Embed Size (px)
Citation preview

Energy Procedia 74 ( 2015 ) 423 – 438
ScienceDirect
1876-6102 © 2015 The Authors. Published by Elsevier Ltd. This is an open access article under the CC BY-NC-ND license (http://creativecommons.org/licenses/by-nc-nd/4 .0/).Peer-review under responsibility of the Euro-Mediterranean Institute for Sustainable Development (EUMISD)doi: 10.1016/j.egypro.2015.07.641
International Conference on Technologies and Materials for Renewable Energy, Environment and Sustainability, TMREES15
A low-cost and fast PV I-V curve tracer based on an open source platform with M2M communication capabilities for preventive
monitoring
P. Papageorgasa*, D. Piromalisb, T. Valavanisa, S. Kambasisa, T. Iliopouloua, G. Vokasa aDepartment of Electronic Engineering, Technological and Educational Institute of Piraeus
bDepartment of Automation Engineering, Technological and Educational Institute of Piraeus
Abstract
This article presents the realization of a low-cost I-V curve tracer especially designed for solar panels. The proposed design is a low-cost implementation of an I-V tracer capable of producing a number of traces automatically within a fraction of second. It is based on an open-source platform with an embedded microcontroller that integrates contemporary technologies for power consumption and measurement together with networking technologies for Machine-to-Machine (M2M) communication. This implementation can be embedded in solar panels aiming to the optimization of solar energy production by providing an in-situ solar panel characterization system. Details about the analysis and design methodology for the developed portable tracer are presented with preliminary results. © 2015 The Authors. Published by Elsevier Ltd. Peer-review under responsibility of the Euro-Mediterranean Institute for Sustainable Development (EUMISD).
Keywords: Photovoltaic systems; I-V curve tracer; electronic load; Smart grid; Smart metering; Internet of things;
1. Introduction
With the evolution of Information and Communication Technologies it is possible today to transform the electric power grid used to a Smart Grid where feedback between the power producers and consumers plays a crucial role for stability and power consumption saving. Today, the production of green energy for restricting the greenhouse
* Corresponding author. Tel.: +30-210-538-1405; fax: +30-210-538-1405. E-mail address: [email protected]
Available online at www.sciencedirect.com
© 2015 The Authors. Published by Elsevier Ltd. This is an open access article under the CC BY-NC-ND license (http://creativecommons.org/licenses/by-nc-nd/4.0/).Peer-review under responsibility of the Euro-Mediterranean Institute for Sustainable Development (EUMISD)
CORE Metadata, citation and similar papers at core.ac.uk
Provided by Elsevier - Publisher Connector

424 P. Papageorgas et al. / Energy Procedia 74 ( 2015 ) 423 – 438
gas emissions is mandatory and governmental policies exist in all countries for increasing the energy production through distributed renewable energy sources and enhance the power saving actions from the consumers. Amongst the renewable energy sources, solar energy plays a major role globally. However photovoltaic (PV) based Distributed Power Generation Systems suffer from solar irradiation variations that when combined with PV modules variations due to various effects can lead to sub-optimal green energy production.
The efficiency of a PV panel is seriously affected by sunlight irradiance blocking obstacles, dirt accumulation,
and inherent tolerances from the manufacturing process or differences from orientation as well as field-aged degradation [1-6]. Aging effects of PV cells affects the I-V characteristics, so an in-situ measurement system of PV performance characteristic parameters can provide valuable information for optimized power generation. What is known from field studies is that the most degraded modules have no correlation between visual defects and performance. Normally the PV panels are tested in the production factory and in standard conditions and then are left unattended. Even the normal tolerance in power generation is expected to be in the range of 5%, therefore this percentage of green power is lost since the worst performing modules reduce the generated power in a series connection with considerable cost [14]. Optimizers and microinverters are suggested as a solution, but their cost is high and the penetration of such solutions in the PV market has remained sallow. The need for a continuous preventive monitoring procedure for PV panels is very important especially when combined with a modern optimizer providing I-V curves in real-time and for each individual panel. A number of e-load implementations have been proposed in the literature [7-11], however they are based on a manual procedure with human operator intervention. In this article we present a holistic approach where the e-load is a part of a real-time optimization procedure for the complete string of Panels in a PV park installation capable of providing valuable PV panel data to the optimizers, the Park administrator and the Smart grid operator in a symmetrical way using web-based technologies and publish-subscribe middleware in order to offer telemetry services for the PV panels in a decentralized architecture.
2. Electronic Load topology for I-V curve tracing
In order to extract the current-voltage (I-V) curve of a device (DUT Device Under Test) a simple variable load as depicted in Fig.1. The load is varied and the voltage and current measurements can be performed, with the procedure repeated for the range of I-V values that must be recorded. In order to realize such a procedure in an automatic way, the load must be controlled by voltage or current through a computer or a microcontroller. One simple approach is presented in Fig.1 where a MOSFET is used as a variable load controlled through the voltage applied in the Gate. When a MOSFET operates in the saturation region the Drain-Source current is controlled through the applied Gate-Source voltage. The Rsense resistor is a current sense resistor and the current of the DUT can be measured by measuring the voltage drop across Rsense. The characterization of the DUT is performed by varying the electronic load under the control of the applied gate voltage.
Fig. 1. A simple electronic load using a MOSFET.
P. Papageorgas et al. / Energy Procedia 74 ( 2015 ) 423 – 438 425
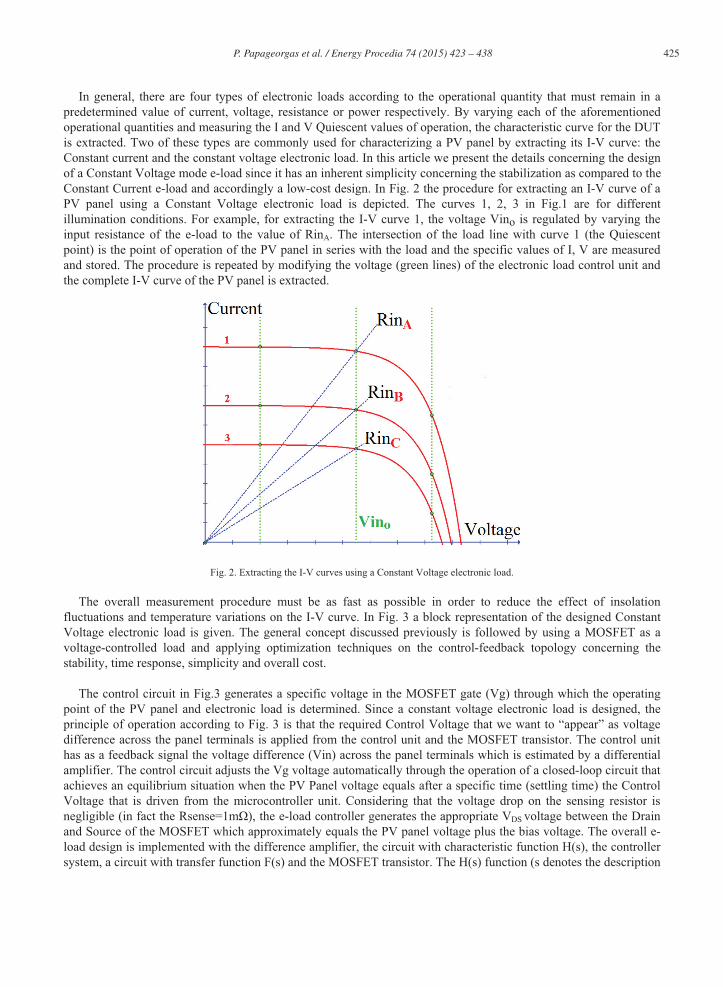
In general, there are four types of electronic loads according to the operational quantity that must remain in a predetermined value of current, voltage, resistance or power respectively. By varying each of the aforementioned operational quantities and measuring the I and V Quiescent values of operation, the characteristic curve for the DUT is extracted. Two of these types are commonly used for characterizing a PV panel by extracting its I-V curve: the Constant current and the constant voltage electronic load. In this article we present the details concerning the design of a Constant Voltage mode e-load since it has an inherent simplicity concerning the stabilization as compared to the Constant Current e-load and accordingly a low-cost design. In Fig. 2 the procedure for extracting an I-V curve of a PV panel using a Constant Voltage electronic load is depicted. The curves 1, 2, 3 in Fig.1 are for different illumination conditions. For example, for extracting the I-V curve 1, the voltage Vino is regulated by varying the input resistance of the e-load to the value of RinA. The intersection of the load line with curve 1 (the Quiescent point) is the point of operation of the PV panel in series with the load and the specific values of I, V are measured and stored. The procedure is repeated by modifying the voltage (green lines) of the electronic load control unit and the complete I-V curve of the PV panel is extracted.
Fig. 2. Extracting the I-V curves using a Constant Voltage electronic load.
The overall measurement procedure must be as fast as possible in order to reduce the effect of insolation fluctuations and temperature variations on the I-V curve. In Fig. 3 a block representation of the designed Constant Voltage electronic load is given. The general concept discussed previously is followed by using a MOSFET as a voltage-controlled load and applying optimization techniques on the control-feedback topology concerning the stability, time response, simplicity and overall cost.
The control circuit in Fig.3 generates a specific voltage in the MOSFET gate (Vg) through which the operating
point of the PV panel and electronic load is determined. Since a constant voltage electronic load is designed, the principle of operation according to Fig. 3 is that the required Control Voltage that we want to “appear” as voltage difference across the panel terminals is applied from the control unit and the MOSFET transistor. The control unit has as a feedback signal the voltage difference (Vin) across the panel terminals which is estimated by a differential amplifier. The control circuit adjusts the Vg voltage automatically through the operation of a closed-loop circuit that achieves an equilibrium situation when the PV Panel voltage equals after a specific time (settling time) the Control Voltage that is driven from the microcontroller unit. Considering that the voltage drop on the sensing resistor is negligible (in fact the Rsense=1m ), the e-load controller generates the appropriate VDS voltage between the Drain and Source of the MOSFET which approximately equals the PV panel voltage plus the bias voltage. The overall e-load design is implemented with the difference amplifier, the circuit with characteristic function H(s), the controller system, a circuit with transfer function F(s) and the MOSFET transistor. The H(s) function (s denotes the description

426 P. Papageorgas et al. / Energy Procedia 74 ( 2015 ) 423 – 438
in the s-plane) has been included for the adjustment of the ratio Vin/Vcontrol. The F(s) function can be implemented as a lead phase compensator for improved stability and speed.
Fig. 3. General design topology of a Constant Voltage electronic load.
The controller operation can be described with the following steps:
1. The procedure starts with the application of a specific Control Voltage which is generated as a reference from the microcontroller. Initially, the open circuit voltage VOC is measured, which corresponds to the maximum output voltage of the PV panel and the maximum input resistance of the e-Load. The voltage regulated from the FET between the PV terminals is measured as the input voltage for the feedback loop using a differential amplifier.
2. The Vin signal is attenuated from the system H(s) because the control voltage is usually smaller than the voltage across the panel. A feedback signal for the control circuit is thus generated.
3. The control circuit drives the MOSFET with a gate voltage which after a settling time will achieve such a value in order for the feedback signal to become equal to the control signal. The actual voltage across the panel terminals will be the control voltage multiplied by the attenuation factor Ho (the transfer characteristic H(s) at DC).
4. Steps 1 to 5 are repeated with control voltages that decrease from the maximum voltage (VOC) down to zero, while the current is being measured for every step. The I,V values are recorded for each measurement cycle and the I-V characteristic curve of the panel is extracted.
The bias voltage is used for MOSFET biasing in order to measure near the ISC region and even for reverse bias
operation of the Panel if necessary in dark conditions. In order to minimize the power consumption, the bias voltage must be kept in the minimum value required for achieving zero voltage between the panel terminals. We can compute the minimum bias voltage as Vb = Rmin·Isc, where Rmin is the minimum input resistance of the electronic load and Isc is the short circuit current of the panel. A specific implementation of the e-load developed is presented in the following section, together with a theoretical analysis that is used for describing the systems’ operation.

P. Papageorgas et al. / Energy Procedia 74 ( 2015 ) 423 – 438 427
2.1. Theoretical Analysis and Simulation of the proposed Constant Voltage e-load topology
The block diagram of Fig. 4 describes the implementation of the general topology presented in Fig.3. Vcontrol is the input signal to the controller generated from the microcontroller unit according to the steps described previously, while G1(s) and G2(s) are derived from a simplified model of the op amp operation used as a controller. There are also other characteristics of the op amp that cannot be precisely modeled, such as the slew rate of the output voltage or A(s) that can explain oscillations that has been observed in the real implementation. In Fig. 4 K represents a linear model of the common source inverting topology of the MOSFET combined with the linearized response of the panel. Therefore we can think K as the system (panel and MOSFET) that we want to control approximated with a constant, which is the rate of change of the load’s input voltage VD with reference to the rate of change of the gate voltage Vg of the MOSFET. The voltage applied to the gate of the MOSFET is the output of the op. Amp controller through the compensator F(s) and the low pass filter D(s) , created from the MOSFET’s input capacitance and the gate resistor R6. . H(s) is a circuit that attenuates the VD and generates the feedback voltage Vf (Vfeedback) for the controller. The schematic diagram of Fig. 5 depicts the implementation of the general topology presented in Fig. 4 where a simple model of a PV panel is also depicted.
Fig. 4. Closed loop controller in the s-plane for stability analysis and optimization.
Fig. 5. Implementation of the proposed Constant Voltage electronic load.
In the schematic diagram of Fig. 5 U1 is a unity gain amplifier for the subtraction of the bias voltage Vbias (vb) from the input voltage of the e-load. With the voltage divider H(s) the ratio Vpanel/Vfeedback is controlled and therefore the Vpanel/Vcontrol ratio is regulated. The three resistors R2, R2, R3 form a star combination in order to

428 P. Papageorgas et al. / Energy Procedia 74 ( 2015 ) 423 – 438
subtract the Vbias (vb) from the measured Vin signal across the PV panel terminals while with R3 we adjust Ho (the DC value for H(s)). In Appendix A3 an analysis of this passive subtractor is provided with the transfer function determined as independent of frequency:
By considering Fig. 4 and Fig. 5 a general approach has been selected for the integrator with operational
amplifier U2 where R5 is the series resistor placed in the Vcontrol and C1 is the feedback capacitor connected in the inverting operational amplifier terminal. We can then write (see Appendix A1):
and
where Ao is the open loop gain of the operational amplifier and b is the bandwidth of the operational amplifier. In Appendix A.1 an analysis of the transfer function of the inverting integrator is given resulting to the G1(s) and G2(s) transfer functions presented above. The D(s) function in Fig. 4 corresponds to the low-pass filter formed with the combination of the MOSFET capacitance Cg and the resistance R6. This filter introduces a phase lag and increases the overshoot produced when a step response function is applied to the Vcontrol input for studying the e-load stability. For this reason we have used a small value for R6. Accordingly we can write that
Fig. 6. The closed-loop control Bode diagram with a passive subtractor.

P. Papageorgas et al. / Energy Procedia 74 ( 2015 ) 423 – 438 429
The N-channel MOSFET selected was the BUK9Y12-100Efrom NXP [15] with maximum drain-source voltage of 100 V, maximum drain current of 85 A, maximum total power dissipation of 238 W and maximum Rdson12 m . A typical value of the gate capacitance Cgs for the NXPBUK9Y12-100E MOSFET is 6.5nF. For simplifying the system analysis we use a linearized model of the actual system and as a result the closed-loop transfer function of the e-load system can be written as:
At dc (s=0) so the ratio Vpanel/Vcontrol is independent of the system’s parameters including the MOSFETS gm and the panel’s I-V slope. We can then calculate the open loop transfer function as:
We have simulated the e-load implementation according to the transfer functions presented above. The analysis
of the transfer function for the e-load with an op amp subtractor has showed a small phase margin, resulting to a slower or less stable system. The analysis of the e-load system with a resistive subtractor resulted in a safer phase margin equal to 90 degrees for a typical one pole model of the op amp controller, as shown in Fig. 6, hence the system is more stable and this is the approach that has been realized.
3. The integrated I-V tracer based on the Polytropon open-source platform with M2M capabilities
The general concept at the top hierarchical level is given in Fig.7 which is based on the design presented in Fig.3 with the microcontroller providing the control voltage through a DAC and measuring the I,V samples through the embedded ADC. The Polytropon platform has been used as the system that controls the overall electronic load operation. This open-source platform (Fig. 8) has been realized as a 4-layer 6 x 7.6 cm board and described in [12, 13]. It is based on two FRAM MSP430 microcontrollers (MSP430FR5969) with extremely low-power consumption and supports board extensions for both the Arduino and Launchpad ecosystems. The Polytropon platform integrates all the necessary M2M communication capabilities based on the Message Queue Telemetry Transport (MQTT) protocol for publishing the collected I-V data using the minimum bandwidth for communication. With the Publish/Subscribe approach supported each client makes subscriptions to the topics of its interest.
Fig. 7. The top-hierarchical level of the automatic PV I-V tracer.
The Message Queuing Telemetry Transport (MQTT) is an open source publish/subscribe protocol for telemetry, which can be easily adapted to a variety of messaging and communication needs. In the Polytropon platform the

430 P. Papageorgas et al. / Energy Procedia 74 ( 2015 ) 423 – 438
MQTT protocol has been embedded in the gateway while a reduced version of the protocol the MQTT-SN has been realized in the wireless sensor nodes of the platform since it is not implementing the TCP/IP layer leading to the minimum traffic and energy consumption accordingly.
(a) (b)
Fig. 8. Pictures of the two sides of the Polytropon platform (a) Side A: Arduino compatible; (b) Side B: Launchpad compatible.
In Fig. 9 the concept of cloud networking with the MQTT protocol is presented. The Data producers called “Publishers” (as for example the WSN nodes used for Automated Meter Reading) are not aware of the addresses of their subscribers that can be a remote located server or a simple HTTP application or any kind of Agent (software application) that can have access to the collected data. In the specific Polytropon platform the MQTT-SN protocol has been realized in every WSN node for publishing the collected data. The overall design of the software of the Polytropon nodes are quite the same for both applications with differences concerning only the “topics” (that is the specific text headers) for the measurements transmitted in each application.
Fig. 9. The MQTT Publish-subscribe concept in the Polytropon Platform for PV panel characterization [13].
The gateway software is common for both applications as well as the server (broker) software. For both use cases the applications that “consume” the aggregated data generated from the WSNs are “subscribers” interested in the two special “topics”. One “topic” named “Country/City/PVpark_1234/Panel_456/IV_Curver” references a PV Park

P. Papageorgas et al. / Energy Procedia 74 ( 2015 ) 423 – 438 431
with identification number 1234 and the I-V curve extracted from the PV panel with identification 456. This text string must be transmitted according to the MQTT protocol through the WSN gateway to the specific Broker.
4. Preliminary results using the Constant Voltage e-load
We have tested two very small PV panels denoted Panel 1 and Panel 2 in the laboratory. Panel 2 has a defection that is difficult to be discovered visually leading to suboptimal power generation. For each I-V curve 36 points are measured and each measurement is a time average of 20 instantaneous values with constant voltage generated from the e-load. The complete I-V curve extraction procedure is accomplished in 70 msec.
Fig. 10. The I-V curve extracted with the Constant Voltage e-load. The PV panel 1 has no defects
Fig. 11. The P-V curve extracted with the Constant Voltage e-load. The PV panel 1 has no defects

432 P. Papageorgas et al. / Energy Procedia 74 ( 2015 ) 423 – 438
Fig. 12. The I-V curve extracted with the Constant Voltage e-load. The PV panel 2 has defects
Fig. 13. The P-V curve extracted with the Constant Voltage e-load. The PV panel 2 has defects
From a simple comparison of Figures 10 and 12 the defect of PV panel 2 is obvious. In Fig. 14 an I-V
characteristic curve is extracted for a larger panel under direct solar irradiance.

P. Papageorgas et al. / Energy Procedia 74 ( 2015 ) 423 – 438 433
Fig. 14. The I-V curve extracted with the Constant Voltage e-load under direct solar irradiation
5. Conclusions
The methodology demonstrated in this article fuses computation and communication technologies for real-time monitoring and characterization of PV panels. The electronic load described in the article realizes a Constant Voltage approach and extracts a complete I-V curve in 70 msec. The open-source platform that is used for controlling the e-load has embedded wireless sensor networking technology based on the MQTT protocol as an efficient way of communication with remote applications using web technologies. The methodology presented uses the open source hardware approach for simplifying the extensibility of the system and software programming using low cost networking extensions readily available for the Launchpad and Arduino ecosystems. This approach enables the experimentation and integration with advanced smart grid telemetry applications for improving the power generation in distributed optimiser applications together with real-time preventive monitoring of PV panels.
Acknowledgements
This research was implemented through the Operational Program "Education and Lifelong Learning" and is co-financed by the European Union (European Social Fund) and Greek national funds.

434 P. Papageorgas et al. / Energy Procedia 74 ( 2015 ) 423 – 438
Appendix A.
A1. Theoretical Analysis of the control system response
For an operational amplifier with an open-loop gain of A the following equations are valid with Vnin and Vin to denote the non-inverting and inverting inputs of the operational amplifier respectively:
and
Fig. A1.1. A general topology for an Inverting Amplifier using an Operational Amplifier.
By solving with reference to Vo we have:
We can substitute for the specific e-load implementation Vnin = Vfeedback and Vin = Vcontrol. With the consideration that 1 is a resistor with value R and 2 is a capacitor we have:
The equations of G1(s) and G2(s) of the block diagram we used are derived as below:
Assuming an ideal op amp operation we have:

P. Papageorgas et al. / Energy Procedia 74 ( 2015 ) 423 – 438 435
We see that sudden changes in the feedback signal are processed faster by the op amp controller resulting to a fast and more stable system response. A2. The magnitude of the K parameter It is possible to estimate the magnitude of the K parameter by making a linear approximation of the models for the MOSFET and the panel, assuming that the load operates near the point where the approximation was made.
For a MOSFET we can measure the derivatives
For small changes in the voltages and close to a point where and are known, we can assume:
The PV panel’s voltage changes in relation to current with a rate of
For small changes around a point where P is known we assume the relation
Substituting
where and
The variable K is the rate of change of the load’s input voltage with reference to the gate voltage.
This expression can be estimated:

436 P. Papageorgas et al. / Energy Procedia 74 ( 2015 ) 423 – 438
When we use a bias voltage with output resistance Rs, we have:
The simpler PV panel model uses the parameters and which can be estimated
and
where IOC stands for the open circuit current for the
PV panel and ISC is the short circuit current parameter for the PV panel. Also from the small-signal MOSFET model we know that and From the above we can conclude that we have a very large K at and a small K at . A3. Theoretical Analysis of the subtractor circuit
For the subtractor and attenuator a star topology of 3 resistors is followed. The main advantage is that the feedback voltage passes through the resistors with no delay when compared with other solutions based on operational amplifiers. Vf in Fig. A3.1 is the feedback signal (Vfeedback) presented in Fig. 3.
Fig. A3.1. Thevenin equivalent for the star topology.
The voltage sources can be converted to equivalent current sources with a total current of
resulting to a total conductance of
This current source is then converted to an equivalent voltage source with

P. Papageorgas et al. / Energy Procedia 74 ( 2015 ) 423 – 438 437
and
In order to subtract Vbias from the total input voltage we have used an operational amplifier in inverting topology with unity gain. The resistors R1 and R2 must have equal values. The resistor R3 is connected to ground and is used for further attenuation of the feedback voltage signal Vf.
Fig. A3.2 The star topology subtractor for Vbias.
This circuit can be modeled by Thevenin equivalent voltage source of value V and series resistance R.
,
The series resistance R has to be small in order to keep the voltage drop low if the op amps input current is significant. The input current of this circuit is the minimum possible input current of the electronic load.
This input current adds an offset to the total output current of the PV panel, and creates an error in measurements. In order to keep this current low we need large value resistors for R2 and R3.
The ratio between the control voltage and the voltage across the panel’s terminals is the same as the attenuation of Vf.

438 P. Papageorgas et al. / Energy Procedia 74 ( 2015 ) 423 – 438
References
[1] M. A. Cluintana, D. L. King, T. J. McMahon and C. R. Osterwald “Commonly observed degradation in field-aged photovoltaic modules” Twenty-Ninth IEEE Photovoltaic Specialists Conference 2002 , p.p. 1436 - 1439
[2] Yoshihiro Hishikawa and Kengo Morita “Initial drop in Isc of the field test c-Si PV modules in Japan”, 3rd World Conference on Photovoltaic Energy Conversion May 11-18. 2003 Osoka, Japan, p.p. 2916-2920
[3] Ulrich Schwabe Peter Mark Jansson, “Performance Measurement of Amorphous and Monocrystalline Silicon PV Modules in Eastern U.S-Energy production versus ambient and module temperature” I2MTC 2009 - International Instrumentation and Measurement Technology Conference, Singapore, 5-7 May 2009,p.p. 1636 – 1641
[4] Emily S. Kopp, Vincent P. Lonij, Adria. E. Brooks, Patricia. L. Hidalgo-Gonzalez, and Alexander D. Cronin “I-V Curves and Visual Inspection of 250 PV Modules Deployed over 2 Years in Tucson” 38th IEEE Photovoltaic Specialists Conference (PVSC), , p.p. 3166 – 3171, 3-8 June 2012
[5] M.Hamdaoui, A. Rabhi, A. El Hajjaji, M. Rahmoun, M. Azizi “Monitoring and control of the performances for photovoltaic systems” International Renewable Energy Congress, November 5-7, 2009 - Sousse Tunisia
[6] Steve Ransome, John Wohlgemuth and Rhys Morgan “Optimising PV array performance using real time measurements” 3rd World Conference on Photovoltaic Energy Conversion May 11-18,2003 Osaka, Japan, p.p. 2396-2399
[7] Vicente Leite, José Batista, Faustino Chenlo and João L. Afonso “Low-Cost “Instrument for Tracing Current-Voltage Characteristics of Photovoltaic Modules” International Conference on Renewable Energies and Power Quality, Santiago de Compostela (Spain), 28th to 30th March, 2012
[8] Hocine Belmili, Salah Med Ait Cheikh, Mourad Haddadi, Cherif Larbes “Design and development of a data acquisition system for photovoltaic modules characterization” Renewable Energy 35 (2010) p.p. 1484–1492
[9] Mao Meiqin; Su Jianhui; Liuchen Chang; Peng Kai; Zhang Guorong; Ding Ming “Research and development of fast field tester for characteristics of solar array” Canadian Conference on Electrical and Computer Engineering, 2009. CCECE '09, p.p. 1055 – 1060
[10] Grietus Mulder, Fjo De Ridder, Peter Coenen, Dominique Weyen, Adwin Martens “Evaluation of an on-site cell voltage monitor for fuel cell systems” International Journal of hydrogen energy, 33 p.p. 5728-5737,2008
[11] Ausias Garrigós and José M Blanes “Power MOSFET is core of regulated dc electronic load” EDN, p.p. 92-92, March 17, 2005 [12] P. Papageorgas, D. Piromalis, K. Antonakoglou, G. Vokas, D. Tseles andK. G. Arvanitis “Smart Solar Panels: In-situ monitoring of photovoltaic panels based on wired and wireless sensor networks” TerraGreen 13 International Conference 2013 - Advancements in Renewable Energy and Clean Environment p.p. 535 – 545 [13] P. Papageorgas, D. Piromalis, T. Iliopoulou, K. Agavanakis, M. Barbarosou, K. Prekas, K. Antonakoglou “Wireless Sensor Networking architecture of Polytropon: An open source scalable platform for the smart grid” The International Conference on Technologies and Materials for Renewable Energy, Environment and Sustainability, TMREES14 p.p. 270 – 276 [14] http://www.tigoenergy.com/ [15] http://www.nxp.com/products/automotive/automotive_mosfets/BUK9Y12-100E.html