Embed Size (px)
Citation preview

0018-9545 (c) 2019 IEEE. Personal use is permitted, but republication/redistribution requires IEEE permission. See http://www.ieee.org/publications_standards/publications/rights/index.html for more information.
This article has been accepted for publication in a future issue of this journal, but has not been fully edited. Content may change prior to final publication. Citation information: DOI 10.1109/TVT.2019.2945398, IEEETransactions on Vehicular Technology
1
A Machine Learning Based Defensive AlertingSystem Against Reckless Driving in Vehicular
NetworksLan Zhang, Li Yan, Yuguang Fang, IEEE Fellow, Xuming Fang, and Xiaoxia Huang
Abstract—Reckless driving severely threatens the safety ofinnocent people, which accounts for around 33% of all fatalitiesin major vehicle accidents. However, most existing efforts focus onthe detection and adjustment of a vehicle’s own driving behavior,whose effectiveness is very limited. In this paper, we develop adefensive alerting system to detect and notify the threats posedby reckless vehicles. By integrating the computation capabilityof a cloud server with that of vehicles nowadays, we proposea cooperative driving performance rating (CDPR) mechanismto automatically and intelligently detect reckless vehicles basedon machine learning algorithms. To support such a defensivealerting system, a three-tier system architecture is developed fromexisting vehicular networks, which consists of vehicles, road-sideunits (RSU) and a cloud server. Moreover, given the fact thatmost vehicles can be trusted to drive safely, to further reducethe transmission load of the CDPR mechanism, we design ourscheme in such a way that every vehicle only uploads the dataof driving maneuvers with reckless potential to RSUs. Basedon the aggregated data, the cloud server globally rates everyvehicle’s driving performance by using support vector machine(SVM) and decision-tree machine learning models. We finallyimplement the proposed CDPR mechanism into a popular trafficsimulator, Simulation of Urban MObility (SUMO), for evaluation.Simulation results illustrate that our defensive alerting systemcan accurately detect reckless vehicles and effectively providetimely alerts.
Index Terms—Cooperative driving behavior rating, Defensivereckless driving alert, SUMO simulation, Machine learning.
I. INTRODUCTION
Driving safety is no doubt the most critical concern behindthe wheel. According to the statistics from the National SafetyCouncil (NSC) of United States (U.S.), more than 40,000roadway fatalities happened in 2017 [1]. A major reason leadsto these road tragedies is the human factor, where recklessdriving is the most considerable one [2], [3]. According to the
Copyright (c) 2015 IEEE. Personal use of this material is permitted.However, permission to use this material for any other purposes must beobtained from the IEEE by sending a request to [email protected].
This work was partially supported by US National Science Founda-tion under grants CNS-1717736 and IIS-1722791. The work of X. Huangwas supported by NSFC-Guangdong Joint Program under Grant U1501255and Guangdong Special Support for Young Innovation Talents under grant2016TQ03X279.
L. Zhang and Y. Fang are with Department of Electrical and Com-puter Engineering, University of Florida, Gainesville, FL, USA (email:[email protected], [email protected].
L. Yan and X. Fang are with Key Lab of Information Coding &Transmission, Southwest Jiaotong University, Chengdu 610031, China(email:[email protected], [email protected]).
X. Huang is with School of Electronics and Communication Engineering,Sun Yat-Sen University, Guangzhou, China (email: [email protected]).
Department of Motor Vehicles (DMV) in U.S., any drivingbehavior disregarding the safety of other individuals can resultin a charge of reckless driving. Even with corresponding lawenforcements, reckless driving still accounts for around 33% ofall fatalities in major car accidents [4]. Therefore, in additionto the law enforcement, how to proactively detect and avoid thesafety threats from reckless driving becomes a vital concern.
One effective mechanism is to monitor and regulate everyvehicle’s own driving performance, which has been intensivelystudied. According to several survey papers [5]–[8], a vehiclecan collect the driving information of itself through its ownsensing devices, such as the electroencephalograph (ECG)sensor embedded in the steering wheel, the dome camera, theinertial measurement unit, and even the smartphone, etc. Byanalyzing the collected sensing data, either a vehicle’s drivingperformance or a driver’s state of mind that may reflect thedriving performance is evaluated. For example, the biologicalmeasure such as the ECG signal can be used to evaluatethe attentiveness of a driver [6]; the driving state such asthe velocity and acceleration can be used to determine thedriving performance [5]; and the external contexts such asthe traffic and weather conditions can be combined with theinternal contexts, such as the velocity of the vehicle and thelevel of alcohol in the driver’s blood, to detect the abnormaldriving behavior [9]. Based on the detection results, the systemmay provide either passively or actively corrective feedbackto the driver, where the audio or video advisories are regardedas passive feedbacks and the direct interventions such asmodifying the pedal force are regarded as active feedbacks[5]–[7]. However, even with accurate detection, the feedbacksuitability as well as the effectiveness are still inadequate.Besides, a driver, no matter whether he/she is a reckless driveror not, will not voluntarily share his/her behavior informationwith others. Thus, a reckless driving behavior detection shoulduse other drivers’ observation to draw a conclusion. Moreover,we unfortunately cannot change the driving behavior of others.Given the fact that the human reaction time in vehicularaccidents is around 1.5 seconds [10], it is difficult to avoid asudden crash caused by a reckless driving vehicle within sucha short time. Therefore, a reckless driving defensive alertingsystem is imperative to help a driver to proactively avoid thesafety threats from the approaching reckless vehicle.
Apparently, the aforementioned self-rated driving perfor-mance [5]–[9] is not reliable nor trusted for others. In orderto provide accurate alerts of reckless vehicles, every vehicle’scurrent driving performance needs to be objectively rated.

0018-9545 (c) 2019 IEEE. Personal use is permitted, but republication/redistribution requires IEEE permission. See http://www.ieee.org/publications_standards/publications/rights/index.html for more information.
This article has been accepted for publication in a future issue of this journal, but has not been fully edited. Content may change prior to final publication. Citation information: DOI 10.1109/TVT.2019.2945398, IEEETransactions on Vehicular Technology
2
Therefore, to develop a fair rating mechanism, a trustworthythird party needs to be involved to monitor every vehicle’sdriving performance and provide the rating results. An in-tuitive monitoring mechanism is to utilize the surveillancecameras deployed along the road [11]–[13]. However, on theone hand, there are not enough deployed camera devicesto seamlessly cover every corner, let alone the cost of themassive installation and maintenance. On the other hand,the technologies of vision-based vehicle monitoring have notbeen well-developed yet [11], [12], [14]. Even the vehicletracking, the most fundamental task of vision-based drivingperformance monitoring, is still challenging due to the abruptobject motion, appearance pattern change, non-rigid objectstructures, etc., especially in the large-volume traffic andhighly-dynamic driving environments [12], [14]. Based onthese observations, in the paper, we propose a cost-effectivemonitoring mechanism, where a vehicle’s driving performanceis monitored by its neighbor vehicles. Similar idea on utilizingthe cooperation among vehicles has also been applied to designa stable routing protocol in vehicular networks [15].
With the rapid development of automobile manufactur-ing [5]–[8], vehicles nowadays exhibit the capability to mon-itor their surrounding driving environments. For example, theultrasonic sensors are used to detect the surrounding obstaclesfor parking assistance; the radar sensors are used to sense theroad ahead for partially automated driving through adaptivecruise control (ACC); the inexpensive low-range and low-resolution versions of lidar sensors are used for forwardcollision prevention [8], [16]. Based on these equipped sensordevices, we can reasonably assume that a vehicle can locallymonitor the driving performance of its neighbor vehicles.However, due to the highly-dynamic driving environments aswell as the complicated external factors, such as the influencefrom other reckless vehicles, a vehicle cannot acquire adequatesensing data of a neighbor vehicle and thus cannot providean accurate rating result. Therefore, we propose to acquirethe driving performance data of a vehicle by aggregatingthe monitored data from its previous and current neighborvehicles. Recently, machine learning algorithms have beenwidely utilized in networking areas, such as network trafficcontrol, due to its efficiency and effectiveness to cope withthe dynamic, large-volume and complicated data in a moreintelligent and autonomous fashion [16]–[21]. In this paper,based on the aggregated multi-modal monitored data, weutilize machine learning algorithms to more accurately andefficiently rate the driving performance of a vehicle anddetect the reckless driving behavior. To support such sensing,aggregating and rating functions, we design a three-tier systemarchitecture based on existing vehicular networks. To thebest of our knowledge, none of existing works establishes areckless driving defensive alerting system by integrating thecomputation capabilities of neighbor vehicles with that of thecloud server.
Our main contributions are summarized as follows:• To better understand the consequences of reckless driv-
ing, we first theoretically evaluate the crash probabilityof a typical reckless driving maneuver, i.e., recklesslane changing. Our analytical result indicates a long
enough distance is required to against reckless driving,which motivates us to devise a defensive alerting systemto proactively enlarge the driving distance gap towardsreckless vehicles.
• We propose a reckless driving defensive alerting systemto proactively detect and notify the approaching of reck-less vehicles. By integrating the computation capabilitiesof the cloud server and vehicles nowadays, we proposea cooperative driving performance rating (CDPR) mech-anism to automatically and intelligently detect recklessvehicles. To facilitate such a defensive alerting system,a three-tier system architecture is developed from exist-ing vehicular networks, where neighbor vehicles of anyvehicle monitor its driving performance and then uploadtheir monitored data to a local road-side unit (RSU) tobe forwarded to the cloud server if needed. Given thefact that most vehicles can be trusted to drive safely, wefurther reduce the transmission load by only uploadingthe driving performance data with reckless potential.
• We devise the machine learning based driving perfor-mance rating algorithms in the cloud server to achieveaccurate detection based on more comprehensive aggre-gated driving data. To evaluate the performance of theproposed alerting system, we implement our design intoa popular trafc simulator, Simulation of Urban MObility(SUMO). Experimental results demonstrate the effective-ness of our defensive alerting system, where the accuracyof reckless vehicle detection and the timeliness of reck-less vehicle alerting are comprehensively evaluated.
The rest of this paper is organized as follows. In Section II,we describe reckless driving behavior and theoretically analyzethe consequence of a typical reckless driving maneuver, i.e.,reckless lane changing, which further motivates our analysis.In Section III, we design the reckless driving defensive alertingsystem, where the CDPR mechanism, system architectureand signaling process are presented. The machine learningbased driving performance rating models are analyzed inSection IV. In Section V, we evaluate the performance ofour defensive alerting system through simulations. Section VIfinally concludes this paper.
II. RECKLESS DRIVING
To better understand the consequences of reckless driving,we first describe the characteristics of reckless driving, andthen theoretically analyze its consequences through a casestudy.
A. Reckless Driving Performance
Although more advanced safety mechanisms are utilized inmodern automobiles nowadays than ever, the number of driv-ing fatalities is still alarming high. In fact, any driving behaviordisregarding the safety of other individuals can be regarded asreckless driving. Although the charge of reckless driving mayvary in different states in USA based on their correspondinglaw enforcement [4], there is still general consensus of recklessdriving, where several driving maneuvers can be regarded as

0018-9545 (c) 2019 IEEE. Personal use is permitted, but republication/redistribution requires IEEE permission. See http://www.ieee.org/publications_standards/publications/rights/index.html for more information.
This article has been accepted for publication in a future issue of this journal, but has not been fully edited. Content may change prior to final publication. Citation information: DOI 10.1109/TVT.2019.2945398, IEEETransactions on Vehicular Technology
3
Fig. 1: A typical scenario of reckless lane changing maneuverand its corresponding cellular automata model.
“reckless”. In the following, we list some of the most commonreckless driving maneuvers reported annually:• Tailgating the leader vehicle, i.e., following too close;• Intentionally failing to yield the right-of-way, such as
reckless lane changing;• Excessive speeding at a considered dangerous velocity;• Placing others in danger by running red lights/stop signs;• Driving under the influence (DUI) or driving while intox-
icated (DWI), such as lane drifting under drunk driving;• Distracted driving, such as texting while driving.
These driving maneuvers, each dangerous in its own right,are responsible for the majority of reckless driving causedaccidents, which lead to serious injuries and medical costs forinnocent people. In this paper, we focus on how to proactivelydetect and avoid the safety threats from the vehicles thatconstantly exhibit reckless driving behavior and put themselvesand others in danger. To better understand the driving charac-teristics of reckless vehicles, we utilize a theoretical model toanalyze its consequences. Due to the complexity of modelinghuman driving behavior, we focus on a typical reckless drivingmaneuver, i.e., reckless lane changing.
B. Case Study: Reckless Lane Changing
According to the beginner driver’s guide, a proper lanechanging should follow these procedures: turn on the blinker,then check the rear view, side mirror and the blind spot, andfinally maintain the speed to smoothly and quickly move tothe desired lane. However, a reckless vehicle may aggressivelymove to the other lane regardless of these proper procedures,which may result in serious accidents [22]. As illustrated inFig.1, a crash happens when vehicle 0 (assumed as a recklessvehicle) changes to the lane of the vehicle 1 without checkingthe blind spot. Besides this scenario, the crash between vehicle0 and 1 may also happen in the following scenarios: withoutusing the right blinker, vehicle 1 may accelerate and crash intothe suddenly drifting vehicle 0; vehicle 0 may mis-estimate thedistance gap or relative velocity towards vehicle 1 and fail toyield to vehicle 1; vehicle 0 may decelerate during its lanechanging or slowly drift to the target lane; etc.
To theoretically analyze the aforementioned scenarios, weutilize a symmetric two-lane cellular automata (CA) model forhighway scenario, where each lane is divided into multiplecells [23]. As illustrated in Fig. 1, each cell is either empty or
occupied by a vehicle. The status of a cell is updated at eachdiscrete time step t ∈ {1, 2, 3, ...}. During the time t→ t+ 1,a vehicle located at x(t) with velocity vt will move to
x(t+ 1)→ x(t) + vt, (1)
where vt is the value of horizontal velocity along the road attime step t.
Without loss of generality, in our lane changing scenario, weassume the reckless vehicle 0 located at x0(t) with velocityvt0 starts changing to the lane of vehicle 1 at time step t,where vehicle 1 is the following vehicle located at x1(t) withvelocity vt1, i.e., x0(t) > x1(t). Note that the scenario thatvehicle 1 is the ahead vehicle of the target lane can be similarlyanalyzed. Since the lane changing process is finished within1 time slot [23], a crash happens when vehicle 0 is not aheadof vehicle 1 at time step t + 1, i.e., x0(t + 1) ≤ x1(t + 1).Therefore, according to (1), a crash happens when the distancegap d = x0(t)− x1(t) satisfies the following condition:
d ≤ vt1 − vt0. (2)
Under the symmetric lane changing setting [23], we donot distinguish fast and slow lane, and thus vt0 and vt1 areassumed to be independent random variables. Denote fvt(v)as the probability density function (PDF) of vt. At time stept, given the value of vt−1, we assume the mean value of therandom variable vt is the given value of vt−1, which matchesthe fact that a vehicle’s current velocity is closely related toits velocity at previous time step. The probability that a crashhappens between vehicle 0 and vehicle 1 can be given by
PC = Pr{d ≤ vt1 − vt0
}=
∫ +∞
d
∫ +∞
−∞fvt1 (v1 + v0) fvt0 (v0) dv1dv0
=
∫ +∞
d
fvt0 (v) ∗ f−vt1 (v)dv.
(3)
Given the PDF of vt0 and vt1, we have the PDF of vt0−vt1, i.e.,fvt0−vt1(v) = fvt0 (v) ∗ f−vt1 (v). Thus, according to (3), thecrash probability PC decreases with the increasing of distancegap d, which reveals that vehicle 1 should keep distance tovehicle 0 to reduce their crash probability. Thus, the utilityfunction of safety can be given by Usafe(d) = α(1− PC(d)),where α is the weighting factor. However, on the otherhand, the increased distance gap d reduces the transportationefficiency, which cannot be ignored especially in crowdedscenarios such as in rush hours. Define the utility function ofroad efficiency by Ueff(d) = β/d, where β is the weightingfactor. Thus, the total utility of a lane changing maneuver bya reckless driver is composed of Usafety(d) and Ueff(d).
On the other hand, for the normal driving vehicles basedon the aforementioned proper lane changing procedures, weassume the crash probability is small enough to be ignored.Therefore, the utility function of a lane changing maneuvercan be given by
Ui(d) =
{α(1− PC(d)) + β/d, i = reckless drivingβ/d, i = normal driving.
(4)

0018-9545 (c) 2019 IEEE. Personal use is permitted, but republication/redistribution requires IEEE permission. See http://www.ieee.org/publications_standards/publications/rights/index.html for more information.
This article has been accepted for publication in a future issue of this journal, but has not been fully edited. Content may change prior to final publication. Citation information: DOI 10.1109/TVT.2019.2945398, IEEETransactions on Vehicular Technology
4
According to the utility function in (4), it is noticeablethat the optimal distance gap d∗ is different for recklessand normal lane changing maneuvers. Specifically, the d∗ inreckless driving is larger than that in normal driving due tothe safety threat by reckless vehicles, i.e., the safety utilityUsafe increases with d. When a reckless vehicle is correctlyidentified, a larger distance gap is absolutely preferred, whichcan be realized by a proactive reckless vehicle alert. However,in contrast, when a normal vehicle is mis-classified as reckless,a larger distance gap will lead to a smaller utility as wellas less transportation efficiency. Therefore, the defensive alertof reckless driving is imperatively necessary, and meanwhilean accurate alarm is expected to improve the overall systemperformance, which motivates our further analysis.
III. RECKLESS DRIVING DEFENSIVE ALARMING SYSTEM
Given the severe consequences of reckless driving, wepropose a machine learning based defensive alarming systemto proactively detect and alert reckless vehicles. Specifically,we design a cooperative driving performance rating (CDPR)mechanism to automatically detect reckless vehicles, whosedetection results are sent to the drivers nearby. These functionsare supported by a three-tier system architecture. In the follow-ing, we first introduce the CDPR mechanism, and then presentour system architecture followed by the signaling process.
A. The CDPR Mechanism
As a complementary safety monitoring mechanism besidesthe traffic polices and video surveillance, the CDPR mech-anism utilizes the monitoring capability of vehicles. On theone hand, more and more sensor devices are installed onvehicles, such as inertial sensors, ultra-sonic, radar, lidar,infrared sensors, vision sensors, etc., which can be utilizedto acquire the information of driving performance of neighborvehicles and provide a way for neighbor vehicles to monitorthemselves, such as the distance gap to neighbor vehicles[8]. On the other hand, supported by vehicular networks,vehicles can communicate with each other as well as withthe infrastructures, i.e., road-side units (RSU). Thus, in thispaper, it is reasonable to assume that a vehicle is capable ofindependently sensing and reporting the driving performanceof its neighbor vehicles. In addition, considering the limitedlocal sensing data as well as the complicated external factors,such as the influence by nearby reckless vehicles, a vehicle canhardly provide accurate rating results. Therefore, we proposethe CDPR mechanism to aggregate a vehicle’s monitoring datafrom its current and previous neighbor vehicles. In addition,given the fact that most vehicles can be trusted to drive safely,to reduce the data volume of uploading, only the monitoredinformation of vehicles with reckless potentials, i.e., recklessmaneuvers, are uploaded. Since a reckless vehicle with con-stant reckless driving behavior can be continuously reported bymultiple neighbor vehicles, our scheme can intuitively realizea timely detection.
Since the CDPR mechanism is based on the cooperationamong neighbor vehicles, every vehicle is encouraged toparticipate into our defensive alerting system. Within this
system, every participant is responsible for reporting thedriving behavior of neighbor vehicles. As a return, theseparticipants can acquire the valuable alerts of reckless vehicles.Besides, other incentives might be considered to attract alarge-scale participation for a safer driving environment infuture smart cities [24], [25]. For example, some quota ofvehicular communication services can be granted to a vehiclebased on its participation. Considering the privacy of partic-ipants, instead of the personal information of a driver, onlythe vehicle description is involved in an alert, such as theposition, heading direction, current velocity, color, body styleand makes, etc. Note that a vehicles dynamic description, suchas the position and heading direction, can be derived by itsperiodic message exchanges in the vehicular communicationsystem (detailed in Section III.C). A vehicles static description,such as the color and body style, is recorded by the systemduring its registration, which can be easily extracted based onthat vehicles communication ID1. To avoid the interferenceof unrelated alerts, a vehicle can only receive the alert ofapproaching neighbor reckless vehicles. By combining thereceived alert with its own location, a vehicle can clearlyrecognize the approaching reckless vehicle, which is informedto the driver through audio or video advisory, similarly asthe audio alarm of a fire. Given the effectiveness of proactivereckless driving alerts as well as the proper incentives, it isreasonable to believe that each vehicle would like to take partin the CDPR mechanism, where the more participants, themore accurate rating results are. To clearly present our design,we assume that every vehicle is enrolled in the followinganalysis. Besides sending the alert to neighbor vehicles, thetransportation department may be informed simultaneously totimely check the detected reckless vehicles. Based on theCDPR mechanism, a harmonic driving environment can befinally realized.
B. System Architecture
To support such a defensive alerting system, we developa three-tier system architecture from existing vehicular net-works. As illustrated in Fig.2, our system architecture consistsof vehicle monitoring tier, local aggregation tier and globalmanagement tier. In the following, we describe the functionsof these three tiers, receptively.• Vehicle monitoring tier is composed of vehicles mov-
ing on the road. The functions of this tier include thedriving environmental sensing, reckless driving maneuverdetection and report uploading, and the reckless drivingalert reception. Specifically, every moving vehicle usesits equipped sensing devices to acquire the informationof surrounding driving environment. These multi-modalsensing information including the distance gap towards aneighbor vehicle, the relative velocity and acceleration,etc., is used to reveal the driving behavior of neighborvehicles. By using a light-weight algorithm, a vehiclecan quickly filter the normal driving maneuvers and
1A vehicle’s communication ID is uniquely assigned by the cloud server,like the subscriber identification module (SIM) ID used by smartphones incellular system, to identify the vehicle entity in vehicular communications.

0018-9545 (c) 2019 IEEE. Personal use is permitted, but republication/redistribution requires IEEE permission. See http://www.ieee.org/publications_standards/publications/rights/index.html for more information.
This article has been accepted for publication in a future issue of this journal, but has not been fully edited. Content may change prior to final publication. Citation information: DOI 10.1109/TVT.2019.2945398, IEEETransactions on Vehicular Technology
5
Fig. 2: The three-tier system architecture and the correspond-ing functions of each tier.
coarsely detect the reckless ones. To derive a moreaccurate rating result in the upper tier, the data of drivingperformance during the duration of a reckless maneuverwill be collected and uploaded to the second tier, i.e.,local aggregation tier. The communication between avehicle and the second tier is based on dedicated shortrange communication (DSRC) technology [26], [27]. Toguarantee the timeliness of monitoring, the driving per-formance data with reckless potentials will be uploadedwithin time Tth since its generation. In addition, eachvehicle will listen to the broadcasted reckless drivingalerts, and provide audio or video advisory to informthe connected drivers. The detail operation procedures ofeach participating vehicle are presented in Algorithm 1.
• Local aggregation tier is composed of road side units(RSU)2, which are the communication infrastructuresin vehicular networks. This tier connects the first andthe third tier, respectively, through wireless and wiredlinks. The functions of this tier are to aggregate andforward the uploaded driving behavioral data, to locallydetect reckless vehicles, and to broadcast reckless drivingalert. For the local reckless vehicle detection, we shouldprovide timely alert in some emergency scenarios, such asthe identification of a hogged drunk driving. Nevertheless,in reality, a reckless driver may perform normally inmost time, such as when waiting at a traffic light ordriving along with very few neighbor vehicles. Thus,the number of detected reckless driving maneuvers ina single road segment will be limited, and instead thedriving performance can be accurately rated in the thirdtier by aggregating more comprehensive data. However,the global alert needs longer detection time, which is
2The local aggregation tier can be composed by any local entities, whichexhibits both communication and computation abilities. We utilize RSUs asan example.
Algorithm 1 Procedures at participating vehicles
1: when a vehicle is started;2: build up connection with system through a nearby RSU;3: repeat4: report its current location to its service RSU;5: monitor the surrounding driving environment;6: if a reckless driving maneuver is detected then7: report the corresponding data to its service RSU;8: end if9: listen the alerting channel;
10: if an alert is received then11: alert the driver through audio advisory;12: end if13: until its engine stop;
not suitable for some emergency scenarios, and thuswe introduce the local detection function in the secondtier. Only when the percentage of a vehicle’s recklessmaneuvers exceeds an empirical threshold, the local alertis broadcasted. To achieve an accurate detection, this alertis meanwhile reported to the third tier, and the updateddetection result will be sent back to support or correctthe current alert in the second tier.
• Global management tier is the cloud center with strongcomputation and storage capabilities. The functions ofthis tier include globally rating a vehicle’s driving perfor-mance and sending the detected alert to the correspondingRSUs. Specifically, the cloud center aggregates data ofreckless driving maneuvers from all RSUs through thewired connections, and analyzes these data by usingmachine learning algorithms. The machine learning baseddriving performance rating models are trained by histor-ical data with reckless or normal labels, which can beperiodically updated by the newly arrived data. The labelof a reckless vehicle can be derived by the record from thetransportation department, where reckless vehicles are theones intercepted and charged by traffic polices. Once areckless vehicle is detected, it will be tracked based on theprevious connections with the system. Note that a vehiclewill periodically communicate with the system, whichwill be explained in details in the following signalingprocess, and thus the system can acquire its position andheading direction. The global alert is finally sent to theRSUs based on the tracking results. Meanwhile, the datacenter may contact the transportation department to fur-ther check or intercept the detected reckless vehicles. Thedetail operation procedures are illustrated in Algorithm 2.
C. Signaling Processes
To realize the communications among the aforementionedthree tiers, we describe their signaling processes. In ourdefensive alerting system, each tier only connects with itsneighbor tiers. Specifically, two upper tiers are wire connected,and two lower tiers are wireless connected based on vehicularnetworks, i.e., DSRC technology [26]. According to DSRCstandard, the on-board unit (OBU) equipped in a vehicle can
0018-9545 (c) 2019 IEEE. Personal use is permitted, but republication/redistribution requires IEEE permission. See http://www.ieee.org/publications_standards/publications/rights/index.html for more information.
This article has been accepted for publication in a future issue of this journal, but has not been fully edited. Content may change prior to final publication. Citation information: DOI 10.1109/TVT.2019.2945398, IEEETransactions on Vehicular Technology
6
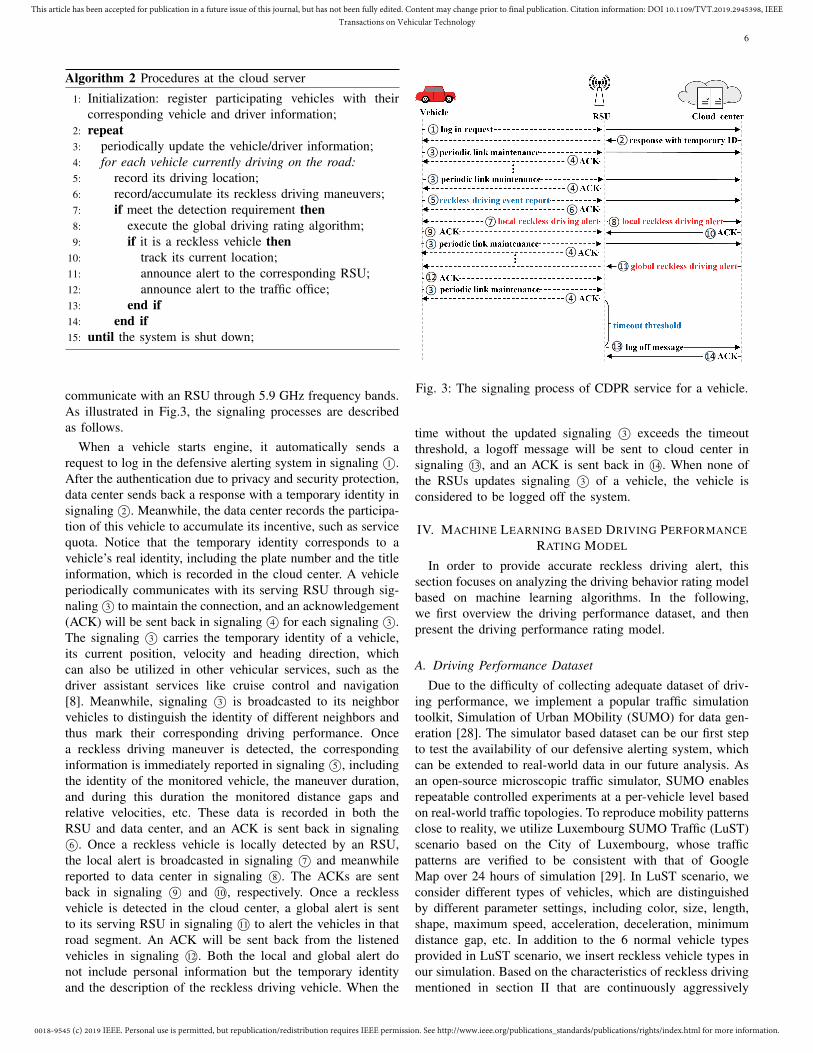
Algorithm 2 Procedures at the cloud server
1: Initialization: register participating vehicles with theircorresponding vehicle and driver information;
2: repeat3: periodically update the vehicle/driver information;4: for each vehicle currently driving on the road:5: record its driving location;6: record/accumulate its reckless driving maneuvers;7: if meet the detection requirement then8: execute the global driving rating algorithm;9: if it is a reckless vehicle then
10: track its current location;11: announce alert to the corresponding RSU;12: announce alert to the traffic office;13: end if14: end if15: until the system is shut down;
communicate with an RSU through 5.9 GHz frequency bands.As illustrated in Fig.3, the signaling processes are describedas follows.
When a vehicle starts engine, it automatically sends arequest to log in the defensive alerting system in signaling 1©.After the authentication due to privacy and security protection,data center sends back a response with a temporary identity insignaling 2©. Meanwhile, the data center records the participa-tion of this vehicle to accumulate its incentive, such as servicequota. Notice that the temporary identity corresponds to avehicle’s real identity, including the plate number and the titleinformation, which is recorded in the cloud center. A vehicleperiodically communicates with its serving RSU through sig-naling 3© to maintain the connection, and an acknowledgement(ACK) will be sent back in signaling 4© for each signaling 3©.The signaling 3© carries the temporary identity of a vehicle,its current position, velocity and heading direction, whichcan also be utilized in other vehicular services, such as thedriver assistant services like cruise control and navigation[8]. Meanwhile, signaling 3© is broadcasted to its neighborvehicles to distinguish the identity of different neighbors andthus mark their corresponding driving performance. Oncea reckless driving maneuver is detected, the correspondinginformation is immediately reported in signaling 5©, includingthe identity of the monitored vehicle, the maneuver duration,and during this duration the monitored distance gaps andrelative velocities, etc. These data is recorded in both theRSU and data center, and an ACK is sent back in signaling6©. Once a reckless vehicle is locally detected by an RSU,
the local alert is broadcasted in signaling 7© and meanwhilereported to data center in signaling 8©. The ACKs are sentback in signaling 9© and 10©, respectively. Once a recklessvehicle is detected in the cloud center, a global alert is sentto its serving RSU in signaling 11© to alert the vehicles in thatroad segment. An ACK will be sent back from the listenedvehicles in signaling 12©. Both the local and global alert donot include personal information but the temporary identityand the description of the reckless driving vehicle. When the
Fig. 3: The signaling process of CDPR service for a vehicle.
time without the updated signaling 3© exceeds the timeoutthreshold, a logoff message will be sent to cloud center insignaling 13©, and an ACK is sent back in 14©. When none ofthe RSUs updates signaling 3© of a vehicle, the vehicle isconsidered to be logged off the system.
IV. MACHINE LEARNING BASED DRIVING PERFORMANCERATING MODEL
In order to provide accurate reckless driving alert, thissection focuses on analyzing the driving behavior rating modelbased on machine learning algorithms. In the following,we first overview the driving performance dataset, and thenpresent the driving performance rating model.
A. Driving Performance Dataset
Due to the difficulty of collecting adequate dataset of driv-ing performance, we implement a popular traffic simulationtoolkit, Simulation of Urban MObility (SUMO) for data gen-eration [28]. The simulator based dataset can be our first stepto test the availability of our defensive alerting system, whichcan be extended to real-world data in our future analysis. Asan open-source microscopic traffic simulator, SUMO enablesrepeatable controlled experiments at a per-vehicle level basedon real-world traffic topologies. To reproduce mobility patternsclose to reality, we utilize Luxembourg SUMO Traffic (LuST)scenario based on the City of Luxembourg, whose trafficpatterns are verified to be consistent with that of GoogleMap over 24 hours of simulation [29]. In LuST scenario, weconsider different types of vehicles, which are distinguishedby different parameter settings, including color, size, length,shape, maximum speed, acceleration, deceleration, minimumdistance gap, etc. In addition to the 6 normal vehicle typesprovided in LuST scenario, we insert reckless vehicle types inour simulation. Based on the characteristics of reckless drivingmentioned in section II that are continuously aggressively

0018-9545 (c) 2019 IEEE. Personal use is permitted, but republication/redistribution requires IEEE permission. See http://www.ieee.org/publications_standards/publications/rights/index.html for more information.
This article has been accepted for publication in a future issue of this journal, but has not been fully edited. Content may change prior to final publication. Citation information: DOI 10.1109/TVT.2019.2945398, IEEETransactions on Vehicular Technology
7
TABLE I: Parameter setting for different vehicle types.
vType accel deccel minGap maxSpeed shapeNv1 2.6 4.5 1.5 70 sedanNv2 3.0 4.5 1.5 50 hatchbackNv3 2.8 4.5 1.0 50 hatchbackNv4 2.7 4.5 1.5 70 wagonNv5 2.4 4.5 1.5 30 vanNv6 2.3 4.5 2.0 30 deliveryRv1 8.0 8.0 0.5 140 sedanRv2 9.0 9.0 0.5 110 hatchbackRv3 9.0 9.0 0.3 100 hatchbackRv4 8.0 8.0 0.2 105 wagonRv5 9.5 9.5 0.7 130 vanRv6 10.0 10.0 0.8 120 delivery
disregarding safety of other individuals, we modify the vehicleparameter settings to generate 6 reckless vehicle types asillustrated in Table I, where ’Nv’ and ’Rv’ represent normaland reckless vehicle type, respectively. Similar parametersetting has been used in [30] to define aggressive driving.
According to the CDPR mechanism, the data of driving per-formance is collected by aggregating that of reckless drivingmaneuvers, which are detected by the detection function ofvehicles mentioned in Section II.B. To realize this function, weutilize the surrogate safety measure (SSM) devices providedin SUMO. An SSM device exhibits the ability of sensingand computing, which can be equipped on a vehicle. Thefunction of an SSM device is to detect conflict encounters,i.e., reckless driving maneuvers, and meanwhile log theircorresponding SSM values. Several SSMs are consideredincluding time to collision (TTC), deceleration rate to avoida crash (DRAC), post encroachment time (PET), brake rate(BR), etc., whose exact definition can be found in [31]. Oncethe value of an SSM exceeds the corresponding threshold,the current encounter is regarded as a conflict encounter,where different conflict encounters may last for different timeduration. Conflict encounters include crossing, merging, tail-gating situations, etc., where different calculation proceduresof SSMs may be implemented. Note that different conflictencounters correspond to different reckless driving events.
In the output file of an SSM device, the driving data ofeach conflict encounter is recorded, including its duration,encounter situation, velocities of the ego and the conflictneighbor during this duration, positions of the ego and theconflict neighbor during this duration, minimum TTC, maxi-mum DARC and PET. Due to the complexity of analyzing theimpact of different conflict encounters, we exclude the featuresaffected by different conflict encounter types and derive thefollowing features to characterize the driving performance:
• the time duration of a conflict encounter,• the distance gap over this duration based on the position
of the ego and conflict neighbor vehicle,• the relative velocity over this duration based on the
velocity of the ego and conflict neighbor vehicle.
In addition, to utilize these features in our rating model, wepreprocess the data with normalization, which is necessaryfor distance-metric based machine learning algorithms, suchas support vector machine (SVM).
B. Training the Driving Performance Rating Models
Based on the aforementioned dataset, we train the drivingperformance rating model by using machine learning algo-rithms [32]–[35]. We utilize two machine learning algorithms[32]–[34], SVM and decision-tree, which are typically usedin classification problems that make them appropriate forclassifying normal vehicles versus reckless vehicles. For SVMmodel, among several useful theoretical and practical char-acteristics, the following two reasons motivate our selection:1) Since the training of SVM involves a convex optimizationproblem, the optimal solution is a global optimum; 2) Theupper bound of the generalization error is independent ofproblem dimensionality. For decision-tree model [32], [33],[35], the nonparametric nature and easy interpretation makeit popular in a variety of application fields. Its advantageover many other models is the effectiveness to constructclassifications through segmenting a data set into smaller andmore homogeneous groups.
To rate a vehicle’s driving performance, the input dataof SVM and decision-tree models is in the form of 〈21-dimensional features, label 〉. Specifically, the 21-dimensionalfeatures are obtained from the normalized driving behaviorfeatures, including the time duration (1 dimension), the per-centage of the distance gap (dividing the overall range into 10dimensions) and the percentage of the relative velocity (divid-ing the overall range into 10 dimensions). In the following,the SVM and decision-tree models are presented, respectively.
1) SVM model [32]–[34]: In general, the SVM model mapsthe points of two categories in the n−dimensional space intoa target m−dimensional space, where a hyperplane in the newspace can better separate two categories of points. Specifically,define our training set by {xi, yi} with N training samples i =1, ..., N , where xi = (x1
i , x2i , ..., x
21i ) is the aforementioned
21-dimensional features, and yi ∈ {−1,+1} is the label ofnormal and reckless vehicle. In SVM models, the mapping isbased on a kernel function, which has multiple types as theinner product between the mapped pairs of points in the featurespace. Since kernel selection is essential to obtain satisfactoryclassification results, we consider the following well-knownkernel functions in our design:• Linear kernel:
K(xi,xj) = xTi xj , (5)
where xTi is the transposition of matrix xi.• Polynomial kernel:
K(xi,xj) = (γxTi xj + 1)d, γ > 0, (6)
where γ is an empirical parameter, and d is the degreeof the polynomial.
• Gaussian radial basis function (RBF) kernel:
K(xi,xj) = exp(−γ ‖xi − xj‖2
), (7)
where γ is an empirical parameter, and ‖xi − xj‖ is thenorm of the point differences, representing the distancebetween vector xi and xj in the corresponding Hilbertspace.

0018-9545 (c) 2019 IEEE. Personal use is permitted, but republication/redistribution requires IEEE permission. See http://www.ieee.org/publications_standards/publications/rights/index.html for more information.
This article has been accepted for publication in a future issue of this journal, but has not been fully edited. Content may change prior to final publication. Citation information: DOI 10.1109/TVT.2019.2945398, IEEETransactions on Vehicular Technology
8
In the target space mapped by a kernel function, SVMclassifies data by finding the best hyperplane that separatesall data points of the two classes. The best hyperplane is theone with the largest margin between the two classes, which istrained with solving the following optimization problem:
maxθ
C(θ) =N∑i=1
θi −1
2
N,N∑i=1,j=1
θiθjyiyjK(xi,xj)
s.t.N∑i=1
θiyi = 0, θi ≥ 0.
(8)
By utilizing the optimal θ, when a test sample with featurevector z arrives for rating, this sample is rated by the followingdecision function [33]:
D(z) = sgn
[N∑i=1
θiyiK(z,xi) +B
], (9)
where B is the bias term.
2) Decision-tree model [32], [33], [35]: A decision tree isa flow-chart-like tree structure, which derives a classificationdecision through a sequence of tests along a path of nodes.The root node contains the entire dataset X = {x1,x,..,xN}.The tree grows through splitting data at the nodes, where theoutgoing branches of a node correspond to the partitioned datasubsets. When the data of a node cannot be splitted any further,it becomes a terminal node indicating a classification decision,i.e., the normal or reckless rating decision of a vehicle. Inour decision-tree model based classifier, we consider threepopular selection algorithms to find the best split predictor:standard classification and regression tree (CART), curvaturetest, and interaction test [35]–[37]. The standard CART selectsthe split predictor that maximizes the split-criterion gain overall possible splits of all predictors; the curvature test selectsthe split predictor that minimizes the p-value of Chi-squaretests of independence between predictors and the response;and similarly interaction test based on the calculation criterionof curvature test considers the interaction between each pair ofpredictor and response. We evaluate the performance of thesethree algorithms in our evaluation part. To present a concreteintroduction, we utilize the standard CART algorithm as theselection algorithm to describe the decision-tree model trainingin the subsequent development.
The principle of tree growing step is to recursively partitiontarget variables so that the data in the descendant nodes arealways purer than that in the parent node. When a trainingdata enters the root node, a test is performed to search for allpossible splits based on a splitting criterion that measures thesplitting quality. In CART, the Gini-index splitting criterion isapplied. According to the definition of Gini-index, the impurityof node n is given by
I(n) = 1−∑j
p2j (n), (10)
where pj(n) is the probability that a sample in subset Xn
belongs to class j. pj(n) can be easily estimated by N jn/Nn,
where N jn is the number of vectors in subset Xn belongs to
class j and Nn is the total number of vectors in Xn. Thedecrease of node impurity ∆I(n) is given by
∆I(n) = I(n)−2∑j=1
pj(nj)I(nj), (11)
where nj is the jth descendant node of node n. By ex-haustively searching for all possible splits, the one with themaximum impurity decrease is selected. When the probabilitypj(l) is more than the threshold P0, node l is regardedas a terminal node with the classification decision j∗ =arg maxj∈{1,2} pj(l).
In the tree pruning step, the established decision tree ispruned to avoid overfitting the training data due to its largesize. We apply the most common pruning rule, minimal cost-complexity pruning, due to its computation efficiency. Thecost-complexity of decision tree T measures its misclassifi-cation rate and complexity (the number of terminal nodes),which is given by
Rα(T ) = R(T ) + α|T |, (12)
where R(T ) is the corresponding misclassification rate, whichis defined as the percentage of misclassified vehicles by thisdecision tree; α is the complexity factor; T is the set of allterminal nodes in T and |T | is the size of T . The pruning startsfrom the terminal nodes to examine each node and subtree.When the replacement of a subtree by a terminal node cangive a lower cost-complexity, the subtree is pruned.
V. PERFORMANCE EVALUATIONS
In this section, we evaluate the effectiveness of our defen-sive alerting system, where the dataset preparation is firstlydescribed, followed by the performance evaluation involvingtwo critical aspects. Specifically, we first evaluate the accuracyof our driving performance rating, as well as the performancecomparison between our machine learning based method andthe conventional statistical based method. Then, we compre-hensively investigate the timeliness of our reckless vehiclealerting, involving the delay of the whole alerting process.
A. Dataset Preparation
Based on our defensive alerting system design in SectionIII and IV, we implement the CDPR mechanism in SUMOplatform to collect the dataset of driving performance. In LuSTscenario, we consider the 12 vehicle types as illustrated inTable I, and the percentage of reckless vehicles is set to be10%. Our simulation involves 15,000 vehicles equipped withSSM devices, whose total arrival time is 50 minutes between8:00 AM and 8:50 AM. The number of our samples, i.e., thenumber of vehicles with reported conflict encounters, is 6977.
Based on the output file of SSM devices, we collect the21-dimensional driving features mentioned in Section IV.B,including the time duration of conflict encounters (1 dimen-sion), the percentage of the distance gap (dividing the overallrange into 10 dimensions) and the percentage of the relativevelocity (dividing the overall range into 10 dimensions). Toavoid the effect due to irrelevant features, we further test

0018-9545 (c) 2019 IEEE. Personal use is permitted, but republication/redistribution requires IEEE permission. See http://www.ieee.org/publications_standards/publications/rights/index.html for more information.
This article has been accepted for publication in a future issue of this journal, but has not been fully edited. Content may change prior to final publication. Citation information: DOI 10.1109/TVT.2019.2945398, IEEETransactions on Vehicular Technology
9
(a) SVM models under different kernel functions.
(b) Decision-tree models under different predictormodels.
Fig. 4: The receiver operating characteristic (ROC) curves ofdifferent models for driving behavior rating.
feature combinations and finally delete some features that areconstant values, i.e., close to 0 for most training samples, suchas the percentage of the last segment in relative velocity range(the relative velocity segment [28.98, 32.60] to the overallrelative velocity range [0, 32.60]). Therefore, the size of ourfinal dataset is 6977×10. In our driving behavior rating model,we utilize 70% samples as the training data and the remaining30% samples as the testing data.
B. Overall Performance
Based on the prepared dataset, we first evaluate the per-formance of the machine learning based driving performancerating models. According to Section IV.B, we explore the per-formance of the SVM models under different kernel functions,i.e., RBF, linear and polynomial kernel, as well as that ofthe decision-tree models under different predictor selectionalgorithms, i.e., standard CART, curvature test and interactiontest. As illustrated in Fig. 4, we illustrate the receiver operatingcharacteristic (ROC) curves of the above models, respectively.A ROC curve presents the true positive rate (TPR) againstthe false positive rate (FPR) under various threshold settings,whose analysis is a direct and natural way to select possiblyoptimal models and to discard suboptimal ones. A good
TABLE II: Accuracy Evaluation.
rating model accuracy(%) precision(%) recall(%) F1(%)SVM 92.73 89.53 97.05 93.14
decision-tree 93.29 89.61 99.98 93.61statistical method 47.95 49.32 1.5 16.53
prediction model yields the points in the upper left cornerof the ROC space, i.e., coordinate (0,1), which represents nofalse negatives (FN) and no false positives (FP). In contrast,the points of a random guess are along the diagonal line fromthe left bottom to the top right corners. Thus, according toour experiment results illustrated in Fig. 4, the ROC curve ofSVM model with RBF kernel apparently outperforms that ofthe other two, while the ROC curves of the three decision-treemodels have very close performance. To clarify the differenceof the ROC curves in decision-tree models, the ROC curveswith y-axis ranging from 0.75 to 1 is presented in the mainfigure, where the whole curves with y-axis ranging from 0 to1 is illustrated on the bottom right. Based on our simulationresults, we apply the SVM model with RBF kernel and thedecision-tree model with standard CART algorithm as ourdriving performance rating models in the following.
Before we further analyze the accuracy and the impact ofparameters for the two selected machine learning based ratingmodels, we take the conventional statistical rating method intoaccount. In the following, we evaluate the accuracy of the threerating methods, i.e., SVM, decision-tree and statistical drivingperformance rating methods. In the CDPR mechanism, weutilize multiple sensing devices to fully characterize differentreckless driving maneuvers, where the machine learning baseddriving performance rating models are introduced due to thedifficulty of analyzing the multi-modal sensing data. Sincethe consequence of a crash comes from the geographicallyproximity between vehicles, a reckless vehicle with highcrash probability intuitively drives closer to neighbor vehicles.Therefore, instead of the multi-modal sensing features, weshould evaluate the availability of a single feature, i.e., thedistance gap, to rate a vehicle’s ”reckless” level. By using thesingle distance gap feature, the conventional statistical methodcan measure a vehicle’s driving performance through compar-ing the vehicle’s statistical distance gap, i.e., mean distancegap, with the empirical threshold derived from previouslydetected reckless vehicles with low computation complexity.Based on the definition of True Positive (TP), True Negative(TN), False Positive (FP) and False Negative (FN), we examinethe following metrics in the comparison:
• Accuracy: the probability that the classification of avehicle’s driving performance is the same as the groundtruth.
• Precision: the probability that the classification for reck-less driving is exactly a reckless vehicle in ground truth.
• Recall: the probability that all reckless vehicles in groundtruth are classified correctly as reckless driving.
• F1 score: a measure of rating accuracy that is the har-monic average of the precision and recall, i.e., F1 =2/(recall−1 + precision−1).

0018-9545 (c) 2019 IEEE. Personal use is permitted, but republication/redistribution requires IEEE permission. See http://www.ieee.org/publications_standards/publications/rights/index.html for more information.
This article has been accepted for publication in a future issue of this journal, but has not been fully edited. Content may change prior to final publication. Citation information: DOI 10.1109/TVT.2019.2945398, IEEETransactions on Vehicular Technology
10
To conduct a fair comparison, the dataset of the statisticalmethod is the same as our machine learning based methods,and the testing results are illustrated in TABLE II. We canobserve that the machine learning based methods apparentlyoutperforms the statistical one, which verifies that a vehicle’sdriving behavior cannot be simply measured by only using thedistance gap feature. Thus, due to the highly dynamic natureof driving environments, the machine learning based drivingperformance rating models by using multi-modal sensing dataare imperatively necessary. By comparing the four metrics,we can observe that the precision and recall metrics are withthe lowest and the highest values, respectively. According totheir corresponding definitions, their evaluation results verifythat although a few false alarms exist in the system, nearlyall reckless vehicles can be identified, which can be acceptedfor the safety consideration in our defensive alerting system.In addition, to fully utilize our dataset for a more accuratecomparison, we conduct a 10-fold cross-validation for ourtwo machine learning based rating models, where the loss ofthe SVM and decision-tree models are 0.0708 and 0.0606,respectively. Therefore, these two machine learning basedrating models can provide accurate rating to detect recklessvehicles, and the decision-tree model performs better in mostconditions.
C. Timeliness of Reckless Vehicle Alert
Since the delay requirement of defensive alerting system isstringent, our design aims at providing accurate detection andreducing alerting delay at the same time. However, as an alert-ing system, there are inevitable delay for alerting procedures,such as the hazard warning and driver’s reaction. Thus, ourdesign makes efforts on reducing the delay from the vehiclesensing, data transmission, and data processing in the cloud.Specifically, each vehicle on road keeps monitoring the drivingperformance of neighbor vehicles, and immediately reportsthe detected reckless driving maneuvers to reduce the sensingdelay. The sensing delay can be further reduced with moreadvanced sensing technologies embedded on vehicles, whichis out of the scope of our analysis. For the data transmissiondelay, instead of reporting all sensing data, vehicles in ourdesign only report the data with reckless potential to fastendata transmissions, and meanwhile to avoid possible trans-mission congestion. Besides, we utilize the RSUs to forwardthe sensing data, which provides fast uploading by shorteningthe transmission distances between vehicles and RSUs. Thecollected sensing data will be forwarded from RSUs to thecloud server through fast and reliable wired connections.For the data processing delay in the cloud, our design onlycollects the sensing data with reckless potentials to reduce theprocessing data amount. Meanwhile, instead of massive imageor video processing, the cloud server uses simple machinelearning algorithms, such as SVM and decision tree, to quicklyprocess the low-dimensional sensing data. By conducting anIntel i7-2600 CPU with 16GB memory, our rating models,i.e., using SVM and decision-tree algorithms, with the samesetting of TABLE II can rate the driving performance ofmore than 900 vehicles per second. With much more powerful
Fig. 5: The detection accuracy as a function of the number ofmonitored reckless driving events.
computation capability, the data processing delay in the couldserver will be further reduced.
In fact, the most significant delay in our design comes fromthe sensing data accumulation, i.e., accumulating the recklessdriving maneuvers. Since the driving environment is highlydynamic and complicated, a vehicles driving performance canbe hardly judged by a short time observation. For example, avehicle with a single or a few reckless driving maneuvers maybe a normal vehicle, whose abnormal reckless maneuvers areaffected by other environmental factors, such as its recklessneighbor vehicles. Therefore, a certain observation time isrequired to accumulate enough sensing data, and there is atrade-off between the accuracy and the timeliness. As illus-trated in Fig.5, the accuracy is formulated as a function of thenumber of monitored reckless driving maneuvers respectivelywith the SVM and decision-tree rating models. Since thedataset of driving performance comes from the accumulationof reckless driving maneuvers reports, the more accumulatedmaneuvers means the longer monitoring time. Thus, we utilizethe number of reported reckless driving maneuvers to measurethe length of the monitoring time. We can observe thatboth the two machine learning based rating models performbetter under a larger number of maneuvers, which means thelonger monitoring time the more accurate rating results are.In addition, within a short monitoring time, i.e., only a fewreported reckless driving maneuvers, the accuracy of our ratingis around 85%, which will be improved to around 90% whenthe number of the monitored reckless driving events is morethan 5. Thus, a quick rating will sacrifice some accuracy,but still with a high accuracy level. For some areas withhistorically high crash probability, such as the bar area, areckless driving alert may be sent in advance within a fewreported data to improve the local driving safety. In addition,due to the increase of accuracy with more reported recklessdriving maneuvers, the rating results should be timely updatedto terminate the false alarm and identify the real recklessvehicles.

0018-9545 (c) 2019 IEEE. Personal use is permitted, but republication/redistribution requires IEEE permission. See http://www.ieee.org/publications_standards/publications/rights/index.html for more information.
This article has been accepted for publication in a future issue of this journal, but has not been fully edited. Content may change prior to final publication. Citation information: DOI 10.1109/TVT.2019.2945398, IEEETransactions on Vehicular Technology
11
VI. CONCLUSION
Observing the severity of reckless driving on the roadnowadays, we proposed a defensive alerting system to proac-tively detect and notify the threats from approaching recklessvehicles. To better understand the consequence of recklessdriving, we first theoretically evaluated the crash probabilityof a typical reckless driving maneuver, i.e., reckless lanechanging. Based on the verified the need for defensive recklessdriving alerts, we further developed a machine learning basedcooperative driving performance rating (CDPR) mechanism byintegrating the computation capabilities of neighbor vehiclesand a cloud server. By utilizing the monitored informationfrom neighbor vehicles, the CDPR mechanism automaticallyand intelligently detects reckless vehicles. To support sucha defensive alerting system, a three-tier system architecturewas developed from existing vehicular networks. Moreover,we devised a transmission load reduction scheme by onlyuploading the data of driving maneuvers with reckless po-tential. Based on the aggregated monitoring data, the cloudserver globally rates every vehicle’s driving performance byusing SVM and decision-tree machine learning algorithms.We finally implemented the proposed CDPR mechanism intoSUMO simulator. Extensive simulation results illustrated thatour defensive alerting system can accurately detect recklessvehicles and provide timely alerts.
REFERENCES
[1] “Driving just got a lot deadlier,” https://www.cbsnews.com/news/traffic-fatalities-jump-by-5-6-percent-in-2016/.
[2] C. Saiprasert and W. Pattara-Atikom, “Smartphone enabled dangerousdriving report system,” in 2013 46th Hawaii International Conferenceon System Sciences. IEEE, 2013, pp. 1231–1237.
[3] J. Yu, Z. Chen, Y. Zhu, Y. J. Chen, L. Kong, and M. Li, “Fine-grained abnormal driving behaviors detection and identification withsmartphones,” IEEE transactions on mobile computing, vol. 16, no. 8,pp. 2198–2212, 2016.
[4] U. S. Department of Motor Vehicles (DMV), “Reckless driving 101,”https://www.dmv.org/safety-laws/reckless-driving.php.
[5] C. M. Martinez, M. Heucke, F.-Y. Wang, B. Gao, and D. Cao, “Drivingstyle recognition for intelligent vehicle control and advanced driverassistance: A survey,” IEEE Transactions on Intelligent TransportationSystems, vol. 19, no. 3, pp. 666–676, 2017.
[6] Y. Dong, Z. Hu, K. Uchimura, and N. Murayama, “Driver inattentionmonitoring system for intelligent vehicles: A review,” IEEE transactionson intelligent transportation systems, vol. 12, no. 2, pp. 596–614, 2010.
[7] G. Sikander and S. Anwar, “Driver fatigue detection systems: A review,”IEEE Transactions on Intelligent Transportation Systems, 2018.
[8] K. Bengler, K. Dietmayer, B. Farber, M. Maurer, C. Stiller, andH. Winner, “Three decades of driver assistance systems.”
[9] S. Al-Sultan, A. H. Al-Bayatti, and H. Zedan, “Context-aware driverbehavior detection system in intelligent transportation systems,” IEEEtransactions on vehicular technology, vol. 62, no. 9, pp. 4264–4275,2013.
[10] M. Green, “Roadway human factors: from science to application,” 2017.[11] D. C. Luvizon, B. T. Nassu, and R. Minetto, “A video-based system for
vehicle speed measurement in urban roadways,” IEEE Transactions onIntelligent Transportation Systems, vol. 18, no. 6, pp. 1393–1404, 2016.
[12] B. Li, J. Yan, W. Wu, Z. Zhu, and X. Hu, “High performance visualtracking with siamese region proposal network,” in Proceedings of theIEEE Conference on Computer Vision and Pattern Recognition, 2018,pp. 8971–8980.
[13] V. A. Memos, K. E. Psannis, Y. Ishibashi, B.-G. Kim, and B. B. Gupta,“An efficient algorithm for media-based surveillance system (eamsus)in iot smart city framework,” Future Generation Computer Systems,vol. 83, pp. 619–628, 2018.
[14] H. Yang, L. Shao, F. Zheng, L. Wang, and Z. Song, “Recent advancesand trends in visual tracking: A review,” Neurocomputing, vol. 74,no. 18, pp. 3823–3831, 2011.
[15] T. Taleb, E. Sakhaee, A. Jamalipour, K. Hashimoto, N. Kato, andY. Nemoto, “A stable routing protocol to support its services in vanetnetworks,” IEEE Transactions on Vehicular technology, vol. 56, no. 6,pp. 3337–3347, 2007.
[16] Q. Luo, Y. Cao, J. Liu, and A. Bensilmane, “Localization and navigationin autonomous driving: Threats and countermeasures,” IEEE Communi-cations Magazine, 2019.
[17] Z. M. Fadlullah, F. Tang, B. Mao, N. Kato, O. Akashi, T. Inoue, andK. Mizutani, “State-of-the-art deep learning: Evolving machine intel-ligence toward tomorrows intelligent network traffic control systems,”IEEE Communications Surveys & Tutorials, vol. 19, no. 4, pp. 2432–2455, 2017.
[18] N. Kato, Z. M. Fadlullah, B. Mao, F. Tang, O. Akashi, T. Inoue, andK. Mizutani, “The deep learning vision for heterogeneous network trafficcontrol: Proposal, challenges, and future perspective,” IEEE wirelesscommunications, vol. 24, no. 3, pp. 146–153, 2016.
[19] J. Wang, L. Zhao, J. Liu, and N. Kato, “Smart resource allocation formobile edge computing: A deep reinforcement learning approach,” IEEETransactions on Emerging Topics in Computing, 2019.
[20] J. Wang, J. Liu, and N. Kato, “Networking and communications inautonomous driving: A survey,” IEEE Communications Surveys &Tutorials, vol. 21, no. 2, pp. 1243–1274, 2018.
[21] L. Zhao, J. Wang, J. Liu, and N. Kato, “Routing for crowd managementin smart cities: A deep reinforcement learning perspective,” IEEECommunications Magazine, vol. 57, no. 4, pp. 88–93, 2019.
[22] B. Sen, J. D. Smith, W. G. Najm et al., “Analysis of lane change crashes,”United States. National Highway Traffic Safety Administration, Tech.Rep., 2003.
[23] X.-G. Li, B. Jia, Z.-Y. Gao, and R. Jiang, “A realistic two-lane cellularautomata traffic model considering aggressive lane-changing behaviorof fast vehicle,” Physica A: Statistical Mechanics and its Applications,vol. 367, pp. 479–486, 2006.
[24] X. Zhang, Z. Yang, W. Sun, Y. Liu, S. Tang, K. Xing, and X. Mao,“Incentives for mobile crowd sensing: A survey,” IEEE CommunicationsSurveys & Tutorials, vol. 18, no. 1, pp. 54–67, 2015.
[25] J. Gao, L. Zhao, and X. Shen, “Network utility maximization based on anincentive mechanism for truthful reporting of local information,” IEEETransactions on Vehicular Technology, vol. 67, no. 8, pp. 7523–7537,2018.
[26] J. B. Kenney, “Dedicated short-range communications (dsrc) standardsin the united states,” Proceedings of the IEEE, vol. 99, no. 7, pp. 1162–1182, 2011.
[27] K. A. Hafeez, L. Zhao, B. Ma, and J. W. Mark, “Performance analysisand enhancement of the dsrc for vanet’s safety applications,” IEEETransactions on Vehicular Technology, vol. 62, no. 7, pp. 3069–3083,2013.
[28] D. Krajzewicz, J. Erdmann, M. Behrisch, and L. Bieker, “Recentdevelopment and applications of sumo-simulation of urban mobility,”International Journal On Advances in Systems and Measurements,vol. 5, no. 3&4, 2012.
[29] L. Codeca, R. Frank, and T. Engel, “Luxembourg sumo traffic (lust)scenario: 24 hours of mobility for vehicular networking research,” in2015 IEEE Vehicular Networking Conference (VNC). IEEE, 2015, pp.1–8.
[30] M. Matousek, M. Yassin, R. van der Heijden, F. Kargl et al., “Robustdetection of anomalous driving behavior,” in 2018 IEEE 87th VehicularTechnology Conference (VTC Spring). IEEE, 2018, pp. 1–5.
[31] S. S. Mahmud, L. Ferreira, M. S. Hoque, and A. Tavassoli, “Applicationof proximal surrogate indicators for safety evaluation: A review of recentdevelopments and research needs,” IATSS research, vol. 41, no. 4, pp.153–163, 2017.
[32] P. Harrington, Machine learning in action. Manning Publications Co.,2012.
[33] V. Vapnik, The nature of statistical learning theory. Springer science& business media, 2013.
[34] C.-C. Chang and C.-J. Lin, “Libsvm: A library for support vectormachines,” ACM transactions on intelligent systems and technology(TIST), vol. 2, no. 3, p. 27, 2011.
[35] N. Elmitiny, X. Yan, E. Radwan, C. Russo, and D. Nashar, “Classifica-tion analysis of driver’s stop/go decision and red-light running violation,”Accident Analysis & Prevention, vol. 42, no. 1, pp. 101–111, 2010.
[36] W.-Y. Loh, “Regression tress with unbiased variable selection andinteraction detection,” Statistica Sinica, pp. 361–386, 2002.

0018-9545 (c) 2019 IEEE. Personal use is permitted, but republication/redistribution requires IEEE permission. See http://www.ieee.org/publications_standards/publications/rights/index.html for more information.
This article has been accepted for publication in a future issue of this journal, but has not been fully edited. Content may change prior to final publication. Citation information: DOI 10.1109/TVT.2019.2945398, IEEETransactions on Vehicular Technology
12
[37] W.-Y. Loh and Y.-S. Shih, “Split selection methods for classificationtrees,” Statistica sinica, pp. 815–840, 1997.
Lan Zhang received the B.S. and M.S. degreesfrom University of Electronic Science and Tech-nology of China, Chengdu, China, in 2013 and2016, respectively. She is currently pursuing the PhDdegree in the Department of Electrical and ComputerEngineering at University of Florida, Gainesville,FL, USA. Her research interests include wirelessnetworking, vehicular communication, and securityand privacy for various cyber-physical systems.
Li Yan received the B.E. degree in communicationengineering and the Ph.D. degree in communicationand information systems from Southwest JiaotongUniversity, China, in 2012 and 2018, respectively.She was a Visiting Student at the Department ofElectrical and Computer Engineering, University ofFlorida, Gainesville, FL, USA, from 2017 to 2018.She is currently a Lecturer with Southwest JiaotongUniversity. Her research interests include 5G com-munications, mobility managements, network archi-tecture, and HSR wireless communications.
Yuguang “Michael” Fang (F’08) received an MSdegree from Qufu Normal University, Shandong,China in 1987, a PhD degree from Case WesternReserve University in 1994, and a PhD degree fromBoston University in 1997. He joined the Depart-ment of Electrical and Computer Engineering at Uni-versity of Florida as an assistant professor in 2000,was promoted to an associate professor in 2003 anda full professor in 2005, and has been a distinguishedprofessor, since 2019. He holds a University ofFlorida Research Foundation (UFRF) Professorship
(2017-2020, 2006-2009), University of Florida Term Professorship (2017-2019), a Changjiang Scholar Chair Professorship (Xidian University, Xian,China, 2008-2011; Dalian Maritime University, Dalian, China, 2015-2018),Overseas Adviser, School of Information Science and Technology, SouthwestJiao Tong University, Chengdu, China (2014-present), and Overseas AcademicMaster (Dalian University of Technology, Dalian, China, 2016-2018).
Dr. Fang received the US National Science Foundation Career Award in2001, the Office of Naval Research Young Investigator Award in 2002, the2015 IEEE Communications Society CISTC Technical Recognition Award,the 2014 IEEE Communications Society WTC Recognition Award, and theBest Paper Award from IEEE ICNP (2006). He has also received a 2010-2011 UF Doctoral Dissertation Advisor/Mentoring Award, a 2011 Florida BlueKey/UF Homecoming Distinguished Faculty Award, and the 2009 UF Collegeof Engineering Faculty Mentoring Award. He was the Editor-in-Chief of IEEETransactions on Vehicular Technology (2013-2017), the Editor-in-Chief ofIEEE Wireless Communications (2009-2012), and serves/served on severaleditorial boards of journals including Proceedings of the IEEE (2018-present),ACM Computing Surveys (2017-present), IEEE Transactions on MobileComputing (2003-2008, 2011-2016), IEEE Transactions on Communications(2000-2011), and IEEE Transactions on Wireless Communications (2002-2009). He has been actively participating in conference organizations suchas serving as the Technical Program Co-Chair for IEEE INFOCOM2014 andthe Technical Program Vice-Chair for IEEE INFOCOM’2005. He is a fellowof the IEEE and a fellow of the American Association for the Advancementof Science (AAAS).
Xuming Fang (SM’16) received the B.E. degreein electrical engineering in 1984, the M.E. degreein computer engineering in 1989, and the Ph.D.degree in communication engineering in 1999 fromSouthwest Jiaotong University, Chengdu, China. Hewas a Faculty Member with the Department ofElectrical Engineering, Tongji University, Shanghai,China, in September 1984. He then joined the Schoolof Information Science and Technology, SouthwestJiaotong University, Chengdu, where he has been aProfessor since 2001, and the Chair of the Depart-
ment of Communication Engineering since 2006. He held visiting positionswith the Institute of Railway Technology, Technical University at Berlin,Berlin, Germany, in 1998 and 1999, and with the Center for AdvancedTelecommunication Systems and Services, University of Texas at Dallas,Richardson, in 2000 and 2001. He has, to his credit, around 200 high-quality research papers in journals and conference publications. He hasauthored or coauthored five books or textbooks. His research interests includewireless broadband access control, radio resource management, multi-hoprelay networks, and broadband wireless access for high speed railway. Dr.Fang is the Chair of IEEE Vehicular Technology Society of Chengdu Chapter.
Xiaoxia Huang (M’07) received the B.E. andM.E degrees in electrical engineering both fromHuazhong University of Science and Technology,Wuhan, China, in 2000 and 2002, respectively, andthe Ph.D. degree in electrical and computer engi-neering from the University of Florida, Gainesville,FL, USA, in 2007. She is currently a Professor withSchool of Electronics and Communication Engineer-ing at Sun Yat-Sen University. Her research inter-ests include intelligent wireless networks, ambientbackscatter networks, and energy harvesting.