Embed Size (px)
Citation preview

City of Scottsdale: Automotive Dealerships
Market Analysis
A Market and Feasibility Study of New Car Dealerships in Scottsdale
SCOTTSDALE
April 2008 Economic Vitality Department

Scottsdale Automotive Dealership Market Analysis—April 2008 2
Scottsdale Automotive Dealerships Market Analysis
April 2008
Scottsdale City Council
Betty Drake
Wayne Ecton
W.J. “Jim” Lane
Robert Littlefield
Ron McCullagh
Tony Nelssen
John C. Little Acting City Manager
A publication of:
The City of Scottsdale Economic Vitality Department 4021 N 75th Street, Suite 102
Scottsdale, AZ 85251 Phone: (480) 312-7989
Fax: (480) 312-2672 www.scottsdaleaz.gov/economics/reports
Last Updated: April 28, 2008
Mary Manross Mayor

Scottsdale Automotive Dealership Market Analysis—April 2008 3
TABLE OF CONTENTS
I. Executive Summary 5
II. Introduction 6
III. Scottsdale Resident Market 11
IV. Scottsdale Employment Market 15
V. Regional Competition 18
VI. Transportation Factors 27
VII. Vehicle Sales & Registration 29
VIII. Appendix 34
Scottsdale Automotive Dealership Market Analysis—April 2008 4
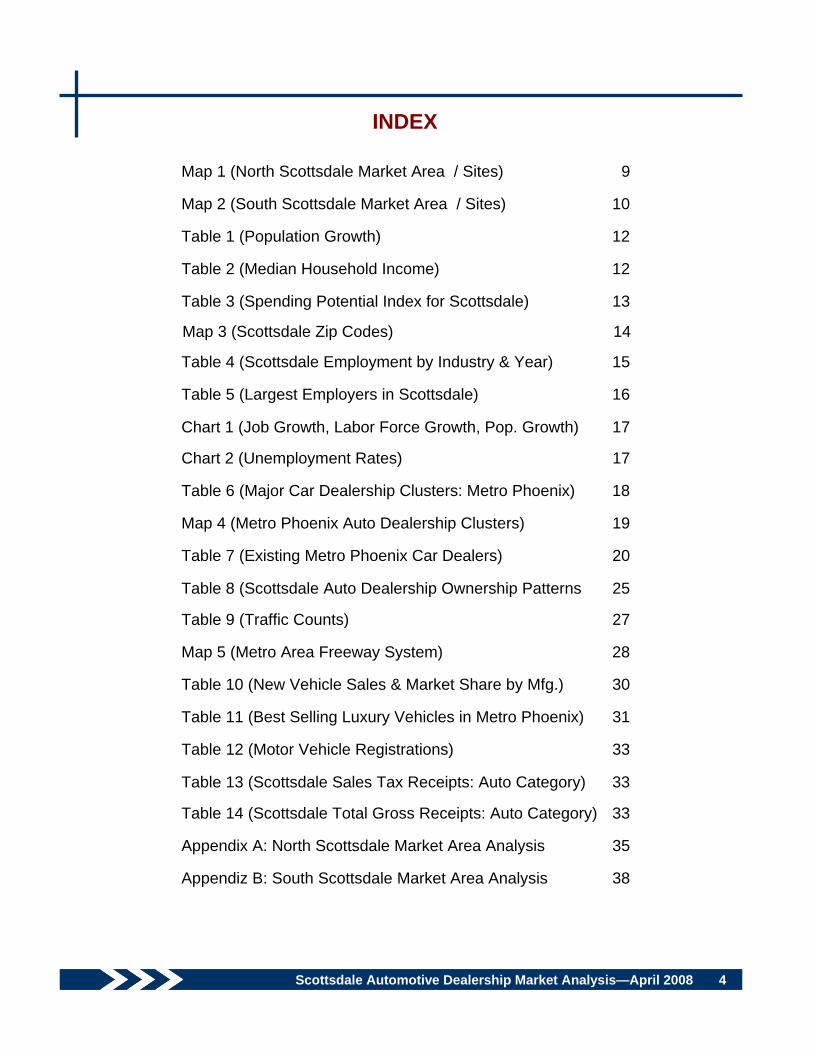
INDEX
Map 1 (North Scottsdale Market Area / Sites) 9
Map 2 (South Scottsdale Market Area / Sites) 10
Table 1 (Population Growth) 12
Table 2 (Median Household Income) 12
Table 3 (Spending Potential Index for Scottsdale) 13
Table 4 (Scottsdale Employment by Industry & Year) 15
Table 5 (Largest Employers in Scottsdale) 16
Chart 1 (Job Growth, Labor Force Growth, Pop. Growth) 17
Chart 2 (Unemployment Rates) 17
Table 6 (Major Car Dealership Clusters: Metro Phoenix) 18
Map 4 (Metro Phoenix Auto Dealership Clusters) 19
Table 7 (Existing Metro Phoenix Car Dealers) 20
Table 8 (Scottsdale Auto Dealership Ownership Patterns 25
Table 9 (Traffic Counts) 27
Map 5 (Metro Area Freeway System) 28
Table 10 (New Vehicle Sales & Market Share by Mfg.) 30
Table 11 (Best Selling Luxury Vehicles in Metro Phoenix) 31
Table 12 (Motor Vehicle Registrations) 33
Table 13 (Scottsdale Sales Tax Receipts: Auto Category) 33
Table 14 (Scottsdale Total Gross Receipts: Auto Category) 33
Appendix A: North Scottsdale Market Area Analysis 35
Appendiz B: South Scottsdale Market Area Analysis 38
Map 3 (Scottsdale Zip Codes) 14

Scottsdale Automotive Dealership Market Analysis—April 2008 5
I. EXECUTIVE SUMMARY
◊ The Phoenix metro area is a very dynamic market; it is growing rapidly, possesses a highly diversified economy, and has excellent prospects for the future.
◊ The City of Scottsdale is one of the
most desirable areas within metro Phoenix, both for businesses and residents. With its high quality of life, high service levels and competitive costs, it attracts not only affluent residents and tourists, but also businesses looking for a higher-end location.
◊ The resident population base of the
market area for the Auto Corridor in North Scottsdale is rapidly growing; the estimated population, within a 10 mile radius, is 524,715. The projected population for 2012 is 585,137, almost a 12 percent increase, which indicates this area will continue to grow.
◊ The total number of people employed
within the 10 mile radius of the North Auto Corridor area is currently 257.388 employees, with an estimated average median household income of $84,328. The Scottsdale Airpark is currently home to nearly 2,500 businesses that employ over 50,000 people.
◊ The resident population base of the market area for the Motor Mile in south Scottsdale continues to grow; the estimated population, within a 10 mile radius, is 1,094,107. The projected population for 2012 is 1,185,301.
◊ Surface transportation improvements
that were recently completed and currently underway greatly enhance accessibility to the Scottsdale auto malls; the primary improvement is the Pima Freeway, which includes interchanges north and east of the north Auto Corridor area. Additional lanes of traffic are currently being added to this freeway.
◊ The automotive clusters closest in
proximity to the Scottsdale market are the Northeast Phoenix, North Phoenix, and East Phoenix. This leaves auto dealers in Scottsdale with an excellent opportunity to serve the rapidly growing and affluent northeast Valley.
◊ The total number of people employed
within the 10 mile radius of the Motor Mile is 769,648, with an estimated median household income of $58,524.

Scottsdale Automotive Dealership Market Analysis—April 2008 6
II. INTRODUCTION
Automobile dealers traditionally have located near each other, creating strip commercial development along major arterial streets. By offering a wide variety of makes and models in one general area, these dealers tend to have a competitive advantage and greater sales potential; customers know that they will be able to compare different lines of cars without having to drive all over town. In addition, these areas tend to attract a variety of auto related services that support the dealer base in that area. Examples of this within the metro Phoenix area include the east Camelback corridor in Phoenix and the Motor Mile in the southern part of Scottsdale. The concept of the auto mall carries this idea one step farther, and is seen, in varying forms, as the future of automobile retailing. The auto mall concentrates a number of dealers or brands on a single site, providing the opportunity, in many cases for a customer to park and walk to a number of dealerships. Auto malls have Covenants, Conditions and Restrictions (CC&Rs) regulating architecture, landscaping, etc., as well as joint marketing programs and other common services and amenities. All of this provides greater recognition and visibility for the center, and therefore attracts more customers. An example of this within the metro Phoenix area includes the Frank Lloyd Wright corridor in the northern part of Scottsdale.
This report includes six major sections, beginning with an overview of the metropolitan area, the City of Scottsdale and the auto mall market area. The report then examines the residential market and then looks at the employment market in the Scottsdale area. Additionally, this report lists the existing regional competition to the auto mall in the Metro Phoenix area, and outlines the transportation factors that make Scottsdale an excellent location for an auto dealership. The final section of the report looks at the automobile sales statistics and registration trends in the state and Metro Phoenix area..
Scottsdale

Scottsdale Automotive Dealership Market Analysis—April 2008 7
The Phoenix metropolitan area is one of the most dynamic and growing areas in the country. Already the hub of the Southwest, Metro Phoenix is rapidly becoming one of the nation’s largest metropolitan areas. Driving this tremendous growth is a strong and diverse employment sector, with high-tech manufacturing, research, corporate headquarters, tourism, and business/personal services as the basis for this strength. The following is a brief overview of some of the major developments occurring in the Phoenix area today: ◊ From 1995 to 2007 the metropolitan
population grew 60.7 percent with an actual increase of approximately 1,550,087. The current population in the metro area is over 4.1 million.
◊ Over half of all of the Metro area
manufacturing jobs are in high-tech industries. The 2007 unemployment rate for metro Phoenix was 3.3 percent.
◊ Tourism remains an important factor
in the Metro Phoenix area with over 15.1 million visitors in 2006. There are about 55,000 hotel rooms available in Metro Phoenix, and that figure continues to increase.
◊ 49 major companies, with over 7,929
new targeted jobs, decided to relocate or expand their operations in the metro Phoenix area in 2006.
◊ Total retail sales in Metro Phoenix
totaled roughly $56.5 billion in 2006 (Source : E l le r Co l lege o f Management).
Scottsdale is considered to be one of the most desirable areas within metropolitan Phoenix, from both a business and a residential viewpoint. The City of Scottsdale has one of the strongest local economies, with low taxes and excellent services. Still, Scottsdale remains strongly committed to maintaining a very high quality of life. Development standards are the strictest in the state. Some specific characteristics that make Scottsdale a unique and desirable location include: ◊ Scottsdale’s population growth rose
roughly 1.5 percent—to 236,373—in 2007. Scottsdale’s overall median household income is among the highest in the Metro area at $72,763.
◊ Retail sales have grown dramatically
over the past ten years. Sales tax collections in Scottsdale have increased 110 percent over the past ten years.
◊ As a tourism destination, Scottsdale
hosted 7.7 million visitors in 2006 with an economic impact of $3.5 billion.
◊ Scottsdale issued 1,060 residential
housing permits in FY2006/07.
Metro Phoenix Overview Scottsdale Overview

Scottsdale Automotive Dealership Market Analysis—April 2008 8
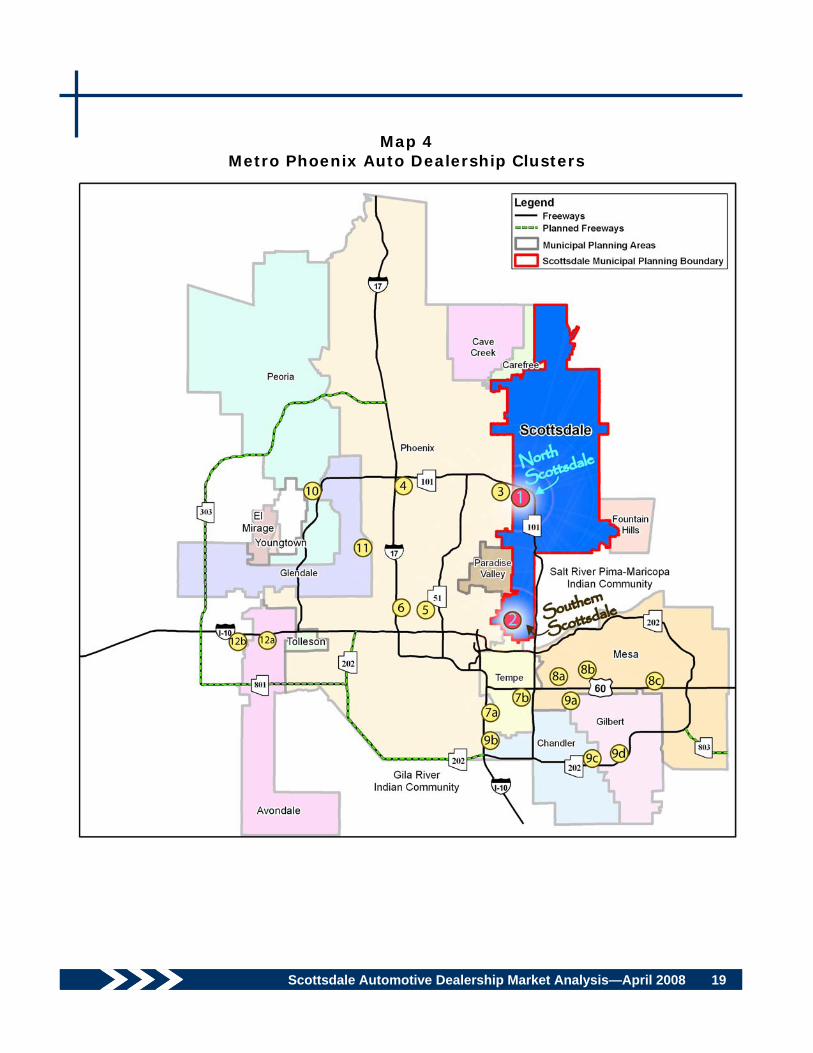
Map 1 (p. 9) delineates the estimated market area for the North Scottsdale Auto Mall. This area includes a ten-mile radius from the Greenway-Hayden Loop and Frank Lloyd Wright Boulevard intersection. Map 2 (p. 10) outlines the estimated market area for the South Scottsdale “Motor Mile”. This area also includes a ten-mile radius extending from McDowell Road and Scottsdale Road. These areas naturally overlap and share portions of other nearby market areas, including Phoenix, Tempe, and Mesa, but represent shorter drive times to each particular market area. Demographics for each market area are included in the Appendix (p. 34). The relative locations of both Scottsdale auto market areas as well as the location of other auto clusters throughout the Metro Phoenix area are shown on Map 4 (p. 19).
Market Area Maps

Scottsdale Automotive Dealership Market Analysis—April 2008 9
Map 1 North Scottsdale Market Area
Key Name Address Owner1 Pinnacle Nissan/Infiniti 7601 E Frank Lloyd Wright Blvd Larry Van Tuyl2 Ed Moses Dodge 7801 E Frank Lloyd Wright Blvd Ed Moses3 Right Honda 7875 E Frank Lloyd Wright Blvd David Wilson4 Right Toyota 7701 E Frank Lloyd Wright Blvd David Wilson5 Legends Cadillac 7901 E Frank Lloyd Wright Blvd John Lund6 Power Ford 8555 E Frank Lloyd Wright Blvd AutoNation7 Van Chevrolet 8585 E Frank Lloyd Wright Blvd Larry Van Tuyl8 Airpark Chrysler/Jeep 15656 N Hayden Rd Coye Porter9 North Scottsdale Hyundai 15500 N Hayden Rd Alan Holzehue10 Saturn of Scottsdale 15350 N Hayden Rd Scotts Property11 Cardinale Way Pontiac/GMC/Buick 15333 N Hayden Rd Joseph Cardinale12 Available 15055 N Hayden Rd -13 Motorsports of Scottsdale 8053 E Raintree Dr Javad Maghami14 Scottsdale Lotus 7652 E Acoma Dr Eric Edenholm
North Scottsdale New Car Dealer Locations Map Legend

Scottsdale Automotive Dealership Market Analysis—April 2008 10
Map 2 South Scottsdale Market Area
Bill Heard site, 2 miles
Key Name Address Owner1 Power Subaru 6420 E McDowell Rd AutoNation2 Power Chrysler/Jeep 6460 E McDowell Rd AutoNation3 Power Isuzu/Hyundai 6480 E McDowell Rd AutoNation4 Powell Volvo 6500 E McDowell Rd Stan Powell5 Power Buick/GMC/Pontiac 6640 E McDowell Rd AutoNation6 Available 6850 E McDowell Rd -7 Infiniti of Scottsdale 6910 E McDowell Rd Ken Schatzberg8 Available 7000 E McDowell Rd -9 Five Star Ford 7100 E McDowell Rd Dr. Kenneth Scholz10 Bill Heard Chevrolet - Service Site 7227 E McDowell Rd Bill Heard11 Scottsdale Hummer 1101 N Scottsdale Rd John Lund12 Mark Kia 1000 N Scottsdale Rd Mark Debowy13 Mark Mitsubishi 1000 N Scottsdale Rd Mark Debowy14 Kachina Cadillac/Hummer Saab 1200 N Scottsdale Rd John Lund15 Scottsdale Lexus 6905 E McDowell Rd Penske16 Scottsdale Aston Martin 6725 E McDowell Rd Penske17 Ferrari/Maserati Scottsdale 6825 E McDowell Rd Penske18 Jaguar/Rolls Royce/Land Rover Scottsdale 6725 E McDowell Rd Penske19 Chapman BMW/Dodge/Volkswagen 6601 E McDowell Rd Baxter Chapman20 Bill Heard Chevrolet 8705 E McDowell Rd Bill Heard
Southern Scottsdale New Car Dealer Locations Map Legend
Motor Mile dealers 2 miles

Scottsdale Automotive Dealership Market Analysis—April 2008 11
III. SCOTTSDALE RESIDENT MARKET
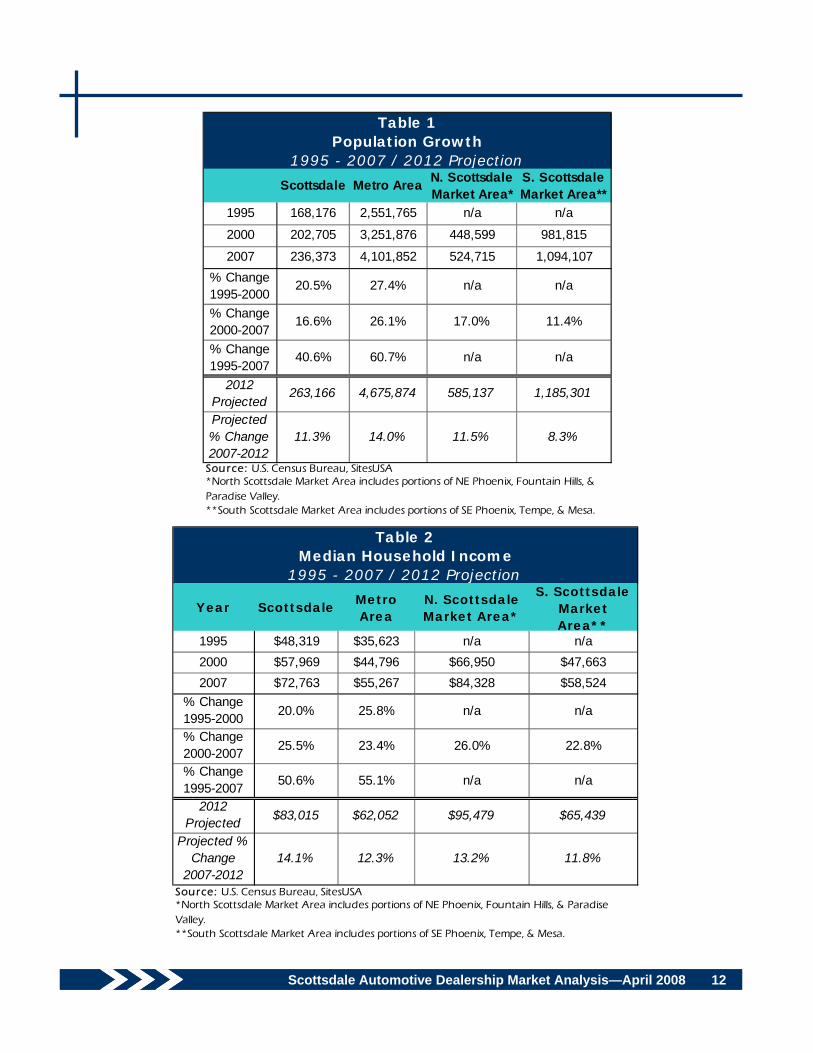
The most important component of the overall demand for new car dealerships within a market area is the resident base within that area. This part of the study looks at the residential market in the northeast Valley, in terms of the number of residents and socioeconomic breakdowns. Overall, the population of the Phoenix metro area grew by approximately 61 percent during from 1995 through 2007; up from 2.6 million in 1995, to 4.1 million in 2007. During the period between 1995 and 2007, the City of Scottsdale grew nearly 41 percent. Significant growth (approximately 3 percent annually) continues. Scottsdale’s population and the Metro area’s population is expected to grow by 11 percent and 14 percent, respectively, over the next five years.
The median household income level of Scottsdale residents is among the highest in the Valley — $72,763, compared to approximately $55,000 for the Metro area in 2007. These higher income households typically have greater disposable income, and, therefore, greater disposition toward new car purchases. Overall, the population located within these markets is rapidly growing, and the residents tend to have high-income levels a n d e x c e l l e n t d e m o g r a p h i c characteristics that make them more likely to consider a new car purchase than any other population base in the Valley. Table 1 (p. 12) shows Scottsdale’s population growth from 1995 through 2007 with projections for 2012. Table 2 (p. 12) shows the median household income of Scottsdale residents since 1995 with a 2012 projection, as well. Table 3 (pg. 13) illustrates the spending potential index for Scottsdale residents by postal zip code, and Map 3 (p. 14)shows the locations of these zip codes within the City of Scottsdale.
Scottsdale’s population has grown nearly 17
percent over the last 7 years
Scottsdale Automotive Dealership Market Analysis—April 2008 12
Scottsdale Metro Area N. Scottsdale Market Area*
S. Scottsdale Market Area**
1995 168,176 2,551,765 n/a n/a
2000 202,705 3,251,876 448,599 981,815
2007 236,373 4,101,852 524,715 1,094,107% Change 1995-2000
20.5% 27.4% n/a n/a
% Change 2000-2007
16.6% 26.1% 17.0% 11.4%
% Change 1995-2007
40.6% 60.7% n/a n/a
2012 Projected
263,166 4,675,874 585,137 1,185,301
Projected % Change 2007-2012
11.3% 14.0% 11.5% 8.3%
Sou rce : U.S. Census Bureau, SitesUSA
**South Scottsdale Market Area includes portions of SE Phoenix, Tempe, & Mesa.
Table 1Population Growth
1995 - 2007 / 2012 Projection
*North Scottsdale Market Area includes portions of NE Phoenix, Fountain Hills, & Paradise Valley.
Year ScottsdaleMetro Area
N. Scottsdale Market Area*
S. Scottsdale Market Area**
1995 $48,319 $35,623 n/a n/a2000 $57,969 $44,796 $66,950 $47,6632007 $72,763 $55,267 $84,328 $58,524
% Change 1995-2000 20.0% 25.8% n/a n/a
% Change 2000-2007 25.5% 23.4% 26.0% 22.8%
% Change 1995-2007 50.6% 55.1% n/a n/a
2012 Projected $83,015 $62,052 $95,479 $65,439
Projected % Change
2007-201214.1% 12.3% 13.2% 11.8%
Sou rce: U.S. Census Bureau, SitesUSA
**South Scottsdale Market Area includes portions of SE Phoenix, Tempe, & Mesa.
Table 2Median Household Income
1995 - 2007 / 2012 Projection
*North Scottsdale Market Area includes portions of NE Phoenix, Fountain Hills, & Paradise Valley.

Scottsdale Automotive Dealership Market Analysis—April 2008 13
Auto Loan
Home Loan
Investments
Retirement Plans
Home Repair
Lawn & Garden
Computers & Hardware
Major Appliances
Electronics
Furniture
Restaurants
Sporting Goods
Fees & Tickets
Toys & Games
Travel
Cable TV
Apparel & Service
Auto Repairs
Health Insurance
Pets & Supplies
8525
011
412
414
112
612
612
511
711
911
712
111
710
512
411
212
511
910
511
912
511
885
251
100
9511
110
095
9610
798
106
105
107
9010
610
210
510
696
105
104
9885
253
242
332
372
333
354
291
293
288
262
307
268
277
334
258
318
254
257
277
257
280
8525
416
118
619
319
218
116
217
216
416
017
916
215
718
316
417
515
515
116
415
016
485
255
213
292
323
293
306
252
256
254
226
267
228
245
285
223
277
217
218
245
223
247
8525
662
5850
5653
5556
5857
5757
5354
5855
5650
5856
5885
257
8586
9787
8584
8986
8987
8877
8987
8989
7988
8985
8525
817
219
521
219
720
019
118
718
817
718
917
717
619
416
619
817
616
118
918
518
585
259
193
235
246
242
235
201
213
203
195
224
199
195
234
200
219
188
188
200
181
202
8526
016
519
019
219
718
316
217
616
616
318
516
616
018
816
817
715
615
416
714
916
685
262
218
288
325
285
307
274
245
260
228
262
229
234
277
217
279
229
214
248
249
252
Ariz
ona
102
100
9899
9698
100
9999
101
9991
9997
9999
8910
210
099
U.S
.10
010
010
010
010
010
010
010
010
010
010
010
010
010
010
010
010
010
010
010
0So
urc
e: T
he
Sou
rceb
ook
of Z
ip C
ode
Dem
ogra
phic
s, 20
07
Zip
Code
Table
3S
pendin
g P
ote
nti
al I
ndex f
or
Sco
ttsd
ale
20
07
Fina
ncia
l Ser
vice
sEn
tert
ainm
ent
Pers
onal
The
Hom
e

Scottsdale Automotive Dealership Market Analysis—April 2008 14
Map 3 Scottsdale Zip
Codes
Scottsdale Automotive Dealership Market Analysis—April 2008 15
IV. SCOTTSDALE EMPLOYMENT MARKET
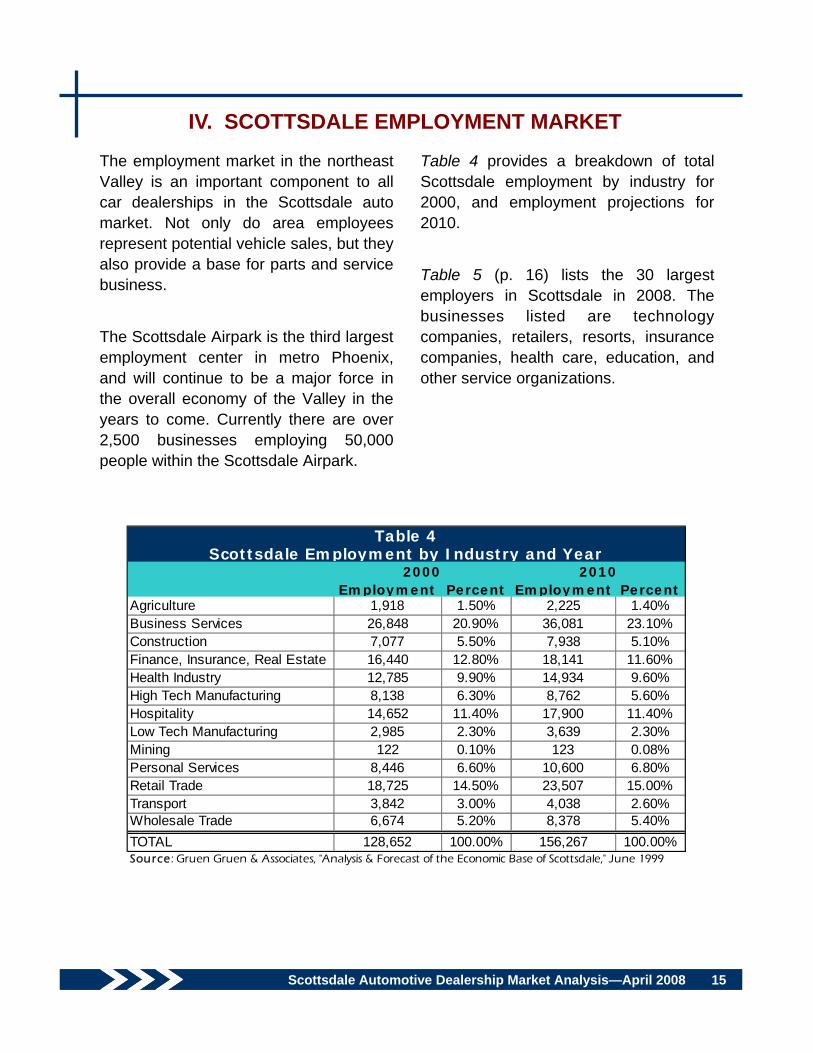
The employment market in the northeast Valley is an important component to all car dealerships in the Scottsdale auto market. Not only do area employees represent potential vehicle sales, but they also provide a base for parts and service business. The Scottsdale Airpark is the third largest employment center in metro Phoenix, and will continue to be a major force in the overall economy of the Valley in the years to come. Currently there are over 2,500 businesses employing 50,000 people within the Scottsdale Airpark.
Table 4 provides a breakdown of total Scottsdale employment by industry for 2000, and employment projections for 2010. Table 5 (p. 16) lists the 30 largest employers in Scottsdale in 2008. The businesses listed are technology companies, retailers, resorts, insurance companies, health care, education, and other service organizations.
Employment Percent Employment PercentAgriculture 1,918 1.50% 2,225 1.40%Business Services 26,848 20.90% 36,081 23.10%Construction 7,077 5.50% 7,938 5.10%Finance, Insurance, Real Estate 16,440 12.80% 18,141 11.60%Health Industry 12,785 9.90% 14,934 9.60%High Tech Manufacturing 8,138 6.30% 8,762 5.60%Hospitality 14,652 11.40% 17,900 11.40%Low Tech Manufacturing 2,985 2.30% 3,639 2.30%Mining 122 0.10% 123 0.08%Personal Services 8,446 6.60% 10,600 6.80%Retail Trade 18,725 14.50% 23,507 15.00%Transport 3,842 3.00% 4,038 2.60%Wholesale Trade 6,674 5.20% 8,378 5.40%TOTAL 128,652 100.00% 156,267 100.00%Sou rce: Gruen Gruen & Associates, "Analysis & Forecast of the Economic Base of Scottsdale," June 1999
Table 4Scottsdale Employment by Industry and Year
2000 2010

Scottsdale Automotive Dealership Market Analysis—April 2008 16
Largest Employers in Scottsdale - 2008Rank Company Name Employees
1 Scottsdale Healthcare** 5,2132 Mayo Clinic - Scottsdale 5,0033 General Dynamics 2,9904 City of Scottsdale 2,5625 Scottsdale Unified School District** 2,5146 CVS - CareMark 2,3467 Go Daddy Group 1,9158 The Vanguard Group 1,7009 Troon Golf LLC 1,53910 Scottsdale Insurance Company 1,40011 Fairmont Princess Resort 1,20012 DHL 1,00013 Coventry Health Care 70014 Dial Corporation 70015 USPS - Scottsdale 64616 Desert Mountain Properties 61017 Nordstrom 60818 The Boulders Resort 60019 E-Telecare Global Solutions 60020 Pulte Homes 54521 Taser 51822 McKesson 50023 Hyatt Regency at Gainey Ranch 50024 Wal-Mart 47525 JDA Software Group 46026 Scottsdale Medical Imaging 45027 First National Bank of Arizona** 35528 Sage Software 35029 Scottsdale Conference Resort** 32930 United Blood Services 326
Sou rce: City of Scottsdale, Economic Vitality Department
*** = Full-time equivalent (FTE), as of March 2008
Table 5

Scottsdale Automotive Dealership Market Analysis—April 2008 17
Chart 1 compares job growth to labor force growth to population growth for metro Phoenix and Scottsdale. Between 1990 and 2005 the total number of jobs in the Metro area grew by 66 percent. There are currently over 257,388 jobs in the north Scottsdale market area, and over 769,648 in the south Scottsdale market area. Both labor force and population growth in the market areas are expected to be slower than the rate of job increase, so it appears that this area will become more important in terms of jobs over time.
Chart 2 provides an overview of unemployment rates for Scottsdale, metro Phoenix, and the State of Arizona since 1998. Between 1998 and 2007, Scottsdale’s unemployment rate ranged between 4.6 percent and 1.9 percent. Scottsdale has paralleled the metro Phoenix and Arizona state rates, but at a signi f icant ly lower level . The unemployment rate for Scottsdale has consistently been about 30 percent lower than the rate for the entire metro Phoenix area, and about 40 percent lower than the rate for the State of Arizona.
0%
20%
40%
60%
80%
100%
% C
hang
e 19
90 -
2005
Job Grow th Labor ForceGrow th
PopulationGrow th
Chart 1Job Growth, Labor Force Growth,
& Population Growth
Scottsdale Maricopa County
Chart 2 Unemployment Rates
0.0%2.0%4.0%6.0%8.0%
1998 1999 2000 2001 2002 2003 2004 2005 2006 2007
Arizona Metro Phoenix Scottsdale

Scottsdale Automotive Dealership Market Analysis—April 2008 18
V. REGIONAL COMPETITION
Currently there are 12 major new car dealership clusters serving the metro Phoenix area. These dealership clusters are shown in Table 6.
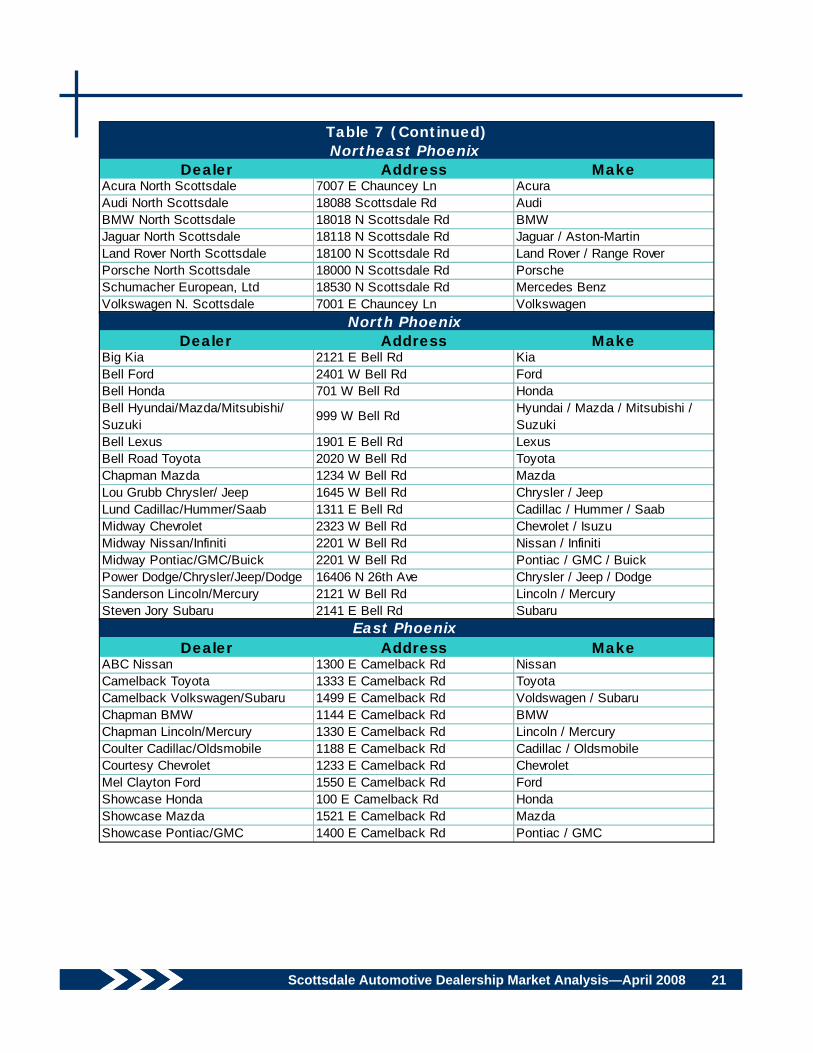
Information about the individual dealerships is included on Maps 1, 2, and 4 (pp. 9, 10, & 19) and in Tables 7 and 8 (pp. 20—26). The clusters closest in proximity to the Scottsdale market are the Northeast Phoenix, North Phoenix, and East Phoenix clusters. This leaves auto dealers in Scottsdale with an excellent opportunity to serve the rapidly growing and affluent northeast Valley.
Key Area Location # Dealerships # Makes Represented
1 North Scottsdale Frank Lloyd Wright Blvd. & Hayden Rd area 13 272 Southern Scottsdale 68th St. & McDowell Rd area (Motor Mile) 16 283 Northeast Phoenix Scottsdale Rd & Loop 101 area 8 104 North Phoenix Bell Rd & I-17 area 15 265 East Phoenix 12th St. & Camelback Rd area 11 156 Central Phoenix Camelback Rd & I-17 area 5 7
(a) Elliot Rd & I-10 area (Autoplex);(b) Baseline Rd & Rural/McClintock Rd area(a) Broadway Rd & Alma School Rd. area;
(b) Main St. & Mesa Dr. area;(c) Superstition Springs Rd & US Hwy 60 area
(a) Arizona Ave & Baseline Rd area;(b) Ray Rd & I-10 area;
(c) Gilbert Rd & Loop 202;(d) Val Vista Rd & Loop 202 areas
10 Peoria Bell Rd & Loop 101 area 16 1911 Glendale 51st Ave & Glendale Rd area 7 11
(a) I-10 & SW of Loop 101 area(b) I-10 & Litchfield Rd area
16 17West Valley
Mesa/ Apache Junction 15 16
Chandler/ Gilbert 1914
12 18
Table 6Major New Car Dealership Clusters: Metro Phoenix Area
2008
7
8
9
12
Tempe
Scottsdale Automotive Dealership Market Analysis—April 2008 19
Map 4 Metro Phoenix Auto Dealership Clusters

Scottsdale Automotive Dealership Market Analysis—April 2008 20
Dealer Address MakeAirpark Chrysler/Jeep 15656 N Hayden Rd Chrysler / JeepCardinale Way Pontiac/GMC/Buick 15333 N Hayden Rd Pontiac / GMC / BuickEd Moses Dodge 7801 E Frank Lloyd Wright Blvd DodgeLedgends Cadillac 7901 E Frank Lloyd Wright Blvd Cadillac / Hummer / Saab
Motorsports of Scottsdale 8053 E Raintree Dr
Aston-Martin / Bentley / BMW / Ferrari / Lamborghini / Mercedes Benz / Panoz / Porsche / Rolls Royce / Murcielargo / Spyker
North Scottsdale Hyundai 15500 N Hayden Rd HyundaiPinnacle Nissan/Infiniti 7601 E Frank Lloyd Wright Blvd Nissan / InfinitiPower Ford 8555 E Frank Lloyd Wright Blvd FordRight Honda 7875 E Frank Lloyd Wright Blvd HondaRight Toyota 7701 E Frank Lloyd Wright Blvd ToyotaSaturn of Scottsdale 15350 N Hayden Rd Saturn
Scottsdale Lotus 7652 E Acoma Dr
Porsche / Audi / Ferrari / Maserati / Aston Martin / Jaguar / Bentley / Mercedes Benz / BMW / Lotus
Van Chevrolet 8585 E Frank Lloyd Wright Blvd Chevrolet
Table 7Existing Metro Phoenix New Car Dealers - 2008
North Scottsdale
Dealer Address MakeBill Heard Chevrolet 8705 E McDowell Rd ChevroletChapman BMW/Dodge/Volkswagen 6601 E McDowell Rd BMW / Dodge / VolkswagenFerrari/Maserati Scottsdale 6825 E McDowell Rd Ferrari / MaseratiFive Star Ford 7100 E McDowell Rd FordInfiniti of Scottsdale 6910 E McDowell Rd InfinitiJaguar/Rolls Royce/Bentley/Land Rover of Scottsdale
6725 E McDowell Rd Jaguar / Rolls Royce / Bentley / Land Rover / Aston Martin
Kachina Cadillac/ Hummer/Saab 1200 N Scottsdale Rd Cadillac / Saab / HummerMark Kia 1000 N Scottsdale Rd KiaMark Mitsubishi 1000 N Scottsdale Rd MitsubishiPower Buick/GMC/Pontiac 6640 E McDowell Rd Buick / GMC / PontiacPower Chrysler/Jeep 6460 E McDowell Rd Chrysler / JeepPower Isuzu/Hyundai 6480 E McDowell Rd Isuzu / HyundaiPower Subaru 6420 E McDowell Rd SubaruPowell Volvo 6500 E McDowell Rd Volvo
Scottsdale Aston Martin 6725 E McDowell Rd Jaguar / Rolls Royce / Bentley / Land Rover / Aston Martin
Scottsdale Hummer 1101 N Scottsdale Rd HummerScottsdale Lexus 6905 E McDowell Rd Lexus
South Scottsdale
Scottsdale Automotive Dealership Market Analysis—April 2008 21
Dealer Address MakeAcura North Scottsdale 7007 E Chauncey Ln AcuraAudi North Scottsdale 18088 Scottsdale Rd AudiBMW North Scottsdale 18018 N Scottsdale Rd BMWJaguar North Scottsdale 18118 N Scottsdale Rd Jaguar / Aston-MartinLand Rover North Scottsdale 18100 N Scottsdale Rd Land Rover / Range RoverPorsche North Scottsdale 18000 N Scottsdale Rd PorscheSchumacher European, Ltd 18530 N Scottsdale Rd Mercedes BenzVolkswagen N. Scottsdale 7001 E Chauncey Ln Volkswagen
Table 7 (Continued)Northeast Phoenix
Dealer Address MakeBig Kia 2121 E Bell Rd KiaBell Ford 2401 W Bell Rd FordBell Honda 701 W Bell Rd HondaBell Hyundai/Mazda/Mitsubishi/ Suzuki
999 W Bell Rd Hyundai / Mazda / Mitsubishi / Suzuki
Bell Lexus 1901 E Bell Rd LexusBell Road Toyota 2020 W Bell Rd ToyotaChapman Mazda 1234 W Bell Rd MazdaLou Grubb Chrysler/ Jeep 1645 W Bell Rd Chrysler / JeepLund Cadillac/Hummer/Saab 1311 E Bell Rd Cadillac / Hummer / SaabMidway Chevrolet 2323 W Bell Rd Chevrolet / IsuzuMidway Nissan/Infiniti 2201 W Bell Rd Nissan / InfinitiMidway Pontiac/GMC/Buick 2201 W Bell Rd Pontiac / GMC / BuickPower Dodge/Chrysler/Jeep/Dodge 16406 N 26th Ave Chrysler / Jeep / DodgeSanderson Lincoln/Mercury 2121 W Bell Rd Lincoln / MercurySteven Jory Subaru 2141 E Bell Rd Subaru
North Phoenix
Dealer Address MakeABC Nissan 1300 E Camelback Rd NissanCamelback Toyota 1333 E Camelback Rd ToyotaCamelback Volkswagen/Subaru 1499 E Camelback Rd Voldswagen / SubaruChapman BMW 1144 E Camelback Rd BMWChapman Lincoln/Mercury 1330 E Camelback Rd Lincoln / MercuryCoulter Cadillac/Oldsmobile 1188 E Camelback Rd Cadillac / OldsmobileCourtesy Chevrolet 1233 E Camelback Rd ChevroletMel Clayton Ford 1550 E Camelback Rd FordShowcase Honda 100 E Camelback Rd HondaShowcase Mazda 1521 E Camelback Rd MazdaShowcase Pontiac/GMC 1400 E Camelback Rd Pontiac / GMC
East Phoenix

Scottsdale Automotive Dealership Market Analysis—April 2008 22
Dealer Address MakeBill Luke Chrysler/Jeep/Dodge 2425 W Camelback Rd Chrysler / Jeep / DodgeCamelback Hyundai/Kia 2223 W Camelback Rd Hyundai / KiaPower Chevrolet 2646 W Camelback Rd ChevroletPerformance Chrysler/Jeep/Dodge 4240 W Glendale Ave Chrysler / Jeep / DodgePhoenix Mercedes Benz 225 W Indian School Rd Mercedes Benz
Table 7 (Continued)Central Phoenix
Dealer Address MakeAcura of Tempe 7800 S Autoplex Loop AcuraChapman Chevrolet/Isuzu 1717 E Baseline Rd Chevrolet / IsuzuEarnhardt Chrysler/Jeep 577 E Baseline Rd Chrysler / JeepHyundai of Tempe 8050 S Autoplex Loop HyundaiPower Nissan 7755 S Autoplex Loop NissanSaturn of Tempe 7799 S Autoplex Loop SaturnTempe Dodge/Kia 7975 S Autoplex Loop Dodge / KiaTempe Honda 8300 S Autoplex Loop Honda / KiaTempe Lincoln/Mercury 7777 S Test Dr Lincoln / MercuryTempe Mitsubishi 8060 S Autoplex Loop MitsubishiTempe Coulter Pontiac/GMC/Buick 7780 S Autoplex Loop Pontiac / GMC / BuickTempe Toyota 7970 S Autoplex Loop Toyota
Tempe
Dealer Address MakeBerge Ford 460 E Auto Center Dr FordBrown & Brown Chevrolet 145 E Main St ChevroletBrown & Brown Nissan 1701 W Broadway Rd NissanPower Chevrolet 6330 E Superstition Springs Blvd ChevroletCardinale Way Mazda 6343 E Test Dr MazdaCoury Pontiac/GMC/Buick 6315 E Auto Park Dr Pontiac / GMC / BuickDarner Chrysler/Jeep 837 W Main St Chrysler / JeepEarnhardt Nissan 6354 E Test Dr NissanEarnhardt Toyota 6136 E Auto Loop Dr Toyota / ScionFiesta Lincoln/Mercury 1720 S Mesa Dr Lincoln / MercuryInfiniti of Superstition Springs 6225 E Test Dr InfinitiSuperstition Ford 3400 S Tomahawk Rd (AJ) FordSuperstition Springs Chrysler/Jeep 6130 Auto Park Dr Chrysler / JeepSuperstition Springs Honda 6229 E Auto Park Dr HondaSuperstition Springs Lexus 6206 E Test Dr Lexus
Mesa/ Apache Junction

Scottsdale Automotive Dealership Market Analysis—April 2008 23
Dealer Address MakeAudi of Chandler 7460 W Orchid Ln AudiBerge Mazda/Volkwagen 385 W Baseline Rd Mazda / VolkswagenBig Two Toyota/Scion 1250 S Gilbert Rd Toyota / ScionDesert Kia 1025 N Arizona Ave KiaEarnhardt Dodge/Hyundai/Kia 1301 N Arizona Ave Dodge / Hyundai / KiaEarnhardt Ford/Mazda 7300 W Orchid Ln Ford / MazdaFreeway Chevrolet 1150 N 54th St ChevroletHenry Brown Buick/Pontiac/GMC 1550 E Driver's Way Buick / Pontiac / GMCLexus of Chandler 7430 W Orchid Ln LexusMercedes Benz of Chandler 7450 W Orchid Ln Mercedes BenzPower Nissan Chandler 1350 S Gilbert Rd NissanSanTan Ford 1429 E Motorplex FordSanTan Honda Superstore 1150 S Gilbert Rd HondaThorobred Chevrolet 2121 N Arizona Ave Chevrolet
Table 7 (Continued)Chandler/ Gilbert
Dealer Address MakeAcura of Peoria 9190 W Bell Rd AcuraArrowhead Honda 8380 W Bell Rd HondaArrowhead Lexus 9238 W Bell Rd LexusBiddulph Mazda 8424 W Bell Rd MazdaInfiniti of Peoria 9167 W Bell Rd InfinitiLarry Miller Dodge 8665 W Bell Rd DodgeLarry Miller Hyundai 8633 W Bell Rd HyundaiLarry Miller Toyota 8425 W Bell Rd Toyota / ScionLiberty Buick 8737 W Bell Rd BuickMoore Chrysler/Jeep 8600 W Bell Rd Chrysler / JeepPower Chevrolet Arrowhead 9055 W Bell Rd ChevroletPeoria Kia 17431 N 91st Ave KiaPeoria Nissan 9151 W Bell Rd NissanPeoria Pontiac/GMC 8860 W Bell Rd Pontiac / GMCSaturn of Arrowhead 8801 W Bell Rd SaturnSunset Ford 9130 W Bell Rd Ford
Peoria
Dealer Address MakeGlendale Pontiac/GMC 4150 W Glendale Ave Pontiac / GMCMark Mitsubishi 4434 W Glendale Ave MitsubishiPerformance Chrysler/Jeep/Dodge 4240 W Glendale Ave Chrysler / Jeep / DodgeSanderson Ford 6400 N 51st Ave FordSanderson Lincoln/Mercury West 5101 W Maryland Ave Lincoln / MercurySands Chevrolet 5418 NW Grand Ave ChevroletWest Valley Nissan 4850 W Glendale Ave Nissan
Glendale

Scottsdale Automotive Dealership Market Analysis—April 2008 24
Dealer Address MakeAvondale Chrysler/Jeep 10055 W Papgo Fwy (Avondale) Chrysler / JeepAvondale Dodge 10101 W Papago Fwy (Avondale) DodgeAvondale Mitsubishi 10555 W Papago Fwy (Avondale) MitsubishiAvondale Nissan 10305 W Papago Fwy (Avondale) NissanAvondale Subaru 10601 W Papago Fwy (Avondale) SubaruAvondale Suzuki 803 E Van Buren (Avondale) SuzukiAvondale Toyota 10005 W Papago Fwy (Avondale) Toyota / ScionGateway Chevrolet 9901 W Papago Fwy (Avondale) ChevroletDan Grubb Ford 7501 W McDowell Rd (Phoenix) FordEarnhardt Honda 10151 W Papago Fwy (Avondale) HondaLarry Miller Mazda 10675 W Papago Fwy (Avondale) MazdaLarry Miller Volkswagen 10205 W Papgo Fwy (Avondale) VolkswagenPioneer Ford 13680 W Test Drive (Goodyear) FordSaturn of Avondale 10685 W Papago Fwy (Avondale) SaturnTom Jones Ford 23454 W Hwy 85 (Buckeye) FordYates Pontiac/GMC 13845 W Test Dr (Goodyear) Pontiac / GMC
West ValleyTable 7 (Continued)

Scottsdale Automotive Dealership Market Analysis—April 2008 25
So
uth
Sco
ttsd
ale
No
rth
Sco
ttsd
ale
(Sco
ttsd
ale
/M
cD
ow
ell)
(Fra
nk L
loy
d W
rig
ht/
Ha
yd
en
)A
cura
--
Acu
ra N
Sco
ttsda
le*
Pen
ske
Ast
on M
artin
Sco
ttsda
le A
ston
Mar
tinP
ensk
e-
-
Aud
i-
-A
udi N
Sco
ttsda
le*
Pen
ske
BM
WC
hapm
anB
axte
r Cha
pman
BM
W N
Sco
ttsda
le*
Pen
ske
Bui
ckP
ower
Aut
oNat
ion
Car
dina
le W
ayJo
seph
Car
dina
le
Cad
illac
Kac
hina
John
Lun
dLe
gend
sJo
hn L
und
Che
vrol
etB
ill H
eard
Bill
Hea
rdV
anLa
rry V
an T
uyl
Chr
ysle
rP
ower
Aut
oNat
ion
Airp
ark
Chr
ysle
r / J
eep
Coy
e P
orte
r
Dod
geC
hapm
anB
axte
r Cha
pman
Ed
Mos
esE
d M
oses
Ferra
ri / M
aser
ati
Ferra
ri/M
aser
ati S
cotts
dale
Pen
ske
Sco
ttsda
le L
otus
Eric
Ede
mho
lm
Ford
Five
Sta
rK
enne
th S
chol
zP
ower
Aut
oNat
ion
GM
CP
ower
Aut
oNat
ion
Car
dina
le W
ayJo
seph
Car
dina
le
Hon
da-
-R
ight
Dav
id W
ilson
Hum
mer
Sco
ttsda
le H
umm
erJo
hn L
und
Lege
nds
John
Lun
d
Hyu
ndai
Pow
erA
utoN
atio
nN
Sco
ttdal
e H
yund
aiA
lan
Hol
zehu
e
Infin
itiIn
finiti
of S
cotts
dale
Ken
Sch
atzb
erg
Pin
nacl
eLa
rry V
an T
uyl
Isuz
uP
ower
Aut
oNat
ion
--
Jagu
arS
cotts
dale
Jag
uar
Uni
ted
Aut
o G
roup
Jagu
ar N
Sco
ttsda
le*
Pen
ke
Jeep
Pow
erA
utoN
atio
nA
irpar
k C
hrys
ler /
Jee
pC
oye
Por
ter
Kia
Mar
k K
iaM
ark
Deb
owy
--
Lam
borg
hini
--
Mot
orsp
orts
of S
cotts
dale
Java
d M
agha
mi
Land
Rov
erLa
nd R
over
of S
cotts
dale
Pen
ske
Land
Rov
er N
Sco
ttsda
le*
Pen
ske
Lexu
sS
cotts
dale
Lex
usP
ensk
e-
-
Maz
da-
--
-
Mer
cede
s B
enz
--
Mot
orsp
orts
of S
cotts
dale
/Sch
umac
her
Euro
pean
*Ja
vad
Mag
ham
i/ Sc
hum
ache
r Eu
rope
an
Table
8S
cott
sdale
Auto
Deale
rship
Ow
ners
hip
Patt
ern
sSta
tus
of
South
& N
ort
h A
uto
Deale
rs:
2008
Ma
ke
Ow
ne
rsh
ipO
wn
ers
hip

Scottsdale Automotive Dealership Market Analysis—April 2008 26
Sout
h Sc
otts
dale
Nort
h S
cotts
dale
(Sco
ttsda
le/M
cDow
ell)
(Fra
nk L
loyd
Wrig
ht/H
ayde
n)M
itsub
ishi
Mar
k M
itsub
ishi
Mar
k D
ebow
y-
-
Nis
san
--
Pin
nacl
eLa
rry V
an T
uyl
Pon
tiac
Pow
erA
utoN
atio
nC
ardi
nale
Way
Jose
ph C
ardi
nale
Por
che
--
Mot
orsp
orts
of S
cotts
dale
/Por
sche
N
Scot
tsda
le*
Pen
ske
Rol
ls R
oyce
/Ben
tley
Land
Rov
er o
f Sco
ttsda
leP
ensk
eM
otor
spor
ts o
f Sco
ttsda
leJa
vad
Mag
ham
i
Saa
bK
achi
naJo
hn L
und
Lege
nds
John
Lun
d
Sat
urn
--
Sat
urn
of S
cotts
dale
Sco
tts P
rope
rty
Sub
aru
Pow
erA
utoN
atio
n-
-
Toyo
ta-
-R
ight
Dav
id W
ilson
Vol
kswa
gen
Cha
pman
Bax
ter C
hapm
anV
olks
wag
en N
Sco
ttsda
le*
Pen
ske
Vol
voP
owel
lS
tan
Pow
ell
--
*Loc
ated
in P
hoe
nix
Ow
ners
hip
Ow
ners
hip
Mak
e
Sco
ttsd
ale
Auto
Deale
rship
Ow
ners
hip
Patt
ern
sSta
tus
of S
outh
& N
orth
Aut
o D
eale
rs:
2008
Table
8 (
Conti
nued)

Scottsdale Automotive Dealership Market Analysis—April 2008 27
VI. TRANSPORTATION FACTORS
Table 9 shows average daily traffic counts, and 2020 estimated traffic counts for the North Scottsdale Auto Corridor and the South Scottsdale Motor Mile.
Traffic Counts
Map 5 (p. 28) depicts the metro Phoenix regional freeway system.
Segment 2000 2002 2004 2006 2030*Frank Lloyd Wright Blvd between Scottsdale Rd & Greenway-Hayden Loop 46,000 53,400 36,800 39,100 39,800
Frank Lloyd Wright Blvd between Greenway-Hayden Loop & Loop 101 47,100 51,300 47,250 49,900 49,200
Scottsdale Rd between Greenway-Hayden Loop & Frank Lloyd Wright 47,900 40,200 41,800 42,100 43,000
Greenway/Hayden Loop between Scottsdale Rd & Frank Lloyd Wright Blvd n/a n/a n/a n/a 11,450
Pima Freeway between Scottsdale Rd & Frank Lloyd Wright Blvd n/a n/a n/a 128,000 216,400
Segment 2000 2002 2004 2006 2030*
McDowell Rd between 64th St & Miller Rd 40,100 32,600 35,800 35,900 41,050
Scottsdale Rd between Roosevelt & Oak 46,100 43,350 40,900 42,700 48,650
*= projection
Sou rce: City of Scottsdale Transportation Department; ADOT
North Scottsdale Auto Mall
South Scottsdale Auto Mall
Table 9Traffic Counts / Projections

Scottsdale Automotive Dealership Market Analysis—April 2008 28
Map
5
Metr
o A
rea F
reew
ay S
yst
em

Scottsdale Automotive Dealership Market Analysis—April 2008 29
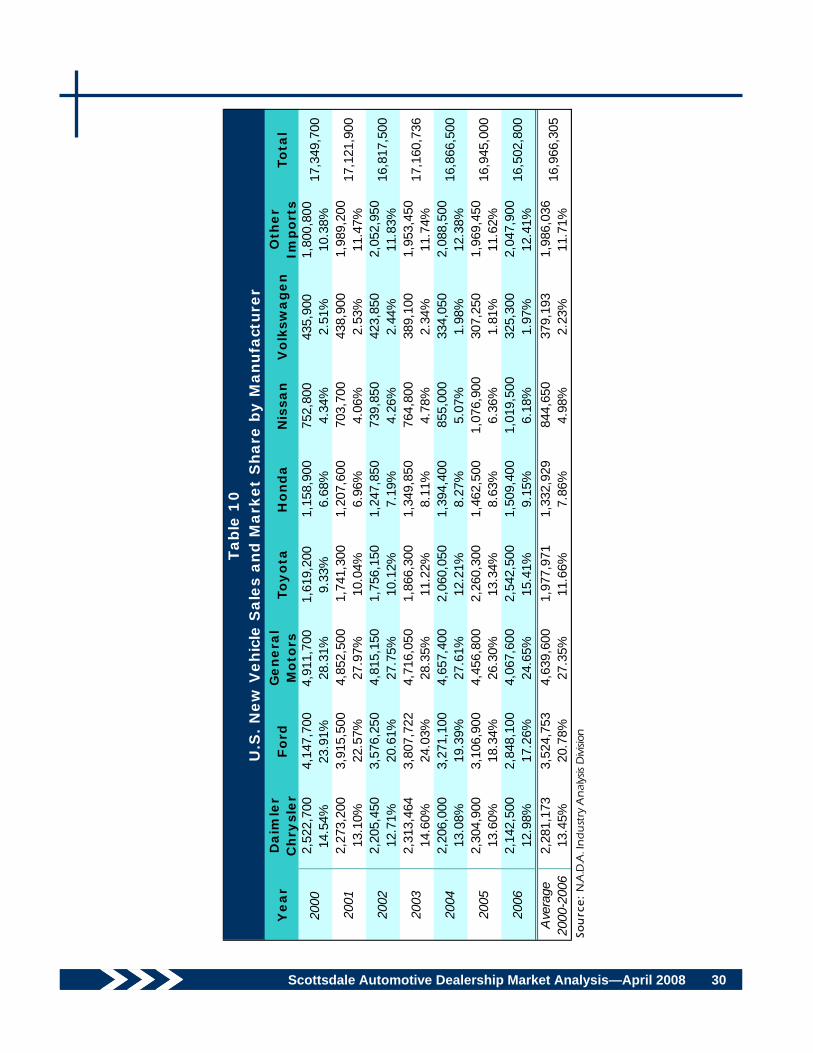
VII. VEHICLE SALES & REGISTRATION
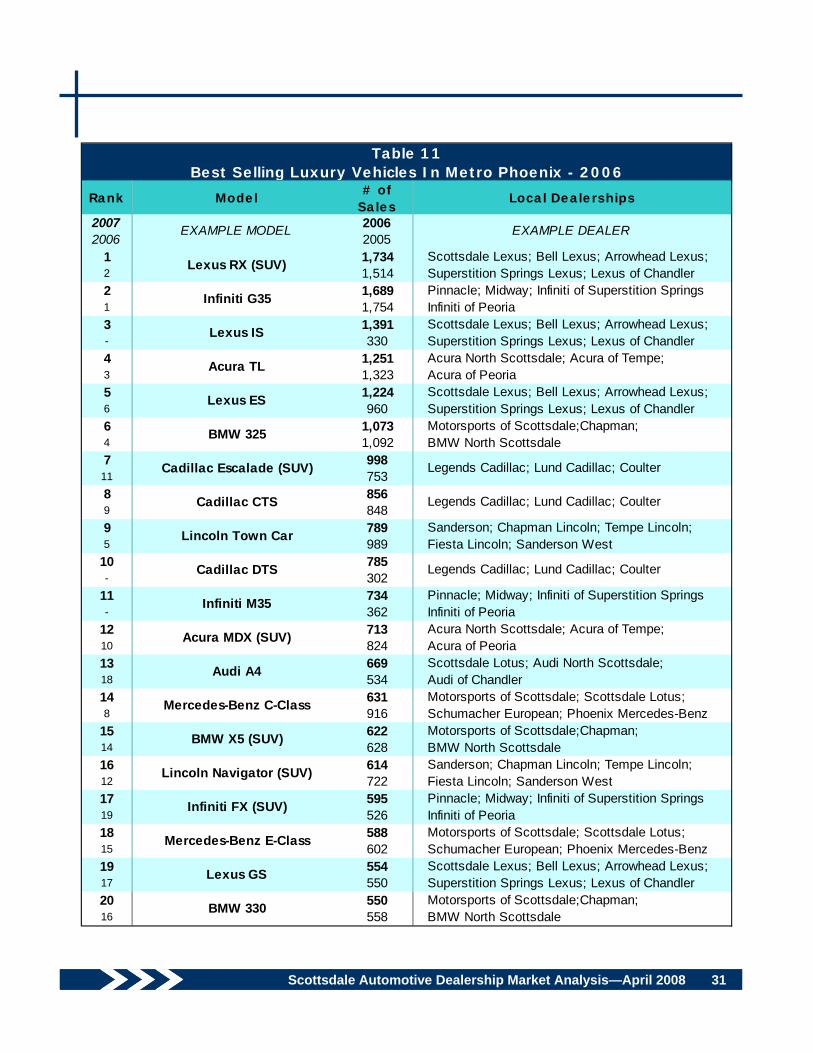
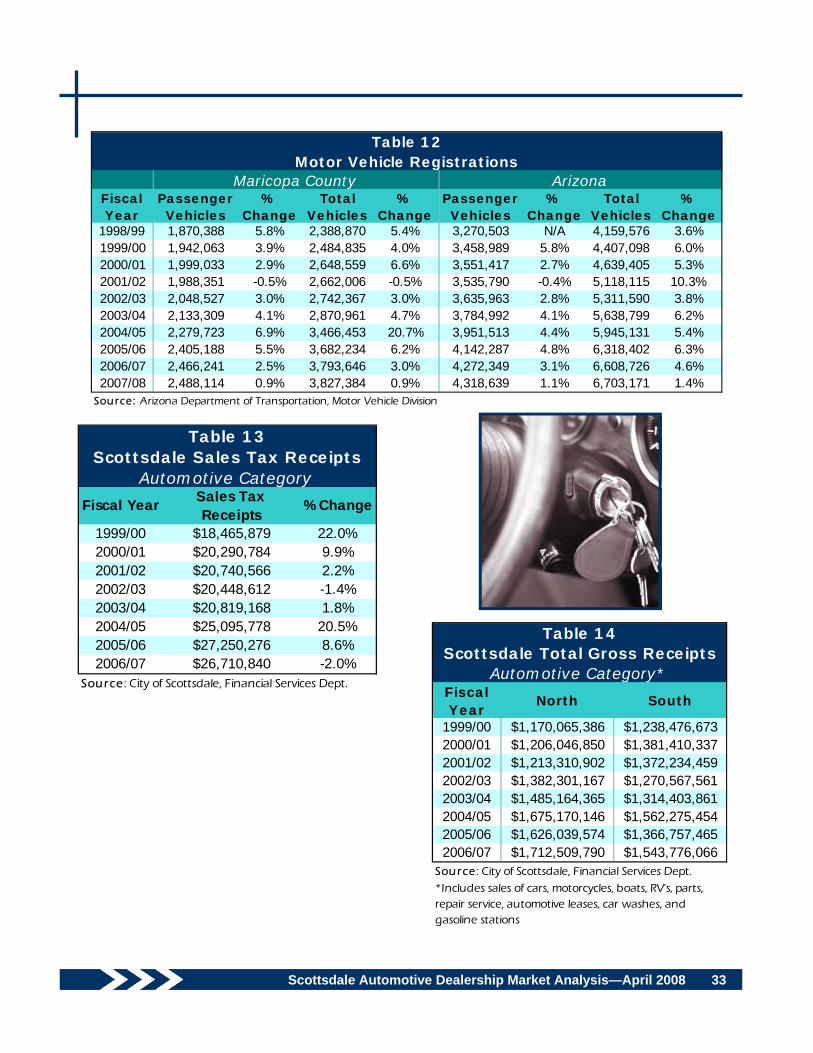
The following section examines sales and registration statistics on national, state and local levels. Although the new car industry was in a slump in the early 1990’s, recent years have shown significant sales growth. Table 10 (p. 30) lists the number of car sales in the US from 2000-2006 by make. Table 11 (p. 31) shows the best selling luxury vehicles in 2006 in Maricopa County. Table 12 (p. 33) gives an overview of motor vehicle registrations in Maricopa County from 1998/99 through 2007/08, showing a 33 percent increase in passenger vehicles over a 10-year period. Metro Phoenix accounted for 58 percent of all passenger vehicle registrations and 57 percent of total vehicle registrations in Arizona in Fiscal Year 2007/08.
Table 13 (p. 33) gives sales tax receipts in the “automotive” category for the City of Scottsdale. Total receipts have grown by 44.6 percent in the past 10 years. Even when this is discounted for inflation, the growth is still quite dramatic. Table 14 (p. 33) gives the total gross receipts in the “automotive” category for the City of Scottsdale. Scottsdale is becoming an increasingly important player in the new car sales arena, partly because of its strategic location within the Valley and partly because of the excellent demographics of its residents.
Scottsdale Automotive Dealership Market Analysis—April 2008 30
Ye
ar
Da
imle
r C
hry
sle
rF
ord
Ge
ne
ral
Mo
tors
To
yo
taH
on
da
Nis
sa
nV
olk
sw
ag
en
Oth
er
Imp
ort
sTo
tal
2,52
2,70
04,
147,
700
4,91
1,70
01,
619,
200
1,15
8,90
075
2,80
043
5,90
01,
800,
800
14.5
4%23
.91%
28.3
1%9.
33%
6.68
%4.
34%
2.51
%10
.38%
2,27
3,20
03,
915,
500
4,85
2,50
01,
741,
300
1,20
7,60
070
3,70
043
8,90
01,
989,
200
13.1
0%22
.57%
27.9
7%10
.04%
6.96
%4.
06%
2.53
%11
.47%
2,20
5,45
03,
576,
250
4,81
5,15
01,
756,
150
1,24
7,85
073
9,85
042
3,85
02,
052,
950
12.7
1%20
.61%
27.7
5%10
.12%
7.19
%4.
26%
2.44
%11
.83%
2,31
3,46
43,
807,
722
4,71
6,05
01,
866,
300
1,34
9,85
076
4,80
038
9,10
01,
953,
450
14.6
0%24
.03%
28.3
5%11
.22%
8.11
%4.
78%
2.34
%11
.74%
2,20
6,00
03,
271,
100
4,65
7,40
02,
060,
050
1,39
4,40
085
5,00
033
4,05
02,
088,
500
13.0
8%19
.39%
27.6
1%12
.21%
8.27
%5.
07%
1.98
%12
.38%
2,30
4,90
03,
106,
900
4,45
6,80
02,
260,
300
1,46
2,50
01,
076,
900
307,
250
1,96
9,45
013
.60%
18.3
4%26
.30%
13.3
4%8.
63%
6.36
%1.
81%
11.6
2%2,
142,
500
2,84
8,10
04,
067,
600
2,54
2,50
01,
509,
400
1,01
9,50
032
5,30
02,
047,
900
12.9
8%17
.26%
24.6
5%15
.41%
9.15
%6.
18%
1.97
%12
.41%
2,28
1,17
33,
524,
753
4,63
9,60
01,
977,
971
1,33
2,92
984
4,65
037
9,19
31,
986,
036
13.4
5%20
.78%
27.3
5%11
.66%
7.86
%4.
98%
2.23
%11
.71%
Sou
rce
: N
.A.D
.A. I
nd
ust
ry A
nal
ysis
Div
ision
17,1
60,7
36
16,8
66,5
00
16,9
45,0
00
Table
10
U.S
. N
ew
Vehic
le S
ale
s and M
ark
et
Share
by M
anufa
cture
r
17,1
21,9
00
2000
17,3
49,7
00
16,5
02,8
00
16,9
66,3
05A
vera
ge
2000
-200
6
2001
2002
2003
2004
2005
2006
16,8
17,5
00
Scottsdale Automotive Dealership Market Analysis—April 2008 31
Rank Model# of
SalesLocal Dealerships
2007 20062006 2005
1 1,734 Scottsdale Lexus; Bell Lexus; Arrowhead Lexus;2 1,514 Superstition Springs Lexus; Lexus of Chandler2 1,689 Pinnacle; Midway; Infiniti of Superstition Springs1 1,754 Infiniti of Peoria3 1,391 Scottsdale Lexus; Bell Lexus; Arrowhead Lexus;- 330 Superstition Springs Lexus; Lexus of Chandler4 1,251 Acura North Scottsdale; Acura of Tempe;3 1,323 Acura of Peoria5 1,224 Scottsdale Lexus; Bell Lexus; Arrowhead Lexus;6 960 Superstition Springs Lexus; Lexus of Chandler6 1,073 Motorsports of Scottsdale;Chapman;4 1,092 BMW North Scottsdale7 99811 7538 8569 8489 789 Sanderson; Chapman Lincoln; Tempe Lincoln;5 989 Fiesta Lincoln; Sanderson West
10 785- 302
11 734 Pinnacle; Midway; Infiniti of Superstition Springs- 362 Infiniti of Peoria
12 713 Acura North Scottsdale; Acura of Tempe;10 824 Acura of Peoria13 669 Scottsdale Lotus; Audi North Scottsdale;18 534 Audi of Chandler14 631 Motorsports of Scottsdale; Scottsdale Lotus;8 916 Schumacher European; Phoenix Mercedes-Benz
15 622 Motorsports of Scottsdale;Chapman;14 628 BMW North Scottsdale16 614 Sanderson; Chapman Lincoln; Tempe Lincoln;12 722 Fiesta Lincoln; Sanderson West17 595 Pinnacle; Midway; Infiniti of Superstition Springs19 526 Infiniti of Peoria18 588 Motorsports of Scottsdale; Scottsdale Lotus;15 602 Schumacher European; Phoenix Mercedes-Benz19 554 Scottsdale Lexus; Bell Lexus; Arrowhead Lexus;17 550 Superstition Springs Lexus; Lexus of Chandler20 550 Motorsports of Scottsdale;Chapman;16 558 BMW North Scottsdale
Table 11Best Selling Luxury Vehicles In Metro Phoenix - 2006
EXAMPLE MODEL EXAMPLE DEALER
Lexus RX (SUV)
Infiniti G35
Lexus IS
Acura TL
Lexus ES
BMW 325
Cadillac Escalade (SUV)
Cadillac CTS
Lincoln Town Car
Cadillac DTS
Infiniti M35
Acura MDX (SUV)
Lexus GS
Audi A4
Mercedes-Benz C-Class
BMW X5 (SUV)
Lincoln Navigator (SUV)
Legends Cadillac; Lund Cadillac; Coulter
Legends Cadillac; Lund Cadillac; Coulter
Legends Cadillac; Lund Cadillac; Coulter
BMW 330
Infiniti FX (SUV)
Mercedes-Benz E-Class

Scottsdale Automotive Dealership Market Analysis—April 2008 32
2007 Rank
Model# of
SalesLocal Dealerships
2006 20062005 200521 539 Acura North Scottsdale; Acura of Tempe;20 482 Acura of Peoria22 49113 67423 486 Scottsdale Lexus; Bell Lexus; Arrowhead Lexus;21 475 Superstition Springs Lexus; Lexus of Chandler24 464 Motorsports of Scottsdale; Scottsdale Lotus;- 237 Schumacher European; Phoenix Mercedes-Benz
25 458 Motorsports of Scottsdale; Scottsdale Lotus;25 420 Schumacher European; Phoenix Mercedes-Benz
Powell Volvo
Best Selling Luxury Vehicles In Metro Phoenix - 2006
EXAMPLE EXAMPLE
Mercedes-Benz M-Class
Sou rce: Phoenix Business Journal, Book of Lists 2008
Acura TSX
Volvo XC90 (SUV)
Lexus GX470 (SUV)
Mercedes-Benz S-Class
Table 11 (Continued)
Scottsdale Automotive Dealership Market Analysis—April 2008 33
Fiscal Year
Passenger Vehicles
% Change
Total Vehicles
% Change
Passenger Vehicles
% Change
Total Vehicles
% Change
1998/99 1,870,388 5.8% 2,388,870 5.4% 3,270,503 N/A 4,159,576 3.6%1999/00 1,942,063 3.9% 2,484,835 4.0% 3,458,989 5.8% 4,407,098 6.0%2000/01 1,999,033 2.9% 2,648,559 6.6% 3,551,417 2.7% 4,639,405 5.3%2001/02 1,988,351 -0.5% 2,662,006 -0.5% 3,535,790 -0.4% 5,118,115 10.3%2002/03 2,048,527 3.0% 2,742,367 3.0% 3,635,963 2.8% 5,311,590 3.8%2003/04 2,133,309 4.1% 2,870,961 4.7% 3,784,992 4.1% 5,638,799 6.2%2004/05 2,279,723 6.9% 3,466,453 20.7% 3,951,513 4.4% 5,945,131 5.4%2005/06 2,405,188 5.5% 3,682,234 6.2% 4,142,287 4.8% 6,318,402 6.3%2006/07 2,466,241 2.5% 3,793,646 3.0% 4,272,349 3.1% 6,608,726 4.6%2007/08 2,488,114 0.9% 3,827,384 0.9% 4,318,639 1.1% 6,703,171 1.4%
Sou rce: Arizona Department of Transportation, Motor Vehicle Division
Maricopa County Arizona
Table 12Motor Vehicle Registrations
Fiscal Year
North South
1999/00 $1,170,065,386 $1,238,476,6732000/01 $1,206,046,850 $1,381,410,3372001/02 $1,213,310,902 $1,372,234,4592002/03 $1,382,301,167 $1,270,567,5612003/04 $1,485,164,365 $1,314,403,8612004/05 $1,675,170,146 $1,562,275,4542005/06 $1,626,039,574 $1,366,757,4652006/07 $1,712,509,790 $1,543,776,066
Table 14Scottsdale Total Gross Receipts
Automotive Category*
Sou rce: City of Scottsdale, Financial Services Dept.
*Includes sales of cars, motorcycles, boats, RV's, parts, repair service, automotive leases, car washes, and gasoline stations
Fiscal Year Sales Tax Receipts
% Change
1999/00 $18,465,879 22.0%2000/01 $20,290,784 9.9%2001/02 $20,740,566 2.2%2002/03 $20,448,612 -1.4%2003/04 $20,819,168 1.8%2004/05 $25,095,778 20.5%2005/06 $27,250,276 8.6%2006/07 $26,710,840 -2.0%
Table 13Scottsdale Sales Tax Receipts
Automotive Category
Sou rce: City of Scottsdale, Financial Services Dept.
Scottsdale Automotive Dealership Market Analysis—April 2008 34
VIII. APPENDIX
This section contains demographic analysis of the North Scottsdale and South Scottsdale market areas. The North Scottsdale Auto Market Area (p. 35) comprises a 10-mile radius around the intersection of Frank Lloyd Wright Boulevard and Greenway-Hayden Loop. The South Scottsdale Auto Market Area (p. 38) consists of a 10-mile radius surrounding the McDowell Road / Scottsdale Road intersection. The data is derived from a SitesUSA data report based on the 2000 U.S. Census.

Scottsdale Automotive Dealership Market Analysis—April 2008 35
10 mile radius
2007 Estimated Population 524,715 2012 Projected Population 585,137 2000 Census Population 448,599 1990 Census Population 298,742 Historical Annual Growth 1990 to 2007 4.4% Projected Annual Growth 2007 to 2012 2.3%
2007 Est. Households 213,490 2012 Proj. Households 236,606 2000 Census Households 184,542 1990 Census Households 120,837 Historical Annual Growth 1990 to 2007 4.5% Projected Annual Growth 2007 to 2012 2.2%
2007 Est. Population 0 to 9 Years 13.2% 2007 Est. Population 10 to 19 Years 12.6% 2007 Est. Population 20 to 29 Years 11.1% 2007 Est. Population 30 to 44 Years 23.1% 2007 Est. Population 45 to 59 Years 22.6% 2007 Est. Population 60 to 74 Years 12.0% 2007 Est. Population 75 Years Plus 5.3% 2007 Est. Median Age 38.2
2007 Est. Male Population 49.3% 2007 Est. Female Population 50.7%
2007 Est. Never Married 22.9% 2007 Est. Now Married 57.1% 2007 Est. Separated or Divorced 14.7% 2007 Est. Widowed 5.2%
2007 Est. HH Income $200,000 or More 11.3% 2007 Est. HH Income $150,000 to 199,999 7.3% 2007 Est. HH Income $100,000 to 149,999 16.5% 2007 Est. HH Income $75,000 to 99,999 13.8% 2007 Est. HH Income $50,000 to 74,999 18.2% 2007 Est. HH Income $35,000 to 49,999 12.4% 2007 Est. HH Income $25,000 to 34,999 7.8% 2007 Est. HH Income $15,000 to 24,999 6.6% 2007 Est. HH Income $0 to 14,999 6.1% 2007 Est. Average Household Income $ 96,894 2007 Est. Median HH Income $ 84,348 2007 Est. Per Capita Income $ 39,754
2007 Est. Number of Businesses 19,981 2007 Est. Total Number of Employees 257,388
POPU
LATI
ON
North Scottsdale Auto Market Area
INC
OM
EH
OU
SEH
OLD
SA
GE
MA
RIT
AL
STA
TUS
&
SEX
APPENDIX A:

Scottsdale Automotive Dealership Market Analysis—April 2008 36
10 mile radius
2007 Est. White Population 89.5% 2007 Est. Black Population 1.7% 2007 Est. Asian & Pacific Islander 2.9% 2007 Est. American Indian & Alaska Native 1.0% 2007 Est. Other Races Population 4.9%
2007 Est. Hispanic Population 78,434 2007 Est. Hispanic Population Percent 14.9% 2012 Proj. Hispanic Population Percent 18.3% 2000 Hispanic Population Percent 8.5%
2007 Est. Adult Population (25 Years or Older) 363,118 2007 Est. Elementary (0 to 8) 2.6% 2007 Est. Some High School (9 to 11) 4.4% 2007 Est. High School Graduate (12) 18.9% 2007 Est. Some College (13 to 16) 22.9% 2007 Est. Associate Degree Only 8.9% 2007 Est. Bachelor Degree Only 27.1% 2007 Est. Graduate Degree 15.2%
2007 Est. Total Housing Units 236,901 2007 Est. Owner Occupied Percent 64.8% 2007 Est. Renter Occupied Percent 25.3% 2007 Est. Vacant Housing Percent 9.9%
2000 Homes Built 1999 to 2000 5.1% 2000 Homes Built 1995 to 1998 18.2% 2000 Homes Built 1990 to 1994 12.9% 2000 Homes Built 1980 to 1989 29.8% 2000 Homes Built 1970 to 1979 22.7% 2000 Homes Built 1960 to 1969 7.8% 2000 Homes Built 1950 to 1959 2.8% 2000 Homes Built Before 1949 0.7%
2000 Home Value $1,000,000 or More 2.3% 2000 Home Value $500,000 to $999,999 7.4% 2000 Home Value $400,000 to $499,999 5.4% 2000 Home Value $300,000 to $399,999 10.5% 2000 Home Value $200,000 to $299,999 22.5% 2000 Home Value $150,000 to $199,999 21.0% 2000 Home Value $100,000 to $149,999 21.4% 2000 Home Value $50,000 to $99,999 9.0% 2000 Home Value $25,000 to $49,999 0.4% 2000 Home Value $0 to $24,999 0.1% 2000 Median Home Value $ 241,992 2000 Median Rent $ 758
HIS
PAN
ICH
OM
E VA
LUES
HO
MES
BU
ILT
BY
YEA
RH
OU
SIN
GED
UC
ATI
ON
(Adu
lts 2
5 or
Old
er)
RA
CE
North Scottsdale Auto Market Area (cont.)

Scottsdale Automotive Dealership Market Analysis—April 2008 37
10 mile radius
2007 Est. Labor: Population Age 16+ 413,226 2007 Est. Civilian Employed 67.4% 2007 Est. Civilian Unemployed 2.7% 2007 Est. in Armed Forces 0.0% 2007 Est. not in Labor Force 29.9% 2007 Labor Force: Males 48.9% 2007 Labor Force: Females 51.1%
2000 Occupation: Population Age 16+ 236,030 2000 Mgmt, Business, & Financial Operations 22.0% 2000 Professional and Related 23.0% 2000 Service 11.6% 2000 Sales and Office 31.4% 2000 Farming, Fishing, and Forestry 0.1% 2000 Construction, Extraction, & Maintenance 6.2% 2000 Production, Transport, & Material Moving 5.6% 2000 Percent White Collar Workers 76.4% 2000 Percent Blue Collar Workers 23.6%
2000 Drive to Work Alone 80.2% 2000 Drive to Work in Carpool 9.6% 2000 Travel to Work by Public Transportation 1.1% 2000 Drive to Work on Motorcycle 0.3% 2000 Walk or Bicycle to Work 1.8% 2000 Other Means 0.8% 2000 Work at Home 6.2%
2000 Travel to Work in 14 Minutes or Less 22.5% 2000 Travel to Work in 15 to 29 Minutes 37.9% 2000 Travel to Work in 30 to 59 Minutes 35.3% 2000 Travel to Work in 60 Minutes or More 4.3% 2000 Average Travel Time to Work 23.9
2007 Est. Total Household Expenditure (in Millions) $ 14,571.5 2007 Est. Apparel $ 704.4 2007 Est. Contributions & Gifts $ 1,063.5 2007 Est. Education & Reading $ 449.3 2007 Est. Entertainment $ 825.1 2007 Est. Food, Beverages & Tobacco $ 2,229.7 2007 Est. Furnishings And Equipment $ 665.2 2007 Est. Health Care & Insurance $ 1,003.0 2007 Est. Household Operations & Shelter & Utilities $ 4,366.5 2007 Est. Miscellaneous Expenses $ 234.6 2007 Est. Personal Care $ 208.4 2007 Est. Transportation $ 2,821.8
North Scottsdale Auto Market Area (cont.)
CO
NSU
MER
EXP
END
ITU
RE
TRA
NSP
OR
TATI
ON
TO
WO
RK
TRA
VEL
TIM
EO
CC
UPA
TIO
NLA
BO
R F
OR
CE

Scottsdale Automotive Dealership Market Analysis—April 2008 38
10 mile radius
2007 Estimated Population 1,094,107 2012 Projected Population 1,185,301 2000 Census Population 981,815 1990 Census Population 839,844 Historical Annual Growth 1990 to 2007 1.8% Projected Annual Growth 2007 to 2012 1.7%
2007 Est. Households 417,962 2012 Proj. Households 450,283 2000 Census Households 378,920 1990 Census Households 329,835 Historical Annual Growth 1990 to 2007 1.6% Projected Annual Growth 2007 to 2012 1.5%
2007 Est. Population 0 to 9 Years 14.7% 2007 Est. Population 10 to 19 Years 14.1% 2007 Est. Population 20 to 29 Years 16.7% 2007 Est. Population 30 to 44 Years 21.8% 2007 Est. Population 45 to 59 Years 18.2% 2007 Est. Population 60 to 74 Years 9.5% 2007 Est. Population 75 Years Plus 5.0% 2007 Est. Median Age 33.0
2007 Est. Male Population 51.0% 2007 Est. Female Population 49.0%
2007 Est. Never Married 33.5% 2007 Est. Now Married 43.5% 2007 Est. Separated or Divorced 17.7% 2007 Est. Widowed 5.2%
2007 Est. HH Income $200,000 or More 5.1% 2007 Est. HH Income $150,000 to 199,999 3.7% 2007 Est. HH Income $100,000 to 149,999 10.7% 2007 Est. HH Income $75,000 to 99,999 11.7% 2007 Est. HH Income $50,000 to 74,999 19.5% 2007 Est. HH Income $35,000 to 49,999 15.8% 2007 Est. HH Income $25,000 to 34,999 11.2% 2007 Est. HH Income $15,000 to 24,999 10.7% 2007 Est. HH Income $0 to 14,999 11.7% 2007 Est. Average Household Income $ 66,129 2007 Est. Median HH Income $ 58,524 2007 Est. Per Capita Income $ 26,007
2007 Est. Number of Businesses 49,978 2007 Est. Total Number of Employees 769,648
POPU
LATI
ON
Southern Scottsdale Auto Market Area
INC
OM
EH
OU
SEH
OLD
SA
GE
MA
RIT
AL
STA
TUS
&
SEX
APPENDIX B:

Scottsdale Automotive Dealership Market Analysis—April 2008 39
10 mile radius
2007 Est. White Population 75.9% 2007 Est. Black Population 4.8% 2007 Est. Asian & Pacific Islander 3.1% 2007 Est. American Indian & Alaska Native 2.7% 2007 Est. Other Races Population 13.5%
2007 Est. Hispanic Population 363,953 2007 Est. Hispanic Population Percent 33.3% 2012 Proj. Hispanic Population Percent 36.0% 2000 Hispanic Population Percent 27.1%
2007 Est. Adult Population (25 Years or Older) 686,356 2007 Est. Elementary (0 to 8) 7.7% 2007 Est. Some High School (9 to 11) 8.0% 2007 Est. High School Graduate (12) 21.9% 2007 Est. Some College (13 to 16) 22.3% 2007 Est. Associate Degree Only 8.4% 2007 Est. Bachelor Degree Only 19.8% 2007 Est. Graduate Degree 12.0%
2007 Est. Total Housing Units 460,753 2007 Est. Owner Occupied Percent 49.2% 2007 Est. Renter Occupied Percent 41.6% 2007 Est. Vacant Housing Percent 9.3%
2000 Homes Built 1999 to 2000 2.3% 2000 Homes Built 1995 to 1998 5.7% 2000 Homes Built 1990 to 1994 6.4% 2000 Homes Built 1980 to 1989 25.6% 2000 Homes Built 1970 to 1979 27.4% 2000 Homes Built 1960 to 1969 14.9% 2000 Homes Built 1950 to 1959 11.5% 2000 Homes Built Before 1949 6.3%
2000 Home Value $1,000,000 or More 1.2% 2000 Home Value $500,000 to $999,999 3.7% 2000 Home Value $400,000 to $499,999 2.5% 2000 Home Value $300,000 to $399,999 4.6% 2000 Home Value $200,000 to $299,999 11.5% 2000 Home Value $150,000 to $199,999 15.7% 2000 Home Value $100,000 to $149,999 33.3% 2000 Home Value $50,000 to $99,999 25.0% 2000 Home Value $25,000 to $49,999 2.1% 2000 Home Value $0 to $24,999 0.5% 2000 Median Home Value $ 171,428 2000 Median Rent $ 590
HIS
PAN
ICH
OM
E VA
LUES
HO
MES
BU
ILT
BY
YEA
R
Southern Scottsdale Auto Market Area (cont.)
HO
USI
NG
EDU
CA
TIO
N
(A
dults
25
or O
lder
)R
AC
E
Scottsdale Automotive Dealership Market Analysis—April 2008 40
10 mile radius
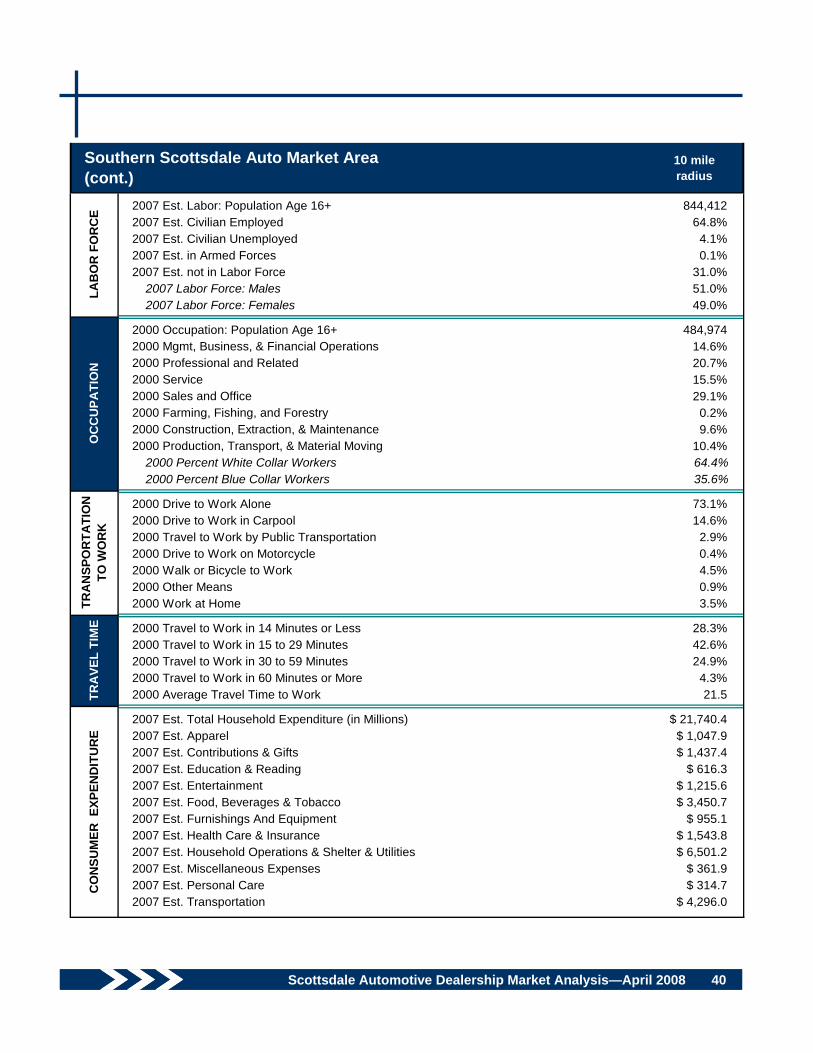
2007 Est. Labor: Population Age 16+ 844,412 2007 Est. Civilian Employed 64.8% 2007 Est. Civilian Unemployed 4.1% 2007 Est. in Armed Forces 0.1% 2007 Est. not in Labor Force 31.0% 2007 Labor Force: Males 51.0% 2007 Labor Force: Females 49.0%
2000 Occupation: Population Age 16+ 484,974 2000 Mgmt, Business, & Financial Operations 14.6% 2000 Professional and Related 20.7% 2000 Service 15.5% 2000 Sales and Office 29.1% 2000 Farming, Fishing, and Forestry 0.2% 2000 Construction, Extraction, & Maintenance 9.6% 2000 Production, Transport, & Material Moving 10.4% 2000 Percent White Collar Workers 64.4% 2000 Percent Blue Collar Workers 35.6%
2000 Drive to Work Alone 73.1% 2000 Drive to Work in Carpool 14.6% 2000 Travel to Work by Public Transportation 2.9% 2000 Drive to Work on Motorcycle 0.4% 2000 Walk or Bicycle to Work 4.5% 2000 Other Means 0.9% 2000 Work at Home 3.5%
2000 Travel to Work in 14 Minutes or Less 28.3% 2000 Travel to Work in 15 to 29 Minutes 42.6% 2000 Travel to Work in 30 to 59 Minutes 24.9% 2000 Travel to Work in 60 Minutes or More 4.3% 2000 Average Travel Time to Work 21.5
2007 Est. Total Household Expenditure (in Millions) $ 21,740.4 2007 Est. Apparel $ 1,047.9 2007 Est. Contributions & Gifts $ 1,437.4 2007 Est. Education & Reading $ 616.3 2007 Est. Entertainment $ 1,215.6 2007 Est. Food, Beverages & Tobacco $ 3,450.7 2007 Est. Furnishings And Equipment $ 955.1 2007 Est. Health Care & Insurance $ 1,543.8 2007 Est. Household Operations & Shelter & Utilities $ 6,501.2 2007 Est. Miscellaneous Expenses $ 361.9 2007 Est. Personal Care $ 314.7 2007 Est. Transportation $ 4,296.0
Southern Scottsdale Auto Market Area (cont.)
CO
NSU
MER
EXP
END
ITU
RE
TRA
NSP
OR
TATI
ON
TO
WO
RK
TRA
VEL
TIM
EO
CC
UPA
TIO
NLA
BO
R F
OR
CE