Embed Size (px)
Citation preview
A mass-balance framework for quantifyingdownstream changes in fluvial architecture
NIKKI STRONG*, BEN SHEETS*, TOM HICKSON† and CHRIS PAOLA**Department of Geology and Geophysics and St Anthony Falls Laboratory, University of Minnesota,
Minneapolis, MN 55455, USA (Email: [email protected]); and†Department of Geology, University of St Thomas, St Paul, MN, USA
ABSTRACT
It is still commonly believed that channel stacking density in alluvial cross-sections is controlled mainly by local subsidence rate, despite new models thatemphasize the three-dimensionality of alluvial architecture. New data are pre-sented from an experimental alluvial basin that show variation in the spatialdistribution of deposition to be the main control on architecture, rather thansubsidence per se. A simple coordinate transformation is proposed that mapsdownstream distance into the fraction of the sediment supply deposited to thatpoint. Transforming measured sections into this ‘mass balance’ coordinate system removes much, although not all, of the observed variability in channelstacking density and grain size. Furthermore, removal of the dominant mass-balance effects via transformation to fraction deposited reveals more clearlythose residual architectural effects that are not mass-balance controlled: forexample, changes in channel size associated with fluctuations in water supply.
Spec. Publs int. Ass. Sediment. (2005), 35, 243–253
INTRODUCTION
Most workers think of physical stratigraphy asbeing controlled by three main allogenic drivers:climate, tectonics and eustasy. For analytical pur-poses, the first two of these must be distilled intospecific governing variables, of which the mainones are rate and size distribution of sedimentsupply, space–time distribution of crustal defor-mation, and space–time distribution of waterrunoff. It follows that alluvial architecture shouldbe controlled by these same variables.
One of the major effects of changes in any ofthese governing variables is to alter the distribu-tion of deposition (referred to here as the deposi-tional mass balance) within the fluvial system.Deposition preferentially extracts the coarser frac-tion of the sediment supply, so both the amountand the size distribution of sediment available tothe fluvial system at a given point are stronglycontrolled by upstream sediment extraction. Thus
a direct effect of changing the sediment mass bal-ance is to cause longitudinal (streamwise) migra-tion of facies belts in concert with changes in thedistribution of deposition. In general one wouldexpect the architecture at any point to reflect asuperposition of these direct mass-balance effectsand changes in other relevant variables, such aslocal sedimentation rate, avulsion frequency andpattern, and channel belt geometry. Note, how-ever, that although sedimentation rate and deposi-tional mass balance are related, they are not thesame: sedimentation is a local variable, but deposi-tional mass balance is meaningful only in the context of the whole fluvial system. The relation-ship between the two is made precise later in thepaper. At this point, little is known about the relative importance for alluvial architecture ofdirect mass-balance effects versus the other vari-ables listed above, although the latter have beenthe exclusive focus of architecture models to date (Allen, 1978, 1979; Bridge & Leeder, 1979;
FSC14 1/3/05 11:21 AM Page 243
Alexander & Leeder, 1987; Leeder & Gawthorpe,1987; Bridge & Mackey, 1993a,b; Mackey &Bridge, 1995). In this paper, an experimental casestudy is presented in which changes in the deposi-tional mass balance turn out to be the dominantcontrol on alluvial architecture.
BACKGROUND AND GOALS
Alluvial architecture was one of the first problemsin physical stratigraphy to be analysed quantitat-ively, thanks to the model proposed by Leeder(1978) and subsequently expanded upon by Allen(1978) and Bridge & Leeder (1979). These modelsand their many descendents will be referred to as the Leeder–Allen–Bridge (LAB) models. InLeeder’s original model, the main control onarchitecture was sedimentation rate, assumedequal to subsidence rate, relative to avulsion fre-quency. The main result of this early work wasthat low sedimentation rates cause randomlyavulsing channels to stack more densely upon oneanother, assuming constant avulsion frequency.The Leeder model led to a series of refinementsand extensions (Allen, 1978, 1979; Bridge &Leeder, 1979; Alexander & Leeder, 1987; Leeder & Gawthorpe, 1987; Bridge & Mackey, 1993a,b;Mackey & Bridge, 1995) as well as a variety of tests (Behrensmeyer & Tauxe, 1982; Kraus &Middleton, 1987; Leeder et al., 1996, Guiseppe &Heller, 1998; Aslan & Blum, 1999; Ashworth et al.,1999; Kraus, 2002).
Two major shortcomings of the original LABapproach have been addressed in recent years.First, one would expect avulsion frequency todepend strongly on sedimentation rate, as avul-sion is largely driven by sedimentation. This wasshown experimentally by Bryant et al. (1995),who also pointed out that, even at a qualitativelevel, the relation between architecture and sedi-mentation depends on the relationship betweenavulsion frequency and sedimentation rate. Heller& Paola (1996) went on to examine the conse-quences of this in more detail. The second majorshortcoming was that the original LAB modelswere two-dimensional, focusing on channel stack-ing in panels taken in the cross-stream direction,i.e. perpendicular to the mean flow direction(depositional strike). This was addressed by
Mackey & Bridge (1995) and Heller & Paola (1996), who extended the domain to the third,streamwise, dimension. Two points about theLAB model series are particularly important to thework we describe here:1 despite efforts to uproot it, the aspect of the LABmodels that persists in common stratigraphicalwisdom is that greater channel stacking density(i.e. a more sheet-like sandbody geometry) implieslower sedimentation (subsidence) rate and viceversa;2 despite considerable effort, even the most basicpredictions of the LAB models remain largelyuntested.
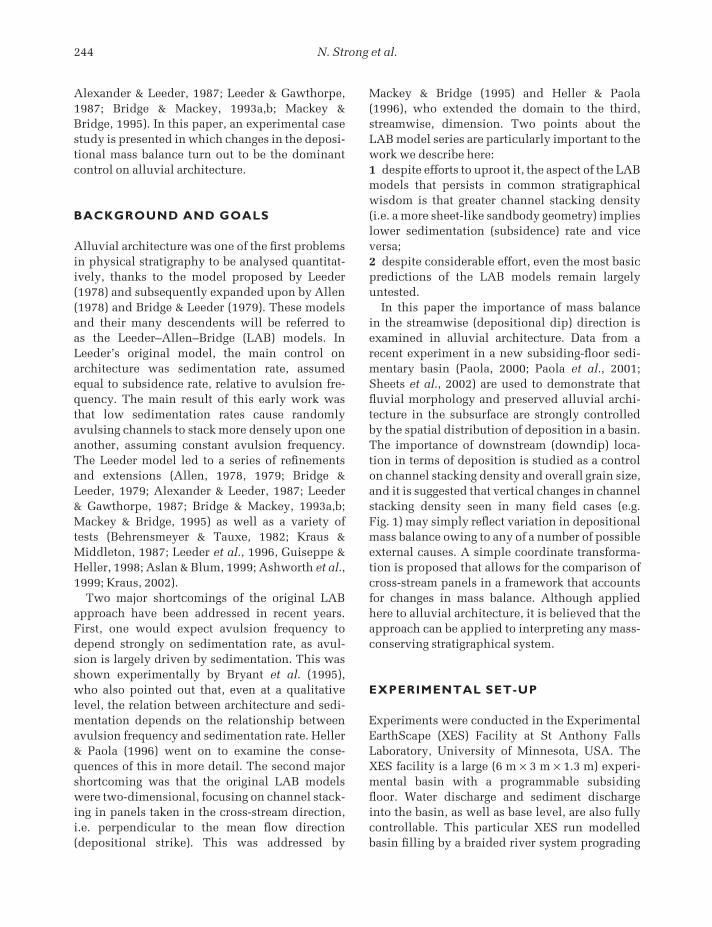
In this paper the importance of mass balance in the streamwise (depositional dip) direction isexamined in alluvial architecture. Data from arecent experiment in a new subsiding-floor sedi-mentary basin (Paola, 2000; Paola et al., 2001;Sheets et al., 2002) are used to demonstrate thatfluvial morphology and preserved alluvial archi-tecture in the subsurface are strongly controlledby the spatial distribution of deposition in a basin.The importance of downstream (downdip) loca-tion in terms of deposition is studied as a controlon channel stacking density and overall grain size,and it is suggested that vertical changes in channelstacking density seen in many field cases (e.g. Fig. 1) may simply reflect variation in depositionalmass balance owing to any of a number of possibleexternal causes. A simple coordinate transforma-tion is proposed that allows for the comparison ofcross-stream panels in a framework that accountsfor changes in mass balance. Although appliedhere to alluvial architecture, it is believed that theapproach can be applied to interpreting any mass-conserving stratigraphical system.
EXPERIMENTAL SET-UP
Experiments were conducted in the ExperimentalEarthScape (XES) Facility at St Anthony FallsLaboratory, University of Minnesota, USA. TheXES facility is a large (6 m × 3 m × 1.3 m) experi-mental basin with a programmable subsidingfloor. Water discharge and sediment dischargeinto the basin, as well as base level, are also fullycontrollable. This particular XES run modelledbasin filling by a braided river system prograding
244 N. Strong et al.
FSC14 1/3/05 11:21 AM Page 244
experimental proxies for fine and coarse-grainedsediment respectively, coal serving as the fine-grained proxy owing to its lower density (1.4 g cm−3) thus greater mobility relative to thequartz sand (2.65 g cm−3). The total volumetricsediment feed rate, i.e. integrated net deposition,was matched to the volumetric rate of accom-modation produced by subsidence throughout theexperiment. This choice was intended to mini-mize facies migration, but this was only partially
into a standing body of water—a braided fluvialfan delta as defined by Nemec & Steele (1984). The main focus of this run was to test the effects of changes in subsidence and water supply onalluvial architecture. Base level was thus heldconstant throughout the experiment. Sedimentcomposition was also held constant, the sedimentmixture consisting of 40% by volume crushedanthracite coal and 60% by volume 120 µm white quartz sand. These materials served as
Quantifying downstream changes in fluvial architecture 245
Fig. 1 Montsant alluvial fan(middle Eocene to late Oligocene:Anadón et al., 1986), Villanova dePrades, Spain.
FSC14 1/3/05 11:21 AM Page 245
successful. This point will be discussed later ingreater detail.
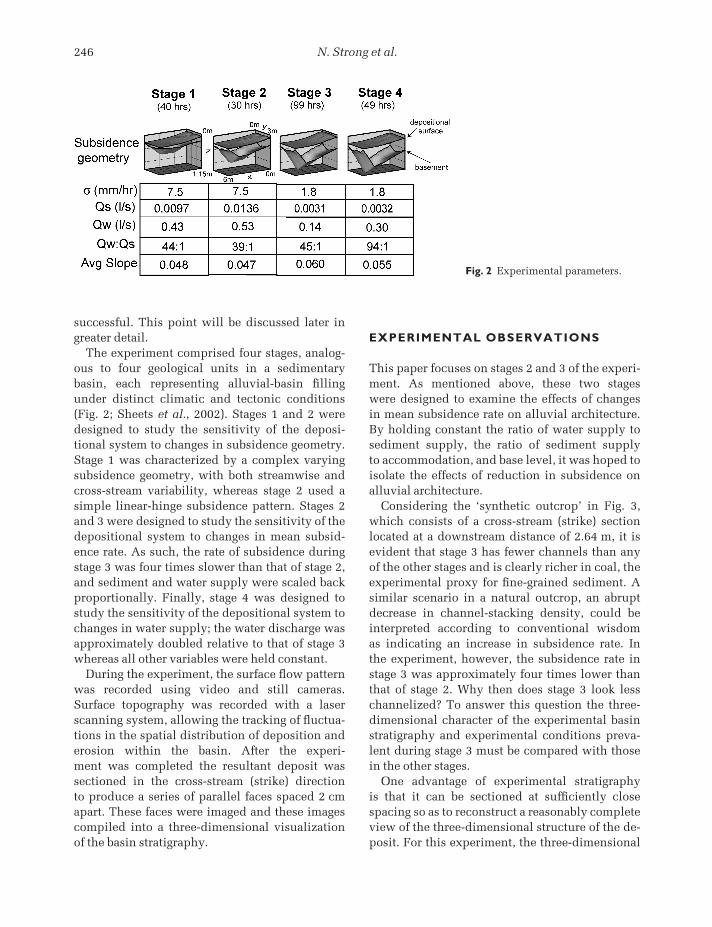
The experiment comprised four stages, analog-ous to four geological units in a sedimentarybasin, each representing alluvial-basin fillingunder distinct climatic and tectonic conditions(Fig. 2; Sheets et al., 2002). Stages 1 and 2 weredesigned to study the sensitivity of the deposi-tional system to changes in subsidence geometry.Stage 1 was characterized by a complex varyingsubsidence geometry, with both streamwise andcross-stream variability, whereas stage 2 used asimple linear-hinge subsidence pattern. Stages 2and 3 were designed to study the sensitivity of thedepositional system to changes in mean subsid-ence rate. As such, the rate of subsidence duringstage 3 was four times slower than that of stage 2,and sediment and water supply were scaled backproportionally. Finally, stage 4 was designed tostudy the sensitivity of the depositional system tochanges in water supply; the water discharge wasapproximately doubled relative to that of stage 3whereas all other variables were held constant.
During the experiment, the surface flow patternwas recorded using video and still cameras.Surface topography was recorded with a laserscanning system, allowing the tracking of fluctua-tions in the spatial distribution of deposition anderosion within the basin. After the experi-ment was completed the resultant deposit wassectioned in the cross-stream (strike) direction to produce a series of parallel faces spaced 2 cmapart. These faces were imaged and these imagescompiled into a three-dimensional visualizationof the basin stratigraphy.
EXPERIMENTAL OBSERVATIONS
This paper focuses on stages 2 and 3 of the experi-ment. As mentioned above, these two stages were designed to examine the effects of changes in mean subsidence rate on alluvial architecture. By holding constant the ratio of water supply tosediment supply, the ratio of sediment supply to accommodation, and base level, it was hoped toisolate the effects of reduction in subsidence onalluvial architecture.
Considering the ‘synthetic outcrop’ in Fig. 3,which consists of a cross-stream (strike) sectionlocated at a downstream distance of 2.64 m, it isevident that stage 3 has fewer channels than any of the other stages and is clearly richer in coal, theexperimental proxy for fine-grained sediment. Asimilar scenario in a natural outcrop, an abruptdecrease in channel-stacking density, could beinterpreted according to conventional wisdom as indicating an increase in subsidence rate. In the experiment, however, the subsidence rate in stage 3 was approximately four times lower thanthat of stage 2. Why then does stage 3 look lesschannelized? To answer this question the three-dimensional character of the experimental basinstratigraphy and experimental conditions preva-lent during stage 3 must be compared with thosein the other stages.
One advantage of experimental stratigraphy is that it can be sectioned at sufficiently closespacing so as to reconstruct a reasonably completeview of the three-dimensional structure of the de-posit. For this experiment, the three-dimensional
246 N. Strong et al.
Fig. 2 Experimental parameters.
FSC14 1/3/05 11:21 AM Page 246
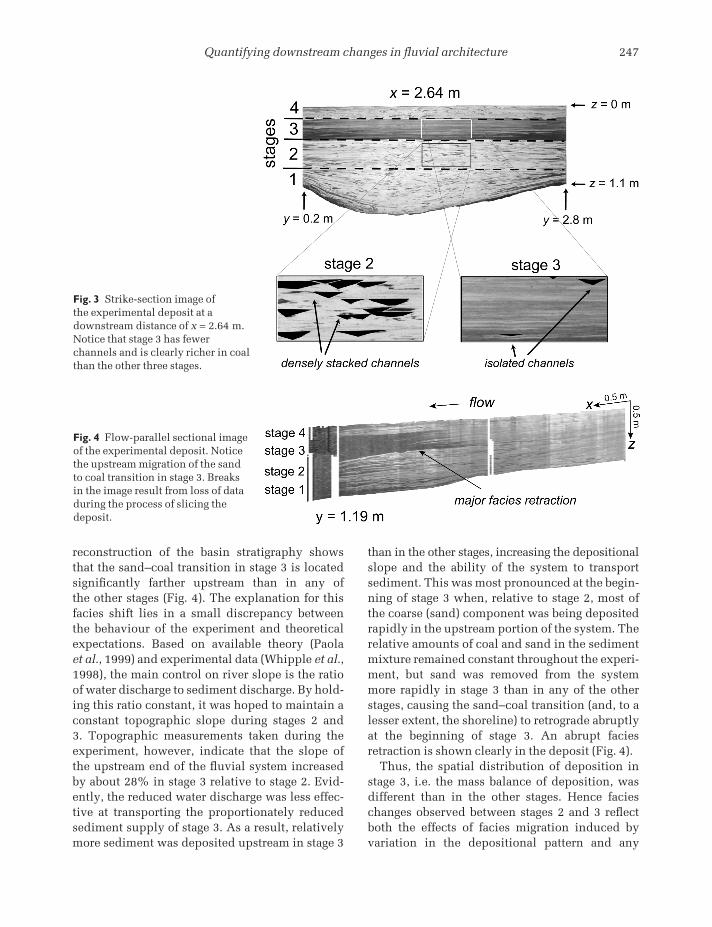
than in the other stages, increasing the depositionalslope and the ability of the system to transportsediment. This was most pronounced at the begin-ning of stage 3 when, relative to stage 2, most ofthe coarse (sand) component was being depositedrapidly in the upstream portion of the system. Therelative amounts of coal and sand in the sedimentmixture remained constant throughout the experi-ment, but sand was removed from the systemmore rapidly in stage 3 than in any of the otherstages, causing the sand–coal transition (and, to alesser extent, the shoreline) to retrograde abruptlyat the beginning of stage 3. An abrupt facies retraction is shown clearly in the deposit (Fig. 4).
Thus, the spatial distribution of deposition instage 3, i.e. the mass balance of deposition, wasdifferent than in the other stages. Hence facieschanges observed between stages 2 and 3 reflectboth the effects of facies migration induced byvariation in the depositional pattern and any
reconstruction of the basin stratigraphy showsthat the sand–coal transition in stage 3 is locatedsignificantly farther upstream than in any of the other stages (Fig. 4). The explanation for thisfacies shift lies in a small discrepancy between the behaviour of the experiment and theoreticalexpectations. Based on available theory (Paola et al., 1999) and experimental data (Whipple et al.,1998), the main control on river slope is the ratioof water discharge to sediment discharge. By hold-ing this ratio constant, it was hoped to maintain aconstant topographic slope during stages 2 and 3. Topographic measurements taken during theexperiment, however, indicate that the slope ofthe upstream end of the fluvial system increasedby about 28% in stage 3 relative to stage 2. Evid-ently, the reduced water discharge was less effec-tive at transporting the proportionately reducedsediment supply of stage 3. As a result, relativelymore sediment was deposited upstream in stage 3
Quantifying downstream changes in fluvial architecture 247
Fig. 3 Strike-section image of the experimental deposit at adownstream distance of x = 2.64 m.Notice that stage 3 has fewerchannels and is clearly richer in coalthan the other three stages.
Fig. 4 Flow-parallel sectional imageof the experimental deposit. Noticethe upstream migration of the sandto coal transition in stage 3. Breaksin the image result from loss of dataduring the process of slicing thedeposit.
FSC14 1/3/05 11:21 AM Page 247
effects resulting purely from the reduced waterand sediment discharges in stage 3. How can thesetwo independent controls on the observed alluvialarchitecture be separated?
MASS-BALANCE TRANSFORMATION
Instinctively, ‘proximal’ and ‘distal’ are thought ofin terms of distance from a sediment source. Theterms are generally understood in a relative sense;for instance, 10 km from source might be proximalin a large basin and distal in a small one. An alter-native conceptualization would be to think ofproximity not in terms of physical distance, butrather in terms of the fraction of all supplied sediment deposited upstream of that point. Themotivation for adopting this point of view is thatone of the strongest drivers of changes in the mor-phodynamic character of sedimentary systemsappears to be loss of sediment and the associatedgrain-size decrease induced by deposition. Ofcourse, downstream sediment loss and associatedfining are not the only causes of down-transportfacies changes. The mass-balance signal is oftensufficiently dominant, however, so as to maskother effects unless it is accounted for correctly.The goal here is to develop a transformation that facilitates this accounting. This effectivelyisolates that part of the depositional signal that isdirectly linked to changes in mass distribution inthe depositional system. Removing the mass bal-ance signal allows us to compare facies depositedunder different depositional geometries on a consistent basis, and to distinguish those aspectsof stratigraphy that are directly linked to changesin mass distribution from those that are not.
Consider a measure of downstream distance notin terms of an absolute length x, but in terms of anon-dimensional number χ(x), where χ(x) is equalto the fraction of all supplied sediment depositedbetween the sediment source at x = 0 and a dis-tance x downstream. Formally χ(x) is defined by:
(1)
χ( )
( )
( )
x
r x x
r x x
x
T
L
T
=�
�0
0
∆
∆
d
d
where r(x) is the rate of deposition in units of (L T−1) at a given downstream distance x, meas-ured over a time interval ∆T. Here ∆T is chosen to be long enough to average out intrinsic, flow-controlled (autogenic) fluctuations (Sheets et al.,2002) but shorter than the time-scales of changesin external variables. Variable L is the total lengthof the depositional system. The term in the numera-tor of equation (1) is equivalent to the width-averaged volume of sediment deposited betweenthe sediment source and a distance x. The term in the denominator of equation (1) is equivalent to the width-averaged volume of sediment depos-ited over the entire length of the system and, for a closed system, is equal to the total volume of sediment supplied over the time interval inquestion. For example, if at some downstream dis-tance x, χ(x) = 0.3, then 30% of the sediment hasbeen extracted from the system at that point, and70% is still in transport. Likewise χ(x) = 0.5 is thedownstream distance at which half the sedimenthas been extracted from the system. The physicaldistance x50 corresponding to χ(x) = 0.5 is in effectthe ‘depositional mid-point’ of the system. It isimportant to note that χ(x) is a non-dimensionalfunction that reflects the spatial distribution of thelocal rate of deposition r∆t(x) over the entire basin.It is not hard to imagine scenarios in which eitherχ(x) or r∆t(x) changes when other variables remainconstant.
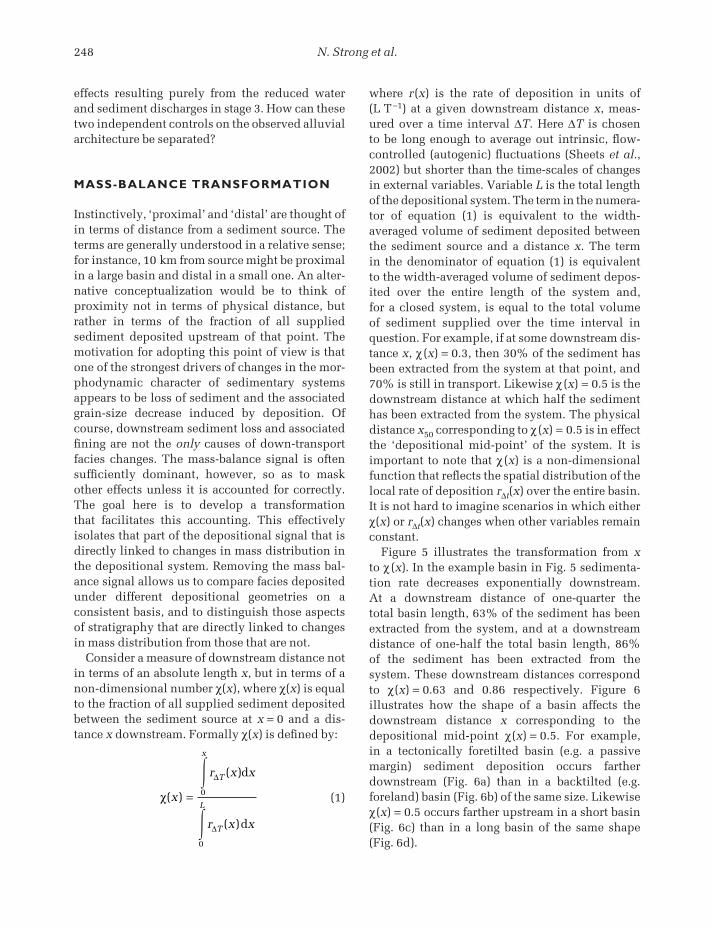
Figure 5 illustrates the transformation from xto χ(x). In the example basin in Fig. 5 sedimenta-tion rate decreases exponentially downstream. At a downstream distance of one-quarter the total basin length, 63% of the sediment has beenextracted from the system, and at a downstreamdistance of one-half the total basin length, 86% of the sediment has been extracted from the system. These downstream distances correspond to χ(x) = 0.63 and 0.86 respectively. Figure 6 illustrates how the shape of a basin affects thedownstream distance x corresponding to thedepositional mid-point χ(x) = 0.5. For example, in a tectonically foretilted basin (e.g. a passivemargin) sediment deposition occurs farther downstream (Fig. 6a) than in a backtilted (e.g.foreland) basin (Fig. 6b) of the same size. Likewiseχ(x) = 0.5 occurs farther upstream in a short basin(Fig. 6c) than in a long basin of the same shape(Fig. 6d).
248 N. Strong et al.
FSC14 1/3/05 11:21 AM Page 248
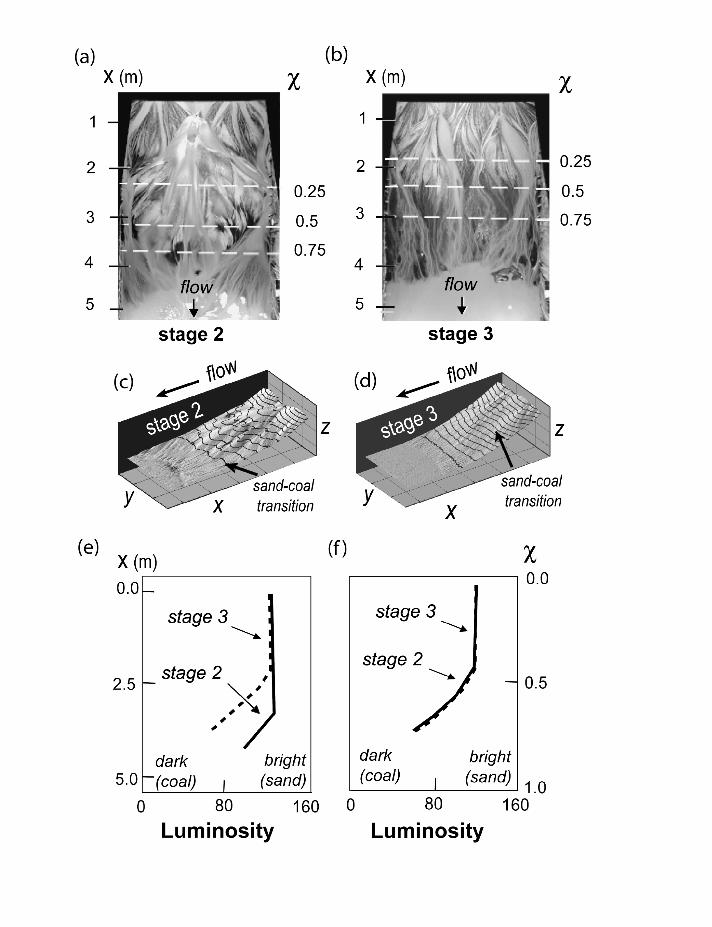
fraction increases, analogous to downstream fin-ing in a natural system. This downstream decreasein luminosity occurs at different rates for stages 2and 3 in x coordinates (Fig. 7e), whereas in χ(x)coordinates the rates of decrease in luminosity forstages 2 and 3 are nearly identical (Fig. 7f).
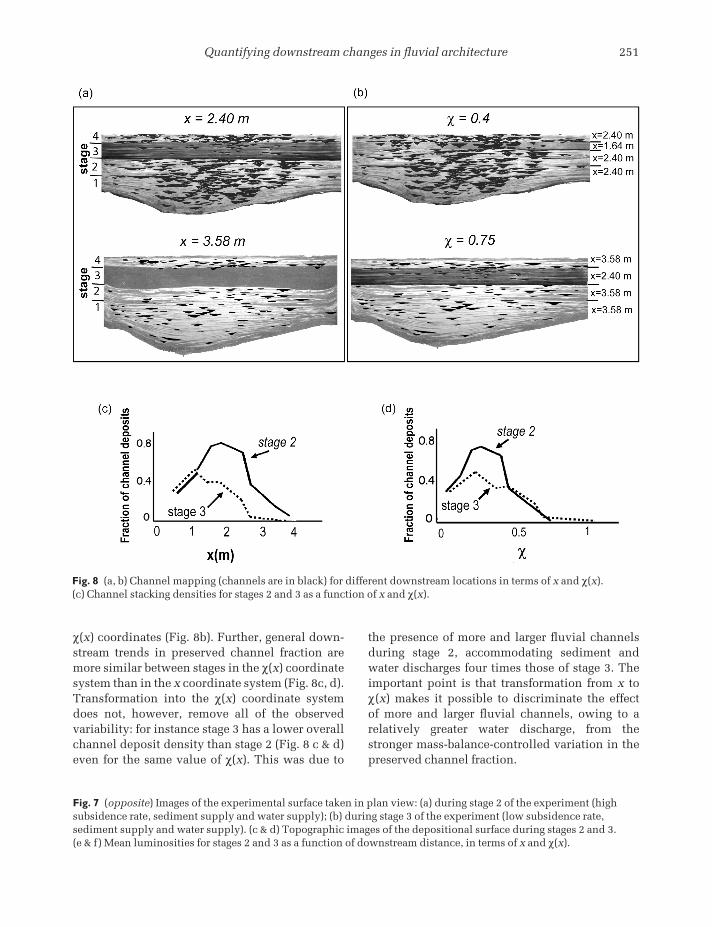
Transformation to χ(x) coordinates has a similareffect on downstream trends in channel stackingdensity. Although stage 3 shows generally fewerchannel deposits than the other stages for a par-ticular downstream location, x (Fig. 8a), much of that variability disappears upon transformation to
The most obvious difference between the twoimages of the experimental surface in Fig. 7(a, b)is that the sand–coal transition occurs fartherupstream in stage 3 than it does in stage 2. This isimportant with respect to alluvial architecture,because at the sand to coal transition a few largefluvial channels bifurcate into numerous smallerchannels, as evident in both the overhead imagestaken during the experiment (Fig. 7a, b) and theimages of the topography of the experimentaldeposit (Fig. 7c & d). The power of the χ trans-formation can be seen by comparing the location of this transition in standard dimensional coordi-nates (left side of each image, Fig. 7a & b) withtransformed χ coordinates (right side of eachimage, Fig. 7a & b). It can be seen that for similarvalues of χ the fluvial system seems to behave similarly. For instance in both images χ(x) = 0.25occurs upstream of the coal–sand transition, χ(x) = 0.5 occurs near the transition, and χ(x) =0.75 occurs downstream of the transition.
This observation can be made quantitative byestimating the volume of coal versus that of quartzsand that has been deposited in a given stage for agiven downstream location. To do so, mean lumi-nosity, a measure of brightness that varies in valuebetween 0 (black, i.e. pure coal) and 255 (white, i.e.pure quartz sand), may be used. For each stagetotal luminosity decreases downstream as the coal
Quantifying downstream changes in fluvial architecture 249
1
2
3
4
0.63
0.86
0.95
1.0
0
0downstream distance (χ)
fraction of sediment extracted (χ)
Fig. 5 A schematic representation of a sedimentarybasin, where sediment thickness decreasesexponentially downstream, illustrating the fundamentaldifference between measuring distance in terms of x(linear scale in back) and measuring distance in terms of χ(x) (non-linear scale in front).
(a)
(b)
(c)
(d)
flow
downstream distance (χ)
χ = 0
χ = 0.5
χ = 1
00.5
1
00.5 1
00.5
1
bas
in d
epth
(z)
Fig. 6 Schematic representation of the effect of basinshape on the downstream location of χ(x) = 0.5,corresponding to the downstream distance, x, where50% of the sediment has been extracted from thesystem.
FSC14 1/3/05 11:21 AM Page 249
FSC14 1/3/05 11:21 AM Page 250
Quantifying downstream changes in fluvial architecture 251
χ(x) coordinates (Fig. 8b). Further, general down-stream trends in preserved channel fraction aremore similar between stages in the χ(x) coordinatesystem than in the x coordinate system (Fig. 8c, d).Transformation into the χ(x) coordinate systemdoes not, however, remove all of the observedvariability: for instance stage 3 has a lower overallchannel deposit density than stage 2 (Fig. 8 c & d)even for the same value of χ(x). This was due to
the presence of more and larger fluvial channelsduring stage 2, accommodating sediment andwater discharges four times those of stage 3. Theimportant point is that transformation from x toχ(x) makes it possible to discriminate the effect of more and larger fluvial channels, owing to a relatively greater water discharge, from thestronger mass-balance-controlled variation in thepreserved channel fraction.
Fig. 7 (opposite) Images of the experimental surface taken in plan view: (a) during stage 2 of the experiment (highsubsidence rate, sediment supply and water supply); (b) during stage 3 of the experiment (low subsidence rate,sediment supply and water supply). (c & d) Topographic images of the depositional surface during stages 2 and 3. (e & f) Mean luminosities for stages 2 and 3 as a function of downstream distance, in terms of x and χ(x).
Fig. 8 (a, b) Channel mapping (channels are in black) for different downstream locations in terms of x and χ(x). (c) Channel stacking densities for stages 2 and 3 as a function of x and χ(x).
FSC14 1/3/05 11:21 AM Page 251
CONCLUSIONS
1 In an experiment with independently con-trolled subsidence, sediment supply and watersupply, a four-fold reduction in rates of thesethree variables produced an abrupt reduction inchannel stacking density in vertical section. Thischange was caused by an abrupt migration offacies towards the sediment source, which was inturn induced by upstream storage of sedimentassociated with a small increase in fluvial slope.2 The effect of varying the distribution of basinaldeposition can be quantified using a simple coor-dinate transformation, from downstream distancex to a non-dimensional mass-balance coordinateχ(x), where χ(x) is the fraction of all supplied sediment deposited upstream of distance x.3 For the experimental data presented here, transformation into this mass-balance coordinate system leads to internally consistent down-transport decreases in sand content and channelstacking density. In particular, many of the vertical changes in architecture resulting from theimposed changes described in (1) above disappearupon transformation to mass-balance coordinates.4 The most important control on alluvial archi-tecture in the experiment reported here was thespatial distribution of sedimentation, i.e. the sedi-ment mass balance. Other allogenic controls, suchas sediment supply, water supply and subsidence,mainly exerted influence indirectly by changingthis mass balance.5 After removal of mass-balance effects by transformation into the χ(x) coordinate system,the main residual architectural effect of reduc-ing water discharge in the experiment reported here was a decrease in channel stacking density associated with a decrease in channel size.6 Transformation to a mass-balance coordinatesystem provides a unifying quantitative frame-work for analysing the role of external variablessuch as subsidence, sediment supply and watersupply in controlling alluvial architecture. Thedominant role played by changes in mass balancein controlling alluvial architecture also illustr-ates a basic limitation of the present generation of ‘stand-alone’ alluvial architecture models:architecture at any particular location has at leastas much to do with relative net sediment extrac-
tion upstream as it does with avulsion dynamicsor channel geometry. Future generations of archi-tecture models should be tightly coupled withmodels for alluvial deposition and erosion onbasin scales to account for these effects.
ACKNOWLEDGEMENTS
We are grateful for helpful comments by reviewersMike Blum, Julio Freedman, and David Mohrig.We also thank Jim Mullin, Chris Ellis, and JohnSwenson for help with the enormous task of run-ning ‘Jurassic Tank’. Finally, we thank our spon-sors; the National Science Foundation (grant EAR97-25989), the University of Minnesota, the Officeof Naval Research (grant N00014-99-1-0603), andour Industrial Consortium (Anadarko PetroleumCorporation, Conoco Inc., Exxon-Mobil UpstreamResearch Company, Japan National Oil Company,and Texaco Inc.).
REFERENCES
Alexander, J. and Leeder, M.R. (1987) Active tectoniccontrol on alluvial architecture. In: Recent Develop-ments in Fluvial Sedimentology (Eds F.G. Ethridge,R.M. Flores and M.D. Harvey). Soc. Econ. Paleontol.Mineral. Spec. Publ., 39, 243–252.
Allen, J.R.L. (1978) Studies in fluviatile sedimentation:an exploratory quantitative model for the architectureof avulsion-controlled alluvial suites. Sediment. Geol.,21, 129–147.
Allen, J.R.L. (1979) Studies in fluviatile sedimentation:an elementary geometrical model for the con-nectedness of avulsion-related channel sand bodies.Sediment. Geol., 24, 253–267.
Anadón, P., Cabrera, L.L., Colombo, F., Marzo, M. andRiba, O. (1986) Syntectonic intraformational uncon-formities in alluvial fan deposits, eastern Ebro basinmargins (NE Spain). In: Foreland Basins (Eds P. Allenand P. Homewood). Spec. Publ. Int. Assoc. Sedi-mentol., 8, 259–271.
Ashworth, P.J., Best, J.L., Peakall, J. and Lorsong, J.A.(1999) The influence of aggradation rate on braidedalluvial architecture: field study and physical scale-modelling of the Ashburton River gravels, CanterburyPlains, New Zealand. In: Fluvial Sedimentology VI(Eds N.D. Smith and J. Rogers). Spec. Publ. Int. Assoc.Sedimentol., 28, 333–346.
Aslan, A. and Blum, M.D. (1999) Contrasting styles ofHolocene avulsion, Texas Gulf Coastal Plain, U.S.A.
252 N. Strong et al.
FSC14 1/3/05 11:21 AM Page 252
Sedimentology (Ed. A.D. Miall). Can. Soc. Petrol.Geol. Mem., 5, 587–596.
Leeder, M.R. and Gawthorpe, R.L. (1987) Sedimentarymodels for extensional tilt block/half-graben basins.Geol. Soc. Lond. Spec. Publ., 28, 139–152.
Leeder, M.R., Mack, G.H., Peakall, J. and Salyards, S.L.(1996) First quantitative test of alluvial stratigraphicmodels: southern Rio Grande rift, New Mexico. Geo-logy, 24, 87–90.
Mackey, S.D. and Bridge, J.S. (1995) Three-dimensionalmodel of alluvial stratigraphy: theory and application.J. Sediment. Res., B65, 7–31.
Nemec, W. and Steel, R.J. (1984) Alluvial and coastal conglomerates: their significant features and some com-ments on gravelly mass-flow deposits.In: Sedimentology of Gravels and Conglomerates(Eds E.H. Koster and R.J. Steel). Can. Soc. Petrol. Geol.Mem., 10, 1–31.
Paola, C. (2000) Quantitative models of sedimentarybasin filling. Sedimentology, 47 (suppl. 1), 121–178.
Paola, C., Parker, G., Mohrig, D.C. and Whipple, K.X.(1999) The influence of transport fluctuations on spatially averaged topography on a sandy, braided fluv-ial fan. In: Numerical Experiments in Stratigraphy:Recent Advances in Stratigraphic and Sedimento-logic Computer Simulations (Eds J. Harbaugh, W.L.Watney, E.C. Rankey, R. Slingerland, R.H. Goldsteinand E.K. Franseen). Spec. Pub. Soc. Econ. Paleontol.Mineral., 62, 211–218.
Paola, C., Mullin, J., Ellis, C., Mohrig, D.C., Swenson,J.B., Parker, G., Hickson, T., Heller, P.L., Pratson, L.,Syvitski, J., Sheets, B. and Strong, N. (2001) Experi-mental stratigraphy. GSA Today, 11, 4–9.
Sheets, B., Hickson, T. and Paola, C. (2002) Assemblingthe stratigraphic record: depositional patterns andtime-scales in an experimental alluvial basin. BasinRes., 14, 287–301.
Whipple, K.X., Parker, G., Paola, C. and Mohrig, D.C.(1998) Channel dynamics, sediment transport, and the slope of alluvial fans: experimental study. J. Geol.,106, 677–693.
In: Fluvial Sedimentology VI (Eds N.D. Smith and J. Rogers). Spec. Publ. Int. Assoc. Sedimentol., 28,293–308.
Behrensmeyer, A.K. and Tauxe, L. (1982) Isochronousfluvial systems in Miocene deposits of northernPakistan. Sedimentology, 29, 331–352.
Bridge, J.S. and Leeder, M.R. (1979) A simulation model of alluvial stratigraphy. Sedimentology, 26,617–644.
Bridge, J.S. and Mackey, S. D. (1993a) A revised alluvialstratigraphy model. In: Alluvial Sedimentation (EdsM. Marzo and C. Puigdefábregas). Spec. Publ. Int.Assoc. Sedimentol., 17, 319–336.
Bridge, J.S. and Mackey, S.D. (1993b) A theoretical studyof fluvial sandstone body dimensions. In: QuantativeDescription and Modelling of Clastic HydrocarbonReservoirs and Outcrop Analogues (Eds S. Flint andI.D. Bryant). Spec. Publ. Int. Assoc. Sedimentol., 15,213–236.
Bryant, M., Falk, P. and Paola, C. (1995) Experimentalstudy of avulsion frequency and rate of deposition.Geology, 23, 365–368.
Guiseppe, A.C. and Heller, P.L. (1998) Long-term riverresponse to regional doming in the Price RiverFormation, central Utah. Geology, 26, 239–242.
Heller, P.L. and Paola, C. (1996) Downstream changes inalluvial architecture: an exploration of controls onchannel-stacking patterns. J. Sediment. Res., 66,297–306.
Kraus, M.J. (2002) Basin-scale changes in floodplainpaleosols: implications for interpreting alluvial architecture. J. Sediment. Res., 72, 500–509.
Kraus, M.J. and Middleton, L.T. (1987) Contrastingarchitecture of two alluvial suites in different struc-tural settings. In: Recent Developments in FluvialSedimentology (Eds F.G. Ethridge, R.M. Flores andM.D. Harvey). Soc. Econ. Paleontol. Mineral. Spec.Publ., 39, 253–262.
Leeder, M.R. (1978) A quantitative stratigraphic model for alluvium, with special reference to channeldeposit density and interconnectedness. In: Fluvial
Quantifying downstream changes in fluvial architecture 253
FSC14 1/3/05 11:21 AM Page 253