Embed Size (px)
Citation preview
Physics Letters B 291 (1992)503-518 PHYSICS LETTERS B North-Holland
A measurement of strange baryon production in hadronic Z ° decays OPAL Collaboration
P.D. Acton a, G. Alexander b, J. Allison c, p.p. AUport d, K.J. Anderson e, S. Arcelli f,
A. Astbury g, D. Axen h, G. Azuelos i'l, G.A. Bahan c, J.T.M. Baines c, A.H. Ball J, J. Banks c, R.J. Barlow c, S. Barnett c, J.R. Barley d, G. Beaudoin i, A. Beck b, J. Becker k, T. Behnke t, K.W. Bell m, G. Bella b, p. Berlich k, S. Bethke n, O. Biebel o, U. Binder k, I.J. Bloodworth P, P. Bock n, B. Boden °, H.M. Bosch n, S. Bougerolle h, H. Breuker q, R.M. Brown m, A. Buijs q, H.J. Burckhart q, P. Capiluppi f, R.K. Carnegie r, A.A. Carter s, J.R. Carter d, C.Y. Chang j, D.G. Charlton q, P.E.L. Clarke a, I. Cohen b, J.C. Clayton P, W.J. Collins d, J.E. Conboy t, M. Cooper u, M. Coupland v, M. Cuffiani f, S. Dado u, G.M. Dallavalle f, S. De Jong q, L.A. del Pozo d, H. DengJ, A. Dieckmann n, M. Dittmar w, M.S. Dixit x, E. do Couto e Silva Y, J.E. Duboscq q, E. Duchovni z, G. Duckeck n, I.P. Duerdoth c, D.J.P. Dumas r, P.A. Elcombe d, P.G. Estabrooks r, E. Etzion b, H.G. Evans e, F. Fabbri f, M. Fincke-Keeler g, H.M. Fischer °, D.G. FongJ, M. FoucherJ, A. Gaidot aa, O. Ganel z, J.W. Gary w, j. Gascon i, R.F. McGowan c, N.I. Geddes m, C. Geich-Gimbel o, S.W. Gensler e, F.X. Gentit aa, G. Giacomelli f, V. Gibson d, W.R. Gibson s, J.D. Gillies m, j. Goldberg u, M.J. Goodrick d, W. Gorn w, C. Grandi f, F.C. Grant a, j. Hagemann t, G.G. Hanson Y, M. Hansroul q, C.K. Hargrove x, P.F. Harrison s, J. Hart q, P.M. Hattersley p, M. Hauschild q, C.M. Hawkes q, E. Heflin w, R.J. Hemingway r, R.D. Heuer q, J.C. Hill d, S.J. HillierP, T. Hilse k, D.A. Hinshaw i, J.D. Hobbs q, P.R. Hobson a, D. Hochman z, R.J. Homer P, A.K. Honma g,t, C.P. Howarth t, R.E. Hughes-Jones c,
k n n a r j R. Humbert , P. Igo-Kemenes , H. Ihssen , D.C. Imrie , A.C. Janissen , A. Jawahery , P.W. Jeffreys m, H. Jeremie i, M. Jimack f, M. Jobes P, R.W.L. Jones s, p. Jovanovic P, C. Jui w, D. Karlen r, K. Kawagoe ab, T. Kawamoto ab, R.K. Keeler g, R.G. Kellogg J, B.W. Kennedy t, S. Kluth d, T. Kobayashi ab, T.P. Kokott °, S. Komamiya ab, L. K6pke q, J.F. Kral q, R. Kowalewski r, j. von Krogh n, j. Kroll e, M. Kuwano ab, p. Kyberd s, G.D. Lafferty c, F. Lamarche i, J.G. Layter w, P. Le Du aa, P. Leblanc i, A.M. Lee J, M.H. Lehto t, D. Lellouch z, P. Lennert n, C. Leroy i, j. Letts w, S. Levegriin o, L. Levinson z, S.L. Lloyd s, F.K. Loebinger c, J.M. LorahJ, B. Lorazo i, M.J. Losty x, X.C. Lou Y, J. Ludwig k, M. Mannelli q, S. Marcellini f, G. Maringer °, C. Markus °, A.J. Martin s, J.P. Martin i, T. Mashimo ab, P. Mfittig °, U. Maur °, J. McKenna g, T.J. McMahon P, J.R. McNutt a, F. Meijers q, D. Menszner n, F.S. Merritt c, H. Mes x, A. Michelini q, R.P. Middleton m, G. Mikenberg z, j. Mildenberger r, D.J. Miller t, R. Mir Y, W. Mohr k, C. Moisan i, A. Montanari f, T. Mori ab, M. Morii ab, T. Mouthuy y,2, B. Nellen o, H.H. Nguyen c, M. Nozaki ab, S.W. O'Neale q,3, F.G. Oakham x, F. Odorici f, H.O. Ogren Y, C.J. Oram g,1, M.J. Oreglia e, S. Orito ab, j.p. Pansart aa, B. Panzer-Steindel q, P. Paschievici z, G.N. Patrick m, N. Paz-Jaoshvili b, p. Pfister k, J.E. Pilcher c, D. Pitman g, D.E. Plane q, P. Poffenbergerg, B. Poli f, A. Pouladdej r, E. Prebys q, T.W. Pritchard s, H. Przysiezniak i, G. Quast e, M.W. Redmond c, D.L. Rees p, G.E. Richards c, D. Robinson q, A. Rollnik °, J.M. Roney e, E. Ros q, S. Rossberg k, A.M. Rossi f,4, M. Rosvick g, P. Routenburg r, K. Runge k, O. Runolfsson q, D.R. Rust Y, M. Sasaki ab, C. Sbarra q, A.D. Schaile k, O. Schaile k, W. Schappert r, p. Scharff-Hansen q, P. Schenk g, H. yon der Schmitt n, S. Schreiber o, C. Schwick t, J. Schwiening °, W.G. Scott m, M. Settles Y, T.G. Shears d, B.C. Shen w,
0370-2693/92/$ 05.00 (~ 1992-Elsevier Science Publishers B.V. All fights reserved 503
Volume 291, number 4 PHYSICS LETTERS B 1 October 1992
C.H. Shepherd-Themistocleous x, p. Sherwood t, R. Shypit h, A. Simon o, p. Singh s, G.P. Siroli f, A. SkujaJ, A.M. Smith q, T.J. Smith q, G.A. Snow J, R. Sobie g,5, R.W. Springer J, M. Sproston m, K. Stephens c, j . Steuerer g, R. StriShmer n, D. Strom ac, T. Takeshita ab,6, p. Taras i, S. Tarem z, M. Tecchio e, p. Teixeira-Dias n, N. Tesch o, N.J. Thackray P, G. Transtromer a, N.J. Tresilian e, T. Tsukamoto ab, M.F. Turner d, G. Tysarczyk-Niemeyer n, D. Van den plas i, R. Van Kooten q, G.J. VanDalen w, G. Vasseur aa, C.J. Virtue x, A. Wagner e , D.L. Wagner e, C. Wahl k, J.P. Walker P, C.P. Ward d, D.R. Ward d, P.M. Watkins P, A.T. Watson P, N.K. Watson q, M. Weber n, P. Weber r, S. Weisz q, P.S. Wells q, N. Wermes n, M.A. Whalley P, G.W. Wilson w, J.A. Wilson P, V.-H. Winterer k, T. Wlodek z, S. Wot ton n, T.R. Wyatt c, R. Yaari z, A. Yeaman s, G. Yekutieli z, M. Yurko i, W. Zeuner q and G.T. ZornJ
a Brunel University, Uxbridge, Middlesex UB8 3PH, UK b Department of Physics and Astronomy, Tel Aviv University, Tel Aviv 69978, Israel c Department of Physics, Schuster Laboratory, The University, Manchester M13 9PL, UK d Cavendish Laboratory, Cambridge CB30HE, UK e Enrico Fermi Institute and Department of Physics, University of Chicago, Chicago, IL 60637, USA f Dipartimento di Fisica dell" Universit& di Bologna and INFN, 1-40126 Bologna, Italy g Department of Physics, University of Victoria, P.O. Box 3055, Victoria, B.C., Canada 1/814/3P6 h Department of Physics, University of British Columbia, 6224 Agriculture Road, Vancouver, B.C., Canada V6T IZ1 i Laboratoire de Physique Nuclkaire, Universitb de Montrbal, Montreal, Quebec, Canada H3C 3J7 J Department of Physics and Astronomy, University of Maryland, College Park, AID 20742, USA k Fakulttit J~r Physik, Albert Ludwigs Universitiit, 141-7800 Freiburg, FRG ! II. Institut 3~r Experimental Physik, Universitiit Hamburg/DESY, W-2000 Hamburg 52, FRG m Rutherford Appleton Laboratory, Chilton, Didcot, Oxfordshire 0 X l l OQX, UK n Physikalisches Institut, Universit?it Heidelberg, W-6900 Heidelberg, FRG o Physikalisches Institut, Universitiit Bonn, 141-5300 Bonn 1, FRG P School of Physics and Space Research, University of Birmingham, Birmingham B15 2TT, UK q CERN, European Organisation for Particle Physics, CH-1211 Geneva 23, Switzerland r Department of Physics, Carleton University, Colonel By Drive, Ottawa, Ontario, Canada KIS 5B6 s Queen Mary and Westfield College, University of London, London E1 4NS, UK t University College London, London WCIE 6BT, UK u Department of Physics, Technion - Israel Institute of Technology, Haifa 32000, Israel v Birkbeck College, London WCIE 7HI~, UK w Department of Physics, University of California, Riverside, CA 92521, USA x Centre for Research in Particle Physics, Carleton University, Ottawa, Ontario, Canada KIS 5B6 Y Department of Physics, Indiana University, Swain Hall West 117, Bloomington, IN 47405, USA z Nuclear Physics Department, Weizmann Institute of Science, Rehovot 76100, Israel aa DPhPE, CEN Saclay, F-91191 Gifisur- Yvette, France ab International Centre for Elementary Particle Physics and Department of Physics, University of Tokyo,
Tokyo 113, Japan and Kobe University, Kobe 657, Japan
ac University of Oregon, Department of Physics, Eugene, OR 97403, USA
Received 21 July 1992
The production of the octet and decuplet baryons A, -=-, Z(1385) ±, E(1530) ° and fl- and the corresponding antibaryons has been measured in a sample of 485000 hadronic Z ° decays. Results on differential and integrated cross sections are presented. The differential cross section of A baryons is found to be softer than the one predicted by the Jetset and Herwig Monte Carlo generators. The measured decuplet yields are found to disagree with the simple diquark picture where only one tuning parameter for spin 1 diquarks is used. Comparisons of the momentum spectra for A and E- with the predictions of an analytical QCD formula are also presented.
504
Volume 291, number 4 PHYSICS LETTERS B l October 1992
1. Introduction
Previous experiments at PETRA and PEP have measured the production of various baryon *~ species in jets [ l ]. It has been found that the average hadronic event at centre of mass energies of 29 GeV contains 0.58 + 0.05 protons, 0.214 ± 0.012 A's, 0.035 + 0.009 Z(1385)+ ' s and 0.0178 ± 0.0036 E - ' s [2]. Surpris- ingly high rates for the f l - of 0.014 ± 0.007 have been reported (see ref. [1] and also ref. [3]) . The dif- ferential momentum spectra of mesons and baryons are found to be very similar, and consequently it is assumed that baryons and mesons are produced by a similar mechanism during the fragmentation pro- cess. However, the observed production ratio of E - to A and the small rates of decuplet baryons require additional mechanisms to suppress the production of baryons with single and double strangeness and with spin 3.
The observed momentum spectra and the extra suppression factors can be described by the diquark model, the most common approach used to describe baryon production in jets. According to this scheme, quark-antiquark and diquark-antidiquark pairs are produced from the sea. A diquark combines with a quark to form a baryon. This model, as used for ex- ample within the Lund string model [4], leads natu- rally to similar fragmentation functions for baryons and light mesons. Thus far, these diquark models are in agreement with the observed baryon yields, if the free parameters to produce diquarks with different spin and strangeness are tuned appropriately.
Inclusive measurements of A and E - baryons have been published, based on about 90 000 hadronic Z ° decays [5]. In this letter, the production o f A, ,E-,
l Also at TRIUMF, Vancouver, Canada V6T 2A3. 2 Present address: Centre de Physique des Particules de
Marseille, Facult6 des Sciences de Luminy, F-13288 Marseille, France.
3 On leave from Birmingham University, Birmingham B15 2TT, UK.
4 Present address: Dipartimento di Fisica, Universit~t della Calabria and INFN, 1-87036 Rende, Italy.
5 And IPP, McGill University, High Energy Physics De- partment, 3600 University Street, Montreal, Quebec, Canada H3A 2T8.
6 Also at Shinshu University, Matsumoto 390, Japan. #1 To simplify the text, we use "baryons" to mean "baryons
plus antibaryons", if not specified otherwise.
E(1385) +, E(1530) °, and f~- is measured with the OPAL detector using a sample of 485 000 hadronic Z ° decays. These particles are identified via their decays over essentially the entire momentum range and al- low a measurement of the differential and integrated yields with very good accuracy.
After a brief description of the OPAL detector and the selection of hadronic Z ° decays, we describe the criteria used to select the different types o f baryons. The cross sections are presented and compared with the Jetset Monte Carlo model version 7.3 [4 ] and with predictions of an analytical QCD formula. Production yields of strange baryons within the Herwig Monte Carlo version 5.0 [6] are also discussed.
2. The OPAL detector and the hadronic event selection
The crucial components for this analysis are de- scribed briefly below. A detailed description of the OPAL detector can be found elsewhere [7].
The measurements of the trajectories and momenta of charged particles are performed with a precision vertex chamber, a jet chamber and z-chambers. The cylindrical vertex drift chamber is located between radii of 9 and 24 cm and is subdivided into 36 az- imuthal sectors each with 12 anode wires parallel to the beam direction and 36 sectors each with 6 anode wires at an average stereo angle of 4.1 °.
In the r -~ plane*2, the average space resolution is 50 ~tm for the hit nearest to the anode wire (first hit) and 90 g m for subsequent hits. The jet chamber is a large volume drift chamber, 4 m long and 1.85 m in radius, which is divided into 24 azimuthal sectors. Each sector contains a sense-wire plane having 159 axial anode wires. Each of the wires provides three- dimensional coordinate measurements, via drift-time measurement in the r-~b plane and charge-division measurement in the z direction. The average space point resolution in the r-~b plane is 130 #m. The jet chamber also allows the measurement o f the specific
.2 The coordinate system is defined such that the z axis follows the electron beam direction, and the x axis is pointing in the direction of the centre of the LEP ring. The radial coordinate, r, is in the x - y plane. The polar and azimuthal angles, 0 and ~b, are defined with respect to the z and x axes, respectively.
505
Volume 291, number 4 PHYSICS LETTERS B 1 October 1992
energy loss, dE /dx , of charged particles [8]. A reso- lution of (3-4)% has been obtained allowing particle identification over a large momentum range. In the barrel region (I cos 01 less than 0.72), the jet chamber is surrounded by a set of z-chambers covering 94% of the azimuth, each of which has 6 anode wires per- pendicular to the beam direction. This provides z co- ordinate measurements with an accuracy of approxi- mately 300/tm. For larger I cos 0l values, the last mea- sured hit on a track can be used to measure 0 with good accuracy. The three drift chamber detectors are operated at a gas pressure of 4 bar and are placed in- side a solenoidal coil that provides a uniform axial magnetic field of 0.435 T.
Tracks are reconstructed using a method that ex- plicitly incorporates the effect of multiple Coulomb scattering in the detector gaseous volumes, in the dis- crete material between chambers, and in the beam pipe [9]. The momentum resolution in the r-~b plane for charged particles in the region I cos01 < 0.7 is [a(pt)/Pt] 2 = 0.022 + (0.0018 "pt) 2, where pt is the momentum in the r-~b plane in GeV. The impact pa- rameter resolution in the r-~b plane, measured using Z ° ---, #+/ t - and Z ° --, e+e - decays, is 40 /~m for 45 GeV tracks. This resolution degrades to ~ 65/~m at 10 GeV transverse momentum and to almost 300/tm at 1 GeV due to multiple scattering effects. Angular resolutions have been estimated to be approximately 0.1 mrad in ~b and 2 mrad in 0 for tracks measured in all components of the central detector.
The data sample, which corresponds to an inte- grated luminosity of about 20 pb -t , was collected with the OPAL detector at LEP during 1990 and 1991. With the requirement that the three drift chambers are operational, a sample of 485 000 hadronic Z ° de- cays has been selected using the criteria described in the OPAL line-shape analysis [ 10], with an efficiency of (98.4 q- 0.4)%. The remaining background pro- cesses are estimated to be at a negligible level (0.1% or less).
To determine the selection efficiencies for the dif- ferent baryons, we have used a sample of approxi- mately 400 000 Jetset hadronic Z ° decays which have been passed through the full detector simulation pro- gram of the OPAL experiment [11 ]. In the case of the ~ - , which has a very low cross section within the Jetset Monte Carlo, we have generated a special sam- ple of 1300 hadronic events containing at least one
f~- which decays to AK-, to determine the efficiency with better accuracy.
3. Select ion of the different strange baryons
The A, -=- and f~- can be identified by their decays into prt- (64%), Art- (100%) and AK- (67.8%), respectively, with the corresponding branching ratios given in parentheses. Due to the long lifetimes of these baryons, a very strong rejection of combinato- rial background is achieved by selecting particle com- binations with secondary vertices, which are clearly displaced from the main vertex. In addition, the good d E / d x measurement in the jet chamber allows a fur- ther strong background suppression. For the identi- fication of E- and t2-, the wrong charge combina- tion provides an excellent method to determine the remaining background.
The Y.(1385) -~ and -~(1530) ° decay strongly with branching ratios of 88% to Art ± and 67% to -=-rt+, respectively. Because of the prompt decay, no addi- tional secondary vertex cuts are possible to reduce the combinatorial background.
For the measurements described below we require that - tracks have at least 40 associated wire hits (Nhit) of the jet chamber, - the first reconstructed hit is before a radial distance of 140 cm, - more than 50% of the geometrically possible hits are found, and - the transverse momentum of the track with respect to the beam axis (Pt) is at least 100 MeV.
3.1. A selection
Two similar selection methods are used to select A's. The first method is optimized to obtain a very good mass resolution and a small systematic error. Here, both tracks used to identify the A decay must have associated z-chamber measurements. The polar angle 0 is therefore limited to I cos 01 < 0.7. This method is used to derive the A cross section results.
The second method is optimized for high efficiency. This is achieved mainly because no requirements on the z-chambers are made, which extends the range of the polar angle to I cos 0[ < 0.9, resulting in a slightly
506
Volume 291, number 4 PHYSICS LETTERS B 1 October 1992
worse mass resolution for the additional identified A's. These reconstructed A's are used to identify the other baryon species.
3.1. I. A selection method 1 The following criteria are used for method 1:
- all track combinations with opposite charge are ex- amined and the higher momentum track is assigned to be the proton track, - the momentum of the combination must be above 1% of the beam energy,
- the impact parameter transverse to the beam direc- tion (d0) of the pion with respect to the main ver- tex #3 must be larger than 3 m m and the do of the proton track must be larger than 1 mm, - background is suppressed by using the information from the d E / d x measurement, if available. Because of the cross-over regions [ 8], momentum dependent cuts are used. I f more than 20 hits could be used for the d E / d x measurement of a track, the combination is retained only if criterion 1 for the proton and criterion 2 for the pion are fulfilled:
(i) the higher momentum track has to have ( 1 ) a d E / d x loss of more than 8 keV/cm and the
probability #4 for a proton greater than 0.5% if the momentum is less than 1.5 GeV,
(2) a d E / d x loss of less than 8.5 keV/cm if the momentum is between 1.5 GeV and 2 GeV, where protons and pions both have a specific energy loss of about 7 keV/cm and
(3) a probability for a proton of more than 5%, or alternatively the probability for a proton must be larger than the probability for a charged kaon, if the track momenta is above 2 GeV;
(ii) for the lower momentum track the probability for a pion must be larger than 0.1%, - photon conversions are removed if the invariant mass of the track pair, assuming them to be an electron positron pair, is smaller than 40 MeV, - the selected combinations are required to have at least one track pair intersection within the radial range of 1-130 cm on the side of the intersection point to
#3 The main vertex is fitted for each event using the mea- sured track coordinates in the event.
#4 The difference between the measured and expected dE/dx loss for a given particle type, assuming a gaussian distribution with a known sigma, defines the probability.
which the combined momentum vector points. I f two intersections exist, the one closer to the interaction point is normally used. The second solution is used (a) if both tracks have their first reconstructed hit af- ter the second intersection point or (b) if one track has hits before and the other track has the first hit af- ter the second intersection, and the angle in the plane transverse to the beam direction, ~ , between the di- rection of flight from the event vertex to the assumed decay point and the reconstructed A momentum, is smaller than for the first intersection. - Candidates with hits on both tracks more than 5 cm upstream towards the collision point from the track intersection are removed, and - the angle • must be smaller than 35 mrad.
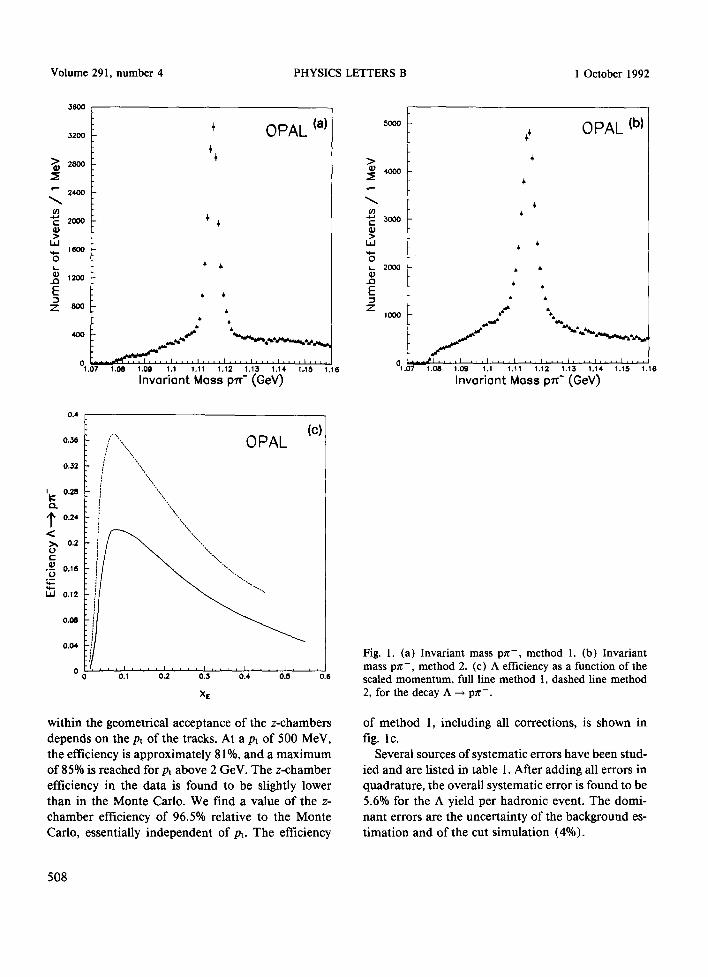
With these cuts, a narrow, almost gaussian A mass peak above a small background is obtained as shown in fig. 1 a. The mass obtained from a gaussian fit to the peak, 1.1155 GeV + 0.06 MeV, is in excellent agree- ment with the Particle Data Group value of 1.1156 GeV [2]. The resolution of the A mass is found to depend on momentum with a value of a = 2.3 MeV for momenta below 5 GeV.
The combinatorial background is determined for different momentum intervals by a fit to the mass distribution (x) using a gaussian distribu- tion for the A signal and a background of the form {I - e x p [ - a ( x - 1.077)]} × (bx + c). The fit has been performed within a mass interval between 1.09 GeV and 1.20 GeV. Because of non-gaussian tails, the number of A's is counted within an in- terval of 4-12 MeV around the A mass using the background estimated from the fit. Using this ap- proach, a total of 17 384 A's above a background of 7457 is found. The observed number of A's and the calculated background are given in table 1. We have used the same method in Monte Carlo gen- erated events and find that this gives the correct number of A's with an accuracy of better than 3%. Using other background parametrisations and fit intervals, the obtained numbers also agree to bet- ter than 3%.
The different distributions of the geometrical vari- ables used to select A's have been compared and very good agreement between data and Monte Carlo is found. The efficiency loss because of the requirement that both tracks have associated z-chamber hits is determined from the data. This efficiency for tracks
507
Volume 291, number 4 PHYSICS LETTERS B 1 October 1992
3600
3200
28OO
" - 2400
t- 2000 4)
I , I q_ 1600 0
. ~ 1200
E Z aoo
4OO
0 1.07
÷ OPAL (a) + +
,1, ,I,
$ ,
6
• - , . . * . * " " " " - " , ~ , . * . , . , . , ,~ . . . .~
1.08 1.09 1.1 1.11 1.12 1.13 1.14 1,15 1.16
Invariant Mass p~v- (GeV)
0.4
(c) O3,o32 /""""",,,,,,,,,,,,,,,, OPAL
ig(~. 0.28
1, o,, i X
< i "" ~ . 0 . 2 " , ,
• ~ 0.16 " ' . . 0
LcJ 0.12 " " "
O.Oe
0.04 ]
0 0 0.1 0.2 0.3 0.4 0.5 0.6
X £
within the geometrical acceptance of the z-chambers depends on the Pt of the tracks. At a Pt of 500 MeV, the efficiency is approximately 81%, and a maximum of 85% is reached for Pt above 2 GeV. The z-chamber efficiency in the data is found to be slightly lower than in the Monte Carlo. We find a value of the z- chamber efficiency of 96.5% relative to the Monte Carlo, essentially independent of Pt. The efficiency
>
U} E 4)
i , i
"5 4)
E Z
5000
4OOO
3000
2000
1000
~ OPAL (b)
+
6
6
/ \
. . . . . . . . . . . p l . . . . i . . . . i . . . . i . . . . i . . . . i . . . . i . . . . i . . . . I
0 1 . 0 7 1 . 0 8 1.09 1.1 1.11 1.12 1.13 1.14 1.15 1.16
Invariant Mass plr- (GeV)
Fig. 1. (a) Invariant mass pn - , method 1. (b) Invariant mass pn - , method 2. (c) A efficiency as a function of the scaled momentum, full line method 1, dashed line method 2, for the decay A --* pn- .
of method 1, including all corrections, is shown in fig. lc.
Several sources of systematic errors have been stud- ied and are listed in table 1. After adding all errors in quadrature, the overall systematic error is found to be 5.6% for the A yield per hadronic event. The domi- nant errors are the uncertainty of the background es- t imat ion and of the cut s imulat ion (4%).
508
Volume 291, number 4 PHYSICS LETTERS B
Table 1 Number of observed baryon species and the different systematic errors of the measurements.
1 October 1992
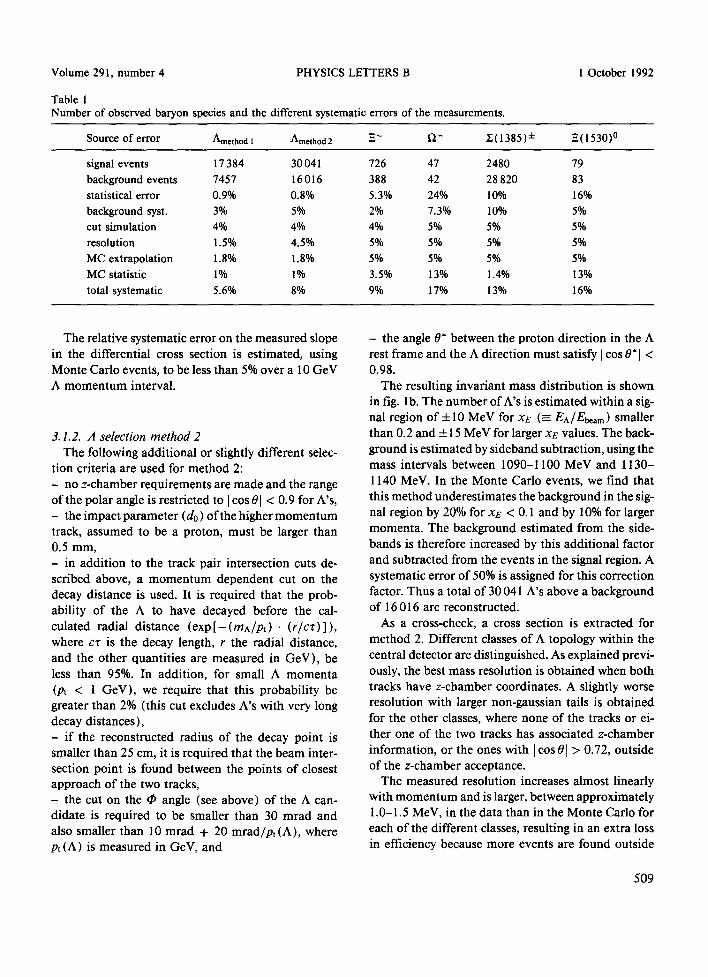
Source of e r r o r Amethod 1 Arnethod 2 E- f~- r. ( 1385 ) + E ( 1530)0
signal events 17 384 30 041 726 47 2480 79 background events 7457 16016 388 42 28820 83 statistical error 0.9% 0.8% 5.3% 24% 10% 16% background syst. 3% 5% 2% 7.3% 10% 5% cut simulation 4% 4% 4% 5% 5% 5% resolution 1.5% 4.5% 5% 5% 5% 5% MC extrapolation 1.8% 1.8% 5% 5% 5% 5% MC statistic 1% 1% 3.5% 13% 1.4% 13% total systematic 5.6% 8% 9% 17% 13% 16%
The relative systematic error on the measured slope in the differential cross section is estimated, using Monte Carlo events, to be less than 5% over a 10 GeV A momentum interval.
3.1.2. A selection method 2 The following additional or slightly different selec-
tion criteria are used for method 2: - no z-chamber requirements are made and the range of the polar angle is restricted to [ cos 01 < 0.9 for A's, - the impact parameter (do) ofthe higher momentum track, assumed to be a proton, must be larger than 0.5 mm, - in addition to the track pair intersection cuts de- scribed above, a momentum dependent cut on the decay distance is used. It is required that the prob- ability of the A to have decayed before the cal- culated radial distance ( e x p [ - (mA/Pt) • (r /cz) ] ), where cz is the decay length, r the radial distance, and the other quantities are measured in GeV), be less than 95%. In addition, for small A momenta (pt < 1 GeV), we require that this probability be greater than 2% (this cut excludes A's with very long decay distances), - if the reconstructed radius of the decay point is smaller than 25 cm, it is required that the beam inter- section point is found between the points o f closest approach of the two tracks, - the cut on the • angle (see above) of the A can- didate is required to be smaller than 30 mrad and also smaller than 10 mrad + 20 mrad/p~(A), where Pt (A) is measured in GeV, and
- the angle 0* between the proton direction in the A rest frame and the A direction must satisfy [ cos 0"[ < 0.98.
The resulting invariant mass distribution is shown in fig. lb. The number of A's is estimated within a sig- nal region o f + 1 0 MeV for xE (=- EA/E~am) smaller than 0.2 and ± 15 MeV for larger xe values. The back- ground is estimated by sideband subtraction, using the mass intervals between 1090-1100 MeV and 1130- 1140 MeV. In the Monte Carlo events, we find that this method underestimates the background in the sig- nal region by 20% for xE < 0.1 and by 10% for larger momenta. The background estimated from the side- bands is therefore increased by this additional factor and subtracted from the events in the signal region. A systematic error of 50% is assigned for this correction factor. Thus a total of 30 041 A's above a background of 16 016 are reconstructed.
As a cross-check, a cross section is extracted for method 2. Different classes of A topology within the central detector are distinguished. As explained previ- ously, the best mass resolution is obtained when both tracks have z-chamber coordinates. A slightly worse resolution with larger non-gaussian tails is obtained for the other classes, where none of the tracks or ei- ther one of the two tracks has associated z-chamber information, or the ones with [cos 0[ > 0.72, outside of the z-chamber acceptance.
The measured resolution increases almost linearly with momentum and is larger, between approximately 1.0-1.5 MeV, in the data than in the Monte Carlo for each of the different classes, resulting in an extra loss in efficiency because more events are found outside
509
Volume 291, number 4 PHYSICS LETTERS B 1 October 1992
200
175
t~3 150
¢N
~12s e-
3
7
25
0
tit OPAL (a) & A~-,A~*
tt t ~ An*, A1r-
1.26 1.28 1.3 1.32 1.34 1.311 1.38 1.4
Invoriont Moss A~ (GeV)
't: O.
1' <
v
0.2
0.18
0 . 1 6
0 . 1 4
* 0 . 1 2 I
~ 0.1
0 0,08
v,~ 0.0,4 L.I..I
0.02
t OPAL (b)
, , , I . . . . I . . . . I . . . . I . . . . I . . . . I . . . . I , , , , I . . . . I , , ,
0.05 0.1 0.15 0.2 0.25 0.3 0.35 0.4 0.45 ().5 X [
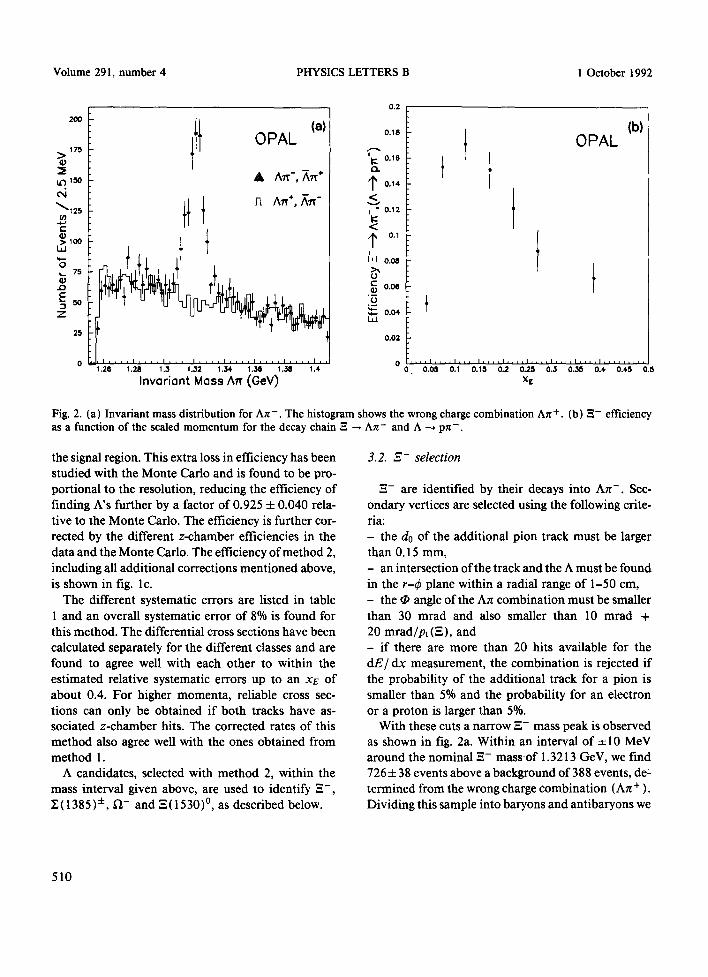
Fig. 2. (a) Invariant mass distribution for An- . The histogram shows the wrong charge combination An +. (b) =-- efficiency as a function of the scaled momentum for the decay chain -~ ---, An- and A ~ pn- .
the signal region. This extra loss in efficiency has been studied with the Monte Carlo and is found to be pro- portional to the resolution, reducing the efficiency of finding A's further by a factor of 0.925 ± 0.040 rela- tive to the Monte Carlo. The efficiency is further cor- rected by the different z-chamber efficiencies in the data and the Monte Carlo. The efficiency of method 2, including all additional corrections mentioned above, is shown in fig. 1 c.
The different systematic errors are listed in table 1 and an overall systematic error of 8% is found for this method. The differential cross sections have been calculated separately for the different classes and are found to agree well with each other to within the estimated relative systematic errors up to an xe of about 0.4. For higher momenta, reliable cross sec- tions can only be obtained if both tracks have as- sociated z-chamber hits. The corrected rates of this method also agree well with the ones obtained from method 1.
A candidates, selected with method 2, within the mass interval given above, are used to identify E - , E ( 1385)+, t2- and ~,(1530) °, as described below.
3.2. 3,- selection
F,- are identified by their decays into A n - . Sec- ondary vertices are selected using the following crite- ria: - the do of the additional pion track must be larger than 0.15 mm, - an intersection of the track and the A must be found in the r-~b plane within a radial range of 1-50 cm, - the • angle of the An combination must be smaller than 30 mrad and also smaller than 10 mrad + 20 mrad/pt ( - ) , and - if there are more than 20 hits available for the dE/d_x measurement, the combination is rejected if the probability of the additional track for a pion is smaller than 5% and the probability for an electron or a proton is larger than 5%.
With these cuts a narrow E - mass peak is observed as shown in fig. 2a. Within an interval of +10 MeV around the nominal E - mass o f 1.3213 GeV, we find 726 ± 38 events above a background of 388 events, de- termined from the wrong charge combination (An + ). Dividing this sample into baryons and antibaryons we
510
Volume 291, number 4 PHYSICS LETTERS B 1 October 1992
find 361 + 27 E - and 365 + 27 ,=+ ~5 The efficiency obtained from the Monte Carlo is
reduced by a factor of 0.91 + 0.05 due to the slightly larger A mass resolution and different z-chamber ef- ficiency in the data and is shown in fig. 2b as a func- tion of the E - energy. The different systematic uncer- tainties which have been studied are listed in table 1 and an overall systematic error of 9% is deduced.
3.3. Q- selection
f~- particles are identified via their decays into A K - with secondary vertices. Due to larger back- ground, stronger criteria are used relative to the ones in section 3.2: - the kaon track candidate must have a Pt above 200 MeV and a do larger than 0.15 mm, - the 4) angle of the A K - combination must be smaller than 30 mrad and also smaller than 10 mrad + 20 mrad/pt ( f2-) ,
- the charged kaon candidate must have more than 20 hits which are used for the dE/dx measure- ment. I f the momentum is smaller than 0.9 GeV, the kaon probability must be larger than 5% and the dE/dx loss must be larger than 7.5 keV/cm. If the momentum is larger than 1.5 GeV, the probability to be a kaon must be larger than 5% and has also to be larger than the correspond- ing pion probability. In the cross-over region be- tween 0.9 and 1.5 GeV, where identification of the kaon becomes difficult, the candidate is re- jected. - T h e probability of the calculated radial decay point of the A K - combination, using the f l - lifetime ( e x p [ - (mn/pt). (r/cz) ] ), must be between 5% and 95%.
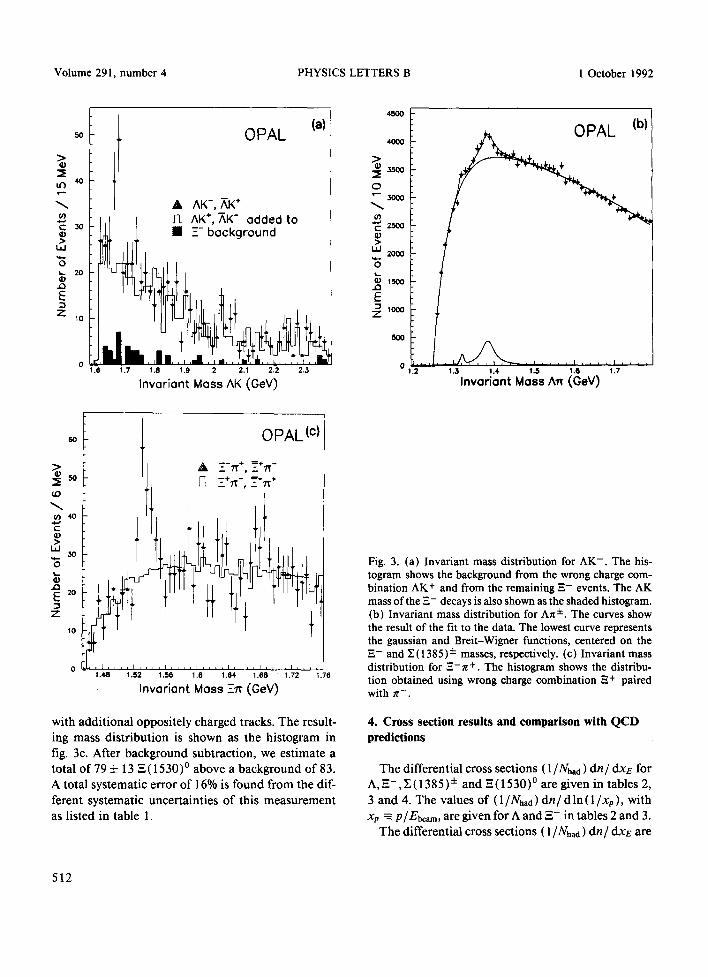
With these cuts the mass spectrum of fig. 3a is ob- tained. A signal of 47 5:11 events is found in an in- terval of + 15 MeV around the ~ - mass of 1.6724 GeV. The background of 42 events, shown as the his- togram in fig. 3a, is obtained from two sources. The dominant background is estimated from the wrong charge combination (AK ÷ ). In addition, E - decays
#5 Previous experiments at lower energies have all reported a slight excess of E- =+ over -- with a combined signifi- cance of 3-4 standard deviations. This excess is not ev- ident when our results are included.
with misidentified pions contribute to the background in the correct charge combination. A total of 41 E - is found from the Art mass peak. The invariant AK mass of these events does not show a peak in the D - mass region and is separately shown as the shaded histogram.
Although the small statistics o f the signal does not allow a detailed study of the systematics, several dis- tributions in the data are found to be well described by the Monte Carlo. A large efficiency uncertainty of 13% comes from the small Monte Carlo statistics, leading to a total error of 17%, see table 1. This error should be compared to the statistical error o f 24%.
3.4. 27(1385) ± and •(1530) ° selection
X(1385) ± and E(1530) ° are identified via their prompt decays into Art ± and -=- rt +, respectively. The following criteria are used to combine the previously identified A and E - candidates with an additional charged particle: - the do of the track must be smaller than 2 ram, and - if there are more than 20 hits useful for the d E / d x measurement, the combination is rejected if the prob- ability for a pion is smaller than 5% while the proba- bility for an electron or a proton is larger than 5%.
With these cuts, a broad Z (1385)± and a narrow E(1530) ° signal are clearly seen in figs. 3b and 3c, respectively. In addition to the X(1385) ± signal, a shoulder from E - decays is also seen in fig. 3b.
The background for the X (1385) ± has been deter- mined using three different methods: (a) the shape from the Monte Carlo simulation, (b) fake A's from track pairs found outside the A mass region, and (c) fitting the Art ± mass spectrum with a background function { e x p [ - a ( x - 1.25)]} x (bx 2 + cx), where x is the mass, a Breit-Wigner resonance with mass and width fixed to the Z ( 1385)± mass and a gaussian peak for the remaining ,E-. This fit is shown in fig. 3b. The three different methods give the same result for the number of Z(1385)+ ' s to within 10%. The num- ber of E( 1385)±'s from the fit is 2480+250. The dif- ferent contributions to the systematic error are listed in table 1, resulting in a total systematic error of 13%.
The background for the ,E (1530) 0 is obtained us- ing wrong charge Art + combinations, with masses be- tween 1.29-1.35 GeV. The -=- mass is assigned to the wrong charge combinations, which are combined
511
Volume 291, number 4 PHYSICS LETTERS B 1 October 1992
> (1)
tO 40
E 3o
> i , i
3 ~ 211
E Z 10
(a) OPAL
0 - - 1.(I i . 7 1.e 1.9 2 2.1 2 .2 2 .3
Invoriont Moss AK (GeV)
A AK-, AK*
.I.- ¢ +
4500
4000
O "-" 3000
O~ "~ 2soo >
W 2 0 0 0
0
.,Q
E
(1~
. . . . 0 1- . . . . .
OPAL (b)
, ~ . i . i J i I i i i i I . . . . 1.3 1 .4 1 .5 1 .6 1 .7
Invoriant Moss An" ( G e V )
60
>
tO
340 E (1)
i , i 30
.D ~: 2o
Z
10
OPAL (c)
A E-'a"", ~*~'- M ?_+~-, _"-~+
1.48 1 ,52 1 .58 1.6 1.64, 1 .68 1.72 1.76
Invariont Mass -TT (GeV)
with additional oppositely charged tracks. The result- ing mass distribution is shown as the histogram in fig. 3c. After background subtraction, we estimate a total of 79 + 13 E (1530)° above a background of 83. A total systematic error of 16% is found from the dif- ferent systematic uncertainties of this measurement as listed in table 1.
Fig. 3. (a) Invariant mass distribution for AK-. The his- togram shows the background from the wrong charge com- bination AK + and from the remaining -=- events. The AK mass of the E- decays is also shown as the shaded histogram. (b) Invariant mass distribution for An ±. The curves show the result of the fit to the data. The lowest curve represents the gaussian and Breit-Wigner functions, centered on the E- and E ( 1385 ) ± masses, respectively. (c) Invariant mass distribution for E--~t +. The histogram shows the distribu- tion obtained using wrong charge combination E + paired with ~- .
4. Cross section results and comparison with QCD predictions
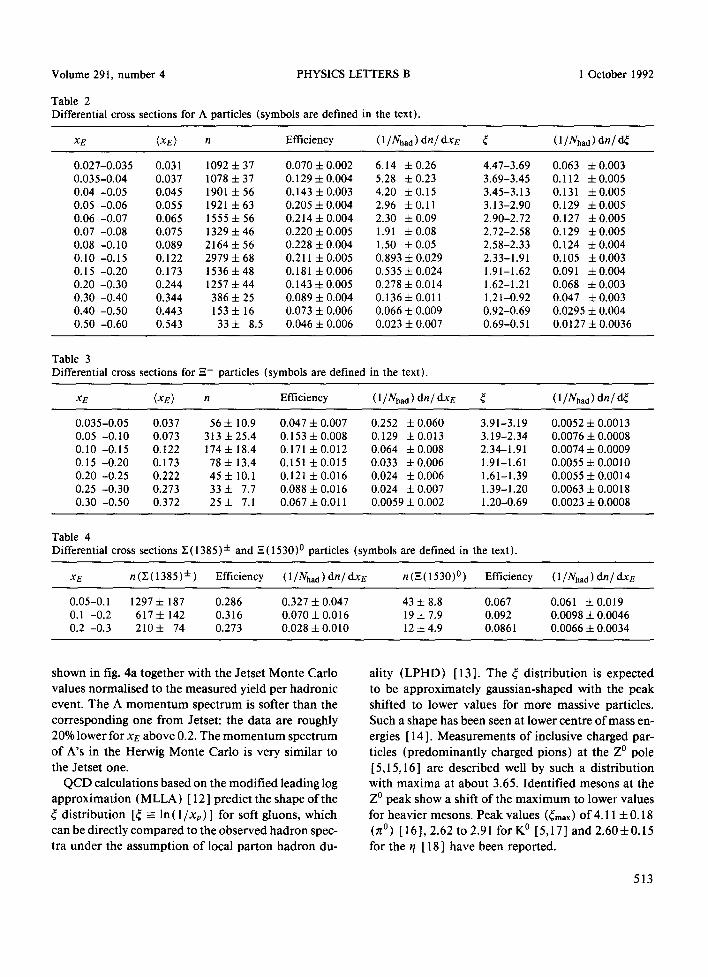
The differential cross sections ( 1/Nhao) d n / d x e for A, -=- ,E(1385) ± and =-(1530) ° are given in tables 2, 3 and 4. The values of ( 1/Nhad) d n / d In ( 1/xp ), with xp - p/Ebearn, are given for A and -=- in tables 2 and 3.
The differential cross sections ( 1/Nhad) d n / d x e are
512
PHYSICS LETTERS B Volume 291, number 4
Table 2 Differential cross sections for A particles (symbols are defined in the text).
XE (XE) n Efficiency ( 1/Nha d )dn / dXE ~ ( 1/Nha d )dn / d~
1 October 1992
0.027-0.035 0.031 1092 5:37 0.070 5:0.002 6.14 ± 0.26 4.47-3.69 0.063 ± 0.003 0.035-0.04 0.037 10784-37 0.1294-0.004 5.28 4-0.23 3.69-3.45 0.112 4-0.005 0.04 -0.05 0.045 1901 4- 56 0.143 ± 0.003 4.20 ± 0.15 3.45-3.13 0.131 + 0.005 0.05 -0.06 0.055 1921±63 0.205-4-0.004 2.96 ±0.11 3.13-2.90 0.129 ±0.005 0.06 -0.07 0.065 15554-56 0.2144-0.004 2.30 ±0.09 2.90-2.72 0.127 ±0.005 0.07 -0.08 0.075 1329±46 0.220±0.005 1.91 4-0.08 2.72-2.58 0.129 5:0.005 0.08 -0.10 0.089 2164 ± 56 0.228 4- 0.004 1.50 ± 0.05 2.58-2.33 0.124 ± 0.004 0.10 -0.15 0.122 2979+68 0.2115:0.005 0.893±0.029 2.33-1.91 0.105 4-0.003 0.15 -0.20 0.173 1536±48 0.181 ±0.006 0.5354-0.024 1.91-1.62 0 .091 ±0.004 0.20 -0.30 0.244 1257 ± 44 0.143 ± 0.005 0.278 ± 0.014 1.62-1.21 0.068 4- 0.003 0.30 -0.40 0.344 386 + 25 0.089 ± 0.004 0.136 ± 0 . 0 1 1 1.21-0.92 0.047 5:0.003 0.40 -0.50 0.443 153 ± 16 0.073 ± 0.006 0.066 5:0.009 0.92-0.69 0.0295 ± 0.004 0.50 -0.60 0.543 33 4- 8.5 0.046 5:0.006 0.023 ± 0.007 0.69-0.51 0.0127 ± 0.0036
Table 3 Differential cross sections for -E- particles (symbols are defined in the text).
XE (XE) n Efficiency ( 1/Nha d ) dn / d-rE ~ ( 1/Nhad ) dn/ d~
0.035-0.05 0.037 56 ± 10 .9 0.047 + 0.007 0.252 4- 0.060 3.91-3.19 0.0052 -4- 0.0013 0.05 -0.10 0.073 313±25.4 0.153±0.008 0.129 ±0.013 3.19-2.34 0.00765:0.0008 0.10 -0.15 0.122 174± 18.4 0.171 ±0.012 0.064 ±0.008 2.34-1.91 0.0074±0.0009 0.15 -0.20 0.173 78± 13.4 0.151 +0.015 0.033 ±0.006 1.91-1.61 0.0055±0.0010 0.20 -0.25 0.222 45 ± 10.1 0.121 ± 0.016 0.024 + 0.006 1.61-1.39 0.0055 ± 0.0014 0.25 -0.30 0.273 33 4- 7.7 0.088 ± 0.016 0.024 4- 0.007 1.39-1.20 0.0063 4- 0.0018 0.30 -0.50 0.372 25 + 7.1 0.067 + 0.011 0.0059 5:0.002 1.20-0.69 0.0023 5:0.0008
Table 4 Differential cross sections E (1385) ± and F, (1530)° particles (symbols are defined in the text).
XE n(Y(1385) ± ) Efficiency (l/Nlaad)dn/dxE n(-(1530) 0 ) Efficiency (1/Nhad)dn/dxE
0.05-0.1 1297+ 187 0.286 0.327+0.047 43+8.8 0.067 0.061 4-0.019 0.1 -0.2 617 + 142 0.316 0.070 4- 0.016 19 4- 7.9 0.092 0.0098 + 0.0046 0.2 -0.3 210 + 74 0.273 0.028 + 0.010 12 ± 4,9 0.0861 0.0066 4- 0.0034
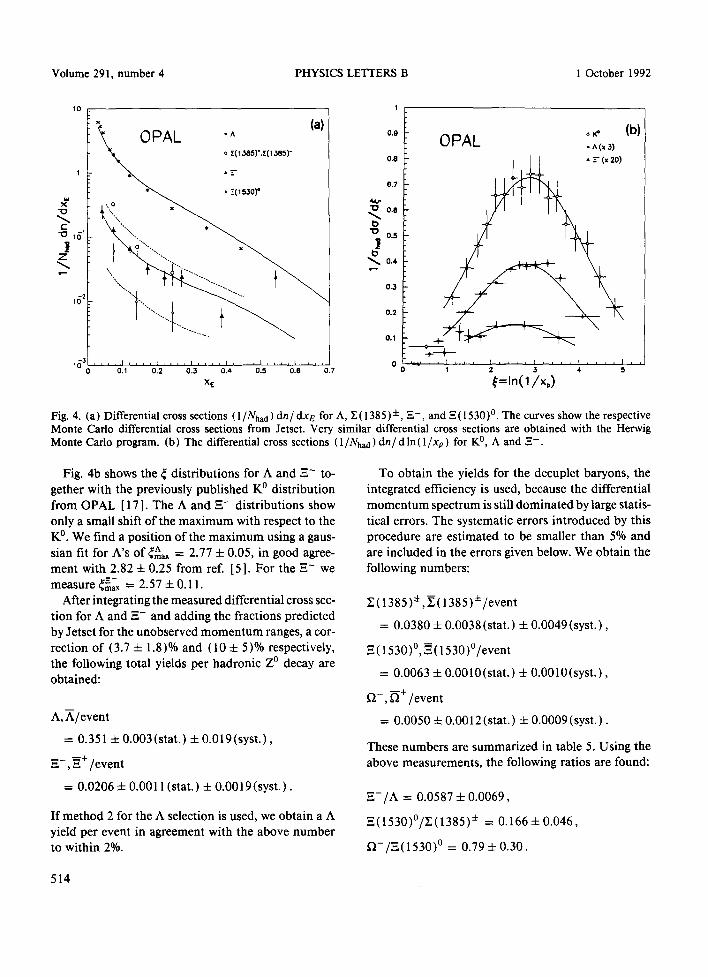
shown in fig. 4a together with the Jetset Monte Carlo
values normalised to the measured yield per hadronic
event. The A momentum spectrum is softer than the
corresponding one from Jetset: the data are roughly
20% lower for xE above 0.2. The momentum spectrum
of A's in the Herwig Monte Carlo is very similar to
the Jetset one.
QCD calculations based on the modified leading log
approximation (MLLA) [ 12 ] predict the shape of the
distribution [~ _ l n ( l / x p ) ] for soft gluons, which
can be directly compared to the observed hadron spec-
tra under the assumption of local parton hadron du-
ality (LPHD) [13]. The ~ distribution is expected
to be approximately gaussian-shaped with the peak
shifted to lower values for more massive particles.
Such a shape has been seen at lower centre of mass en-
ergies [14]. Measurements of inclusive charged par-
ticles (predominantly charged pions) at the Z ° pole
[5,15,16 ] are described well by such a distribution with maxima at about 3.65. Identified mesons at the
Z ° peak show a shift of the maximum to lower values
for heavier mesons. Peak values (~max) of 4.11 + 0.18
(n °) [16], 2.62 to 2.91 for K ° [5,17] and 2 .60+0.15
for the ~/ [l 8] have been reported.
513
Volume 291, number 4 PHYSICS LETTERS B 1 October 1992
1 0
C "O 141 |
Z
~62
L O P A L "^ (a)
1 0 3 - i A . 1 , , , , I . . . . I . . . . I , , , , I , , , , I , , , ,
0 0.1 0.2 0.3 0.4. O.S O.fl 0.7
X~-
0.9
0.8
e.7
~ 0 . 6
0.5 ! ~ 0.4
0.2
0 . 1
° ~. (b) O P A L .,,~.3)
• ~ (x 20)
---V-+
1 2 3 4 S
~=lnO/×,)
\
Fig. 4. (a) Differential cross sections (1/Nha d )dn/ dx E for A, X (1385 )±, =--, and =-( 1530)°. The curves show the respective Monte Carlo differential cross sections from Jetset. Very similar differential cross sections are obtained with the Herwig Monte Carlo program. (b) The differential cross sections ( 1/NhM ) d n / d In ( 1/xp ) for K °, A and -=-.
Fig. 4b shows the ~ distributions for A and .E- to- gether with the previously published K ° distribution from OPAL [17]. The A and ~,- distributions show only a small shift of the maximum with respect to the K °. We find a position of the maximum using a gaus- sian fit for A's of ~Aax = 2.77 4- 0.05, in good agree- ment with 2.82 4- 0.25 from ref. [5]. For the --- we measure ~nax = 2.57 4- 0.11.
After integrating the measured differential cross sec- tion for A and -=- and adding the fractions predicted by Jetset for the unobserved momentum ranges, a cor- rection of (3.7 4- 1.8)% and (10 5: 5)% respectively, the following total yields per hadronic Z ° decay are obtained:
A,A/event
= 0.351 ± 0.003 (stat.) 4- 0.019(syst.),
-=-, E+/event
= 0.0206 4- 0.0011 (stat.) -4- 0.0019(syst.).
I f method 2 for the A selection is used, we obtain a A yield per event in agreement with the above number to within 2%.
To obtain the yields for the decuplet baryons, the integrated efficiency is used, because the differential momentum spectrum is still dominated by large statis- tical errors. The systematic errors introduced by this procedure are estimated to be smaller than 5% and are included in the errors given below. We obtain the following numbers:
~ (1385)± ,E(1385)±/event
= 0.0380 -4- 0.0038(stat.) + 0.0049(syst.),
E(1530) °, --~( 1530)°/event
= 0.0063 4- 0.0010(star.) 4- 0.0010(syst.),
f~-, ~ + / e v e n t
= 0.0050 4- 0.0012(stat.) + 0.0009(syst.).
These numbers are summarized in table 5. Using the above measurements, the following ratios are found:
.~- /A = 0.0587 + 0.0069,
,~(1530)°/E(1385) ± = 0.166 + 0.046,
f~- /E(1530) ° = 0.79 :t: 0.30.
514
Volume 291, number 4 PHYSICS LETTERS B 1 October 1992
Table 5 Inclusive particle yields as measured by OPAL (the statistical and systematic errors are added in quadrature). The values for neharged and K ° are taken from ref. [ 19 ] and ref. [ 17 ] The predictions are from the Jetset and Herwig Monte Carlo programs with default parameters. To describe the octet baryons the extra strangeness suppression value for diquarks in Jetset has been changed to 0.3 from the default of 0.4. For the Herwig Model the cluster mass parameter has been changed to 3.32 to describe the A yield.
Particle n/event (OPAL) Jetset default Jetset tuned Herwig default Herwig tuned
ncharse d 21.4 4- 0.43 21.3 21.3 20.9 21.1 K 0 2.10 4-0.14 2.16 2.15 2.07 2.12 A 0.351 4- 0.019 0.383 0.351 0.427 0.352 -=- 0.0206 4- 0.0021 0.027 0.021 0.062 0.046 Y-(1385) ± 0.0380-4-0.0062 0.074 0.068 0.136 0.I15 .E(1530) ° 0.0063 4- 0.0014 0.0053 0.0048 0.0307 0.0216 fl- 0.0050 4- 0.0015 0.00072 0.00044 0.0095 0.0054
where the errors include both the statistical and sys- tematic contributions and correlated errors have been neglected.
5. C o m p a r i s o n w i t h t h e L u n d d i q u a r k m o d e l
To test baryon production models via diquarks, we use the Jetset Monte Carlo. Within this diquark scheme, several parameters are relevant to baryon pro- duction: - the diquark to quark ratio (qq/q), - the strange to non-strange quark ratio (s/d), - the strange diquark suppression factor (us/ud)x (d/s), - the spin 1 diquark parameter ½ (qql/qq0), and - the popcorn parameter.
The diquark to quark ratio regulates the overall baryon rate and the s/d suppression is mainly deter- mined by the kaon yield. In Jetset, A's are produced to a large extent from the combination of ud-diquarks and a single s-quark. Thus, the single s-quark con- tributes to the A and K ° yield in about the same way and the ratio of the two particle yields is almost pro- portional to the ratio of ud-diquark to d-quarks in the fragmentation process. An uncertainty of about 20% exists, however, because A's are also produced via strange diquarks and from the decays of decuplet baryons. Table 5 shows the baryon yields obtained using Jetset with its default parameters, qq/q = 0.1, s/d=0.3, (us/ud)x (d/s)=0.4, -~ (qql/qq0)=0.05 and 50% popcorn probability. The strange octet baryons are described to within 20%. A simple change
of the (us/ud) x (d/s) parameter to 0.3 4- 0.03 results in a good description of the K °, A, and -=- rates, as shown in table 5 ("Jetset tuned"). However, the de- cuplet baryons are, in general, not well described. The corresponding baryon rates from the Herwig Monte Carlo version 5.0 [6] with its default parameters are also shown in table 5. Even after changing the clus- ter mass parameter from its default value of 3.5 #6 to 3.32 4- 0.05 ("Herwig tuned"), the other baryons differ by up to a factor of three from the measured values, although the f l - rate is described.
To investigate whether the different decuplet baryon rates can be reproduced by Jetset, we have performed further studies. In these studies the pa- rameter s/d was fixed to 0.285 to describe our mea- sured K ° yield [17]. The parameter qq/q was left unchanged from its default value of 0.1 since it de- scribes the measured K ° and A yields. The other three parameters, which mainly determine the rela- tive baryon production rates, were varied over a wide range. No clear evidence for or against the popcorn mechanism exists: we accordingly used values of 0%, 50% and 100% for the popcorn parameter.
The popcorn parameter [20] defines the probabil- ity to form an additional meson between a baryon- antibaryon pair. Two additional parameters exist within the popcorn scheme as implemented in Jetset. These additional parameters regulate the strangeness suppression if a meson is produced between the baryon-antibaryon pair. Their default values result
,6 The default value in version 5.4 has been changed to 3.35 to describe the measured OPAL A rate.
515
Volume 291, number 4 PHYSICS LETTERS B 1 October 1992
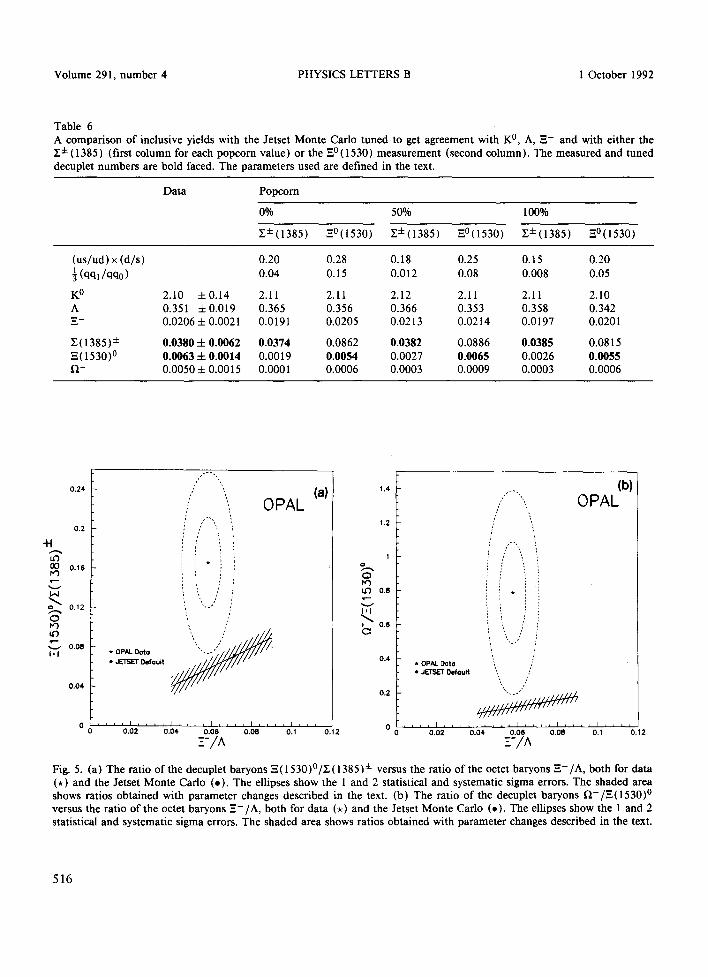
Table 6 A comparison of inclusive yields with the Jetset Monte Carlo tuned to get agreement with K °, A, " _ and with either the Z ± (1385 ) (first column for each popcorn value) or the --0 (1530) measurement (second column). The measured and tuned decuplet numbers are bold faced. The parameters used are defined in the text.
Data Popcorn
0% 50% 100%
Z±(1385) E°(1530) Z±(1385) E°(1530) Z±(1385) "_0(1530)
(us/ud) × (d/s) 0.20 0.28 0.18 0.25 0.15 0.20 ½ (qq]/qq0 ) 0.04 0.15 0.012 0.08 0.008 0.05
K ° 2.10 4-0.14 2.11 2.11 2.12 2.11 2.11 2.10 A 0.351 + 0.019 0.365 0.356 0.366 0.353 0.358 0.342 E - 0.0206 4- 0.0021 0.0191 0.0205 0.0213 0.0214 0.0197 0.0201
E(1385) ± 0.0380 4- 0.0062 0.0374 0.0862 0.0382 0.0886 0.0385 0.0815 , (1530) o 0.0063 -4- 0.0014 0.0019 0.0054 0.0027 0.0065 0.0026 0.0055 f l - 0.0050 4- 0.0015 0.0001 0.0006 0.0003 0.0009 0.0003 0.0006
0.24
0 . 2
-H to O0 0.16
C ,
0.12
o r,'3 to
0.08 I '1
0.04
,,--,,
/
OPAL , . " " , ,
i ',,,../ /
* OPAL Data ' " , - , ' ~ / / / / S / / / " • JETSET D e f a u l t
(a)
, , , , I , , , , I . . . . I . . . . I . . . . I . . . . 0 . 0 2 0.04 O.O6 0.08 O. 1 O. 12 z-/^
1.4
1.2
1
o i,,3 I .~ 0 . 8
v I , I
0 . 6 c :
0.4
0 . 2
/." " , , /
,' '.,, ,,"
(b)
OPAL
: //"'',,,, ,,
1 t i
j
",,..// * OPAL. Data 't ': • J~-TSb'T ~ f a u l t ~ / ',, ,,
, , ,'
0.02 0.04 0 . 0 6 0 . 0 8 0.1 O. 12
--/A
Fig. 5. (a) The ratio of the decuplet baryons E (1530)°/Y-( 1385 ) ± versus the ratio of the octet baryons - - / A , both for data ( , ) and the Jetset Monte Carlo ( , ) . The ellipses show the 1 and 2 statistical and systematic sigma errors. The shaded area shows ratios obtained with parameter changes described in the text. (b) The ratio of the decuplet baryons f ~ - / E ( 1 5 3 0 ) 0 versus the ratio of the octet baryons , - / A , both for data (*) and the Jetset Monte Carlo ( , ) . The ellipses show the 1 and 2 statistical and systematic sigma errors. The shaded area shows ratios obtained with parameter changes described in the text.
516
Volume 291, number 4 PHYSICS LETTERS B 1 October 1992
in additional suppression of strange mesons and baryons. Because of simple spin counting, the pro- duction of decuplet baryons relative to octet baryons is enhanced, if mesons are produced between the baryon and the antibaryon. No additional parameters are implemented, which would modify this decuplet enhancement.
To simplify the comparison of the results for the strangeness and spin suppression diquark parame- ters, we modified the popcorn model to have iden- tical strange quark treatment for the different pop- corn values. To do so, the two additional parameters within the popcorn scheme were changed from the default value of 0.5 to 1. Table 6 gives a summary of the results. The parameters (us/ud) x (d/s) and ½ (qql/qq0) were varied to give agreement with the octet baryons and either the E(1385) ± (column 1 of each popcorn value) or the E(1530) ° (column 2 of each popcorn value) yield. We were not able to describe the r - yield by this approach.
From these studies, we find that the diquark pa- rameters are strongly correlated and can only be estimated accurately if the popcorn parameter is first fixed. We also find that the ratios of the in- clusive yields for E - / A and E(1530)°/~(1385) ± or f~-/E(1530) ° cannot be varied independently within the current model. For all studied param- eters, the ratio values obtained from the Monte Carlo are shown by the hatched bands in figs. 5a and 5b and are in disagreement with the measure- ments.
For a more sophisticated and conclusive study of diquark models, more measurements of other baryon species and also of correlations are clearly needed.
6 . S u m m a r y
We have measured the production cross sections of several strange octet and decuplet baryons in hadronic Z ° decays.
From our measurements, the following conclusions on baryon production models can be drawn: - the momentum spectrum of the A is softer than the one which is predicted by either the Jetset or the Herwig Monte Carlo,
- the default values for baryon production within the Jetset diquark scheme need only small modifications to describe the octet baryon yields, if the decuplet results are ignored, - the Herwig Monte Carlo, with fewer free parame- ters, cannot describe the overall observed octet or de- cuplet baryon rates, - the yields of the different decuplet baryons cannot be described by just one spin 1 suppression factor, and - the amount of diquark splitting due to the popcorn mechanism has a strong influence on the other param- eter values and no accurate determination of the var- ious diquark parameters is possible without a better knowledge of the importance of the popcorn mecha- nism.
A c k n o w l e d g e m e n t
We thank T. Sj6strand for various interesting dis- cussions about section 5 of this letter. We also thank the SL Division for the efficient op- eration of the LEP accelerator and their continuing close cooperation with our experimental group. In addition to the support staff at our own institutions we are pleased to acknowledge the Department of Energy, USA, National Science Foundation, USA, Science and Engineering Research Council, UK, Natural Sciences and Engineering Research Council, Canada, Israeli Ministry of Science, Minerva Gesellschaft, Japanese Ministry of Education, Science and Culture (the Monbusho) and a grant under the Monbusho International Science Research Program, American Israeli Bi-national Science Foundation, Direction des Sciences de la Mati~re du Commis- sariat h l'Energie Atomique, France, Bundesministerium fiir Forschung und Technologie, FRG, National Research Council of Canada, Canada, A.P. Sloan Foundation and Junta Nacional de Investiga~o Cientifica e Tecnol6gica, Portugal.
517
Volume 291, number 4 PHYSICS LETTERS B 1 October 1992
References
[ 1 ] See e.g.D. Saxon, preprint RAL-88-102; P. M~ittig, Phys. Rep. 177 (1989) 141.
[2] Particle Data Group, K. Hikasa et al., Phys. Rev D 45 (1992) 1.
[3] MARK2 Collab., S.R. Klein et al., Phys. Rev. Lett. 59 (1987) 2412.
[4] B. Anderson et al., Phys. Rep. 97 (1983) 31; T. Sj6strand, Comput. Phys. Commun. 39 (1986) 347; CERN preprint CERN-TH.6488/92; T. Sj6strand and M. Bengtsson, Comput. Phys. Commun. 43 (1987) 367.
[5] DELPHI Collab., P. Abreu et al., Phys. Lett. B 275 (1992) 231.
[6] G. Marchesini et al., Cambridge preprint Cavendish- HEP-91/26 and DESY 91-048.
[7] OPAL Collab., M. Ahmet et al., Nucl. Instrum. Methods A 305 (1991) 275.
[8] M. Hauschild et al., Nucl. Instrum. Methods A 314 (1992) 74.
[9] P. Billoir, Nucl. Instrum. Methods 225 (1984) 352. [10] OPAL Collab., G. Alexander et al., Z. Phys. C 52
(1991) 175. [ l l ] J . Allison et al., preprint CERN-PPE/91-234, sub-
mitted to Nucl. Instrum. Methods
[12] Y.I. Azimov, Y.L. Dokshitzer, V.A. Khoze and S.I. Troyan, Z. Phys. C 27 (1985) 65; Y.L. Dokshitzer, V.A. Khoze and S.I. Troyan, Perturbative QCD, ed. A.H. Mueller (World Scientific, Singapore, 1989); V.A. Khoze, Y.L Dokshitzer and S.I. Troyan, LUND preprint LU TP 90-12 (1990).
[13] D. Amati and G. Veneziano, Phys. Lett. B 83 (1979) 87; Y.I. Azimov, Y.L Dokshitzer, V.A. Khoze and S.I. Troyan, Phys. Lett. B 165 (1985) 147.
[ 14] TASSO Collab., M. Althoffet al., Z. Phys. C 22 (1984) 307.
[ 15] OPAL Collab., M.Z. Akrawy et al., Phys. Lett. B 247 (1990) 617.
[16] L3 Collab., B. Adeva et al., Phys. Lett. B 259 (1991) 119.
[17] OPAL Collab., G. Alexander et al., Phys. Lett. B 264 (1991) 219.
[ 18 ] L3 Collab., O. Adriani et al., preprint CERN-PPE/92- 83.
[ 19 ] OPAL Collab., P.D. Acton et al., Z. Phys. C 53 (1992) 539.
[20] B. Andersson, G. Gustafson and T. Sj6strand, Phys. Scr. 32 (1985) 574.
518


![Baryon Stability on the Higgs Dissolution Edge : violation ... · Baryon Stability on the Higgs Dissolution Edge : Threshold corrections and suppression of Baryon ... (RPP) GUTs[2–8]isuse](https://img.pdfslide.net/doc/110x75/5ca1c77088c99335108cc886/baryon-stability-on-the-higgs-dissolution-edge-violation-baryon-stability.jpg)