Embed Size (px)
Citation preview
A Mega-Experimentin Jewish Education:The Impact ofbirthright israel
A Publication of theMaurice and Marilyn Cohen Centerfor Modern Jewish StudiesBrandeis University
Leonard Saxe, Ph.D.Charles Kadushin, Ph.D.Shaul Kelner, M.Phil.Mark I. Rosen, Ph.D.Erez Yereslove
birthright israel Research Report 3January 2002
About the Cohen Center for Modern Jewish StudiesThe Maurice and Marilyn Cohen Center for Modern Jewish Studies at Brandeis University is a
multi-disciplinary research institute dedicated to the study of modern American Jewry. Our
mission is to enhance understanding of the Jewish community and the development of religious
and cultural identity. The Center's faculty and staff includes psychologists, sociologists, and
Jewish studies scholars, whose interests include Jewish identity, Jewish culture, family life,
religious expression, and Israel-Diaspora relations. A broad range of research is conducted by
Center faculty, spanning studies of individuals and institutions. Our research applies cutting-
edge methods and theories to the study of modern Jewry and our work is disseminated to both
public and academic groups.
The authors gratefully acknowledge Taglit / birthright israel International and the Andrea and
Charles Bronfman Philanthropies for their support of this research and its publication, and
Professor Barry Chazan for his helpful guidance and feedback. In addition, we wish to thank
Joseph Fishman and Tanya Price for their assistance in the preparation of this report. We are
also grateful to the staff of birthright israel in Jerusalem and New York who help to make our work
possible, and to the thousands of birthright israel applicants and participants who gave
generously of their time to complete our surveys and interviews.
Research Reports and Program Information About birthright israel
Additional research reports about birthright israel:
Saxe, L., Kadushin, C., Pakes, J., Kelner, S., Sternberg, L., Horowitz, B., Sales, A., & Brodsky, A.(2000). birthright israel Launch Evaluation: Preliminary Findings. (birthright israel Research Report 1).
Waltham, MA: Brandeis University, Cohen Center for Modern Jewish Studies.
Kelner, S., Saxe, L., Kadushin, C., Canar, R., Lindholm, M., Ossman, H., Perloff, J., Phillips, B., Teres,R., Wolf, M., & Woocher, M. (2000). Making Meaning: Participants’ Experience of birthright israel.(birthright israel Research Report 2). Waltham, MA: Brandeis University, Cohen Center for Modern
Jewish Studies.
Saxe, L., Kadushin, C., Kelner, S., Rosen, M., & Yereslove, E. (2001). A Mega-Experiment in JewishEducation: The Impact of birthright israel. (birthright israel Summary Report 1). Waltham, MA:
Brandeis University, Cohen Center for Modern Jewish Studies. [Abbreviated version of ResearchReport 3]
Kelner, S., Saxe, L., & Kadushin, C. (Forthcoming, 2002). birthright israel Evaluation: The SecondCohort. (birthright israel Research Report 4). Waltham, MA: Brandeis University, Cohen Center for
Modern Jewish Studies.
Research reports may be obtained by contacting:
The Cohen Center for Modern Jewish StudiesBrandeis University, Mailstop 014, Waltham, Massachusetts 02454781/736-2060 www.brandeis.edu/cmjs [email protected]
Program information about birthright israel:
Expanding the Vision: A Pre-Post Educational Program
Revised Educational Standards 2001
Program information may be obtained by contacting:
birthright israel USA
521 Fifth Avenue, 27th Floor, New York, NY 10175888/994-7723 www.birthrightisrael.com [email protected]
Taglit birthright israel International
Beit Hashenhav, 12 Beit Hadfus Street, Jerusalem 95483 Israel972 2 652-8222 [email protected]
The Cohen Center for Modern Jewish StudiesBrandeis UniversityMailstop 014
Waltham, Massachusetts 02454781/736-2060www.brandeis.edu/cmjs
A Mega-Experimentin Jewish Education:The Impact ofbirthright israel
i

ii
Professor Barry ChazanHebrew UniversityCo-Chair, Education Committee, birthright israel
We may be on the threshold of a new era in our understanding of Jewish education and Jewish
identity. Former myths are being reconsidered and new visions are being created.
Older notions of Jewish education saw it as aimed at children, housed in schools, and focused on
either cognitive transmission or communal solidarity. Newer notions see it as lifelong, taking place ona campus that extends beyond classrooms, and focused on shaping the total, holistic self. The clientsof Jewish education are, increasingly, Jews of all ages — from preschoolers and their parents, to
adolescents, university students and young adults, to adults and senior citizens. The venues ofJewish education are, increasingly, not just in school buildings in the local community, but in thelarger Jewish world — learning takes place in day and supplementary schools, Jewish community
centers, summer camps, college campuses, and on trips to Europe and Israel. The emerging aim ofJewish education, regardless of age level or setting, is to touch the inner soul and to affect the Jewwithin.
Older notions of identity focused on the influence of Jewish schooling, measured it in terms of ritualbehavior, and divided the emerging populations into "the identified" and "the unaffiliated." More
recently, researchers are beginning to look at other influential factors beyond schools. They areseeking new measures of Jewishness beyond ritual and are questioning the validity of the affiliated-unaffiliated dichotomy.
Nowhere are these emerging metamorphoses being more creatively studied and described than inthe unfolding body of research on birthright israel being conducted by the Cohen Center for Modern
Jewish Studies at Brandeis University. This research was initiated because of a desire on the part ofthe founders of the birthright israel program to closely examine the impact of the experience onparticipants. What started as straightforward input-output analysis is emerging as potentially
breakthrough social science research with powerful educational policy implications.
Four significant hypotheses are beginning to emerge from the work of Leonard Saxe, Charles
Kadushin, and their colleagues:
1) The so-called unaffiliated, about which organized Jewry is so distraught, may not be a "lost tribe"
after all. They may be neither lost nor unaffiliated. Rather, they may simply have been waiting for us toreach out and talk to them. birthright israel trips seem to initiate such a conversation.
2) Jewish identity may best be viewed as developing through an extended journey, and a criticalelement of this journey may simply be to get young people started on a personal trajectory. If properlysupported, travels on this journey could lead to increased levels of Jewish commitment, and a
birthright israel trip seems to be a very important stop.
3) Young Jews may be hungry for peak Jewish experiences, and a birthright israel trip seems to
satisfy this hunger. The trip is not experienced solely as a once-in-a-lifetime "banquet," but insteadseems to whet participants' appetites for more Jewish nourishment.
4) A birthright israel trip uncovers, often unexpectedly, the power of the experience of Jewishcollectivity for many young Jews. They discover the magic of being with other young Jews — andthey enjoy it. This may provide significant clues about appropriate directions for Jewish communal life
in the months and years after the trip.
Foreword
iii

The Cohen Center team is not only doing the job it was engaged to do, it may also be chartingentirely new directions. Its numbers and findings are obviously gratifying to the founders of birthrightisrael, but more significantly, its findings may be generating a new understanding of the nextgeneration of youth and young adults in American Jewry. This new research is particularly innovativesince it is the start of what we hope will be a major longitudinal study of young North American Jews.
Our intent is to track them and learn from them for years to come.
The rhetoric of birthright israel has always emphasized that the ten days that participants spend in
Israel are the beginning of a lifetime journey. With the help of our Cohen Center colleagues, thebirthright israel Education Committee hopes to track, understand, and ameliorate this journey in thedecade ahead.
We may be on the threshold of a new era in the fields of Jewish education and Jewish identity. Readthis report — and stay tuned — to find out what is ahead!
iv
Contents Foreword iii
Executive Summary ix
Introduction 1
A Mega-Experiment in Jewish Education 3
Program Theory 3
birthright israel: The First Wave 5
Research on Jewish Identity and the Israel Experience 6
Present Study 7
Findings 3
Participant Profile 11
Attitudes Before the Trip 12Jewish Affiliation and Upbringing
Experiences During the Trip 14Feelings About the Trip
Strongest Memories of the Trip
Holiness in the Holy Land: Spiritual Experiences of Participants
Impact: How Did the Trip Affect Participants? 17The Program’s Impact on Jewish Identity
Salience of Jewish IdentityPeoplehood and Religion as Aspects of Jewish Identity
Political Attitudes Regarding Israel
Returning to Israel: Action and IntentionAlumni Who Have Already Returned to IsraelThe Intention to ReturnInfluences Affecting a Future Trip to IsraelInfluencing Others to Go to Israel
Jewish Life at Home: Just What Did Participants Do Differently After the Trip? 26Jewish Social Networks
Contacts with Others from the TripJewish FriendshipsContacts with Trip Staff and Israelis
Changes in Jewish Activities
Ritual Observance
v

Understanding Post-Trip Engagement 30Accounting for Variation in Post-Trip Engagement
Students and Non-StudentsSimilarities and Differences Between Students and Non-StudentsFollow-Up Activities for AlumniExplaining Student/Non-Student Differences
The Effect of the School Attended
Conclusions 35
What Are We Learning?
Post-Trip Programming
Next Steps
Appendix A:Comparisons of United States and Canadian Participants 43
Appendix B:Methodology 49
References 59
vi
Figure 1: Ages of U.S. Participants at Time of Trip 11
Figure 2: Student Status of Participants One Year After Trip 11
Figure 3: Participant Denomination Prior to Trip 12
Figure 4: Family Background of Participants 13
Figure 5: Participants' Jewish Activities in Childhood 13
Figure 6: Participants' Reactions to the Trip 14
Figure 7: Strongest Trip Memories 15
Figure 8: Importance of Being Jewish 18
Figure 9: Importance of Marrying a Jew 19
Figure 10: Importance of Raising Children as Jews 19
Figure 11: Exploration of Judaism 20
Figure 12: Aspects of Jewish Identity 21
Figure 13: Connection to Israel 21
Figure 14: Connection to the Jewish People 22
Figure 15: Participant Reasons for Visiting Israel After the Trip 23
Figure 16: Likelihood of Going to Israel in the Future 24
Figure 17: Factors Influencing a Future Trip to Israel 24
Figure 18: Influencing Others to Apply for a Future Trip 25
Figure 19: Outcomes of Influencing Others to Apply for a Future Trip 25
Figure 20: Contacts with Other Participants One Year After the Trip 26
Figure 21: Proportion of Close Jewish Friends 27
Figure 22: Proportion of Close Jewish Friends and Contacts withOthers From the Trip 27
Figure 23: Student Participation in Jewish Activities 28
Figure 24: Following News About Israel 28
Figure 25: Engagement in Jewish Study 29
Figure 26: Characteristics of Participants Associated with Post-Trip Engagement 30
Table A1: Summary of Differences Between U.S. and Canadian Participants 46
Table B1: Trip Participation Discrepancies Between Database and Self-Reports 51
Chart B1: Survey Responses Over Time 52
Figures,Tables andCharts
vii
viii
Table B2: Number of Non-Responding Participants Receiving Intensive Follow-UpCategorized by Validity of Database Contact Information 52
Table B3: Responses Categorized by Date of Response and Nature of Follow-Up 53
Table B4: Response Rates by Respondent Status 53
Table B5: Response Rates by Type of Follow-Up 53
Table B6: Response Rates by Gender and Nationality 54
Table B7: Mean Values for Attitudinal Indices by Response Date 54
Table B8: Mean Values for Attitudinal Indices by Type of Follow-Up 55
Table B9: Date of Response by Gender 55
Table B10: Date of Response by Age 55
A Mega-Experiment in Jewish Education:The Impact of birthright israel
Leonard Saxe, Charles Kadushin, Shaul Kelner, Mark Rosen, and Erez Yereslove
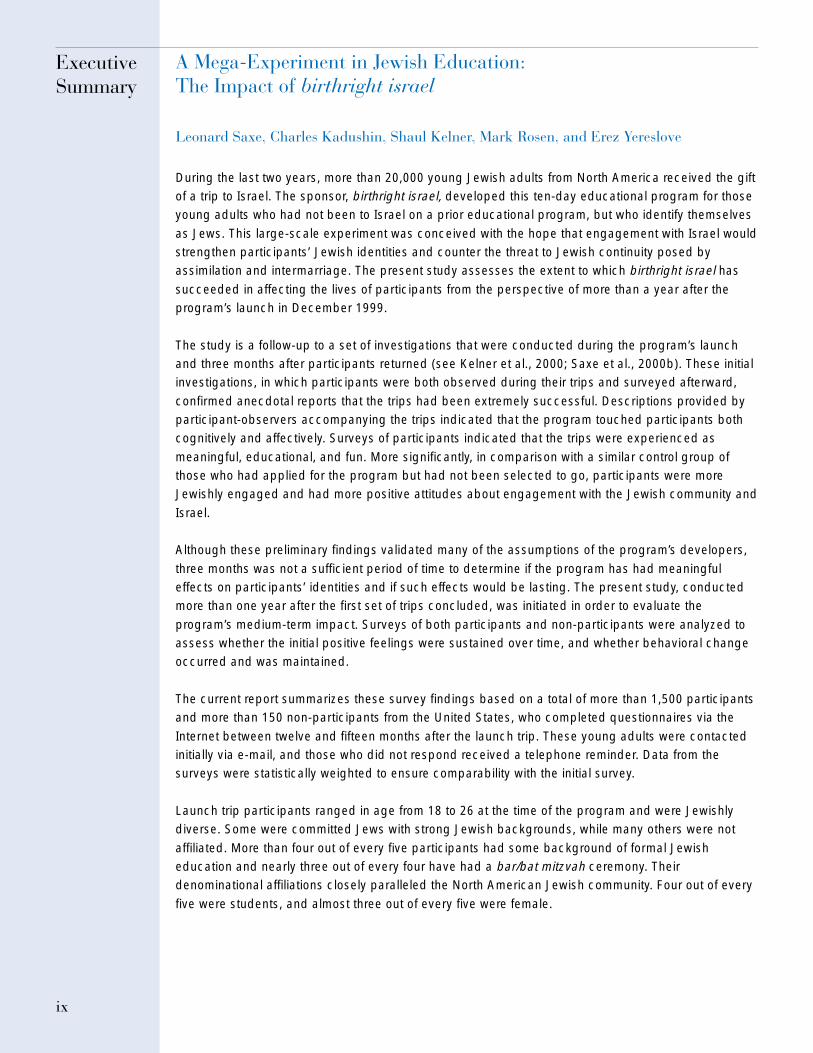
During the last two years, more than 20,000 young Jewish adults from North America received the giftof a trip to Israel. The sponsor, birthright israel, developed this ten-day educational program for thoseyoung adults who had not been to Israel on a prior educational program, but who identify themselves
as Jews. This large-scale experiment was conceived with the hope that engagement with Israel wouldstrengthen participants’ Jewish identities and counter the threat to Jewish continuity posed byassimilation and intermarriage. The present study assesses the extent to which birthright israel has
succeeded in affecting the lives of participants from the perspective of more than a year after theprogram’s launch in December 1999.
The study is a follow-up to a set of investigations that were conducted during the program’s launchand three months after participants returned (see Kelner et al., 2000; Saxe et al., 2000b). These initialinvestigations, in which participants were both observed during their trips and surveyed afterward,
confirmed anecdotal reports that the trips had been extremely successful. Descriptions provided byparticipant-observers accompanying the trips indicated that the program touched participants bothcognitively and affectively. Surveys of participants indicated that the trips were experienced as
meaningful, educational, and fun. More significantly, in comparison with a similar control group ofthose who had applied for the program but had not been selected to go, participants were moreJewishly engaged and had more positive attitudes about engagement with the Jewish community and
Israel.
Although these preliminary findings validated many of the assumptions of the program’s developers,
three months was not a sufficient period of time to determine if the program has had meaningfuleffects on participants’ identities and if such effects would be lasting. The present study, conductedmore than one year after the first set of trips concluded, was initiated in order to evaluate the
program’s medium-term impact. Surveys of both participants and non-participants were analyzed toassess whether the initial positive feelings were sustained over time, and whether behavioral changeoccurred and was maintained.
The current report summarizes these survey findings based on a total of more than 1,500 participantsand more than 150 non-participants from the United States, who completed questionnaires via the
Internet between twelve and fifteen months after the launch trip. These young adults were contactedinitially via e-mail, and those who did not respond received a telephone reminder. Data from thesurveys were statistically weighted to ensure comparability with the initial survey.
Launch trip participants ranged in age from 18 to 26 at the time of the program and were Jewishlydiverse. Some were committed Jews with strong Jewish backgrounds, while many others were not
affiliated. More than four out of every five participants had some background of formal Jewisheducation and nearly three out of every four have had a bar/bat mitzvah ceremony. Theirdenominational affiliations closely paralleled the North American Jewish community. Four out of every
five were students, and almost three out of every five were female.
ExecutiveSummary
ix

The follow-up study demonstrated that the initial impact of the program was sustained over the courseof more than a year:
The trips continued to be seen as fun, meaningful, and educational.More than a year after the trip, participants continued to describe their experience very positively. Thepercentages of participants who described it as fun, meaningful, and educational were virtually
identical to the percentages obtained three months after the trip. Participants’ strongest memorieswere, almost exclusively, of the key historical sites and activities with religious significance: the Kotel,Masada, Jerusalem, Shabbat, the Dead Sea, and Yad Vashem.
Participants had a stronger sense of Jewish identity.Responses to the question: “How important in your life is being Jewish?” indicated a stronger sense
of Jewish identity among participants in comparison with non-participants. Before the trip, there wereno differences between these two groups. In addition, the percentages twelve to fifteen months afterthe program were almost the same as those obtained three months after the trip, indicating that the
trip’s positive impact on Jewish identity remained strong.
Participants were more likely to want to marry a Jew and raise their children as Jews.Participants were more likely than non-participants to indicate that marrying a Jewish person and
raising Jewish children were important. Again the percentages remained consistent over time.
Participants were more likely to feel it was important to remember the Holocaust, to careabout Israel, and to support Jewish organizations.When asked about various “ways of being Jewish,” participants were more likely than non-participants to indicate that it was important to remember the Holocaust. Participants were much
more likely to care about Israel than non-participants. Participants were also more likely to indicatethat supporting Jewish organizations was important. Both participants and non-participants gave lowratings to dimensions relating to Jewish ritual.
Participants had a stronger sense of connection to the Jewish people and were more likely toindicate they were exploring their Jewishness.In contrast with non-participants, participants developed a stronger connection to the Jewish peopleas a result of the trip and their sense of connection remained strong a year after the trip. They alsowere more likely to indicate that they were exploring their Jewishness.
Participants felt a stronger sense of connection to Israel.Participants’ sense of connection to Israel, which was not strong prior to the trip, became much
stronger after the trip and remained strong a year later. Non-participants were much less likely toindicate a sense of connection. There were no differences between participants and non-participantson attitudes toward Israeli-Palestinian negotiations.
Some participants returned to Israel and many others wanted to return.Several hundred participants visited Israel again after their birthright israel trip. Most returned foreducational programs or vacation. When participants were asked whether they intended to return
within the next two years, almost half said a return was likely.
x
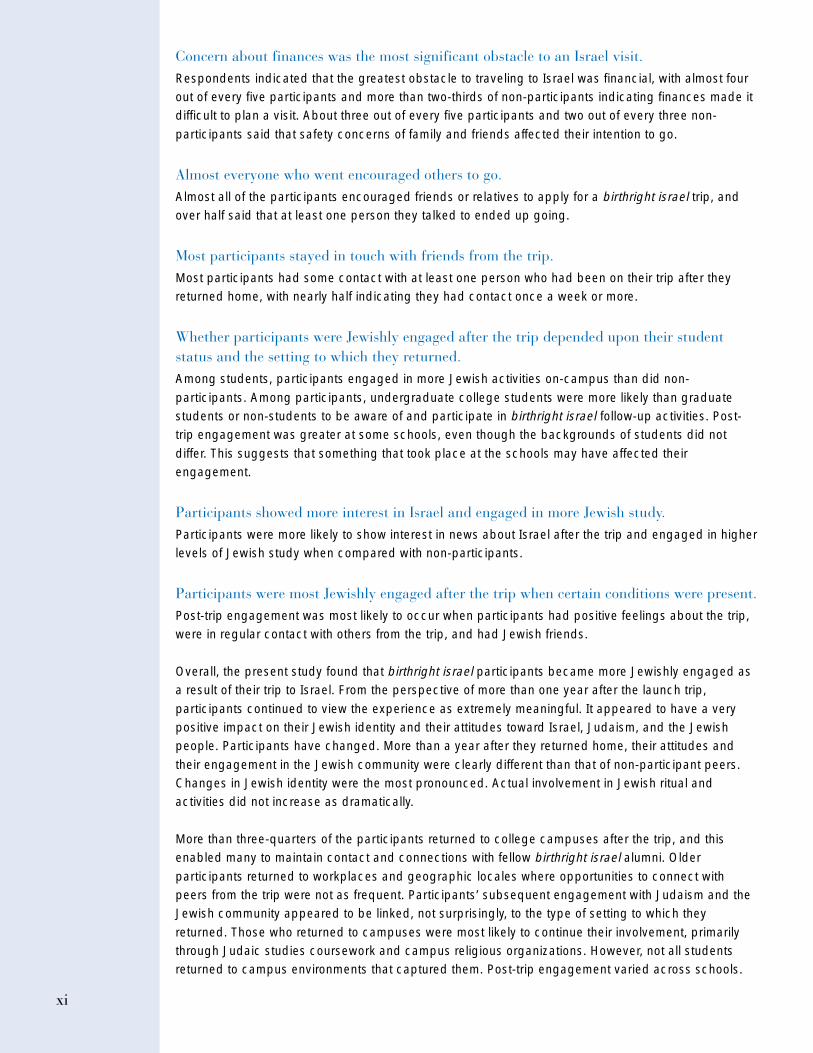
Concern about finances was the most significant obstacle to an Israel visit.Respondents indicated that the greatest obstacle to traveling to Israel was financial, with almost fourout of every five participants and more than two-thirds of non-participants indicating finances made itdifficult to plan a visit. About three out of every five participants and two out of every three non-
participants said that safety concerns of family and friends affected their intention to go.
Almost everyone who went encouraged others to go.Almost all of the participants encouraged friends or relatives to apply for a birthright israel trip, andover half said that at least one person they talked to ended up going.
Most participants stayed in touch with friends from the trip.Most participants had some contact with at least one person who had been on their trip after theyreturned home, with nearly half indicating they had contact once a week or more.
Whether participants were Jewishly engaged after the trip depended upon their studentstatus and the setting to which they returned.Among students, participants engaged in more Jewish activities on-campus than did non-
participants. Among participants, undergraduate college students were more likely than graduatestudents or non-students to be aware of and participate in birthright israel follow-up activities. Post-trip engagement was greater at some schools, even though the backgrounds of students did not
differ. This suggests that something that took place at the schools may have affected theirengagement.
Participants showed more interest in Israel and engaged in more Jewish study.Participants were more likely to show interest in news about Israel after the trip and engaged in higherlevels of Jewish study when compared with non-participants.
Participants were most Jewishly engaged after the trip when certain conditions were present.Post-trip engagement was most likely to occur when participants had positive feelings about the trip,were in regular contact with others from the trip, and had Jewish friends.
Overall, the present study found that birthright israel participants became more Jewishly engaged asa result of their trip to Israel. From the perspective of more than one year after the launch trip,
participants continued to view the experience as extremely meaningful. It appeared to have a verypositive impact on their Jewish identity and their attitudes toward Israel, Judaism, and the Jewishpeople. Participants have changed. More than a year after they returned home, their attitudes and
their engagement in the Jewish community were clearly different than that of non-participant peers.Changes in Jewish identity were the most pronounced. Actual involvement in Jewish ritual andactivities did not increase as dramatically.
More than three-quarters of the participants returned to college campuses after the trip, and thisenabled many to maintain contact and connections with fellow birthright israel alumni. Older
participants returned to workplaces and geographic locales where opportunities to connect withpeers from the trip were not as frequent. Participants’ subsequent engagement with Judaism and theJewish community appeared to be linked, not surprisingly, to the type of setting to which they
returned. Those who returned to campuses were most likely to continue their involvement, primarilythrough Judaic studies coursework and campus religious organizations. However, not all studentsreturned to campus environments that captured them. Post-trip engagement varied across schools.
xi

Given the breadth of religious and cultural diversity among these young Jews, a variety of programsneed to be developed to provide ways for them to continue their Jewish engagement. Since a
significant component of the experience involved the connections that participants made with otherJews on their trip, efforts to enhance post-trip engagement will be more successful if they operatethrough these newly-created Jewish networks.
The impact of birthright israel on participants’ Jewish identities appears to be profound. However, thesuccess of the program poses a challenge for the Jewish community. The community now needs to
find ways to transform participants’ inspiration and motivation into Jewish commitment.
xii

1
Introduction

2
3
A Mega-Experiment In Jewish Education
In December 1999, the first birthright israel flights left North America with several hundred young
Jews who were traveling to Israel for a ten-day educational experience. For each traveler, this was hisor her first educational encounter with Israel and, for almost all, it was their first trip to Israel. Theparticipants looked like the North American Jewish community — some described themselves as
“just Jewish,” while the majority claimed affiliation with either the Reform or Conservative movements,and less than 10 percent identified themselves as Orthodox (Saxe et al., 2000b). Perhaps the mostunique element of the trip, aside from the fact that it heralded the subsequent departure of tens of
thousands of similar participants, was that the trips were being provided at no cost. This was the startof a bold educational experiment, funded by a partnership that included the government of Israel, theJewish Agency and federations, and a consortium of private philanthropists.1
This initiative, a large-scale experiment in informal Jewish education, was designed to test theproposition that providing an opportunity for young Jews to “reclaim their birthright” and experience
Israel as part of a peer group would alter their trajectory of Jewish engagement. As an integral part ofthe birthright israel experiment, a careful study of the impact of the program was designed andconducted. In two preliminary reports (Kelner et al., 2000; Saxe et al., 2000b), we described this
research.
The preliminary results made clear that the program had achieved its short-term goal of providing an
extremely effective educational program. It also demonstrated that those who went had become moreJewishly engaged. When compared with those individuals who had applied but did not go (“non-participants”), participants had significantly more positive attitudes about engagement with the
Jewish community and Israel. These findings were based on observations of the trips and a three-month follow-up. Although this research suggested that the program was successful in placingparticipants on a different Jewish journey, the real test was whether the program’s impact would be
sustained over time. The present report is designed to answer that question from the perspective ofmore than a year after the trip.
Program Theory
The program that came to be known as birthright israel was started by philanthropists Charles S.
Bronfman and Michael Steinhardt, who embraced the idea of a “birthright” proposed by Yossi Beilin,former Minister of Justice for Israel (Beilin, 2000). Concerned that assimilation was taking a heavy tollon Jewish life in the Diaspora, both philanthropists sought to transform the landscape of involvement
with Israel by generating a dramatic initiative. These two individuals provided initial funding, createdthe program’s organizational structure, and organized a means of financing the program that wouldallow up to 100,000 young adults to participate.
Judaism and Jewish culture do not seem to have engaged a significant number, perhaps the majority,of a generation of Jewish young people. Although many Jewish children receive some type of Jewish
education and experience a bar/bat mitzvah ceremony, for a majority, involvement in Judaism
Introduction
1 Specifically, the partners include the people of Israel through their government, local Jewishcommunities around the world (through the United Jewish Communities in North America, Keren
HaYesod outside of North America, and The Jewish Agency for Israel), and leading philanthropistsfrom North America.
4
appears to wane during adolescence (Saxe et al., 2000a). Moreover, rising intermarriage rates havesparked fears over the future of American Jewry (Fishman, 2001). It was against this backdrop that
birthright israel was conceived.
The birthright israel experiment hypothesizes that a well-structured and exciting experience of
contemporary Israel might have the power to counteract these trends of diminished Jewishconnection. Specifically, birthright israel aims to promote caring for the State of Israel, a newunderstanding of the significance of Israel, and a feeling of love and unity for the entire Jewish
people. It aspires to be an impetus for lasting change.
Under birthright israel’s aegis, it is planned, over a five-year period, that up to 100,000 young Jews
will take advantage of the free gift of an educational experience in Israel. The program’s sponsorsbelieve that engagement with Israel is so potentially powerful that even relatively brief exposure canoffset the forces in society that distract young Jews from being Jewish. So compelling is this belief
that they have pledged over $210 million toward this initiative.
The target group, as the sponsors conceived it, consists of those young Jews who are at greatest
risk of being lost to the community. As Marlene Post, Chairperson of birthright israel North America,characterizes the program, it “was conceived chiefly as an outreach to young people whohave not been drawn into existing Jewish frameworks and may therefore soon be lost to the Jewish
people (1999, p. 54).” 2
Mindful of the brief nature of the program, the birthright israel experience was not designed as an end
in itself, but rather as a catalyst for more fundamental transformations in participants’ Jewish identitiesand behaviors. The hope was that participants would return home and be inspired to engage in moreactivities that have a Jewish component, such as reading Jewish books, engaging in Jewish study
and spiritual pursuits, attending Jewish social events, or volunteering in a Jewish setting. Ultimatelybirthright israel “alumni” would end up living lives that were more Jewishly engaged and wouldassume their place in the larger Jewish community.
Although birthright israel ’s developers were extraordinarily hopeful about the potential impact of theprogram and were able to organize a group of partners that spanned the Jewish world, critics raised
a number of pointed questions. Spending several thousand dollars per individual to provide ten-dayeducational trips to Israel seemed risky and, to some, misguided. The Chair of the Governing Boardof the World Jewish Congress, for example, called the program idea “bizarre” and the possibility of it
enhancing identity as “unthinkable” (Liebler, 1999, 2000). Such critical views make systematicevaluation of the program’s impact even more important. Positive assessment of the program’s near-term impact only goes part of the way toward addressing these concerns, since there is the real
possibility that the effects are temporary and fade over time.
This report describes the attitudes and behavior of participants more than one year after their
experience in Israel. Over time, what effect does a visit to Israel with peers have on young people,many of whom would not otherwise go? Do they become engaged with Judaism and the Jewishcommunity as a result of their journey and do they stay engaged? Is birthright israel just a short-term,
2 The three-month follow-up study revealed that only some of those who went on the trip could becharacterized in this fashion. In summarizing the findings, the authors wrote: “ birthright israel brought
together a remarkably diverse group of young people... The program did not exclusively engageeither the already committed or those at risk of being ‘lost to the Jewish people’, but a mixture of thetwo — and everything in between” (Saxe et al., 2000b, p. v).
5
enjoyable experience, or does it have a desired long-term impact on the attitudes and behaviors ofyoung Jews, Jews who are the future of the Jewish people?
Although the emphasis in the present report is on new findings, for the benefit of readers unfamiliarwith the earlier research, the present report describes the background of the program and reviews
some of our prior research on the social-demography of participants and applicants. 3
birthright israel: The First Wave
In December 1999 and January 2000, nearly 6,000 young North American Jews went to Israel on thelaunch program of birthright israel. Most participants were college students, and more than half went
under the auspices of Hillel: The Foundation for Campus Life, Inc. Other sponsor organizationsincluded groups from various religious denominations, communal and national agencies,independent and nonprofit educational organizations, and private tour groups. Since there were more
applicants than the trips could accommodate, organizing groups engaged in some form of aselection process, with criteria varying from group to group. Most relied on a lottery, typically stratifiedso that groups could be balanced according to gender and interests.
Eligibility requirements for trips were prescribed by birthright israel. Participation was open to anyself-described Jew between the ages of 18 and 26 who had not previously been to Israel on a “peer
educational program.” Thus, young people who had visited Israel simply as tourists were eligible,while those who had been on a youth program (such as a high school summer in Israel) wereineligible. Participation was entirely free, although applicants had to provide a deposit of $250, which
was repaid if they took part in the full program.
The trip was designed to be an educational experience, not just a tour of Israel. Each group had an
elaborate pre-planned itinerary, and participants heard talks and visited sites based on three themes:a) the narrative of the Jewish people — the landmarks of Jewish history; b) values of the Jewishpeople — the core ideas of Jewish life; and c) contemporary Israel — modern Jewish society.4
Although there was some variation depending upon the trip organizer, all groups visited certainplaces, for example, the Kotel (Western Wall), Masada, Yad Vashem, and the Golan Heights. Inaddition, all groups spent at least one Shabbat in Jerusalem and met Israeli peers in a program
called “the mifgash” (encounter).
Underlying the itinerary designed for each trip was a carefully planned set of experiences designed
to influence participants both intellectually and emotionally. Participants traveled in groups of 30-40on buses, often with students from their own college campus, but sometimes with young people fromall over the country. In most cases, they arrived in Israel on flights shared with hundreds of other
participants. All of the participants had an opportunity to take part in mifgashim (encounters) withIsraelis and several groups included Israeli young adults as actual birthright israel participants.Although, for all of the groups, the sites were the central focus of the program, participants also
benefited from their interpersonal interactions — with everyday Israelis, tour guides, madrichim (tourstaff), and most importantly, with each other.
3 Readers familiar with our earlier report (Preliminary Findings) may wish to skim from page 5through page 7.
4 More detail can be found in birthright israel publications describing program requirements.
6
Research on Jewish Identity and the Israel Experience
Although birthright israel is a unique initiative, both in scope and vision, the idea behind it is neither
new nor untested. It arose out of a deep concern that Jewish identity, and the connection of Jews tothe land and people of Israel, needed to be strengthened in Jewish communities throughout the world(e.g., Beilin, 2000). Jewish identity is developed and sustained by many things, including Jewish
education and Jewish practice at home. Recently, recognition of the role played by transnational tiesbetween Diaspora Jews and Israel is increasing. Ties with Israel are seen as an increasingly salientfactor among those who are interested in promoting Jewish identity. Goldstein and Goldstein (1996),
for example, have noted that Israel has played a central role in Jewish identity development.
Yet, even though Israel is considered to be an important element of Jewish identity, recent research
suggests that it is becoming less important among contemporary Diaspora Jews (Cohen & Eisen,1998, 2000). Only about one-third of Jews in the United States who are moderately affiliated havevisited Israel, and there are signs that these numbers are decreasing. Cohen and Eisen, who
conducted survey research as well as in-depth interviews with American Jews, found that ties withIsrael were relatively weak among mainstream Jews and that many were ambivalent. They attributeweakening ties to the ways in which American Judaism has become an increasingly individual
experience. One consequence of this trend is that Israel is not a high priority for many AmericanJews.
Why should Israel play a strong role in Jewish identity? Or, in consideration of the focus of this report,the more appropriate question is: How might trips and engagement with Israel play a role in thedevelopment of Jewish identity? Given the current nature of American Jewry, with Jews who are more
and more removed from their ancestors’ countries of origin, David Mittelberg (1999), an Israelisociologist, argues that visits to Israel can lead to the “re-ethnification” of those who have lost theirethnic identities. Mittelberg advocates that Israel become “a truly integral part of their lives,” a state of
affairs that is now practical because of advances in travel and communication. Using data from the1990 National Jewish Population Survey (Kosmin, et al., 1991), Mittelberg found positive associationsbetween visits to Israel and measures of Jewish identification, community affiliation, and religious
practice, irrespective of denomination, level of Jewish education, age, gender, or region. In otherwords, regardless of a Jew’s background, a trip to Israel was found to be associated with anenhanced sense of Jewish identity. A strong advocate of visits to Israel, he contends that an Israel trip
“is a unique experience that connects American Jews to their past, to Israel’s present, and by virtue ofits Jewish contribution to Israeli society and culture, to the future well-being of the Jewish people”(1999, p. xiv).
There is some evidence that traveling to Israel during college is an important predictor of laterengagement with Jewish communal life. Researchers Israel and Mittelberg (1998), drawing on the
1995 Boston Jewish community demographic study, found that those who took their first trip to Israelin college were more engaged in Jewish life than those who went at a younger age. Similarly, in focusgroups organized by the American Jewish Committee, college-age visits to Israel were found to have
a more lasting impact on students than family visits around the age of b’nai mitzvah or high-schoolprograms (Ukeles, 1994). This finding is, perhaps, surprising. Those who begin visiting Israel at ayoung age would be expected to have stronger ties.
Nevertheless, these findings are parallel to more general findings that compare the effects of earlyand later experiences on Jewish identity development. Horowitz (1993), in analyzing data from the
New York Jewish Population Survey, found that “voluntary” Jewish experiences in the teenage andadult years were better predictors of affiliation and practice than “involuntary” experiences earlier in
7
life. These data are consistent with evidence from surveys of those who have had a b’nai mitzvahceremony (see, e.g., Saxe et al., 2000a) that document how poorly young U.S. Jews evaluate theirHebrew school education.
Given that trips to Israel “matter” in developing Jewish identity, although their impact may depend onthe person’s developmental stage, the key question is to understand the mechanisms that explainhow Israel experiences affect young people. Chazan (1997) proposes three possible models as
explanations. The first, a domino model, suggests that an Israel visit is a critical step in a series ofeducational experiences. The second, a cluster model, argues that the Israel experience gainsimpact in conjunction with parallel educational experiences. And the third, an independent model,
makes the case that an Israel trip may have its own separate impact on Jewish identity.
The available research is compelling, but it suffers from methodological limitations. Mittelberg (1999)
notes that an association between a visit to Israel and an interest in Israel and the Jewish people isjust that — an association. As one example, it is almost universally the case that Jewish communityleaders have visited Israel (e.g., Cohen & Eisen, 2000), but no one would make the argument that the
Israel trip generated their community commitment. Similarly, most of those who apply for rabbinictraining in the United States have been to Israel on study abroad or similar programs (Wertheimer,1993). So it is likely that those who go to Israel are already interested in Judaism and the community.
Most of the extant research does not allow one to establish whether the Israel visit caused the interestor if the interest was already there before the trip.
As described in our previous report on birthright israel (Saxe et al., 2000b), there have been anumber of evaluative studies of Israel trips (e.g., Cohen, 1994; Cohen, 1995; Sales, 1998, 1999).These studies provide important information, but focusing on the trip does not provide information
about the subsequent impact of the trip. In addition, there is a critical selection issue. To the extentthat those who participate in Israel experiences are different from those who don’t participate (withrespect to Jewish motivation and other factors), understanding trip impact becomes difficult. In
studies that involve follow-up assessments (e.g. Cohen, 1994), it is therefore a problem to determinehow much of the change was a product of who went and how much was actually a result of havingbeen in Israel (Chazan, 1997).
Present Study
In the initial report assessing the impact of the launch program on participants, we presentedsubstantial evidence that the trip had a “profound impact” on participants and we suggested thatparticipation in birthright israel had “placed [them] on a different Jewish trajectory than their peers”
(Saxe, et al., 2000b, p. 28). The purpose of the present report is to assess whether birthright israelalumni have continued on that trajectory and to establish whether the initial changes we observedappear to be enduring.
From the outset, our program of research has been carefully designed to overcome the keymethodological limitations of previous studies on the Israel experience (Saxe et al., 2000b). Along
with studying large numbers of trips and participants, multiple types of qualitative and quantitativedata were collected, and comparisons were made between participants and non-participants. Theresearch design included several features to enhance validity:
• Both participants and non-participants were surveyed using e-mail and the Internet one month,three months, and twelve to fifteen months after the trip period.

8
• Since the non-participants who applied to go on birthright israel trips had motivations that weresimilar to those of participants, and since those who went were, for the most part, selected at
random, the non-participants served as an effective control group (allowing us to isolate theeffects of the trip from prior interest in Israel).
• Participant-observers, part of the evaluation team, accompanied a number of the groupsthroughout their time in Israel to provide an ethnographic component that allowed us totriangulate findings through multiple research methods.
The present report focuses on the findings from a survey completed by United States participantsand non-participants between 12 and 15 months after participants visited Israel. 5 Three months after
the trip, nearly 2,500 participants and 531 non-participants completed our web survey. Twelve tofifteen months after the trip, 1,676 participants and 153 non-participants completed the survey. Inorder to ensure that the samples are comparable, the follow-up sample was weighted on
unchangeable factors such as gender, whether they had a bar/bat mitzvah ceremony, and whether ornot their families lit candles Friday night and observed kashrut when they were growing up. Thisweighting procedure enabled us to make the follow-up group look like the original respondents on
factors that are known to be well-correlated with various outcome measures. In addition, a variety oftechniques were employed to ensure a high response rate. Yet another methodological contribution tothis report is the ethnographic field research, which enriches and informs these results. The
ethnographic findings themselves are described in a separate report (Kelner et al., 2000).Methodological details of the design of the present study can be found in Appendix B.
Our research questions concerned the following:
• What do participants remember of their Israel experience and which experiences had the most
powerful and the most lasting effect? Are some participants more likely than others to have beenaffected?
• What was the impact of the trip and how has it changed over the year since participants arrivedhome? What attitudes did participants have about Judaism and Israel before the trip, immediatelyafter the trip, and more than one year later? Were there any post-trip changes in participants’
involvement in Jewish activities? Can we attribute these changes to the program?
• What characteristics of participants and trip organizers appear to be related to post-trip changes
in attitudes and activities pertaining to Judaism and Israel?
• How does the program achieve impact?
5 Data were collected from both U.S. and Canadian participants. However, no comparison group wasavailable for Canada and, thus, the analyses focus on the U.S. participants/non-participants.
Appendix A on page 43 highlights the differences between the two samples.

9
Findings

10
11
Participant Profile
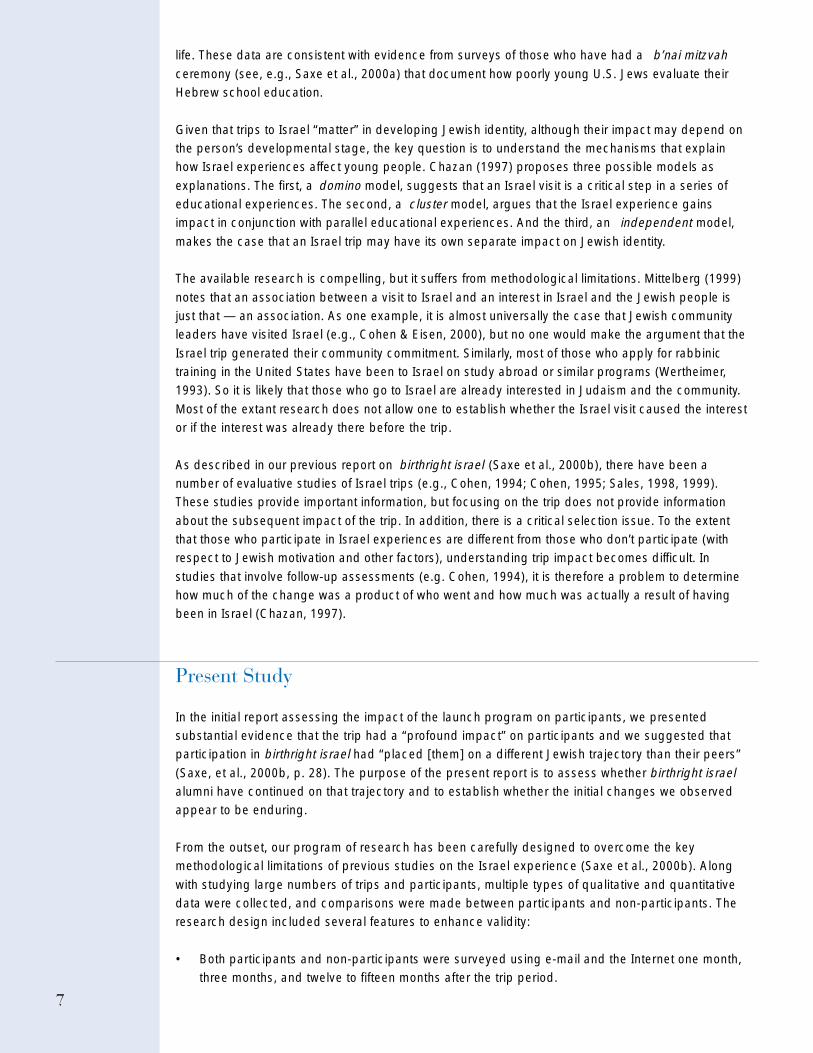
Any self-described Jew who had not previously been on a peer educational trip to Israel and was
between the ages of 18 and 26 was eligible for the trip. For the launch program, the majority ofparticipants were at the younger end of this range. Two-thirds of those who went on the trip werebetween the ages of 18 and 20 at the time of their travel (see Figure 1). Typical of participation rates
in many aspects of Jewish life, birthright israel attracted more women than men — 59 percent werefemale and 41 percent were male.
0
5%
10%
15%
20%
25%
20%
25%23%
14%
7%
12%
age 18 age 19 age 20 age 21 age 22 age 23+
Figure 1: Ages of U.S. Participants at Time of Trip
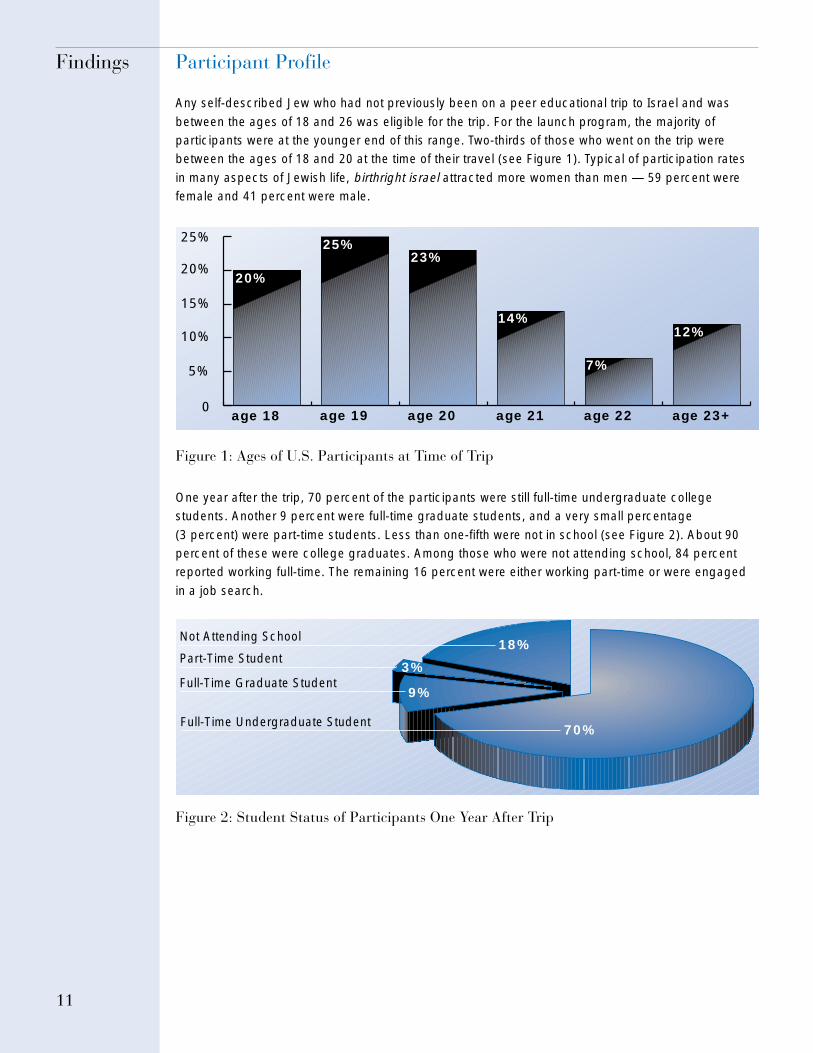
One year after the trip, 70 percent of the participants were still full-time undergraduate collegestudents. Another 9 percent were full-time graduate students, and a very small percentage
(3 percent) were part-time students. Less than one-fifth were not in school (see Figure 2). About 90percent of these were college graduates. Among those who were not attending school, 84 percentreported working full-time. The remaining 16 percent were either working part-time or were engaged
in a job search.
Findings
Figure 2: Student Status of Participants One Year After Trip
9%
3%
18%
70%
Full-Time Graduate Student
Part-Time Student
Not Attending School
Full-Time Undergraduate Student
12
Attitudes Before the Trip
As reported in the initial evaluation, those who accepted the “gift” of a trip to Israel were as diverse as
the North American Jewish population. They varied in religious background, Jewish education andcommitment, and their motivations for applying to the program.
Jewish Affiliation and Upbringing
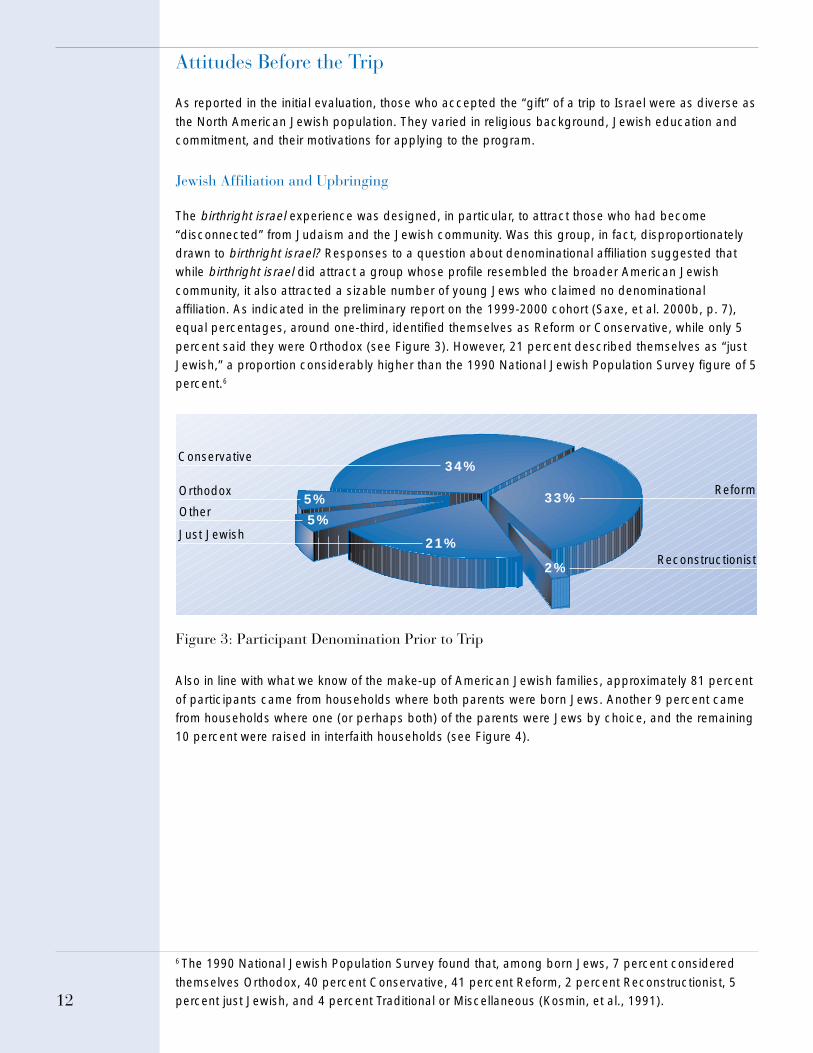
The birthright israel experience was designed, in particular, to attract those who had become
“disconnected” from Judaism and the Jewish community. Was this group, in fact, disproportionatelydrawn to birthright israel? Responses to a question about denominational affiliation suggested thatwhile birthright israel did attract a group whose profile resembled the broader American Jewish
community, it also attracted a sizable number of young Jews who claimed no denominationalaffiliation. As indicated in the preliminary report on the 1999-2000 cohort (Saxe, et al. 2000b, p. 7),equal percentages, around one-third, identified themselves as Reform or Conservative, while only 5
percent said they were Orthodox (see Figure 3). However, 21 percent described themselves as “justJewish,” a proportion considerably higher than the 1990 National Jewish Population Survey figure of 5percent.6
6 The 1990 National Jewish Population Survey found that, among born Jews, 7 percent considered
themselves Orthodox, 40 percent Conservative, 41 percent Reform, 2 percent Reconstructionist, 5percent just Jewish, and 4 percent Traditional or Miscellaneous (Kosmin, et al., 1991).
Figure 3: Participant Denomination Prior to Trip
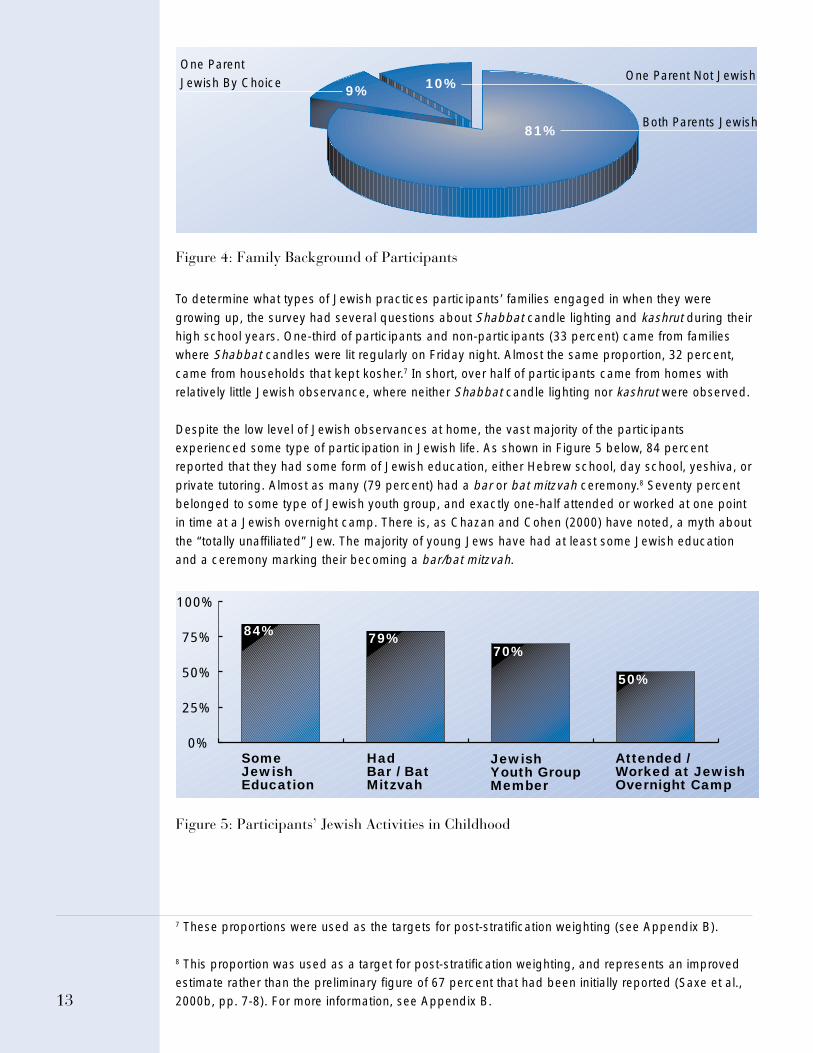
Also in line with what we know of the make-up of American Jewish families, approximately 81 percent
of participants came from households where both parents were born Jews. Another 9 percent camefrom households where one (or perhaps both) of the parents were Jews by choice, and the remaining10 percent were raised in interfaith households (see Figure 4).
Orthodox5%
Other5%
Conservative34%
Reconstructionist2%
Reform33%
Just Jewish21%
13
Figure 4: Family Background of Participants
To determine what types of Jewish practices participants’ families engaged in when they were
growing up, the survey had several questions about Shabbat candle lighting and kashrut during theirhigh school years. One-third of participants and non-participants (33 percent) came from familieswhere Shabbat candles were lit regularly on Friday night. Almost the same proportion, 32 percent,
came from households that kept kosher.7 In short, over half of participants came from homes withrelatively little Jewish observance, where neither Shabbat candle lighting nor kashrut were observed.
Despite the low level of Jewish observances at home, the vast majority of the participantsexperienced some type of participation in Jewish life. As shown in Figure 5 below, 84 percentreported that they had some form of Jewish education, either Hebrew school, day school, yeshiva, or
private tutoring. Almost as many (79 percent) had a bar or bat mitzvah ceremony.8 Seventy percentbelonged to some type of Jewish youth group, and exactly one-half attended or worked at one pointin time at a Jewish overnight camp. There is, as Chazan and Cohen (2000) have noted, a myth about
the “totally unaffiliated” Jew. The majority of young Jews have had at least some Jewish educationand a ceremony marking their becoming a bar/bat mitzvah.
84% 79%70%
50%
SomeJewishEducation
HadBar / BatMitzvah
JewishYouth GroupMember
Attended /Worked at JewishOvernight Camp
0%
25%
50%
75%
100%
Figure 5: Participants’ Jewish Activities in Childhood
7 These proportions were used as the targets for post-stratification weighting (see Appendix B).
8 This proportion was used as a target for post-stratification weighting, and represents an improvedestimate rather than the preliminary figure of 67 percent that had been initially reported (Saxe et al.,2000b, pp. 7-8). For more information, see Appendix B.
Both Parents Jewish81%
One Parent Not Jewish10%
One ParentJewish By Choice
9%
14
In spite of the fact that virtually all participants had some form of Jewish education, 86 percent hadnever been to Israel prior to going on birthright israel. As noted in the preliminary report (Saxe, et al.
2000b, pp. 10-13), there were a sizable number of young Jews who had some Jewish involvementand would have liked to have gone to Israel, but said that the cost had prevented them from doing so.In addition, there was another segment that had not been Jewishly involved but wanted to be.
Participation in birthright israel provided both segments with just the sort of opportunity they hadbeen seeking.
Experiences During the Trip
Launch participants’ evaluations of their trip were a critical part of our initial assessment of birthrightisrael and, as summarized earlier, were extremely positive (Saxe et al., 2000b). The present follow-up
study considers whether these initial positive evaluations remained stable more than one year laterand inquired about participants’ retrospective views of their birthright israel experience.
Feelings About the Trip
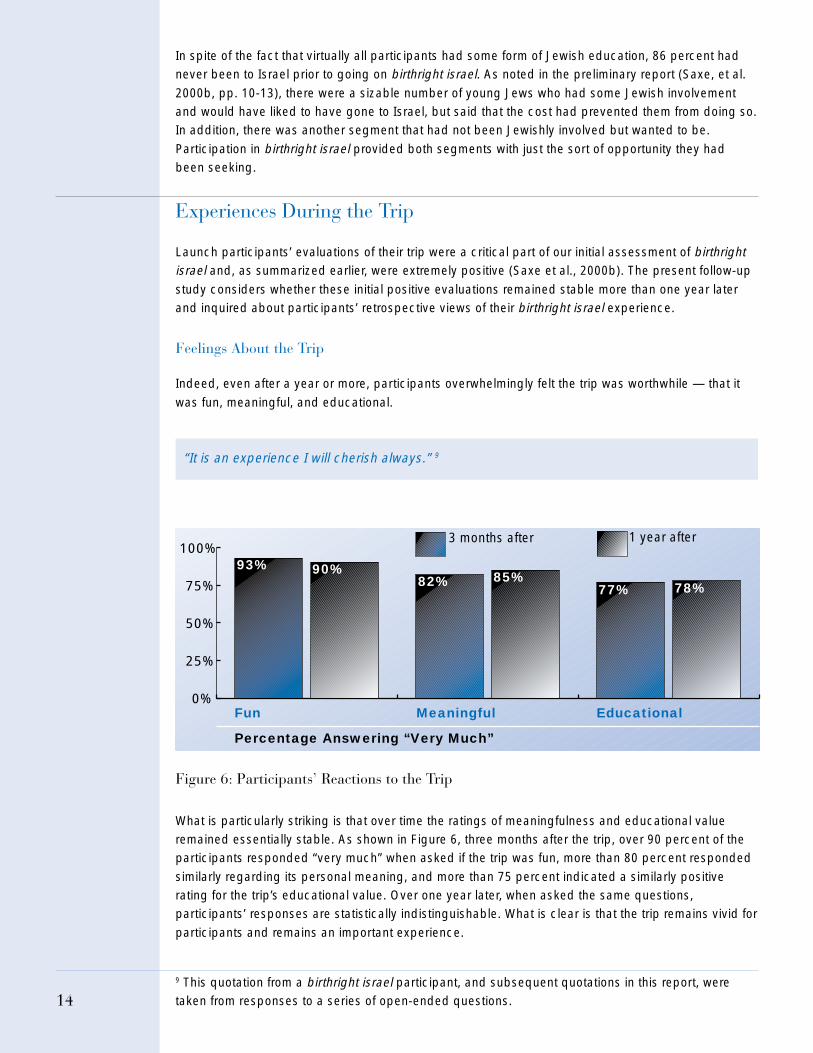
Indeed, even after a year or more, participants overwhelmingly felt the trip was worthwhile — that it
was fun, meaningful, and educational.
“It is an experience I will cherish always.” 9
0%
25%
50%
75%
100%93%
Percentage Answering “Very Much”
Fun Meaningful Educational
90%82% 85%
77% 78%
1 year after3 months after
Figure 6: Participants’ Reactions to the Trip
What is particularly striking is that over time the ratings of meaningfulness and educational valueremained essentially stable. As shown in Figure 6, three months after the trip, over 90 percent of theparticipants responded “very much” when asked if the trip was fun, more than 80 percent responded
similarly regarding its personal meaning, and more than 75 percent indicated a similarly positiverating for the trip’s educational value. Over one year later, when asked the same questions,participants’ responses are statistically indistinguishable. What is clear is that the trip remains vivid for
participants and remains an important experience.
9 This quotation from a birthright israel participant, and subsequent quotations in this report, weretaken from responses to a series of open-ended questions.
15
Strongest Memories of the Trip
As part of an effort to “unpack” the experience, in our one-year post-trip survey we provided
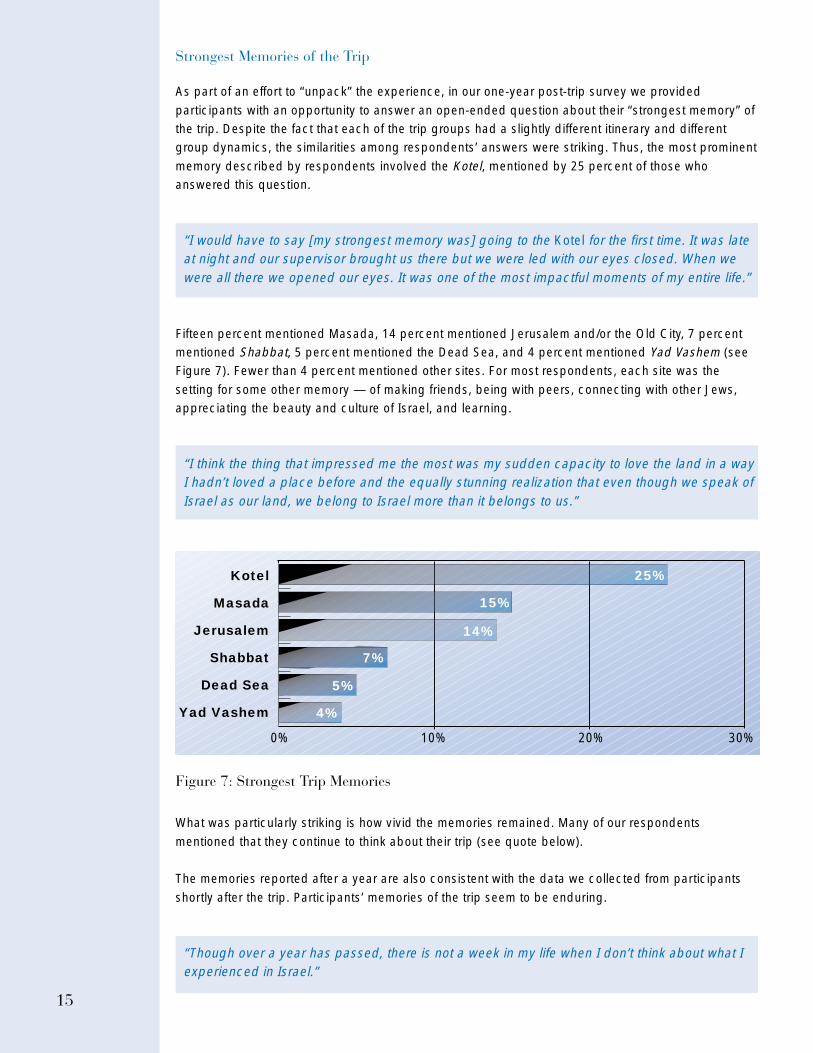
participants with an opportunity to answer an open-ended question about their “strongest memory” ofthe trip. Despite the fact that each of the trip groups had a slightly different itinerary and differentgroup dynamics, the similarities among respondents’ answers were striking. Thus, the most prominent
memory described by respondents involved the Kotel, mentioned by 25 percent of those whoanswered this question.
“I would have to say [my strongest memory was] going to the Kotel for the first time. It was lateat night and our supervisor brought us there but we were led with our eyes closed. When wewere all there we opened our eyes. It was one of the most impactful moments of my entire life.”
Fifteen percent mentioned Masada, 14 percent mentioned Jerusalem and/or the Old City, 7 percentmentioned Shabbat, 5 percent mentioned the Dead Sea, and 4 percent mentioned Yad Vashem (seeFigure 7). Fewer than 4 percent mentioned other sites. For most respondents, each site was the
setting for some other memory — of making friends, being with peers, connecting with other Jews,appreciating the beauty and culture of Israel, and learning.
“I think the thing that impressed me the most was my sudden capacity to love the land in a wayI hadn’t loved a place before and the equally stunning realization that even though we speak ofIsrael as our land, we belong to Israel more than it belongs to us.”
Kotel
Masada
Jerusalem
Shabbat
Dead Sea
Yad Vashem
25%
0% 10% 20% 30%
15%
14%
7%
5%
4%
Figure 7: Strongest Trip Memories
What was particularly striking is how vivid the memories remained. Many of our respondents
mentioned that they continue to think about their trip (see quote below).
The memories reported after a year are also consistent with the data we collected from participants
shortly after the trip. Participants’ memories of the trip seem to be enduring.
“Though over a year has passed, there is not a week in my life when I don’t think about what Iexperienced in Israel.”
16
Holiness in the Holy Land: Spiritual Experiences of Participants
Israel affected participants in many ways. Some were moved simply by the natural beauty of the
country. Others were taken with the excitement of modern Jerusalem and Tel Aviv. Still othersresponded to the historical and archaeological sites. And then there were those who encounteredsomething intangible, something not easily described, which can be classified as spiritual. For some,
the Holy Land was indeed holy.
Specific questions about spirituality were not asked on our surveys of launch participants, although
we did ask questions about spirituality on subsequent surveys given to participants on later trips. Inthese latter surveys, more than half of the participants described their experience as spiritual.
For the launch participants, we looked for references or allusions to spirituality in their responses toopen-ended questions. Along with the query about their strongest memories, there were alsoquestions about their biggest disappointments and about activities that they would have liked to have
done but did not have a chance to do. At the end of the survey, there was an opportunity for them torespond to the question: “Is there anything else you would like to tell us about your birthright israelexperience?”
To explore ways in which participants invoked notions of spirituality to describe their birthright israelexperience, all of the written comments from surveys were analyzed. We found that the majority of
references to spirituality, variously expressed, fell into one or more of five associative categories:Jerusalem, the Kotel, Shabbat, Yad Vashem, and Masada.
A simple reference to a given place or activity was not considered “spiritual” unless the participantprovided further elaboration, as we could not otherwise determine what specifically he or she foundmeaningful. Thus, a recollection of “being at the Kotel” would not be categorized as a spiritual
experience, whereas “being at the Kotel and knowing over three thousand years’ worth of myancestors have stood there” would be. As an additional criterion, any comment that contained onlyelements of aesthetic or material appreciation, lacking a spiritual or religious component, was
excluded. As an example of the spiritual, we would include the feeling of fulfilling serenity andsolitude at the summit of Masada, but we would not categorize as spiritual a simple recollection of thebeauty of a Masada sunrise.
“...when I was in high school my mother had breast cancer and I sent a prayer to be put in thewall that she would be OK and 7 years later I stood at that wall and put in a note from mymother who was cancer-free. I have never felt so connected to God in my entire life.”
Those participants who provided such responses, which consisted of either positive or negativefeelings towards spirituality, indicated that for them it was a force on the trip.
Positive reactions to key sites and events varied from feelings of connectedness with the Jewishnation to those of divine communication. Many participants described religious epiphanies at places
of particular Jewish significance, especially the Kotel. Visits to Yad Vashem were often marked bymoments of somber contemplation about the Jewish people’s place in the world. For numerousparticipants, sunrise at Masada provided a spiritual high, and some of those who chose to pray atop
the desert peak said they experienced sensations of unity with God.

17
Participants were asked: “What would you like to do in Israel that you did not have a chance to doduring your birthright israel trip?” Very often, they listed one of these “spiritual sites” as the response.
Many wished they could have spent more time in Jerusalem or at the Kotel. Some felt not enough timewas allotted to truly absorb the impact of Yad Vashem. Some groups were unable to climb up Masadadue to time constraints and ascended via cable car, which they felt detracted from the overall
experience. And, on one of the trips, groups were unable to ascend the mountain altogether due tolocal flooding, which left a number feeling that they had truly missed out on something special whenthey returned home.
Apparently, even with limited or no firsthand exposure to these sites, these participants had a sensethat they should expect to feel more fulfilled or connected at them than at other sites. They seemed to
have an idea of where to expect sanctity and wanted the opportunity to find it there. Thesedescriptions confirm earlier conclusions drawn from ethnographic field work (Kelner, et al., 2000).
“I remember davening Shacharit one morning and being in the middle of Shmoneh Esreh andthinking to myself that the Avraham, Yitzchak and Yaacov who I mention in my prayers were inthis land and bursting into tears.”
A minority complained when they did not find the sanctity they sought. For example, there wereseveral who expressed a letdown after their first experience at the Kotel. This may be expected, asspecific events or sites do not inspire everyone. Another group wanted more spiritual content in their
program and were disappointed when it was not present. In contrast, others felt religion was being“crammed down [their] throats.” Although spirituality certainly seems to be a presence, itsacceptance as an important part of the trip was not uniform among launch participants. Nonetheless,
all of these comments were in the context of extremely positive reactions to the trip.
Impact: How Did the Trip Affect Participants?
Based on the evaluative data, there is substantial evidence that the trip was exceedingly well-received by participants and the one-year follow-up findings suggest that it was more than a halo
effect generated by a novel experience. However, the most important test of the birthright israel“experiment” is whether the program produced any sustained change in participants’ attitudes andbehaviors. More specifically:
• Did their identities as Jews change?
• Did they feel more connected to the Jewish people?
• Have they revisited Israel since their initial trip?
• Did they become more interested in Israel and did they develop a desire to return?
• Did they stay in touch with other participants and sustain a sense of community?
• Did they become more involved in Jewish activities at home?
18
Two types of comparisons were made, wherever possible, to answer these questions: comparisonsover time (i.e., at three months and one year post-trip), and comparisons between participants andnon-participants (i.e., those who applied but for various reasons did not go). All differences reported
between participants and non-participants are statistically significant (p <.05) unless noted otherwise.
The Program’s Impact on Jewish Identity
Salience of Jewish Identity Could a ten-day trip to Israel actually be sufficient to generate
changes in participants’ Jewish identities? The findings described below strongly suggest that it was.
“I was raised... without any real motivation to marry a Jewish person or learn more aboutJudaism. I didn’t think Israel would be any different or more special than visiting Italy. Thebirthright trip changed everything for me. Upon my return I began exploring my own Jewishidentity and the role I want Judaism to play in my life.”
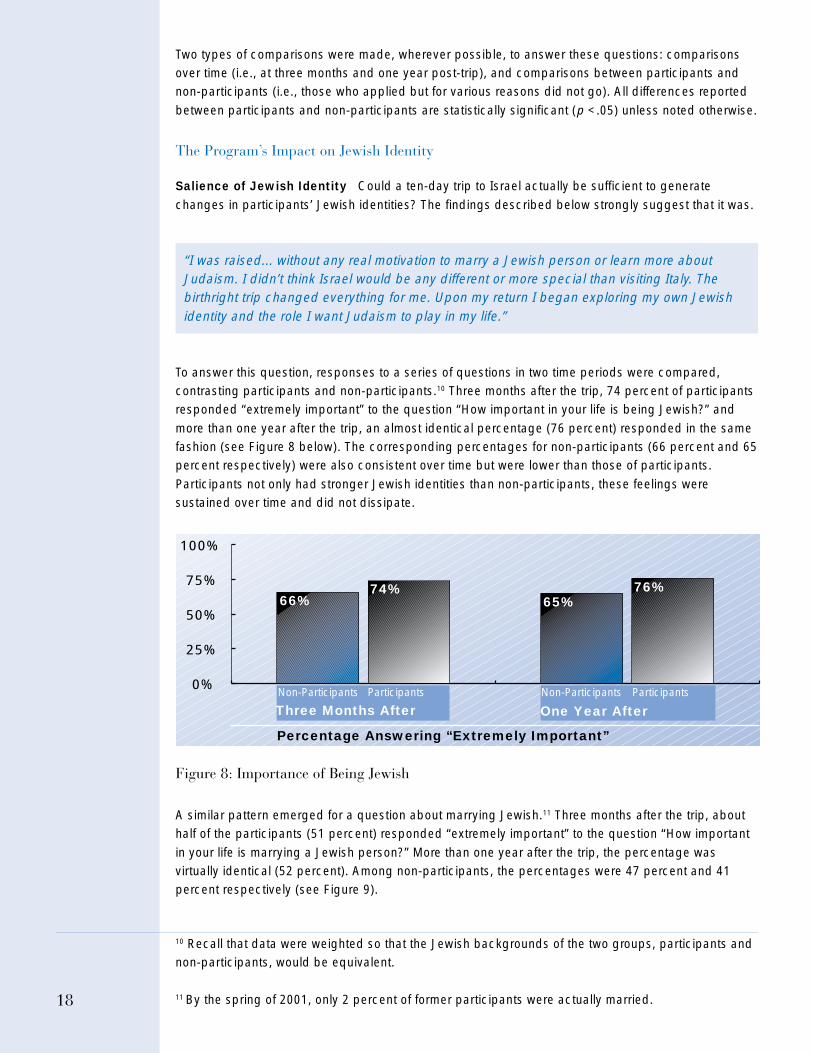
To answer this question, responses to a series of questions in two time periods were compared,contrasting participants and non-participants.10 Three months after the trip, 74 percent of participantsresponded “extremely important” to the question “How important in your life is being Jewish?” and
more than one year after the trip, an almost identical percentage (76 percent) responded in the samefashion (see Figure 8 below). The corresponding percentages for non-participants (66 percent and 65percent respectively) were also consistent over time but were lower than those of participants.
Participants not only had stronger Jewish identities than non-participants, these feelings weresustained over time and did not dissipate.
0%
25%
50%
75%
100%
Three Months After One Year After
66%74%
65%76%
Non-Participants Participants Non-Participants Participants
Percentage Answering “Extremely Important”
Figure 8: Importance of Being Jewish
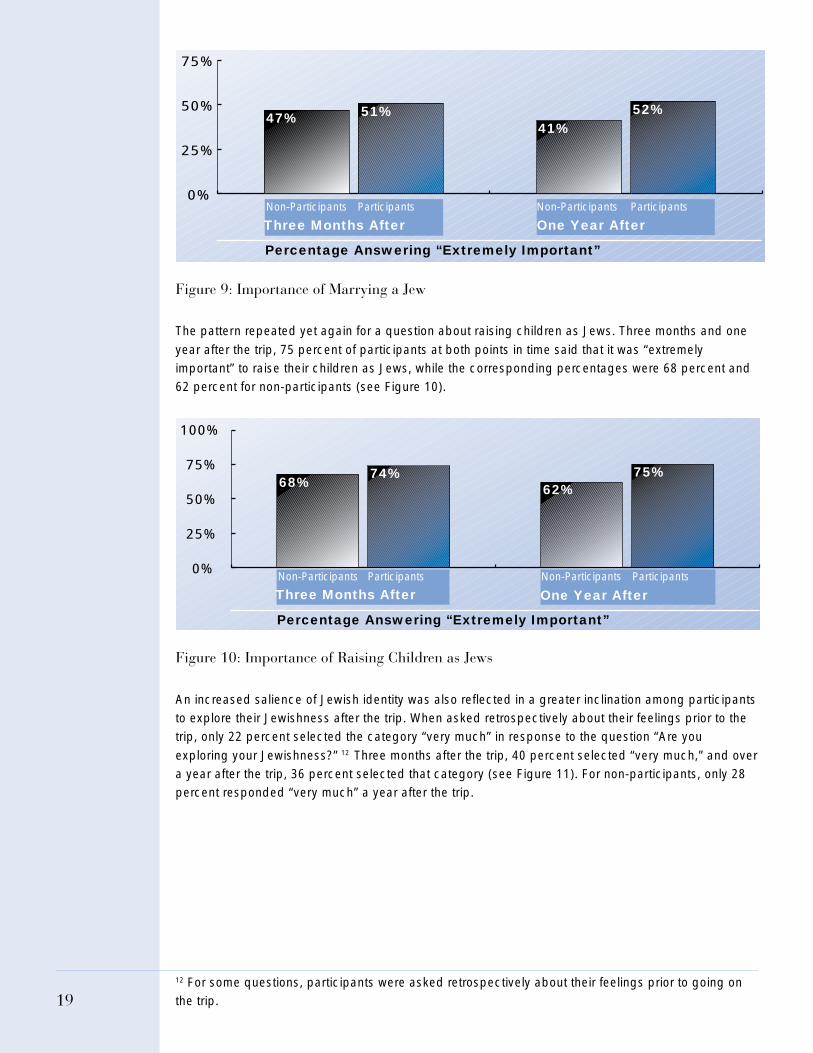
A similar pattern emerged for a question about marrying Jewish.11 Three months after the trip, abouthalf of the participants (51 percent) responded “extremely important” to the question “How important
in your life is marrying a Jewish person?” More than one year after the trip, the percentage wasvirtually identical (52 percent). Among non-participants, the percentages were 47 percent and 41percent respectively (see Figure 9).
10 Recall that data were weighted so that the Jewish backgrounds of the two groups, participants andnon-participants, would be equivalent.
11 By the spring of 2001, only 2 percent of former participants were actually married.
19
0%
25%
50%
75%
Three Months After One Year After
47%
Non-Participants Participants Non-Participants Participants
Percentage Answering “Extremely Important”
51%41%
52%
Figure 9: Importance of Marrying a Jew
The pattern repeated yet again for a question about raising children as Jews. Three months and one
year after the trip, 75 percent of participants at both points in time said that it was “extremelyimportant” to raise their children as Jews, while the corresponding percentages were 68 percent and62 percent for non-participants (see Figure 10).
0%
25%
50%
75%
100%
Three Months After One Year After
68%74%
62%75%
Non-Participants Participants Non-Participants Participants
Percentage Answering “Extremely Important”
Figure 10: Importance of Raising Children as Jews
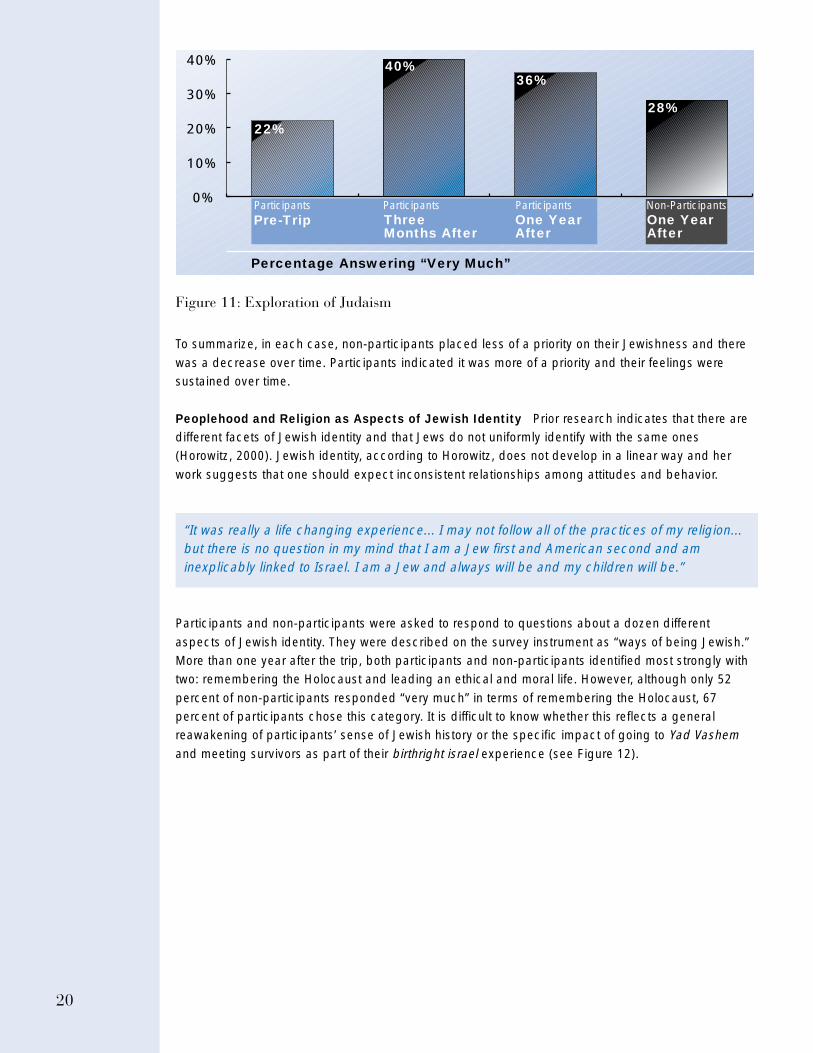
An increased salience of Jewish identity was also reflected in a greater inclination among participantsto explore their Jewishness after the trip. When asked retrospectively about their feelings prior to thetrip, only 22 percent selected the category “very much” in response to the question “Are you
exploring your Jewishness?” 12 Three months after the trip, 40 percent selected “very much,” and overa year after the trip, 36 percent selected that category (see Figure 11). For non-participants, only 28percent responded “very much” a year after the trip.
12 For some questions, participants were asked retrospectively about their feelings prior to going onthe trip.
20
0%
10%
20%
30%
40%
ThreeMonths After
One YearAfter
22%
Participants Non-Participants
Percentage Answering “Very Much”
40%36%
28%
Pre-TripParticipants Participants
One YearAfter
Figure 11: Exploration of Judaism
To summarize, in each case, non-participants placed less of a priority on their Jewishness and there
was a decrease over time. Participants indicated it was more of a priority and their feelings weresustained over time.
Peoplehood and Religion as Aspects of Jewish Identity Prior research indicates that there aredifferent facets of Jewish identity and that Jews do not uniformly identify with the same ones(Horowitz, 2000). Jewish identity, according to Horowitz, does not develop in a linear way and her
work suggests that one should expect inconsistent relationships among attitudes and behavior.
“It was really a life changing experience... I may not follow all of the practices of my religion...but there is no question in my mind that I am a Jew first and American second and aminexplicably linked to Israel. I am a Jew and always will be and my children will be.”
Participants and non-participants were asked to respond to questions about a dozen different
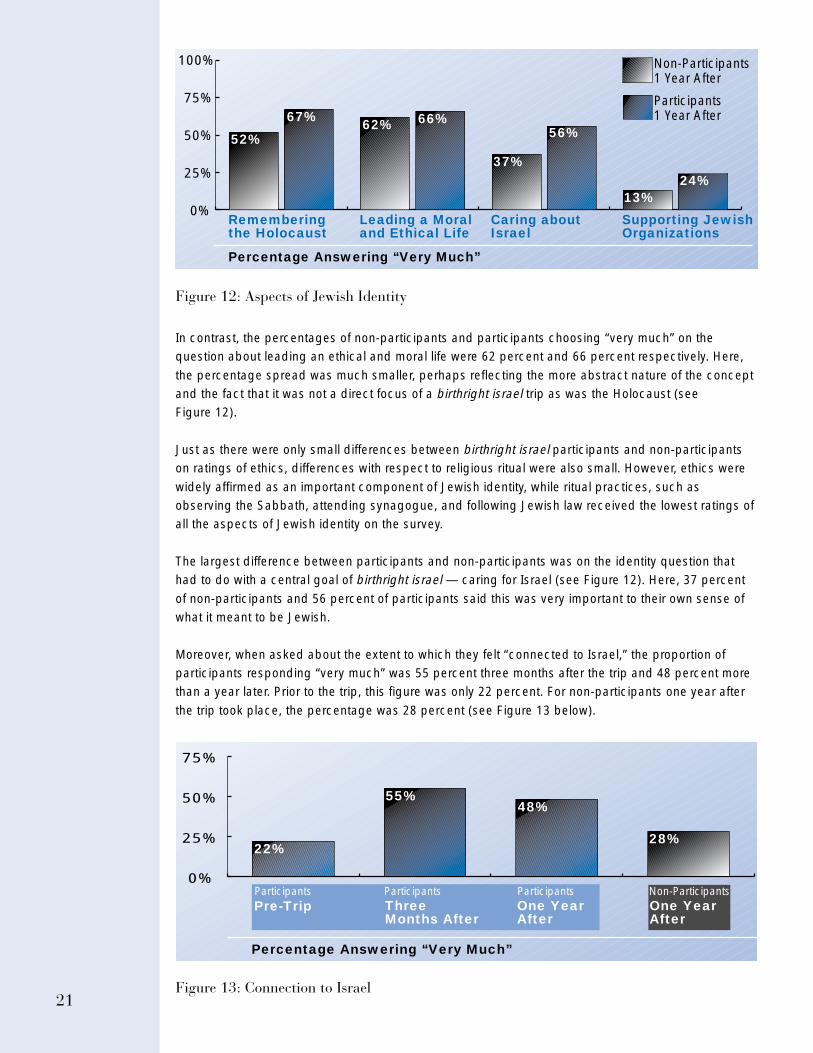
aspects of Jewish identity. They were described on the survey instrument as “ways of being Jewish.”More than one year after the trip, both participants and non-participants identified most strongly withtwo: remembering the Holocaust and leading an ethical and moral life. However, although only 52
percent of non-participants responded “very much” in terms of remembering the Holocaust, 67percent of participants chose this category. It is difficult to know whether this reflects a generalreawakening of participants’ sense of Jewish history or the specific impact of going to Yad Vashemand meeting survivors as part of their birthright israel experience (see Figure 12).
21
0%
25%
50%
75%
100%
Rememberingthe Holocaust
Leading a Moraland Ethical Life
Caring aboutIsrael
Supporting JewishOrganizations
52%
67% 62%
37%
56%
13%24%
66%
Non-Participants1 Year After
Participants1 Year After
Percentage Answering “Very Much”
Figure 12: Aspects of Jewish Identity
In contrast, the percentages of non-participants and participants choosing “very much” on thequestion about leading an ethical and moral life were 62 percent and 66 percent respectively. Here,
the percentage spread was much smaller, perhaps reflecting the more abstract nature of the conceptand the fact that it was not a direct focus of a birthright israel trip as was the Holocaust (seeFigure 12).
Just as there were only small differences between birthright israel participants and non-participantson ratings of ethics, differences with respect to religious ritual were also small. However, ethics were
widely affirmed as an important component of Jewish identity, while ritual practices, such asobserving the Sabbath, attending synagogue, and following Jewish law received the lowest ratings ofall the aspects of Jewish identity on the survey.
The largest difference between participants and non-participants was on the identity question thathad to do with a central goal of birthright israel — caring for Israel (see Figure 12). Here, 37 percent
of non-participants and 56 percent of participants said this was very important to their own sense ofwhat it meant to be Jewish.
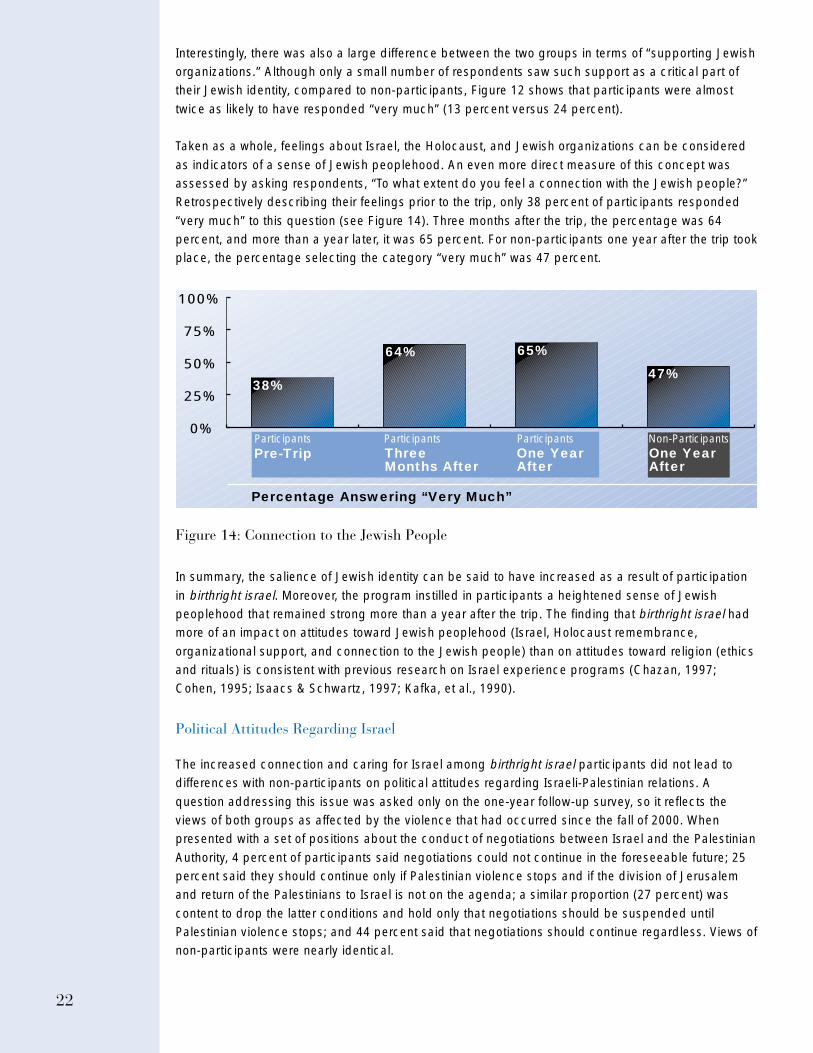
Moreover, when asked about the extent to which they felt “connected to Israel,” the proportion ofparticipants responding “very much” was 55 percent three months after the trip and 48 percent morethan a year later. Prior to the trip, this figure was only 22 percent. For non-participants one year after
the trip took place, the percentage was 28 percent (see Figure 13 below).
0%
25%
50%
75%
ThreeMonths After
One YearAfter
22%
Participants Non-Participants
Percentage Answering “Very Much”
Pre-TripParticipants Participants
One YearAfter
28%
55%48%
Figure 13: Connection to Israel
22
Interestingly, there was also a large difference between the two groups in terms of “supporting Jewishorganizations.” Although only a small number of respondents saw such support as a critical part oftheir Jewish identity, compared to non-participants, Figure 12 shows that participants were almost
twice as likely to have responded “very much” (13 percent versus 24 percent).
Taken as a whole, feelings about Israel, the Holocaust, and Jewish organizations can be considered
as indicators of a sense of Jewish peoplehood. An even more direct measure of this concept wasassessed by asking respondents, “To what extent do you feel a connection with the Jewish people?”Retrospectively describing their feelings prior to the trip, only 38 percent of participants responded
“very much” to this question (see Figure 14). Three months after the trip, the percentage was 64percent, and more than a year later, it was 65 percent. For non-participants one year after the trip tookplace, the percentage selecting the category “very much” was 47 percent.
0%
25%
50%
75%
100%
ThreeMonths After
One YearAfter
38%
Participants Non-Participants
Percentage Answering “Very Much”
Pre-TripParticipants Participants
One YearAfter
64% 65%
47%
Figure 14: Connection to the Jewish People
In summary, the salience of Jewish identity can be said to have increased as a result of participation
in birthright israel. Moreover, the program instilled in participants a heightened sense of Jewishpeoplehood that remained strong more than a year after the trip. The finding that birthright israel hadmore of an impact on attitudes toward Jewish peoplehood (Israel, Holocaust remembrance,
organizational support, and connection to the Jewish people) than on attitudes toward religion (ethicsand rituals) is consistent with previous research on Israel experience programs (Chazan, 1997;Cohen, 1995; Isaacs & Schwartz, 1997; Kafka, et al., 1990).
Political Attitudes Regarding Israel
The increased connection and caring for Israel among birthright israel participants did not lead todifferences with non-participants on political attitudes regarding Israeli-Palestinian relations. A
question addressing this issue was asked only on the one-year follow-up survey, so it reflects theviews of both groups as affected by the violence that had occurred since the fall of 2000. Whenpresented with a set of positions about the conduct of negotiations between Israel and the Palestinian
Authority, 4 percent of participants said negotiations could not continue in the foreseeable future; 25percent said they should continue only if Palestinian violence stops and if the division of Jerusalemand return of the Palestinians to Israel is not on the agenda; a similar proportion (27 percent) was
content to drop the latter conditions and hold only that negotiations should be suspended untilPalestinian violence stops; and 44 percent said that negotiations should continue regardless. Views ofnon-participants were nearly identical.
23
Returning to Israel: Action and Intention
Alumni Who Have Already Returned to Israel Although birthright israel is a one-time gift, a
critical outcome is that alumni will be inspired to want to return, further strengthening their connectionto the Jewish people. Over the course of the year since the trip, we found that 7 percent had indeedreturned on their own. Given the size of the group participating in the launch program, it is estimated
that between 300 and 400 returned to Israel. In light of the precipitous drop-off in travel to Israel sinceSeptember 2000, particularly among participants in study abroad programs, these numbers seemsubstantial.
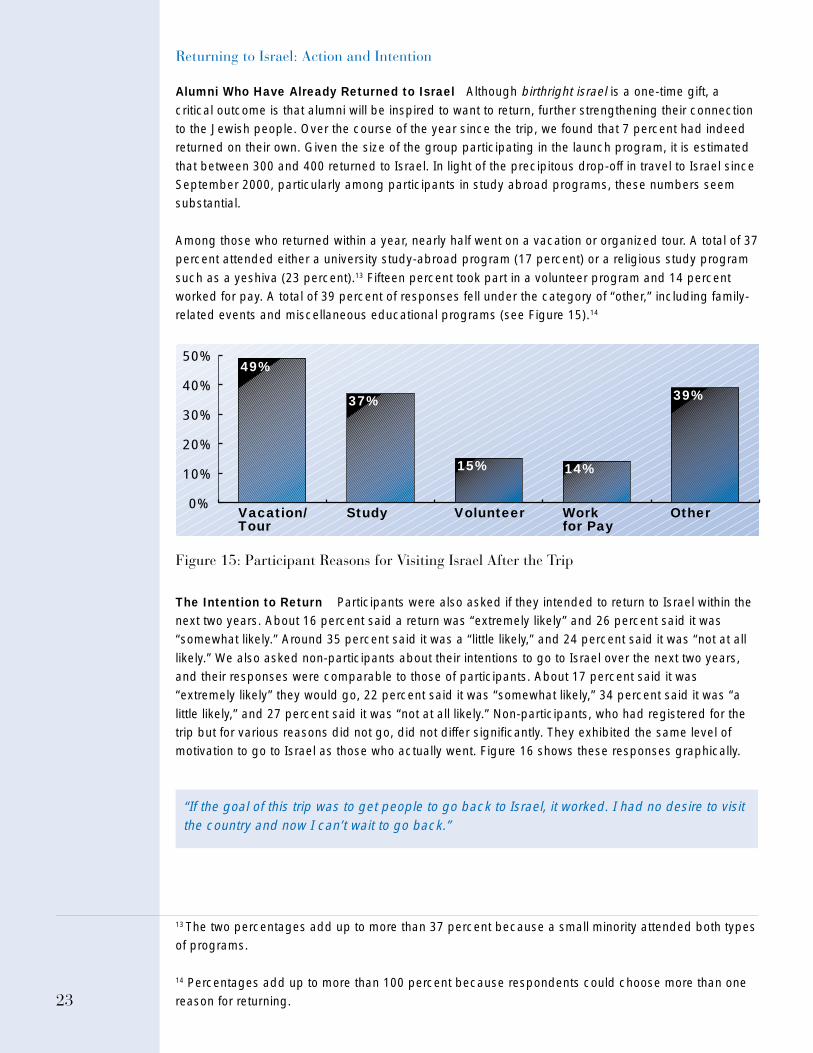
Among those who returned within a year, nearly half went on a vacation or organized tour. A total of 37percent attended either a university study-abroad program (17 percent) or a religious study program
such as a yeshiva (23 percent).13 Fifteen percent took part in a volunteer program and 14 percentworked for pay. A total of 39 percent of responses fell under the category of “other,” including family-related events and miscellaneous educational programs (see Figure 15).14
0%
10%
20%
30%
40%
50%49%
Vacation/Tour
Study Volunteer Workfor Pay
Other
37%
15% 14%
39%
Figure 15: Participant Reasons for Visiting Israel After the Trip
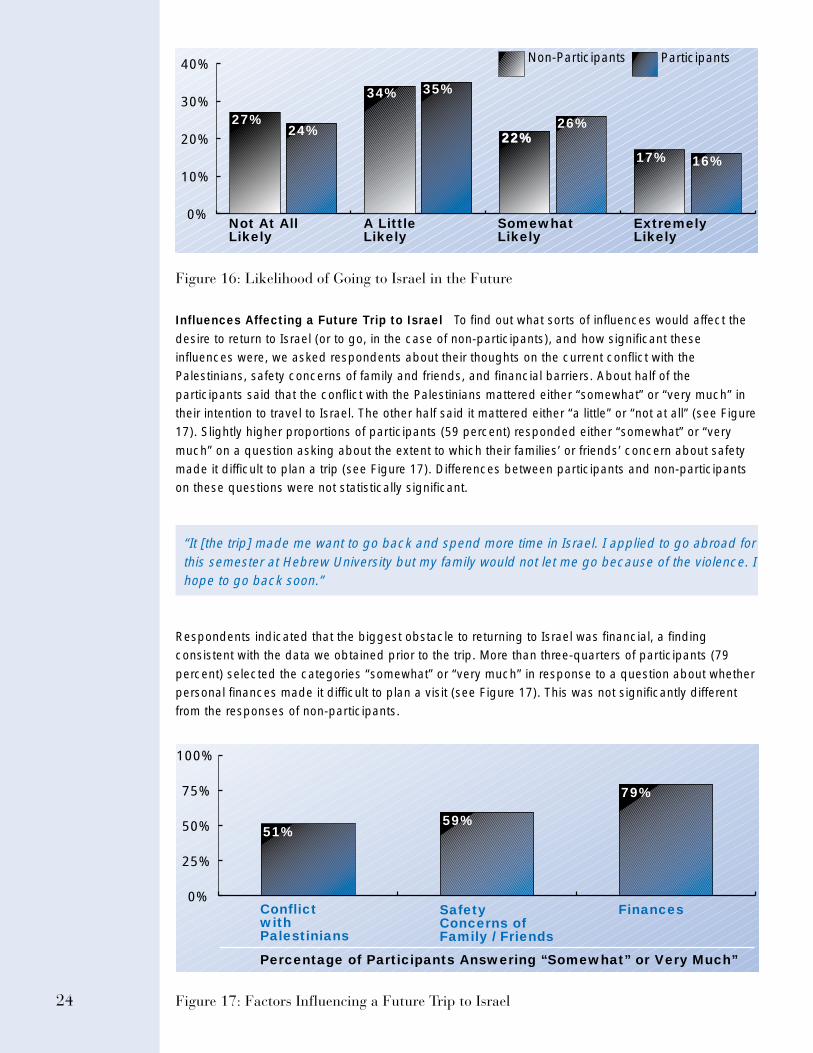
The Intention to Return Participants were also asked if they intended to return to Israel within thenext two years. About 16 percent said a return was “extremely likely” and 26 percent said it was“somewhat likely.” Around 35 percent said it was a “little likely,” and 24 percent said it was “not at all
likely.” We also asked non-participants about their intentions to go to Israel over the next two years,and their responses were comparable to those of participants. About 17 percent said it was“extremely likely” they would go, 22 percent said it was “somewhat likely,” 34 percent said it was “a
little likely,” and 27 percent said it was “not at all likely.” Non-participants, who had registered for thetrip but for various reasons did not go, did not differ significantly. They exhibited the same level ofmotivation to go to Israel as those who actually went. Figure 16 shows these responses graphically.
“If the goal of this trip was to get people to go back to Israel, it worked. I had no desire to visitthe country and now I can’t wait to go back.”
13 The two percentages add up to more than 37 percent because a small minority attended both typesof programs.
14 Percentages add up to more than 100 percent because respondents could choose more than onereason for returning.
24
0%
10%
20%
30%
40%
27%
Not At AllLikely
Non-Participants Participants
A LittleLikely
SomewhatLikely
ExtremelyLikely
24%
34% 35%
22%22%26%
17% 16%
Figure 16: Likelihood of Going to Israel in the Future
Influences Affecting a Future Trip to Israel To find out what sorts of influences would affect the
desire to return to Israel (or to go, in the case of non-participants), and how significant theseinfluences were, we asked respondents about their thoughts on the current conflict with thePalestinians, safety concerns of family and friends, and financial barriers. About half of the
participants said that the conflict with the Palestinians mattered either “somewhat” or “very much” intheir intention to travel to Israel. The other half said it mattered either “a little” or “not at all” (see Figure17). Slightly higher proportions of participants (59 percent) responded either “somewhat” or “very
much” on a question asking about the extent to which their families’ or friends’ concern about safetymade it difficult to plan a trip (see Figure 17). Differences between participants and non-participantson these questions were not statistically significant.
“It [the trip] made me want to go back and spend more time in Israel. I applied to go abroad forthis semester at Hebrew University but my family would not let me go because of the violence. Ihope to go back soon.”
Respondents indicated that the biggest obstacle to returning to Israel was financial, a findingconsistent with the data we obtained prior to the trip. More than three-quarters of participants (79
percent) selected the categories “somewhat” or “very much” in response to a question about whetherpersonal finances made it difficult to plan a visit (see Figure 17). This was not significantly differentfrom the responses of non-participants.
51%
ConflictwithPalestinians
SafetyConcerns ofFamily / Friends
Finances
79%
59%
Percentage of Participants Answering “Somewhat” or Very Much”
0%
25%
50%
75%
100%
Figure 17: Factors Influencing a Future Trip to Israel
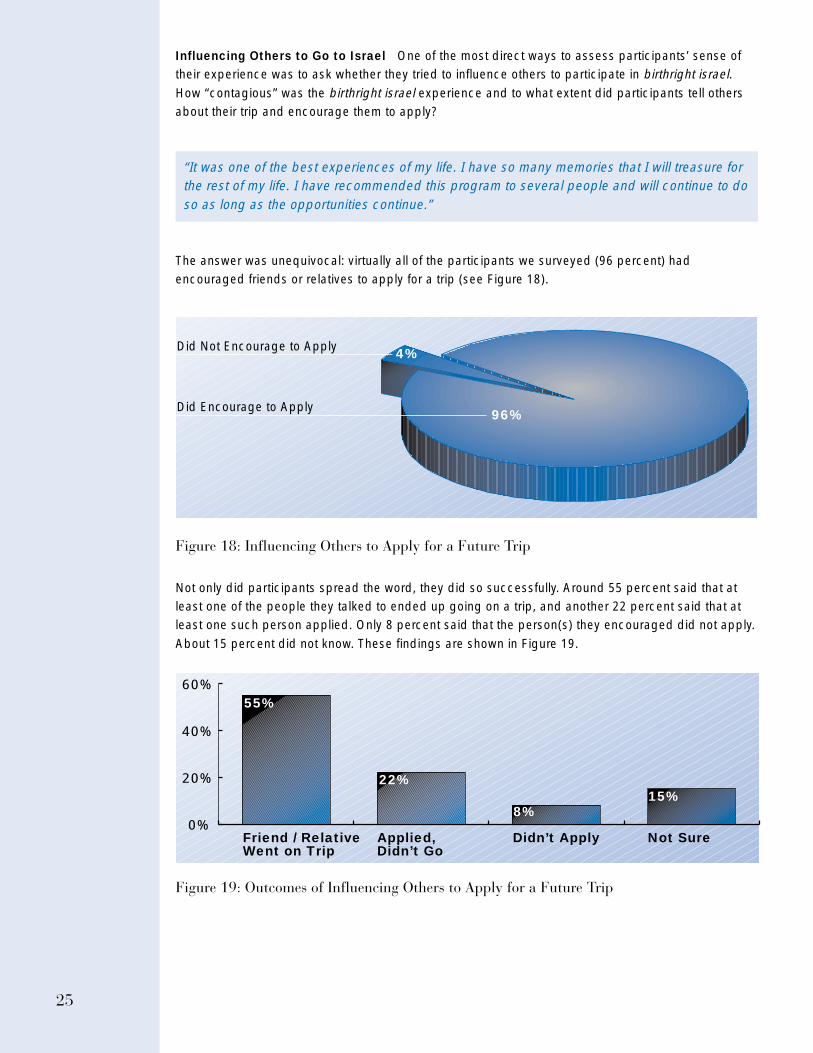
25
Influencing Others to Go to Israel One of the most direct ways to assess participants’ sense oftheir experience was to ask whether they tried to influence others to participate in birthright israel.How “contagious” was the birthright israel experience and to what extent did participants tell othersabout their trip and encourage them to apply?
“It was one of the best experiences of my life. I have so many memories that I will treasure forthe rest of my life. I have recommended this program to several people and will continue to doso as long as the opportunities continue.”
The answer was unequivocal: virtually all of the participants we surveyed (96 percent) hadencouraged friends or relatives to apply for a trip (see Figure 18).
Figure 18: Influencing Others to Apply for a Future Trip
Not only did participants spread the word, they did so successfully. Around 55 percent said that atleast one of the people they talked to ended up going on a trip, and another 22 percent said that atleast one such person applied. Only 8 percent said that the person(s) they encouraged did not apply.
About 15 percent did not know. These findings are shown in Figure 19.
0%
20%
40%
60%55%
Friend / RelativeWent on Trip
22%
8%15%
Applied,Didn’t Go
Didn’t Apply Not Sure
Figure 19: Outcomes of Influencing Others to Apply for a Future Trip
Did Not Encourage to Apply 4%
96%Did Encourage to Apply
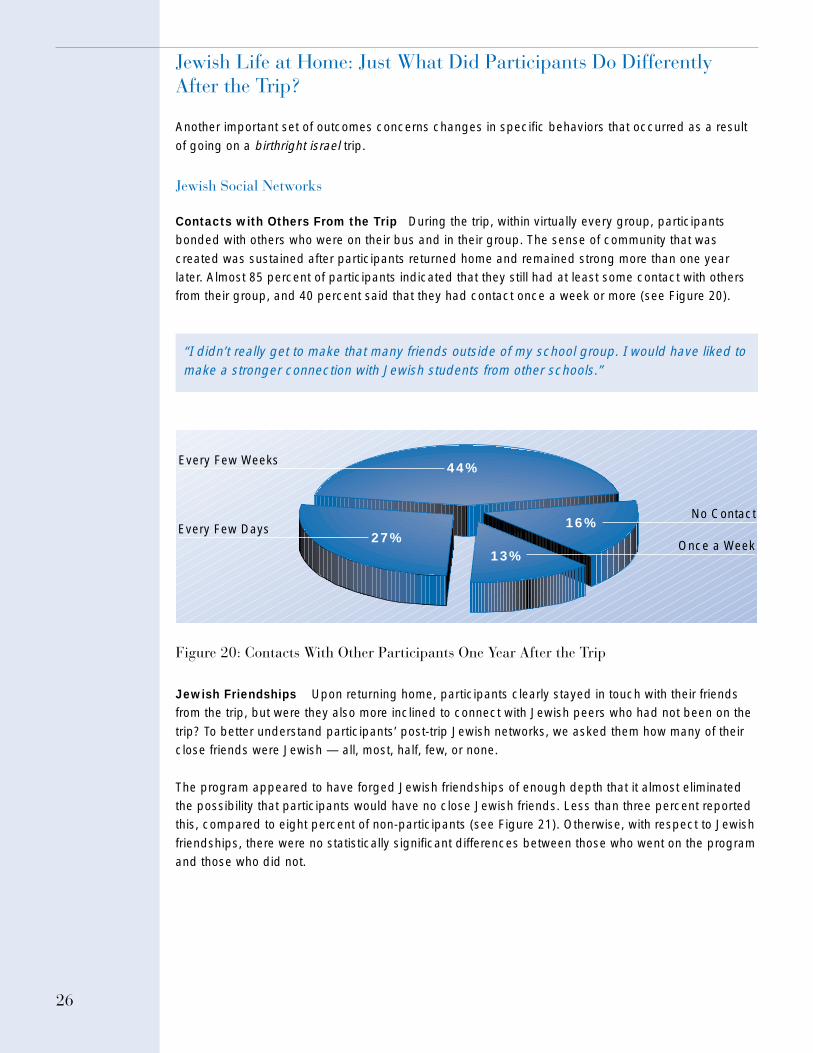
26
Jewish Life at Home: Just What Did Participants Do DifferentlyAfter the Trip?
Another important set of outcomes concerns changes in specific behaviors that occurred as a result
of going on a birthright israel trip.
Jewish Social Networks
Contacts with Others From the Trip During the trip, within virtually every group, participantsbonded with others who were on their bus and in their group. The sense of community that was
created was sustained after participants returned home and remained strong more than one yearlater. Almost 85 percent of participants indicated that they still had at least some contact with othersfrom their group, and 40 percent said that they had contact once a week or more (see Figure 20).
“I didn’t really get to make that many friends outside of my school group. I would have liked tomake a stronger connection with Jewish students from other schools.”
Figure 20: Contacts With Other Participants One Year After the Trip
Jewish Friendships Upon returning home, participants clearly stayed in touch with their friendsfrom the trip, but were they also more inclined to connect with Jewish peers who had not been on the
trip? To better understand participants’ post-trip Jewish networks, we asked them how many of theirclose friends were Jewish — all, most, half, few, or none.
The program appeared to have forged Jewish friendships of enough depth that it almost eliminatedthe possibility that participants would have no close Jewish friends. Less than three percent reportedthis, compared to eight percent of non-participants (see Figure 21). Otherwise, with respect to Jewish
friendships, there were no statistically significant differences between those who went on the programand those who did not.
Every Few Days27%
Every Few Weeks 44%
Once a Week13%
No Contact16%
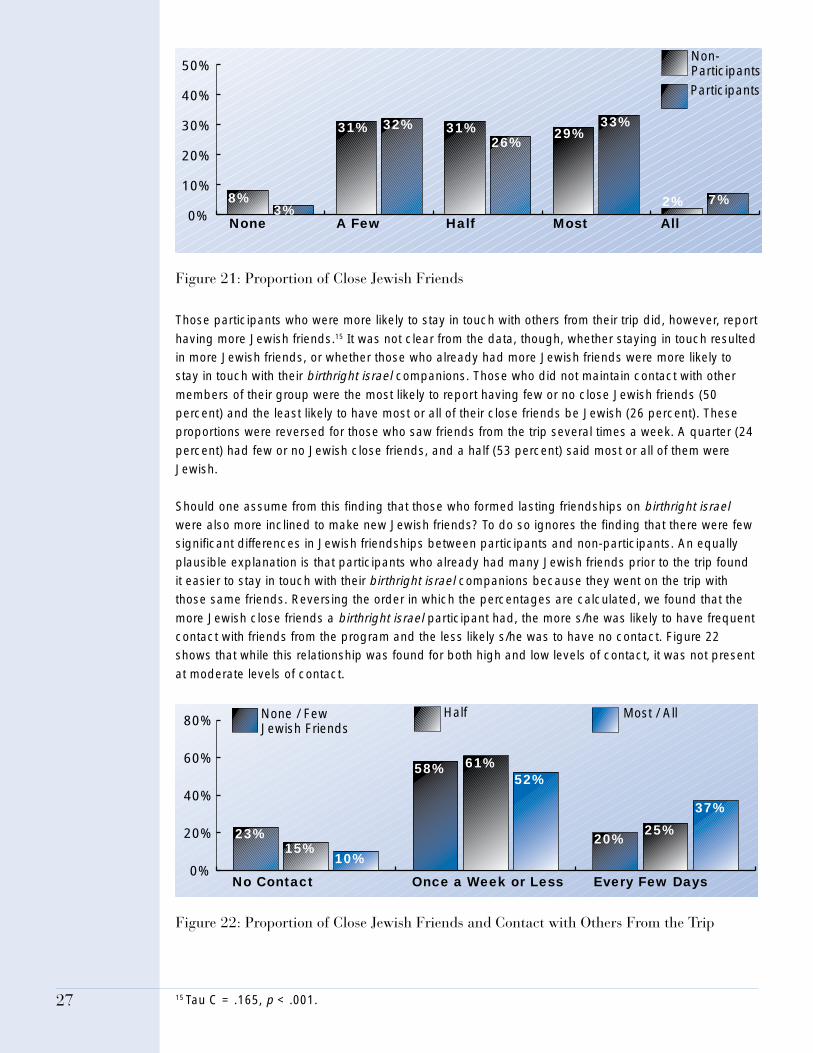
27
0%
10%
20%
30%
40%
50%
8%
None
Non-ParticipantsParticipants
A Few Half Most All3%
31% 32% 31%26%
29%33%
2% 7%
Figure 21: Proportion of Close Jewish Friends
Those participants who were more likely to stay in touch with others from their trip did, however, report
having more Jewish friends.15 It was not clear from the data, though, whether staying in touch resultedin more Jewish friends, or whether those who already had more Jewish friends were more likely tostay in touch with their birthright israel companions. Those who did not maintain contact with other
members of their group were the most likely to report having few or no close Jewish friends (50percent) and the least likely to have most or all of their close friends be Jewish (26 percent). Theseproportions were reversed for those who saw friends from the trip several times a week. A quarter (24
percent) had few or no Jewish close friends, and a half (53 percent) said most or all of them wereJewish.
Should one assume from this finding that those who formed lasting friendships on birthright israelwere also more inclined to make new Jewish friends? To do so ignores the finding that there were fewsignificant differences in Jewish friendships between participants and non-participants. An equally
plausible explanation is that participants who already had many Jewish friends prior to the trip foundit easier to stay in touch with their birthright israel companions because they went on the trip withthose same friends. Reversing the order in which the percentages are calculated, we found that the
more Jewish close friends a birthright israel participant had, the more s/he was likely to have frequentcontact with friends from the program and the less likely s/he was to have no contact. Figure 22shows that while this relationship was found for both high and low levels of contact, it was not present
at moderate levels of contact.
0%
20%
40%
60%
80%
No Contact
None / FewJewish Friends
23%
Half Most / All
Once a Week or Less Every Few Days
15%10%
58% 61%52%
20%25%
37%
Figure 22: Proportion of Close Jewish Friends and Contact with Others From the Trip
15 Tau C = .165, p < .001.
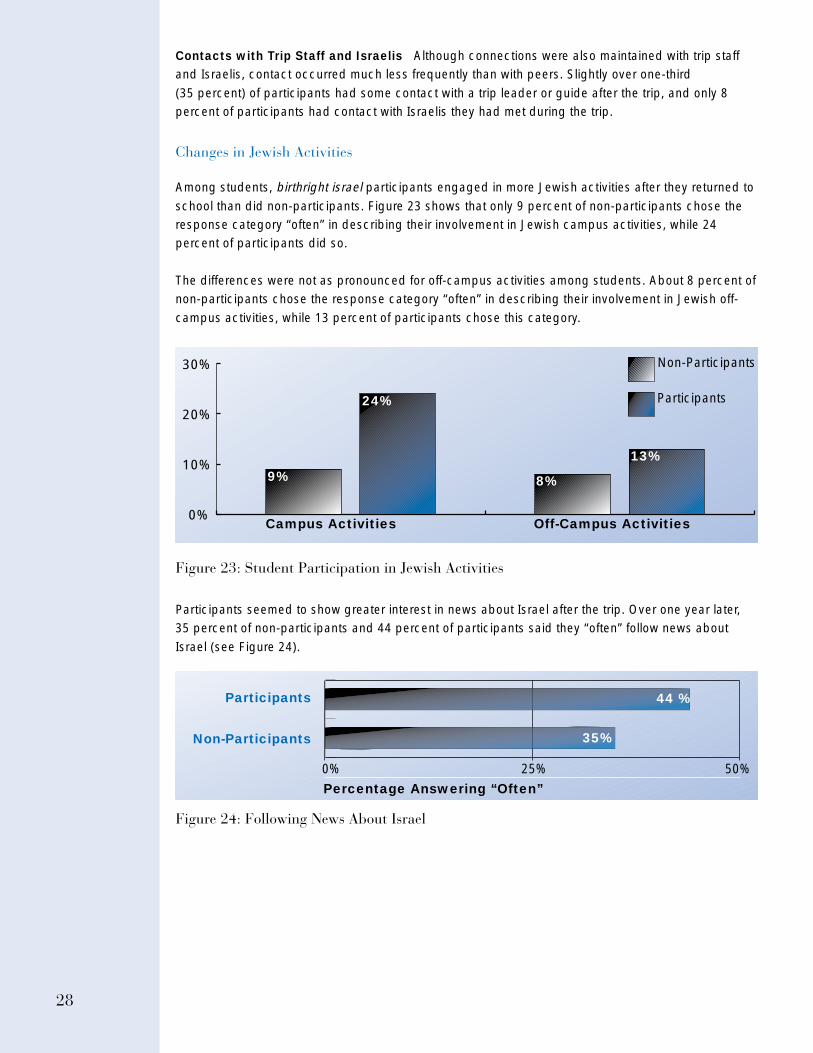
28
Contacts with Trip Staff and Israelis Although connections were also maintained with trip staffand Israelis, contact occurred much less frequently than with peers. Slightly over one-third
(35 percent) of participants had some contact with a trip leader or guide after the trip, and only 8percent of participants had contact with Israelis they had met during the trip.
Changes in Jewish Activities
Among students, birthright israel participants engaged in more Jewish activities after they returned to
school than did non-participants. Figure 23 shows that only 9 percent of non-participants chose theresponse category “often” in describing their involvement in Jewish campus activities, while 24percent of participants did so.
The differences were not as pronounced for off-campus activities among students. About 8 percent ofnon-participants chose the response category “often” in describing their involvement in Jewish off-
campus activities, while 13 percent of participants chose this category.
0%
10%
20%
30%
Campus Activities
Non-Participants
Participants
9%
Off-Campus Activities
24%
8%
13%
Figure 23: Student Participation in Jewish Activities
Participants seemed to show greater interest in news about Israel after the trip. Over one year later,35 percent of non-participants and 44 percent of participants said they “often” follow news about
Israel (see Figure 24).
Participants
Non-Participants
0%
Percentage Answering “Often”25% 50%
44 %
35%
Figure 24: Following News About Israel
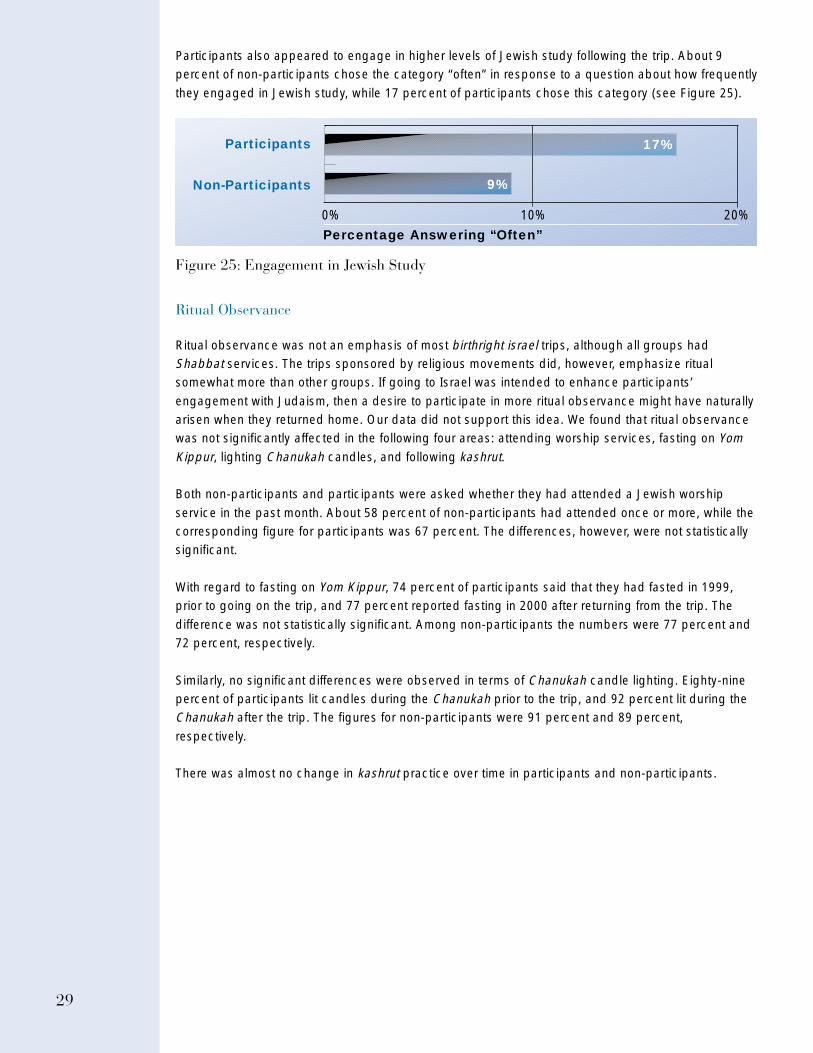
29
Participants also appeared to engage in higher levels of Jewish study following the trip. About 9percent of non-participants chose the category “often” in response to a question about how frequently
they engaged in Jewish study, while 17 percent of participants chose this category (see Figure 25).
Participants
Non-Participants
0%
Percentage Answering “Often”10% 20%
17%
9%
Figure 25: Engagement in Jewish Study
Ritual Observance
Ritual observance was not an emphasis of most birthright israel trips, although all groups hadShabbat services. The trips sponsored by religious movements did, however, emphasize ritualsomewhat more than other groups. If going to Israel was intended to enhance participants’
engagement with Judaism, then a desire to participate in more ritual observance might have naturallyarisen when they returned home. Our data did not support this idea. We found that ritual observancewas not significantly affected in the following four areas: attending worship services, fasting on YomKippur, lighting Chanukah candles, and following kashrut.
Both non-participants and participants were asked whether they had attended a Jewish worship
service in the past month. About 58 percent of non-participants had attended once or more, while thecorresponding figure for participants was 67 percent. The differences, however, were not statisticallysignificant.
With regard to fasting on Yom Kippur, 74 percent of participants said that they had fasted in 1999,prior to going on the trip, and 77 percent reported fasting in 2000 after returning from the trip. The
difference was not statistically significant. Among non-participants the numbers were 77 percent and72 percent, respectively.
Similarly, no significant differences were observed in terms of Chanukah candle lighting. Eighty-ninepercent of participants lit candles during the Chanukah prior to the trip, and 92 percent lit during theChanukah after the trip. The figures for non-participants were 91 percent and 89 percent,
respectively.
There was almost no change in kashrut practice over time in participants and non-participants.
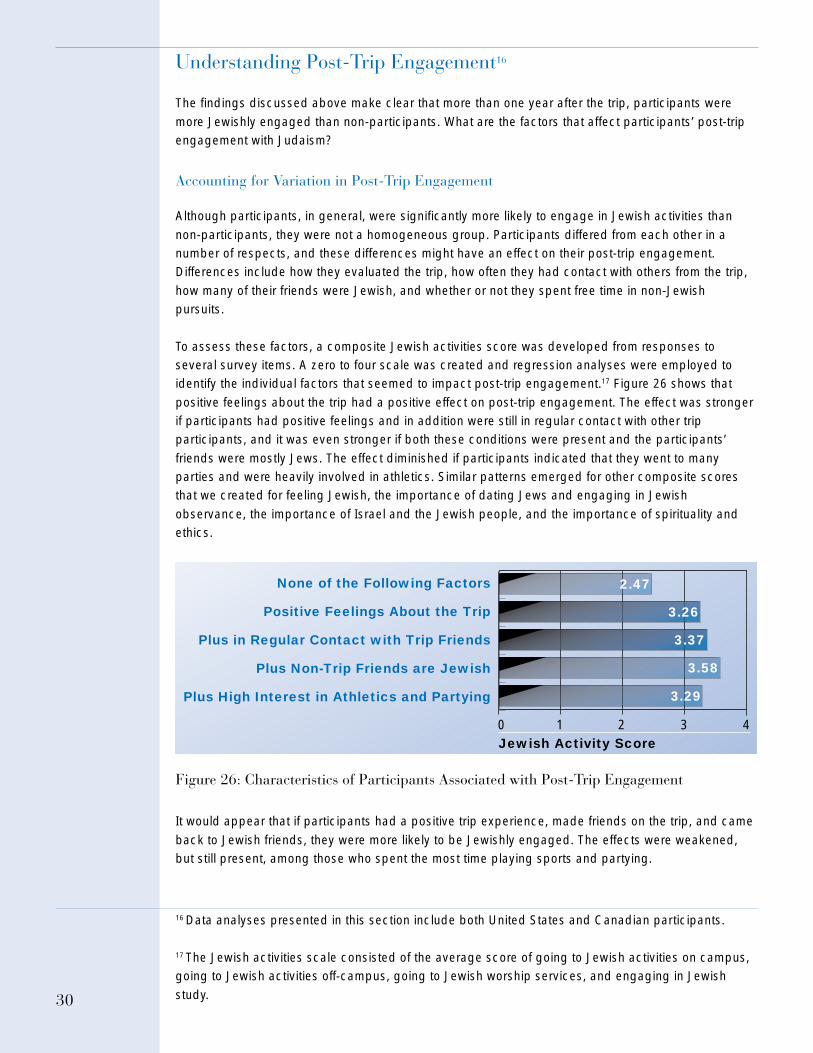
30
Understanding Post-Trip Engagement16
The findings discussed above make clear that more than one year after the trip, participants were
more Jewishly engaged than non-participants. What are the factors that affect participants’ post-tripengagement with Judaism?
Accounting for Variation in Post-Trip Engagement
Although participants, in general, were significantly more likely to engage in Jewish activities than
non-participants, they were not a homogeneous group. Participants differed from each other in anumber of respects, and these differences might have an effect on their post-trip engagement.Differences include how they evaluated the trip, how often they had contact with others from the trip,
how many of their friends were Jewish, and whether or not they spent free time in non-Jewishpursuits.
To assess these factors, a composite Jewish activities score was developed from responses toseveral survey items. A zero to four scale was created and regression analyses were employed toidentify the individual factors that seemed to impact post-trip engagement.17 Figure 26 shows that
positive feelings about the trip had a positive effect on post-trip engagement. The effect was strongerif participants had positive feelings and in addition were still in regular contact with other tripparticipants, and it was even stronger if both these conditions were present and the participants’
friends were mostly Jews. The effect diminished if participants indicated that they went to manyparties and were heavily involved in athletics. Similar patterns emerged for other composite scoresthat we created for feeling Jewish, the importance of dating Jews and engaging in Jewish
observance, the importance of Israel and the Jewish people, and the importance of spirituality andethics.
None of the Following Factors
Positive Feelings About the Trip
Plus in Regular Contact with Trip Friends
Plus Non-Trip Friends are Jewish
Plus High Interest in Athletics and Partying
25%
1 2 3 40Jewish Activity Score
2.47
3.26
3.37
3.58
3.29
Figure 26: Characteristics of Participants Associated with Post-Trip Engagement
It would appear that if participants had a positive trip experience, made friends on the trip, and came
back to Jewish friends, they were more likely to be Jewishly engaged. The effects were weakened,but still present, among those who spent the most time playing sports and partying.
16 Data analyses presented in this section include both United States and Canadian participants.
17 The Jewish activities scale consisted of the average score of going to Jewish activities on campus,going to Jewish activities off-campus, going to Jewish worship services, and engaging in Jewish
study.
31
Students and Non-Students
As noted earlier, student participants were more engaged in on-campus Jewish activities than off-
campus activities. There is nothing surprising about this finding. However, a more fundamentalquestion is whether students were more engaged than non-students, both in terms of their Jewishidentities and behaviors. To answer this question, several additional analyses were conducted by
comparing the data obtained from participants who indicated they were full-time undergraduates (70percent of all participants) with those who were not students (18 percent). For ease of comparison,the remaining 12 percent, who were either part-time or graduate students, were omitted from these
analyses. All subsequent references to students refer to full-time undergraduates.
Similarities and Differences Between Students and Non-Students No significant differences
were observed between students and non-students on a series of questions about Jewish identity,ritual observance, and Israel travel.
There were no student/non-student differences in Jewish identity, specifically regarding theimportance of:• Jewish peoplehood
• Ethics and spirituality• Holocaust remembrance• Fighting anti-Semitism
There were no student/non-student differences in ritual observance, specifically regarding:• Kashrut observance
• Shabbat candle lighting• Attendance at services18
• Self-described commitment to religious observance
There were no student/non-student differences in Israel travel and interest in Israel, specificallyregarding:
• Ratings of birthright israel• Intended or actual travel to Israel since the trip• Perceptions regarding safety of Israel travel
• Following news about Israel
In three other areas, differences were observed between students and non-students, specifically
regarding:• Coursework in Jewish subjects• Leadership in Jewish organizations
• Social networks
As might be expected, current undergraduate students were more likely than those not enrolled in
school to have taken courses on Jewish subjects over the past 15 months. One out of every three (35percent) undergraduate participants in birthright israel indicated they had taken a course in Jewishstudies, while only 15 percent of non-students had taken such a course.
18 A statistically significant difference, where non-students were slightly less likely to have attendedservices in the previous month, disappeared once we controlled for age.
32
Leadership in voluntary organizations, whether Jewish or not, declined as people left the universitysetting. It is likely there are fewer such opportunities for recent graduates. Sixty-one percent of full-
time undergraduate student participants had some type of leadership position in non-Jewishorganizations, compared to 38 percent of non-students. The student/non-student differential wassmaller when considering Jewish activities. There, 37 percent of full-time undergraduate students who
went on birthright israel indicated that they held a Jewish leadership position, compared to 28percent of non-student alumni.
Although students and non-students did not differ in the overall proportion of their close friends whowere Jewish, students were more likely than non-students to see their fellow birthright israel groupmembers on at least a weekly basis. However, the difference between the two groups (44 percent
versus 33 percent, respectively) was not as large as might be anticipated. One would expect thatstudents inhabiting a college campus, where interactions with peers are frequent, would be muchmore likely to interact with fellow birthright israel alumni than would non-students, whose interactions
with peers, overall, are less frequent.
We also found no differences between students and non-students in the proportion that had no
contact with trip leaders (64 and 65 percent, respectively). However, for those who did maintaincontact, it tended to be more frequent for students. Five percent of all students saw their trip staffevery few days, compared to less than one percent of non-students. Particularly for those participants
who were part of a campus-sponsored Hillel trip, it is likely that they had more opportunity forinteraction than non-students.
Follow-Up Activities for Alumni Regression analyses indicated that students were generally morelikely than non-students to be aware of and to participate in follow-up activities for birthright israelalumni. Models controlling for age, gender, country of residence and perceptions of the quality of the
birthright israel trip, indicated the following:
Students were more likely than non-students to be aware of and to participate in alumni gatherings,
including:• Parties• Reunions
• Retreats• Orientations for new participants
Students were more likely to be aware of and to read alumni media, including:• Newsletters• E-mail groups
Although students, in contrast with non-students, were more aware of and more likely to participate infollow-up activities directly specifically at them, they did not participate in general Jewish communal
activities any more than non-students. Students were more likely to be aware of activities such ascelebrations of special events connected to Israel, Jewish learning programs, Shabbat or holidayprograms, Jewish cultural activities, and political activity related to Israel. But they were no more likely
to take part in them.
33
In summary, being a student made it more likely that a birthright israel alumnus or alumna would findout about and get involved in those activities that were specifically oriented toward keeping the group
in contact. Students were also more aware of program offerings in the broader Jewish community thatwere not specifically oriented toward birthright israel alumni. But this awareness did not translate intoa greater level of participation. Regardless of whether one considers the birthright israel groups to be
“Jewish communities of meaning” or simply ordinary social groups, these networks are betterperpetuated within the campus setting. However, campuses appear to have no advantage over othersettings in fostering actual participation in broader communal activities.
Explaining Student/Non-Student Differences Why might campuses be better settings forfostering Jewish learning, Jewish leadership, and alumni networks?
Since colleges are structured around classroom learning, it is not surprising that people whoseprimary self-definition is “student” would have more of an inclination to enroll in Jewish classes.
Equally important, the opportunity for such learning exists. Recent years have witnessed a substantialincrease in the number of Jewish studies classes (see Cohen & Davidson, 2001). Course options areoften diverse and standardized registration makes enrollment easy. The opportunity exists at a time of
life when broadening knowledge is one’s primary life activity. In addition, to the extent that enrollmentin a Judaic studies course fulfills a humanities, language, or other matriculation requirement, itsatisfies a utilitarian motive.
Contrast this with the situation of a recent graduate. Here, the primary self-definition is as a worker,not as a student, and options for learning are not as easy to access. Beginning a program of formal
study, be it through a course, with a tutor, or alone, requires more of an act of will. Most importantly,Jewish study is now relegated to a leisure-time activity, to be pursued after work hours or during alunch break. It does not serve utilitarian goals and it competes with other activities.
Jewish leadership among students can be explained through an understanding of campus social life.Many students engage in extracurricular activities on campus, simultaneously pursuing personal
interests and meeting like-minded fellow students. These activities often take place in the context ofstudent-run organizations, where opportunities for leadership naturally arise. Students inspired by abirthright israel trip might be more inclined to gravitate toward Jewish organizations and assume
positions of leadership.
The most likely explanation for student/non-student differences in follow-up activities stems from the
dominant role of Hillel in the launch of birthright israel. Nearly half of the students went on Hillel-sponsored trips, and the same groups that toured Israel together returned to campus together.
Generally speaking, the presence of differences between students and non-students suggests thatsome post-trip effects of a birthright israel trip depend, at least in part, on the general lifestyle andcontext of participants’ daily lives. Campus life, where students are engaged in daily learning and are
in regular contact throughout the day with others their own age, is more conducive to maintaining thecommunity consciousness formed on birthright israel trips. In contrast, non-students are moreisolated, have a more structured schedule, and have less free-time for study and to socialize with
peers.
Although campuses appear to have an advantage in promoting Jewish learning and leadership, and
in sustaining alumni networks, there were no differences between campus and non-campusparticipants on measures of Jewish identity or religious practice. It is not yet evident whether theadvantages we did observe came about because participants from the same campus traveled
together, or because of an influence from the campus setting itself.
34
The Effect of the School Attended
Were there differences from school to school in post-trip engagement? Examining the effect of the
specific campus to which alumni returned, we found that participation rates in alumni follow-upactivities varied by location. The university context accounted for 21 percent of the variance inparticipation in alumni activities.19 This relatively high percentage indicates that the school a person
attends has a significant influence on their post-trip involvement. There were clear differences amongcolleges in the level of activity of birthright israel alumni.
One might assume that certain schools managed to attract birthright israel participants to alumniactivities more than other schools because their students were somehow predisposed to involvement.It is true that schools varied in the Jewish identity and practice of their undergraduate body. Nine
percent of the variance in the reported importance of being Jewish, marrying Jewish, and raisingchildren Jewishly could be accounted for by the university attended, as could 6 percent of thevariance in ritual observance. But the schools that had the most active birthright israel alumni were
not necessarily those with most observant or Jewishly committed students.
Something other than the Jewish commitment level of the student body accounts for greater post-trip
engagement. Without, however, actually studying the nature of the university Jewish communities towhich birthright israel participants returned, we can only speculate about possible reasons. Althoughstudies of post-trip programming efforts in Hillels and Jewish student unions have not yet been
undertaken, it is likely that differences among these institutions play an important role. Thedemographic composition of the campus, the relationships among Jews and non-Jews there, themakeup of the birthright israel cohorts, and the quality of the trip itself relative to trips taken by
students at other campuses may turn out to be relevant considerations.
19 See the Explanatory Note at the end of Appendix B for more detail on the Variance Components
Analysis procedure used to calculate these percentages.
35
Conclusions

36
37
Conclusions What Are We Learning?
When birthright israel was launched in 1999, the idea was greeted with a mixture of hopefulness and
skepticism. Given the many needs of the Jewish community, and the critical gaps in Jewish educationprograms for young people, spending millions of dollars to provide ten-day educational trips seemeda risky strategy. Still, there was a widespread perception that a serious problem existed — young
Diaspora Jews were not connecting to their tradition. Before the program was launched, it wasunclear whether large numbers of participants could be recruited and, even if they could, whetherparticipation on a brief trip could be a meaningful educational encounter. We now have nearly two
years of systematic data and the benefit of perspective. Our unequivocal answer is that the programhas both attracted a broad range of participants and engendered a meaningful change in theirJewish identities.
Six thousand young Jews from North America went on the first birthright israel trips, and through thesummer of 2001, 22,000 have traveled to Israel from all over the world. On one basic level, the
program can be considered a success by a simple criterion — the extraordinarily high level of interestit has generated. More than 50,000 young people applied to participate in the program, most ofwhom would not otherwise have gone to Israel. Even in the face of continuing violence affecting
Israel, interest in the program has continued. As evidenced by the very high percentage of pastparticipants who encouraged their friends to go, it is clear that the “buzz” on the street aboutbirthright israel is extremely positive.
Our task as social scientists has been to look more deeply at the birthright israel experiment. We havesought to understand the nature of the program’s impact, the reasons for its success, and how its
impact might be sustained. As part of our analysis, we have examined multiple criteria and collecteddata not just from participants, but also from others who are similar to them. Two central questionshave been asked. First, what effects did the launch program have on participants, and second, were
these effects fleeting or enduring?
As researchers who have conducted evaluation studies for nearly three decades, we have seen many
promising social experiments fail or yield only middling results. What we found in studying birthrightisrael has surprised us. The simple message of this report is that the experiment was, and continuesto be, a huge success. From the perspective of fifteen months after the trip, participants continue to
view the experience as extremely meaningful and it appears to have had a very positive impact ontheir Jewish identity and their attitudes towards Israel, Judaism, and the Jewish people. It is rare insocial science research for attitudinal change to be sustained over time, and it is even more rare
when attitudes are not only sustained but do not diminish.
“Priceless. I owe the enthusiasm of my current Jewish life to birthright. As the Talmud teaches— if one person was saved the whole world has been saved. Birthright literally saved theJewish world.”
Participants, compared to others who applied but were not selected to participate in the program,
look very different. More than a year after they return home, participants’ attitudes and aspects oftheir engagement in the Jewish community are different than that of their non-participant peers.Although sustained changes in attitudes were observed, and we found significant changes in actual
engagement, participation in birthright israel did not magically transform young Jews overnight. Formost participants, with the exception of a small group who became baalei teshuvah (Jews who“return” to traditional observance), their Jewish engagement only changed in limited ways. The goal
38
of the program was to be a catalyst for change, so it is unrealistic to expect that participants would becompletely transformed. Ten days, no matter how powerful, cannot, by themselves, make someone
an inspired Jew for life.
The birthright israel experience gave participants an experience that was novel for most of them —
being part of a Jewish community. Each bus was a community in itself, and the sense of communitywas further reinforced when participants traveled to and from Israel with hundreds of peers. Thebirthright israel Mega Event, an evening celebration that brought together participants from all of the
various trips, enabled them to be part of a community of thousands. Ten days of togetherness cancreate warm and tight bonds, and our survey data make clear that participants stayed in close touchwith one another after the trip. But they didn’t just connect with each other — many said they realized
for the first time what it means to be Jewish.
The program sponsors, including the Israeli government, Jewish communities around the world, and
private philanthropists, felt strongly that providing young Jews with an opportunity to experienceIsrael could spark renewed commitment and Jewish engagement. Although it is difficult to separatethe impact of the program from its status as a “gift,” there is no doubt that this feature of the program
was important, even critical. It not only made it possible for many to participate who would nototherwise have been able to go, it was a dramatic indicator to participants of concern and interest bythe Jewish community. Ironically, the affluence of contemporary America has, perhaps, made the
present generation of 18-26 year olds even more sensitive to financial issues and more conscious ofthe value of the gift than earlier generations would have been. It is one explanation for their view ofthe program’s meaningfulness and educational value.
Post-Trip Programming
The dramatic effects documented by the evaluation raise an important question. How can the senseof community created during the trip be maintained after the trip? A critical issue arising from thesefindings is how to best understand, predict, and influence post-trip engagement. What have we
learned from the birthright israel launch program about the factors that are central to engagement?
Our analyses support the idea that experiences on a birthright israel trip are not the sole determinant
of whether alumni become engaged in post-trip activities. If alumni have Jewish friends, and if theystay in contact with other trip participants, they more readily become involved in Jewish life. This ismore likely in some settings than in others. It may be far easier to sustain engagement when one is in
close contact with other participants as well as local rabbis and madrichim from the trip. Collegecampuses have a decided advantage in involving people in alumni programming, but the degree ofparticipation in these activities varies substantially across universities. Moreover, the impact of
specific school settings declines when it comes to translating the birthright israel experience intoritual observance or active participation with other parts of the Jewish community.
Thus, the settings to which alumni return influence the long-term Jewish effects of birthright israel.However, the ways in which this occurs are complex and are difficult to sort out, since our data comefrom individual participants. It was impractical to collect separate data about the myriad schools and
communities to which alumni returned. The data we do have indicate that aspects of the post-tripsetting are more strongly associated with some outcomes than others, but we cannot yet determinewhich ones are most salient. When this information becomes available, through further research,
informed efforts can be made to influence campuses and communities through thoughtful socialpolicy. Follow-up activities in settings that appear to be most successful with alumni are essential asthe program matures.
39
Next Steps
The birthright israel experiment is now entering its third year of operation. It is a time when Israel isfacing a series of vexing problems that offer no easy solution. The ongoing violence has devastated
the country’s tourism industry and resulted in a more than 50 percent decline in visits from NorthAmericans during the first six months of 2001, compared to the previous year.20 That tens ofthousands of young Diaspora Jews continue to be interested in learning about their heritage by
visiting Israel is, as we suggested earlier, one of the best indications that the program is a success.Our findings make it clear that past participants are the best advertisement for the program.
Our hope, however, is that this report has stimulated consideration of more profound questions aboutbirthright israel. The launch program follow-up data reported here demonstrate that the experiencehad both cognitive and affective effects on participants and that the program appears to serve as a
catalyst for Jewish engagement. Answering the central question of whether participants are now on anew Jewish trajectory requires additional follow-up and data collection several years post-trip.
Another important question raised by birthright israel concerns the generalizability of the findings.The short and medium-term success of the program stands out very favorably when contrasted with ahost of less-than-successful prior efforts at large-scale Jewish educational interventions in other
contexts. There may be important lessons to be learned as a result of the birthright israel program —for other facets of Jewish education and, perhaps, education more generally. The intensity ofbirthright israel, coupled with its communal focus, may be a model for different kinds of interventions
both with young adults and other age groups.
Finally, and perhaps most important for the long-term assessment of birthright israel, the report also
raises a series of challenges for birthright israel about how to sustain the Jewish involvement of thosethe program touches. The attitude change produced by the experience is not yet matched by long-term behavior change in participants. Whether it is an issue of how the communities are prepared to
deal with birthright israel alumni or, more simply, a question of making connections between elementsof the program and participants is not clear. It seems unequivocal that birthright israel participantsare inspired and motivated — a seed has been planted that needs to be nurtured. The participants
are not a unitary group. Aside from socio-demographic diversity, they represent the breadth ofreligious and cultural diversity among the Jewish community in the Diaspora.
What is now self-evident is that it is up to Jewish communities to find ways to engage the diversebirthright israel alumni. It probably means removing a host of barriers — financial and competence-related — to participation in the Jewish community. But it is also likely to entail the creation of new
programs that satisfy the need for connection and community nurtured by birthright israel. Being inIsrael as part of birthright israel provided alumni with a very positive Jewish educational experience. Itgave them a sense of the possibilities of Jewish communal engagement. From campus programs, to
synagogues, community centers, and other community-based organizations, the challenge is todevelop equally engaging opportunities — ones that capture the spirit of Klal Yisrael and the love ofIsrael. In this troubled time in history when faith is being tested by daily events, the need is
unprecedented and the potential is unlimited.
20 Figure based on the number of tourist visas issued. Data obtained from the Israel Consulate ofBoston in August 2001, originally provided by the New York Office of the Israel Government Ministryof Tourism.

40

41
Appendices

42
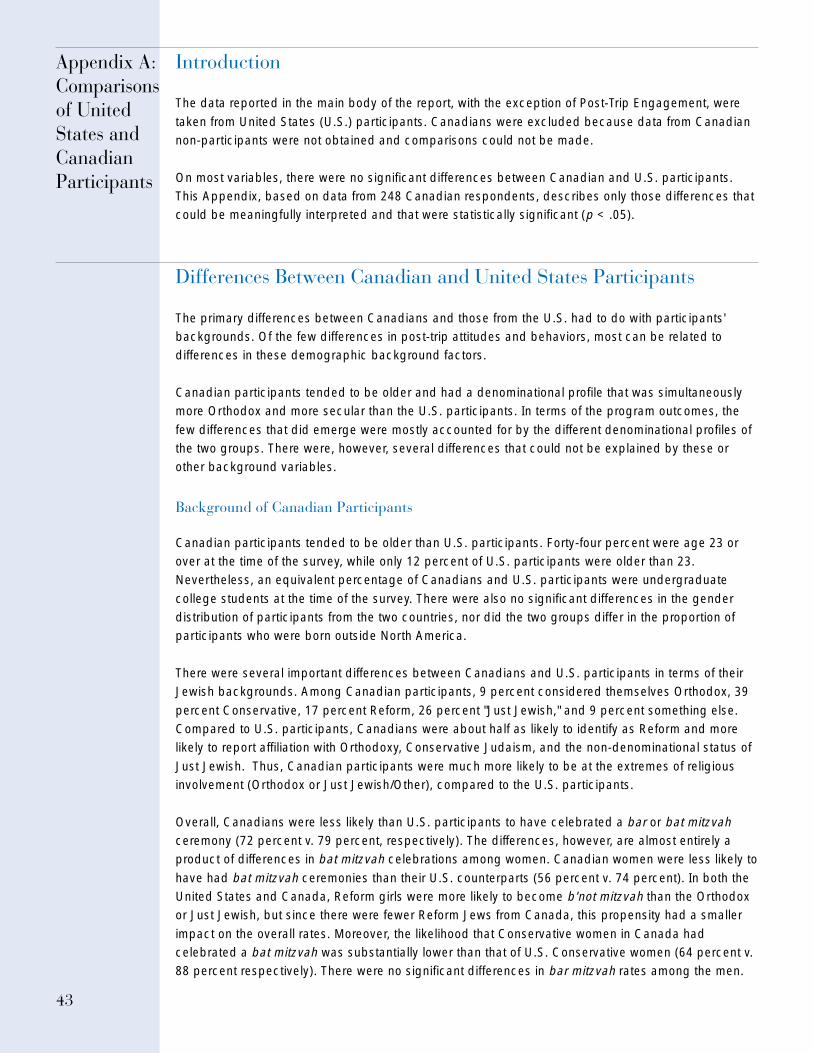
43
Introduction
The data reported in the main body of the report, with the exception of Post-Trip Engagement, were
taken from United States (U.S.) participants. Canadians were excluded because data from Canadiannon-participants were not obtained and comparisons could not be made.
On most variables, there were no significant differences between Canadian and U.S. participants.This Appendix, based on data from 248 Canadian respondents, describes only those differences thatcould be meaningfully interpreted and that were statistically significant (p < .05).
Differences Between Canadian and United States Participants
The primary differences between Canadians and those from the U.S. had to do with participants'backgrounds. Of the few differences in post-trip attitudes and behaviors, most can be related todifferences in these demographic background factors.
Canadian participants tended to be older and had a denominational profile that was simultaneouslymore Orthodox and more secular than the U.S. participants. In terms of the program outcomes, the
few differences that did emerge were mostly accounted for by the different denominational profiles ofthe two groups. There were, however, several differences that could not be explained by these orother background variables.
Background of Canadian Participants
Canadian participants tended to be older than U.S. participants. Forty-four percent were age 23 orover at the time of the survey, while only 12 percent of U.S. participants were older than 23.Nevertheless, an equivalent percentage of Canadians and U.S. participants were undergraduate
college students at the time of the survey. There were also no significant differences in the genderdistribution of participants from the two countries, nor did the two groups differ in the proportion ofparticipants who were born outside North America.
There were several important differences between Canadians and U.S. participants in terms of theirJewish backgrounds. Among Canadian participants, 9 percent considered themselves Orthodox, 39
percent Conservative, 17 percent Reform, 26 percent "Just Jewish," and 9 percent something else.Compared to U.S. participants, Canadians were about half as likely to identify as Reform and morelikely to report affiliation with Orthodoxy, Conservative Judaism, and the non-denominational status of
Just Jewish. Thus, Canadian participants were much more likely to be at the extremes of religiousinvolvement (Orthodox or Just Jewish/Other), compared to the U.S. participants.
Overall, Canadians were less likely than U.S. participants to have celebrated a bar or bat mitzvahceremony (72 percent v. 79 percent, respectively). The differences, however, are almost entirely aproduct of differences in bat mitzvah celebrations among women. Canadian women were less likely to
have had bat mitzvah ceremonies than their U.S. counterparts (56 percent v. 74 percent). In both theUnited States and Canada, Reform girls were more likely to become b'not mitzvah than the Orthodoxor Just Jewish, but since there were fewer Reform Jews from Canada, this propensity had a smaller
impact on the overall rates. Moreover, the likelihood that Conservative women in Canada hadcelebrated a bat mitzvah was substantially lower than that of U.S. Conservative women (64 percent v.88 percent respectively). There were no significant differences in bar mitzvah rates among the men.
Appendix A:Comparisonsof UnitedStates andCanadianParticipants
44
The more traditional profile of Canadian Jewry reflected in the denominational distribution and thegender norms surrounding bar and bat mitzvah was also evidenced in higher rates of Jewish day
school enrollment and informal Jewish education. Twice as many Canadian participants than U.S.participants graduated from a Jewish secondary school (13 percent v. 6 percent). Although therewere no significant differences in Jewish youth group participation, the rates of Jewish overnight
camp enrollment (as either a camper or a counselor) were somewhat higher for Canadians (62percent v. 50 percent).
Effects of the Trip on Canadian Participants
Overall, there were few significant differences between Canadians and U.S. participants in post-trip
outcome measures. There were, however, a few instances where differences were observed. Thefocus on differences should not, however, obscure the broader finding that outcomes for the twogroups were essentially similar.
Effects of Student Status One behavioral indicator of trip effects in which Canada-U.S.differences were noted involved campus-based activities. Canadian students were less likely than
U.S. students to have selected the response category "often" in describing their involvement in post-trip Jewish activities on campus (11 percent v. 24 percent).1 There were no differences between thetwo groups with regard to off-campus activities.
Overall, Canadian participants were less likely to engage in Jewish study (24 percent said they neverundertook this activity, compared to 12 percent of U.S. participants). Controlling for student status
revealed that the differences were found only among full-time undergraduates. There were nodifferences in Jewish study between Canadians and U.S. participants who were not students.
Student status did, however, account fully for differences between Canadians and U.S. participantswith regard to their frequency of contact with friends from the trip. Seventeen percent of Canadianswere in touch with friends from the trip every few days, compared to 27 percent of U.S. participants.
However, this effect disappeared once student status was controlled.
Effects of Denominational Affiliation on Jewish Identity On a series of measures of Jewish
identity, Canadian participants were less likely than U.S. participants to indicate strong Jewishaffiliation. They were less likely to have attended services in the month prior to the survey (51 percentv. 67 percent) and more likely to say that attending synagogue was not at all important to their
personal sense of being Jewish (23 percent v. 15 percent). In addition, they were less likely toexpress a strong sense of connection to the Jewish people (56 percent said they "very much" feltsuch a connection, compared to 65 percent of U.S. participants), less likely to say they were "very
much" exploring their Judaism (28 percent v. 36 percent) and less likely to say that making the worlda better place was central to their sense of being Jewish (40 percent v. 54 percent).
Despite these differences, on most indicators of Jewish identity and behavior, there were nosignificant differences between the two groups. No significant differences were observed with regardto the extent that their personal sense of being Jewish involved living a rich spiritual life, caring about
Israel, remembering the Holocaust, or celebrating Jewish holidays, among other things. No significantdifferences were observed in their responses to the question: "How important in your life is beingJewish?" Nor were differences observed in responses about opinions on interdating and
intermarrying, observing the High Holidays and Chanukah, or keeping kosher.
1 Because this question was asked only of students, the control for student status was built-in.
45
In attempting to explain the differences that were observed, denominational affiliation was used as acontrol variable. In all cases, the inclusion of affiliation eliminated differences between the Canadians
and U.S. participants who identified as Orthodox. The same was true for those who consideredthemselves Just Jewish. Almost all differences between Reform Jews from the two countriesdisappeared with the exception of the centrality to personal Jewish identity of tikkun olam, or making
the world a better place. U.S. Reform Jews were much more likely to affirm the salience of this valuethan Canadian Reform Jews.
The only denomination for which Canada-U.S. differences persisted was among those who identifiedthemselves as Conservative Jews. Canadian participants who reported affiliation with theConservative movement were less likely to express a strong Jewish identity than the U.S.
Conservative Jews.
Travel to Israel With regard to future Israel travel, Canadian participants were less likely than U.S.
participants to say that their future plans would be affected by security concerns. When askedwhether the Israeli-Palestinian conflict would influence their decision to go back, 18 percent ofCanadians said it very much would, compared to 24 percent of the U.S. participants. Likewise, 19
percent of Canadians versus 29 percent of U.S. participants said that their parents' or friends'concerns about security would very much influence their decision.
The greater willingness of Canadians to set aside security concerns may be reflected in the fact that,while similar proportions of Canadian and U.S. alumni encouraged other people to apply for abirthright israel trip, the Canadians were more likely to report that the people they had spoken to
actually ended up going on the program. Of those who knew what the people they encouragedeventually did, 78 percent of Canadians said that those they encouraged had gone on the trip,compared to 65 percent of U.S. participants.
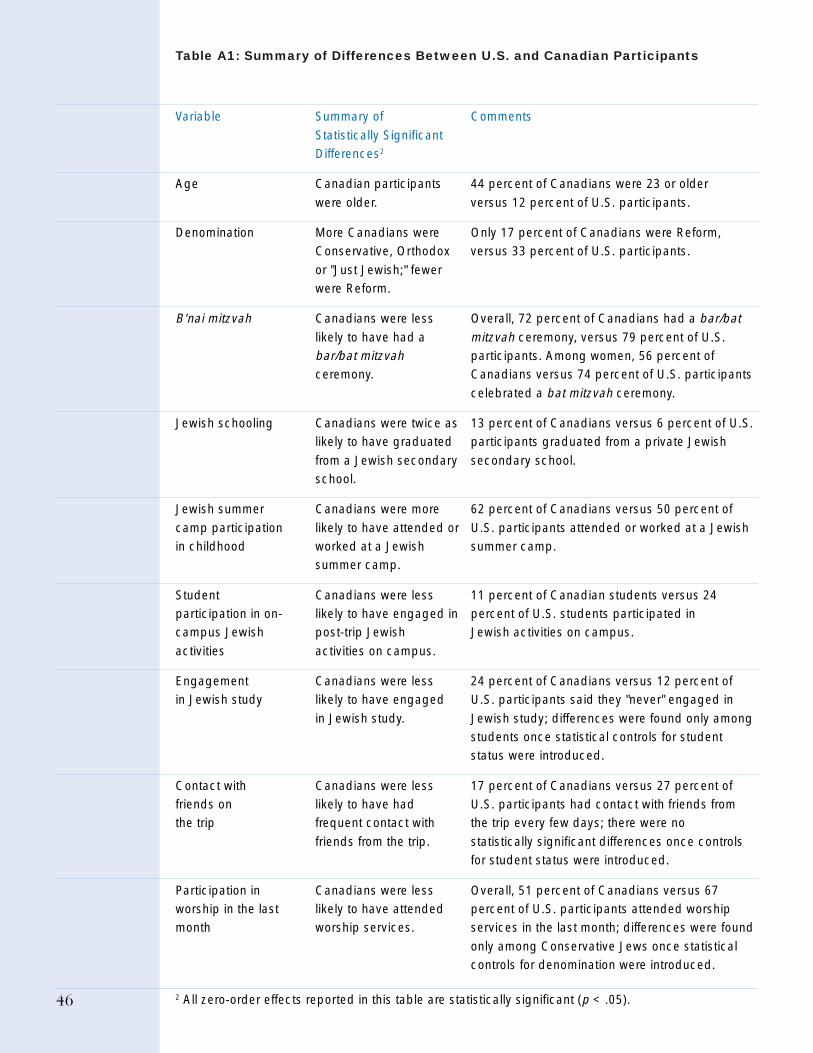
46
Table A1: Summary of Differences Between U.S. and Canadian Participants
Variable Summary of Comments
Statistically SignificantDifferences2
Age Canadian participants 44 percent of Canadians were 23 or older
were older. versus 12 percent of U.S. participants.
Denomination More Canadians were Only 17 percent of Canadians were Reform,Conservative, Orthodox versus 33 percent of U.S. participants.
or "Just Jewish;" fewerwere Reform.
B'nai mitzvah Canadians were less Overall, 72 percent of Canadians had a bar/batlikely to have had a mitzvah ceremony, versus 79 percent of U.S.bar/bat mitzvah participants. Among women, 56 percent ofceremony. Canadians versus 74 percent of U.S. participants
celebrated a bat mitzvah ceremony.
Jewish schooling Canadians were twice as 13 percent of Canadians versus 6 percent of U.S.likely to have graduated participants graduated from a private Jewish
from a Jewish secondary secondary school.school.
Jewish summer Canadians were more 62 percent of Canadians versus 50 percent of
camp participation likely to have attended or U.S. participants attended or worked at a Jewishin childhood worked at a Jewish summer camp.
summer camp.
Student Canadians were less 11 percent of Canadian students versus 24participation in on- likely to have engaged in percent of U.S. students participated incampus Jewish post-trip Jewish Jewish activities on campus.
activities activities on campus.
Engagement Canadians were less 24 percent of Canadians versus 12 percent ofin Jewish study likely to have engaged U.S. participants said they "never" engaged in
in Jewish study. Jewish study; differences were found only amongstudents once statistical controls for studentstatus were introduced.
Contact with Canadians were less 17 percent of Canadians versus 27 percent offriends on likely to have had U.S. participants had contact with friends fromthe trip frequent contact with the trip every few days; there were no
friends from the trip. statistically significant differences once controlsfor student status were introduced.
Participation in Canadians were less Overall, 51 percent of Canadians versus 67worship in the last likely to have attended percent of U.S. participants attended worshipmonth worship services. services in the last month; differences were found
only among Conservative Jews once statisticalcontrols for denomination were introduced.
2 All zero-order effects reported in this table are statistically significant (p < .05).
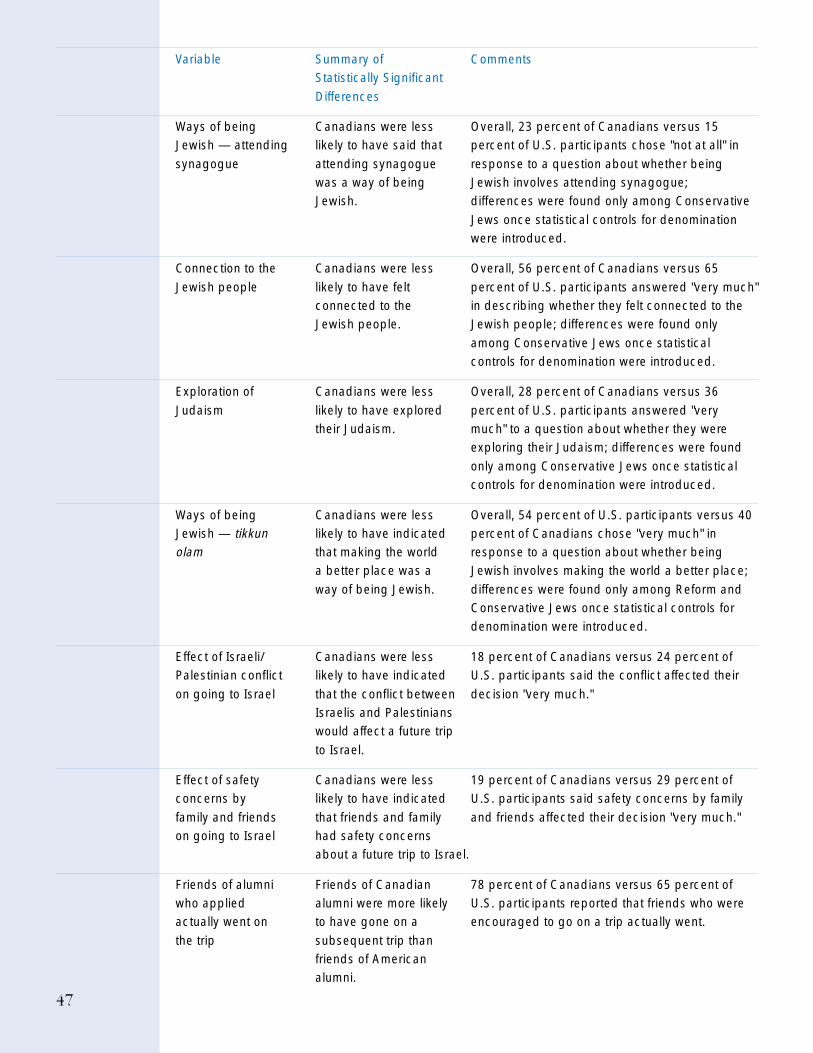
47
Variable Summary of CommentsStatistically Significant
Differences
Ways of being Canadians were less Overall, 23 percent of Canadians versus 15Jewish — attending likely to have said that percent of U.S. participants chose "not at all" in
synagogue attending synagogue response to a question about whether beingwas a way of being Jewish involves attending synagogue;Jewish. differences were found only among Conservative
Jews once statistical controls for denominationwere introduced.
Connection to the Canadians were less Overall, 56 percent of Canadians versus 65
Jewish people likely to have felt percent of U.S. participants answered "very much"connected to the in describing whether they felt connected to theJewish people. Jewish people; differences were found only
among Conservative Jews once statisticalcontrols for denomination were introduced.
Exploration of Canadians were less Overall, 28 percent of Canadians versus 36
Judaism likely to have explored percent of U.S. participants answered "verytheir Judaism. much" to a question about whether they were
exploring their Judaism; differences were found
only among Conservative Jews once statisticalcontrols for denomination were introduced.
Ways of being Canadians were less Overall, 54 percent of U.S. participants versus 40Jewish — tikkun likely to have indicated percent of Canadians chose "very much" inolam that making the world response to a question about whether being
a better place was a Jewish involves making the world a better place;
way of being Jewish. differences were found only among Reform andConservative Jews once statistical controls fordenomination were introduced.
Effect of Israeli/ Canadians were less 18 percent of Canadians versus 24 percent ofPalestinian conflict likely to have indicated U.S. participants said the conflict affected their
on going to Israel that the conflict between decision "very much."Israelis and Palestinianswould affect a future trip
to Israel.
Effect of safety Canadians were less 19 percent of Canadians versus 29 percent ofconcerns by likely to have indicated U.S. participants said safety concerns by family
family and friends that friends and family and friends affected their decision "very much."on going to Israel had safety concerns
about a future trip to Israel.
Friends of alumni Friends of Canadian 78 percent of Canadians versus 65 percent ofwho applied alumni were more likely U.S. participants reported that friends who wereactually went on to have gone on a encouraged to go on a trip actually went.
the trip subsequent trip thanfriends of Americanalumni.

48
49
Introduction
To assess the impact of birthright israel, multiple methods were employed. Participant-observers
accompanied participants on a sample of trips, researchers conducted focus groups, and surveyswere administered to program applicants and participants via the Internet. The present reportsummarizes survey data collected approximately 15 months after the first birthright israel trips. Below,
details of the sample frame, weighting, and analysis plan are described. Although the design isstraightforward, involving a comparison of participants and non-participants, constructing samplesthat were representative of the applicants and participants was not trivial. The challenges arose
primarily from the nature of the initial birthright israel launch, an unprecedented large-scale socialexperiment that was continually evolving. Despite the challenges posed by this research setting, weare confident that the resulting data are representative, and that every possible step was undertaken
to ensure the quality of the data.
Database
Contact information was obtained for participants and non-participants from the database thatbirthright israel created in the fall of 1999 when applicants first registered for the program over theInternet. This database posed a significant challenge to conducting the research. Some applicants
had entered data incorrectly or did not provide all the information requested, and the database wasnot updated after participants returned from their trips in January and February of 2000. The lattersituation was especially problematic since college-age individuals are a highly mobile population and
considerable change in addresses, phone numbers and e-mail addresses are to be expected withinthis group. Consequently, many telephone numbers, e-mail and mail addresses were invalid. Inaddition, approximately 5 percent of the entries in the database were duplicates.
These database difficulties led us to employ a variety of strategies to ensure that we obtained arepresentative sample and that we understood the reasons for non-response. One significant
consequence of these database difficulties was that we could not be confident, a priori, that non-response represented an unwillingness to respond. It may have instead reflected our inability tolocate an individual, or it may have been the case that the same person was represented in the
database more than once, and our second contact message was simply ignored. Although everyattempt was made to eliminate duplicates, it was impossible to ascertain whether the duplicate entrycontaining the correct address and telephone number was the one that was retained. As described
below, in our attempts to follow-up with non-respondents, approximately 30 percent of those we triedto reach did not have valid contact information.
Appendix B:Methodology
50
Survey Procedures
Initial contact was made with all participants and applicants (non-participants) by sending a
personalized e-mail to their last known valid e-mail address. The e-mail contained an invitation torespond to a follow-up survey on birthright israel and included a URL link that when clicked took themdirectly to an online survey. The text of the e-mail is presented below. As an incentive to participate,
respondents were notified that they would be placed in a lottery for $100 worth of books from Barnes& Noble.
Shalom (Respondent’s Name)!
A year ago you registered to participate in the birthright israel gift trip. Some of you were
fortunate enough to go, others were not. Now, your help is urgently needed. We don’t wantyour money. We want your honest ideas and opinions about the current situation in Israel andyour own involvement in the Jewish community. For those who participated in trips, we want to
learn about your experience. Your answers will be extremely helpful to those who plan andsupport Jewish education and trips to Israel.
To express our thanks for your input, your name will be entered into a lottery offering a giftcertificate you can spend on books or records at www.barnesandnoble.com. Your answers aretotally confidential and will be seen only by researchers at Brandeis University. They will ONLY
be part of a statistical report. The survey begins below - to continue, click or hit enter on the“continue” icon at the bottom of the page. If you have any questions about the survey ortechnical problems in responding, please respond to this e-mail at
[email protected] or call our toll free number 1-888-659-8711. To insurethat our survey is representative, it is very important that you respond. We — and the sponsorsof birthright israel — are very appreciative.
Thank you,
Charles Kadushin and Len Saxe,Co-Principal Investigators
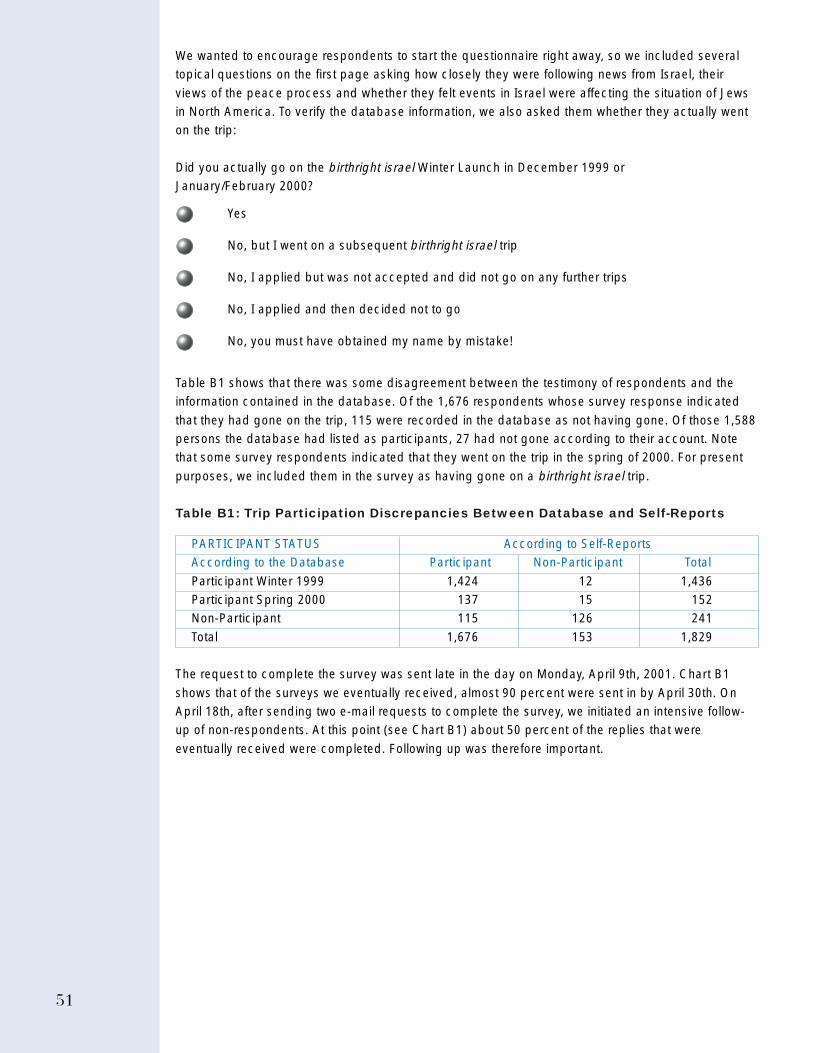
51
We wanted to encourage respondents to start the questionnaire right away, so we included severaltopical questions on the first page asking how closely they were following news from Israel, their
views of the peace process and whether they felt events in Israel were affecting the situation of Jewsin North America. To verify the database information, we also asked them whether they actually wenton the trip:
Did you actually go on the birthright israel Winter Launch in December 1999 orJanuary/February 2000?
Yes
No, but I went on a subsequent birthright israel trip
No, I applied but was not accepted and did not go on any further trips
No, I applied and then decided not to go
No, you must have obtained my name by mistake!
Table B1 shows that there was some disagreement between the testimony of respondents and theinformation contained in the database. Of the 1,676 respondents whose survey response indicated
that they had gone on the trip, 115 were recorded in the database as not having gone. Of those 1,588persons the database had listed as participants, 27 had not gone according to their account. Notethat some survey respondents indicated that they went on the trip in the spring of 2000. For present
purposes, we included them in the survey as having gone on a birthright israel trip.
Table B1: Trip Participation Discrepancies Between Database and Self-Reports
PARTICIPANT STATUS According to Self-ReportsAccording to the Database Participant Non-Participant Total
Participant Winter 1999 1,424 12 1,436Participant Spring 2000 137 15 152Non-Participant 115 126 241
Total 1,676 153 1,829
The request to complete the survey was sent late in the day on Monday, April 9th, 2001. Chart B1
shows that of the surveys we eventually received, almost 90 percent were sent in by April 30th. OnApril 18th, after sending two e-mail requests to complete the survey, we initiated an intensive follow-up of non-respondents. At this point (see Chart B1) about 50 percent of the replies that were
eventually received were completed. Following up was therefore important.

52
25%
0%
20%
40%
60%
80%
100%
APRIL 12
APRIL 13
APRIL 14
APRIL 15
APRIL 16
APRIL 17
APRIL 18
APRIL 19
APRIL 20
APRIL 21
APRIL 22
APRIL 23
APRIL 24
APRIL 25
APRIL 26
APRIL 27
APRIL 28
APRIL 29
APRIL 30
MAY 1
MAY 2
MAY 3
MAY 4
MAY 5
MAY 6
MAY 7
MAY 8
MAY 9
MAY 11
MAY 13
MAY 14
MAY 18
MAY 22
MAY 26
MAY 28
Date Returned
Cum
ula
tive P
erc
enta
ge
Retu
rned
Chart B1: Survey Responses Over Time
From the 6,489 entries in the database, a total of 3,172 non-respondents (See Table B2) who hadbeen listed by birthright israel as having participated in the initial 1999-2000 launch were chosen atrandom. SRBI, a respected polling organization with whom we had successfully worked in the past,
then attempted to reach them by telephone. One year earlier, SRBI had been responsible fortelephone interviews with non-respondents in the original launch program data collection efforts. Thistime, however, as a result of methodological experimentation, it was determined that responses could
be effectively generated, at least from participants, merely by calling non-respondents’ attention tothe survey and asking them to complete it online. Interviewers at SRBI found that many non-respondents had treated the e-mails asking for their response to the survey as “junk” e-mails and had
not even bothered to open them. Encouraging respondents to fill in the survey themselves rather thaninterviewing them proved more cost-effective.
Table B2: Number of Non-Responding Participants Receiving Intensive Follow-UpCategorized by Validity of Database Contact Information
Valid Database Contact Number of Participants Who Percentage Who ReceivedInformation Available? Received Intense Follow-Up Intense Follow-UpNo 885 27.9%
Yes 1,827 57.6%Not Certain 460 14.5%Total 3,172 100.0%
To encourage responses, SRBI interviewers used a standardized protocol.1 This procedure resulted in
a total of 637 respondents who would not have otherwise completed their surveys, representing over40 percent of the eventual respondents. Recall that the yield was limited by the fact that the listsbeing used were inaccurate, since at least 30 percent of the numbers reached were verifiably not
correct. Table B3 shows that from the halfway point of the data collection process through the end,over 80 percent of the returns resulted from these telephone calls.
1 Available from the authors of this report.
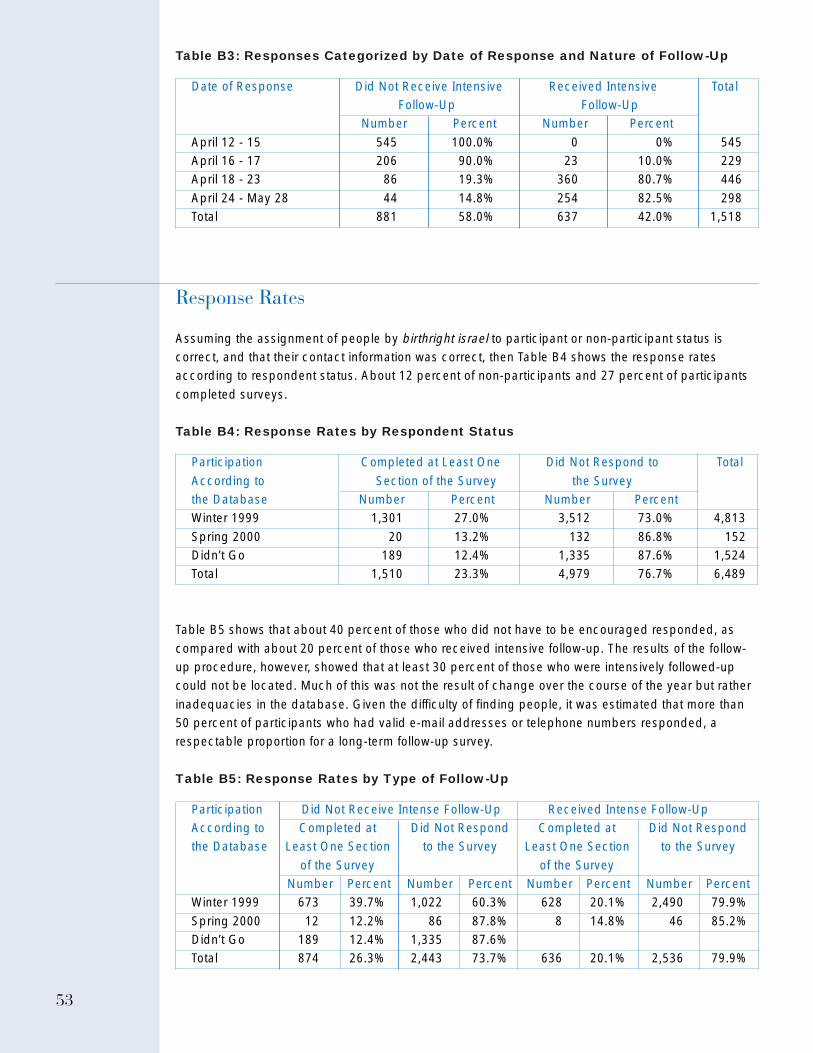
53
Table B3: Responses Categorized by Date of Response and Nature of Follow-Up
Date of Response Did Not Receive Intensive Received Intensive Total Follow-Up Follow-UpNumber Percent Number Percent
April 12 - 15 545 100.0% 0 0% 545April 16 - 17 206 90.0% 23 10.0% 229April 18 - 23 86 19.3% 360 80.7% 446
April 24 - May 28 44 14.8% 254 82.5% 298Total 881 58.0% 637 42.0% 1,518
Response Rates
Assuming the assignment of people by birthright israel to participant or non-participant status iscorrect, and that their contact information was correct, then Table B4 shows the response ratesaccording to respondent status. About 12 percent of non-participants and 27 percent of participants
completed surveys.
Table B4: Response Rates by Respondent Status
Participation Completed at Least One Did Not Respond to Total
According to Section of the Survey the Surveythe Database Number Percent Number PercentWinter 1999 1,301 27.0% 3,512 73.0% 4,813
Spring 2000 20 13.2% 132 86.8% 152Didn’t Go 189 12.4% 1,335 87.6% 1,524Total 1,510 23.3% 4,979 76.7% 6,489
Table B5 shows that about 40 percent of those who did not have to be encouraged responded, as
compared with about 20 percent of those who received intensive follow-up. The results of the follow-up procedure, however, showed that at least 30 percent of those who were intensively followed-upcould not be located. Much of this was not the result of change over the course of the year but rather
inadequacies in the database. Given the difficulty of finding people, it was estimated that more than50 percent of participants who had valid e-mail addresses or telephone numbers responded, arespectable proportion for a long-term follow-up survey.
Table B5: Response Rates by Type of Follow-Up
Participation Did Not Receive Intense Follow-Up Received Intense Follow-UpAccording to Completed at Did Not Respond Completed at Did Not Respondthe Database Least One Section to the Survey Least One Section to the Survey
of the Survey of the SurveyNumber Percent Number Percent Number Percent Number Percent
Winter 1999 673 39.7% 1,022 60.3% 628 20.1% 2,490 79.9%
Spring 2000 12 12.2% 86 87.8% 8 14.8% 46 85.2%Didn’t Go 189 12.4% 1,335 87.6%Total 874 26.3% 2,443 73.7% 636 20.1% 2,536 79.9%
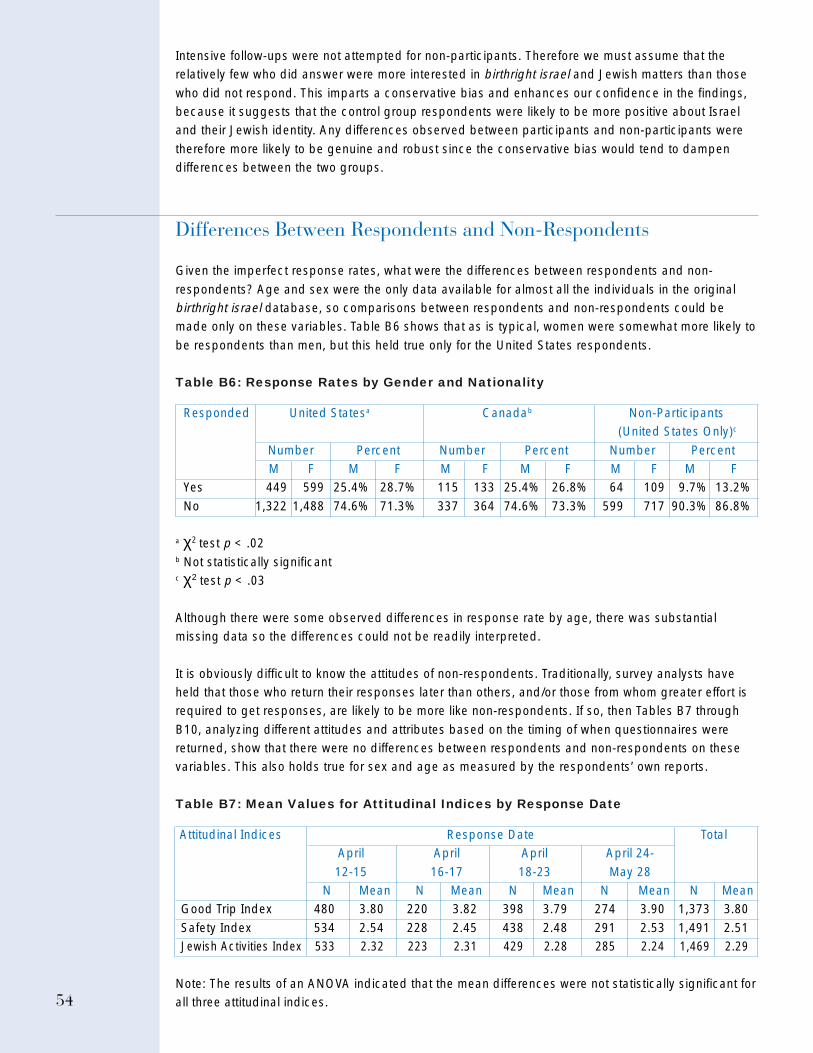
54
Intensive follow-ups were not attempted for non-participants. Therefore we must assume that therelatively few who did answer were more interested in birthright israel and Jewish matters than those
who did not respond. This imparts a conservative bias and enhances our confidence in the findings,because it suggests that the control group respondents were likely to be more positive about Israeland their Jewish identity. Any differences observed between participants and non-participants were
therefore more likely to be genuine and robust since the conservative bias would tend to dampendifferences between the two groups.
Differences Between Respondents and Non-Respondents
Given the imperfect response rates, what were the differences between respondents and non-
respondents? Age and sex were the only data available for almost all the individuals in the originalbirthright israel database, so comparisons between respondents and non-respondents could bemade only on these variables. Table B6 shows that as is typical, women were somewhat more likely to
be respondents than men, but this held true only for the United States respondents.
Table B6: Response Rates by Gender and Nationality
Responded United Statesa Canadab Non-Participants (United States Only)c
Number Percent Number Percent Number PercentM F M F M F M F M F M F
Yes 449 599 25.4% 28.7% 115 133 25.4% 26.8% 64 109 9.7% 13.2%
No 1,322 1,488 74.6% 71.3% 337 364 74.6% 73.3% 599 717 90.3% 86.8%
a χ2 test p < .02b Not statistically significantc χ2 test p < .03
Although there were some observed differences in response rate by age, there was substantialmissing data so the differences could not be readily interpreted.
It is obviously difficult to know the attitudes of non-respondents. Traditionally, survey analysts haveheld that those who return their responses later than others, and/or those from whom greater effort isrequired to get responses, are likely to be more like non-respondents. If so, then Tables B7 through
B10, analyzing different attitudes and attributes based on the timing of when questionnaires werereturned, show that there were no differences between respondents and non-respondents on thesevariables. This also holds true for sex and age as measured by the respondents’ own reports.
Table B7: Mean Values for Attitudinal Indices by Response Date
Attitudinal Indices Response Date TotalApril April April April 24-
12-15 16-17 18-23 May 28N Mean N Mean N Mean N Mean N Mean
Good Trip Index 480 3.80 220 3.82 398 3.79 274 3.90 1,373 3.80
Safety Index 534 2.54 228 2.45 438 2.48 291 2.53 1,491 2.51Jewish Activities Index 533 2.32 223 2.31 429 2.28 285 2.24 1,469 2.29
Note: The results of an ANOVA indicated that the mean differences were not statistically significant forall three attitudinal indices.
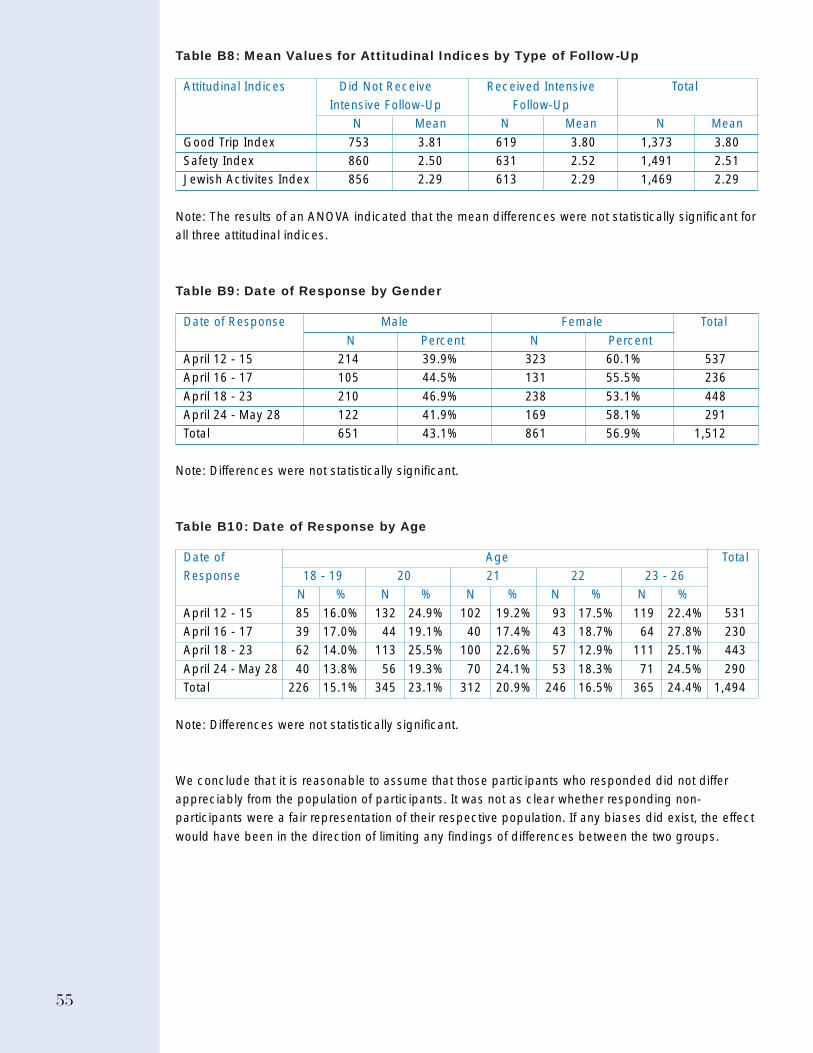
55
Table B8: Mean Values for Attitudinal Indices by Type of Follow-Up
Attitudinal Indices Did Not Receive Received Intensive TotalIntensive Follow-Up Follow-Up
N Mean N Mean N Mean
Good Trip Index 753 3.81 619 3.80 1,373 3.80Safety Index 860 2.50 631 2.52 1,491 2.51Jewish Activites Index 856 2.29 613 2.29 1,469 2.29
Note: The results of an ANOVA indicated that the mean differences were not statistically significant forall three attitudinal indices.
Table B9: Date of Response by Gender
Date of Response Male Female Total
N Percent N PercentApril 12 - 15 214 39.9% 323 60.1% 537April 16 - 17 105 44.5% 131 55.5% 236
April 18 - 23 210 46.9% 238 53.1% 448April 24 - May 28 122 41.9% 169 58.1% 291Total 651 43.1% 861 56.9% 1,512
Note: Differences were not statistically significant.
Table B10: Date of Response by Age
Date of Age TotalResponse 18 - 19 20 21 22 23 - 26
N % N % N % N % N %
April 12 - 15 85 16.0% 132 24.9% 102 19.2% 93 17.5% 119 22.4% 531April 16 - 17 39 17.0% 44 19.1% 40 17.4% 43 18.7% 64 27.8% 230April 18 - 23 62 14.0% 113 25.5% 100 22.6% 57 12.9% 111 25.1% 443
April 24 - May 28 40 13.8% 56 19.3% 70 24.1% 53 18.3% 71 24.5% 290Total 226 15.1% 345 23.1% 312 20.9% 246 16.5% 365 24.4% 1,494
Note: Differences were not statistically significant.
We conclude that it is reasonable to assume that those participants who responded did not differappreciably from the population of participants. It was not as clear whether responding non-participants were a fair representation of their respective population. If any biases did exist, the effect
would have been in the direction of limiting any findings of differences between the two groups.
56
Weighting
Given endemic vagaries in survey responses, almost all national surveys weight respondent data so
that it matches the national census proportion on basic demographics such as age, sex, race, andeducation (Massey & Botman, 1988). In the present case, it is hard to know what variables would bebest to use for weights, and what should be the “gold standard.” Given some possible remaining
uncertainties about the representativeness of the sample as obtained, the decision was made to try tomake the follow-up look as much as possible like the sample from the previous year, so that changescould be reasonably assessed. Obviously, only variables that could not possibly change over the year
could be used, and further, these variables had to be related to key outcomes.
Analysis suggested four variables: gender (women are generally more favorable to Jewish matters,
more likely to participate in birthright israel, and more likely to respond); whether or not therespondent had a bar/bat mitzvah ceremony; whether or not the respondents’ families when they weregrowing up lit Sabbath candles; and finally, whether their families at that time kept kosher. For the U.S.
participants, 59 percent of the respondents to the first year’s survey were women, 78 percent had abar/bat mitzvah ceremony, 33 percent of their families lit Sabbath candles, and 33 percent of thefamilies kept kosher. For the United States, both participants and non-participants in the follow-up
survey were weighted to match these figures. The weighting is done by means of “iterativeproportional fitting,” (Deming, 1943) which means that in effect all the weights are appliedsimultaneously.
Assessment of Change
Although the assessment of change in evaluation studies has undergone major methodologicalinnovation in the past ten years (Winship & Morgan, 1999), the design of the present study makessome of the vexing issues of change assessment somewhat moot. In the launch year, considerably
more people applied for the gift of a free trip to Israel than could eventually be accommodated. In thefollowing year, just about everyone who was selected to go did go. If a considerable proportion ofthose who were offered the trip had eventually decided not to go, then the statistical design of the
evaluation would have be affected (see Winship & Morgan, 1999, pp. 680-685). As will be seen, thiswas not the case for the launch trip.
Choices as to who would go in the first or launch year were made in essentially two ways — by lottery,or by selecting persons less likely to be highly involved in Jewish activities. In some rare cases,leaders were chosen, but where there was a selection made on other than a random basis, the
preponderant philosophy was to pick those who were less Jewishly involved in keeping with thedesire of the funders to affect people who might not otherwise be interested in Israel. The results ofthe use of randomization and bias in selection were that the non-participants were either similar in
their Jewish involvement to participants, or were slightly more interested. By weighting non-participants so that they had the same Jewish background factors as the participants, the non-participant tilt towards being more Jewish was controlled. In addition, the response rate virtually
guaranteed that non-participants who responded would be more Jewishly involved than non-participants who didn’t respond.
57
Overall, non-participants were either similar to participants or somewhat more Jewishly engaged. Theevaluation design focused on assessing the impact of the program on those Jews between the ages
of 18 to 26 who were interested in the program in the first place. Although this group appeared to besimilar to the overall population, it is difficult to tell how representative it was. In contrastingparticipants with those who had applied to the program but did not go, the most conservative
possible comparisons were made. Weighting made respondents from the first wave of data and thesecond wave of data as comparable as possible.
Explanatory Note
Assessment Of Outcome Variation
The variance components analysis (VCA) function in the SPSS 10 statistical software package (1999)was used to assess how much of the variance in post-trip outcomes was attributable to the college
settings to which student alumni returned. The college attended constituted the random effect in theVCA model, and was based on verbatim responses recoded for analysis. Recoding ensured thatvarious spellings of schools (e.g. New York University, NYU, N.Y.U., NY University, etc.) would not be
counted as separate entities. A minimum norm quadratic unbiased estimator (MINQUE) was used toestimate the contribution of each random effect to the variance of the dependent variable.

58

59
References

60
61
Beilin, Y. (2000). His brother’s keeper: Israel and diaspora Jewry in the twenty-first century. New York:Schocken Books.
Chazan, B. (1997). Does the teen Israel experience make a difference? New York: Israel ExperienceInc.
Chazan, B. & Cohen, S. M. (2000). What we know about American Jewish youth: Some implicationsfor birthright israel. Journal of Jewish Communal Service, 77, 76-82.
Cohen, E. (1994). Toward a strategy of excellence: A structural analysis. (The Israel experienceongoing survey and evaluation 2). Jerusalem, Israel: Youth and Hechalutz Department, the Joint
Authority for Jewish Zionist Education.
Cohen, S. M. (1995). The impact of varieties of Jewish education upon Jewish identity: An inter-
generational perspective. Contemporary Jewry, 16, 68-96.
Cohen, S. M., & Davidson, A. (2001). Adult Jewish learning in America: Current patterns andprospects for growth. New York: The Florence G. Heller/JCC Association Research Center and TheJewish Theological Seminary of America.
Cohen, S. M. & Eisen, A. M. (1998). The Jew within: Self, community, and commitment among thevariety of moderately affiliated. Brookline, MA: Wilstein Institute.
Cohen, S. M. & Eisen, A. M. (2000). The Jew within: Self, family and community in America.Bloomington, IN: University of Indiana Press.
Deming, W. E. (1943). Statistical adjustment of data. London: J. Wiley & Sons [Reprinted by DoverPublications, 1984].
Fishman, S. (2001). Jewish and something else: A study of mixed-married families. New York:American Jewish Committee.
Goldstein, S. & Goldstein, A. (1996). Jews on the move: Implications for Jewish identity. Albany, NY:State University of New York Press.
Horowitz, B. (1993). The 1991 New York Jewish population study. New York: UJA-Federation of JewishPhilanthropies of New York.
Horowitz, B. (2000). Connections and journeys. New York: UJA-Federation of Jewish Philanthropies ofNew York.
Isaacs, L.W. & Schwartz, J. (1997). The Alexander Muss High School in Israel impact evaluation. NewYork: Jewish Education Service of North America, Inc.
Israel, S. & Mittelberg, D. (1998). The Israel visit—not just for teens: The characteristics and impact ofcollege-age travel to Israel. Waltham, MA: Brandeis University, Cohen Center for Modern JewishStudies.
Kafka, R., London, P., & Frank, N. L. (1990). The impact of ‘summer in Israel’ experiences on NorthAmerican Jewish teenagers. Jerusalem, Israel: CRB Foundation.
References

62
Kelner, S., Saxe, L., Kadushin, C., Canar, R., Lindholm, M., Ossman, H., Perloff, J., Phillips, B., Teres,R., Wolf, M., & Woocher, M. (2000). Making meaning: Participants’ experience of birthright israel.Waltham, MA: Brandeis University, Cohen Center for Modern Jewish Studies.
Kosmin, B. A., Goldstein, S., Waksberg, J., Lerer, N., Keysar, A., & Scheckner, J. (1991). Highlights ofthe CJP 1990 National Jewish Population Survey. New York: Council of Jewish Federations.
Liebler, I. (1999, November 19). Birthright israel: Too quick and superficial. The Jewish Week.
Liebler, I. (2000, January 19). Birthright israel — the quick fix: Don’t believe the hype. World JewishReview.
Massey, J. T. & Botman, S. L. (1988). Weighting adjustments for random digit dialed surveys. In R. M.Groves, P. P. Biemer, L. L. Lyberg, J. T. Massey, W. L. Nicholls, & J. Waksberg (Eds.), Telephonesurvey methodology. (pp. 143-160). New York: Wiley.
Mittelberg, D. (1999). The Israel connection and American Jews. Westport, CT: Praeger.
Post, M. E. (1999, December 20). Don’t bash birthright. Jerusalem Report, p. 54.
Sales, A. (1998). Israel experience: Is length of time a critical factor? Waltham, MA: BrandeisUniversity, Cohen Center for Modern Jewish Studies.
Sales, A. (1999). Israel experience ’98: Testing the four-week option (preliminary findings). Waltham,MA: Brandeis University, Cohen Center for Modern Jewish Studies
Saxe, L., Kelner, S., Kadushin, C. L., & Brodsky, A. (2000a). Jewish adolescents: American teenagerstrying to ‘make it.’ Agenda: Jewish Education, 13, 3-7.
Saxe, L., Kadushin, C., Pakes, J., Kelner, S., Sternberg, L., Horowitz, B., Sales, A., & Brodsky, A.(2000b). Birthright israel launch evaluation: Preliminary findings. Waltham, MA: Brandeis University,Cohen Center for Modern Jewish Studies.
SPSS® For Windows®, [Computer Program]. (1999, November 27). Chicago, IL: SPSS, Inc.
Ukeles, J. (1994). Campus and community: Strengthening the identity of Jewish college students.New York: American Jewish Committee.
Wertheimer, J. (1993). A people divided: Judaism in contemporary America. Hanover, NH: BrandeisUniversity Press/University Press of New England.
Winship, C. & Morgan, S. L. (1999). The estimation of causal effects from observational data. AnnualReview of Sociology, 25, 659-707.