Embed Size (px)
DESCRIPTION
A
Citation preview
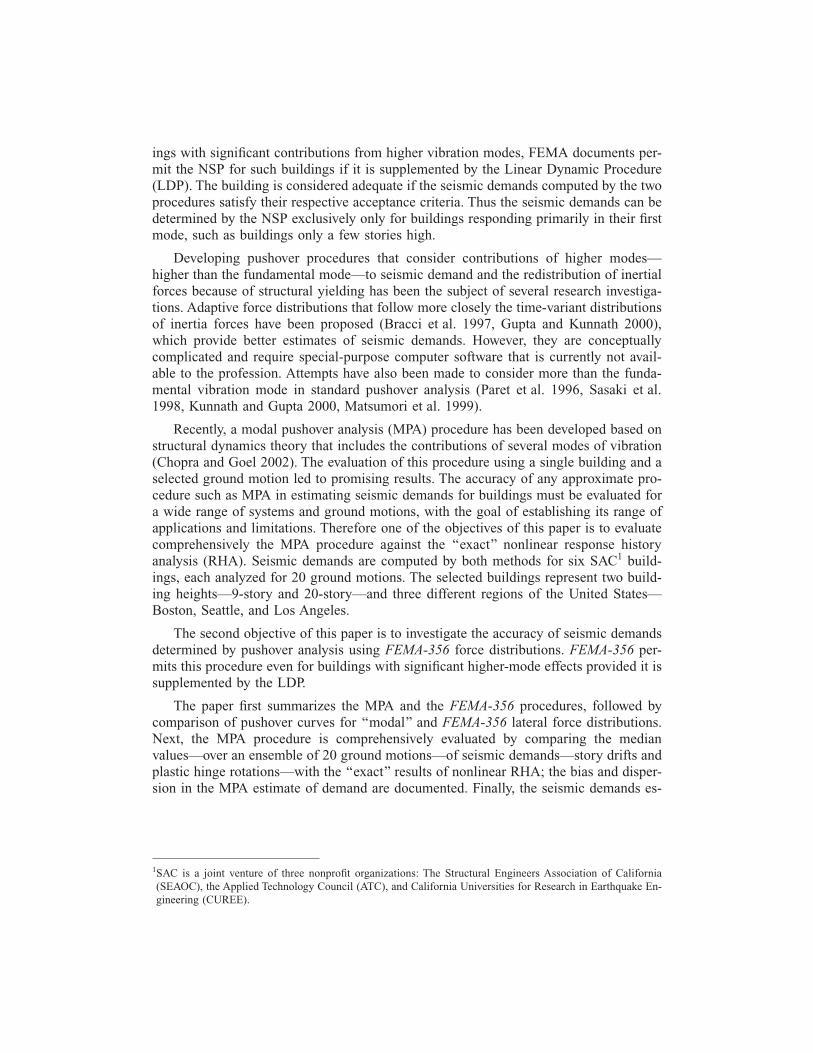
Evaluation of Modal and FEMA Pushover Analyses: SAC Buildings
Rakesh K. Goel, California Polytechnic State University, San Luis Obispoand Anil K. Chopra, University of California, Berkeley
This paper comprehensively evaluates the Modal Pushover Analysis (MPA) procedure against the ‘‘exact’’ nonlinear response history analysis (RHA) and investigates the accuracy of seismic demands determined by pushover analysis using FEMA-356 force distributions; the MPA procedure in this paper contains several improvements over the original version presented in Chopra and Goel (2002). Seismic demands are computed for six buildings, each analyzed for 20 ground motions. It is demonstrated that with increasing number of ‘‘modes’’ included, the height-wise distribution of story drifts and plastic rotations estimated by MPA becomes generally similar to trends noted from nonlinear RHA. The additional bias and dispersion introduced by neglecting ‘‘modal’’ coupling and P-� effects due to gravity loads in MPA procedure is small unless the building is deformed far into the inelastic range with significant degradation in lateral capacity. A comparison of the seismic demands computed by FEMA-356 NSP and nonlinear RHA showed that FEMA-356 lateral force distributions lead to gross underestimation of story drifts and completely fail to identify plastic rotations in upper stories compared to the values from the nonlinear RHA. The ‘‘Uniform’’ force distribution in FEMA-356 NSP seems unnecessary because it grossly overestimates drifts and plastic rotations in lower stories and grossly underestimates them in upper stories. The MPA procedure resulted in estimates of demand that were much better than from FEMA force distributions over a wide range of responses—from essentially elastic response of Boston buildings to strongly inelastic response of Los Angeles buildings. However, pushover analysis procedures cannot be expected to provide satisfactory estimates of seismic demands for buildings deforming far into the inelastic range with significant degradation of the lateral capacity; for such cases, nonlinear RHA becomes necessary.
INTRODUCTION
According to the FEMA-273 and FEMA-356 (BSSC 1997, 2000) documents, seismic demands are computed by the nonlinear static procedure (NSP) or pushover analysis, wherein the structure is subjected to monotonically increasing lateral forces with an invariant height-wise distribution until a target displacement is reached. Recognizing the limitations of these force distributions in approximating the seismic demands for build-
ings with significant contributions from higher vibration modes, FEMA documents permit the NSP for such buildings if it is supplemented by the Linear Dynamic Procedure (LDP). The building is considered adequate if the seismic demands computed by the two procedures satisfy their respective acceptance criteria. Thus the seismic demands can be determined by the NSP exclusively only for buildings responding primarily in their first mode, such as buildings only a few stories high.
Developing pushover procedures that consider contributions of higher modes— higher than the fundamental mode—to seismic demand and the redistribution of inertial forces because of structural yielding has been the subject of several research investigations. Adaptive force distributions that follow more closely the time-variant distributions of inertia forces have been proposed (Bracci et al. 1997, Gupta and Kunnath 2000), which provide better estimates of seismic demands. However, they are conceptually complicated and require special-purpose computer software that is currently not available to the profession. Attempts have also been made to consider more than the fundamental vibration mode in standard pushover analysis (Paret et al. 1996, Sasaki et al. 1998, Kunnath and Gupta 2000, Matsumori et al. 1999).
Recently, a modal pushover analysis (MPA) procedure has been developed based on structural dynamics theory that includes the contributions of several modes of vibration (Chopra and Goel 2002). The evaluation of this procedure using a single building and a selected ground motion led to promising results. The accuracy of any approximate procedure such as MPA in estimating seismic demands for buildings must be evaluated for a wide range of systems and ground motions, with the goal of establishing its range of applications and limitations. Therefore one of the objectives of this paper is to evaluate comprehensively the MPA procedure against the ‘‘exact’’ nonlinear response history analysis (RHA). Seismic demands are computed by both methods for six SAC1 buildings, each analyzed for 20 ground motions. The selected buildings represent two building heights—9-story and 20-story—and three different regions of the United States— Boston, Seattle, and Los Angeles.
The second objective of this paper is to investigate the accuracy of seismic demands determined by pushover analysis using FEMA-356 force distributions. FEMA-356 permits this procedure even for buildings with significant higher-mode effects provided it is supplemented by the LDP.
The paper first summarizes the MPA and the FEMA-356 procedures, followed by comparison of pushover curves for ‘‘modal’’ and FEMA-356 lateral force distributions. Next, the MPA procedure is comprehensively evaluated by comparing the median values—over an ensemble of 20 ground motions—of seismic demands—story drifts and plastic hinge rotations—with the ‘‘exact’’ results of nonlinear RHA; the bias and dispersion in the MPA estimate of demand are documented. Finally, the seismic demands es
1SAC is a joint venture of three nonprofit organizations: The Structural Engineers Association of California (SEAOC), the Applied Technology Council (ATC), and California Universities for Research in Earthquake Engineering (CUREE).
� � � �
timated by the NSP using FEMA-356 lateral force distributions are presented and compared with the MPA estimate and exact results from nonlinear RHA. The limitations of both approximate procedures are identified and documented.
SAC BUILDINGS, GROUND MOTIONS, AND RESPONSE STATISTICS
SAC BUILDINGS
SAC commissioned three consulting firms to design 3-, 9-, and 20-story model buildings with symmetric plan according to the local code requirements of three cities: Los Angeles (ICBO 1994), Seattle (ICBO 1994), and Boston (BOCA 1993). This study analyzed 9- and 20-story buildings—referred to as SAC buildings in this paper— buildings where higher-mode effects are likely to be important; details of these buildings are available in Gupta and Krawinkler (1999).
SAC GROUND MOTIONS
For all three locations, sets of 20 ground motion records were assembled representing probabilities of exceedance of 2% and 10% in 50 years (return periods of 2475 and 475 years, respectively) (Somerville et al. 1997). The 2/50 set of records are used in the subsequent analysis. This set of ground motions enables testing of the MPA procedure—an approximate method—under the most severe conditions; as shown later in this paper, many ground motions drive the selected buildings far into the region of significant deterioration in stiffness and lateral load-carrying capacity, a condition under which the discrepancy between the results from the approximate and exact procedures may be expected to be large.
RESPONSE STATISTICS
The dynamic response of each building to each of 20 ground motions is determined by nonlinear RHA (Chopra 2001: Sec 15.3), MPA, and NSP using force distributions specified in FEMA-356 (described below). The ‘‘exact’’ peak value of structural response or demand, r, determined by nonlinear RHA is denoted by rNL-RHA , and the approximate value from MPA by rMPA and from FEMA-356 analyses by rFEMA ; the same notation rFEMA is used for all FEMA-356 force distributions. The response of each building was also computed assuming elastic behavior. For elastic systems, the nonlinear RHA procedure specializes to linear RHA and the MPA procedure to standard response spectrum analysis (RSA); thus the responses are denoted as rRHA and rRSA .
Presented in this paper are median values x̂, defined as the geometric mean, and the dispersion measure, �, of n(�20) observed values of xi of the response: rMPA , rRSA , rFEMA , rRHA , or rNL-RHA (Benjamin and Cornell 1970):
n n 1/2
� ln xi � �ln xi�ln x̂�2
i�1 i�1 x̂�exp ; �� (1)
n n�1
In the case where one or more excitations caused collapse of the building or its first‘‘mode’’ SDF system (which will be defined later), the median and dispersion were es
timated by a counting method. The 20 data values were sorted in ascending order, the median was estimated as the average of the 10th and 11th values starting from the lowest value; the 84th-percentile value as the 17th value; and the dispersion�ln (84th percentile value)—ln (median value). Note that if more than three excitations caused collapse of the building or its first-‘‘mode’’ system, the 84th-percentile value was unavailable, and hence the dispersion was not calculated.
The bias in an approximate procedure is quantified by the median of the ratio of structural response values determined by an approximate and the ‘‘exact’’ procedures:
�rRSA /rRHA for the RSA procedure, rMPA rRSA ** �rMPA /rNL-RHA for the MPA procedure and rFEMA toward underestimating the response if the ratio is less than one and overestimating the response if the ratio exceeds one.
MODAL PUSHOVER ANALYSIS
SUMMARY
Summarized below are a series of steps in the MPA procedure to estimate the peak inelastic response of a multistory building with its plan symmetric about two orthogonal axes to earthquake ground motion along an axis of symmetry (Chopra and Goel 2002):
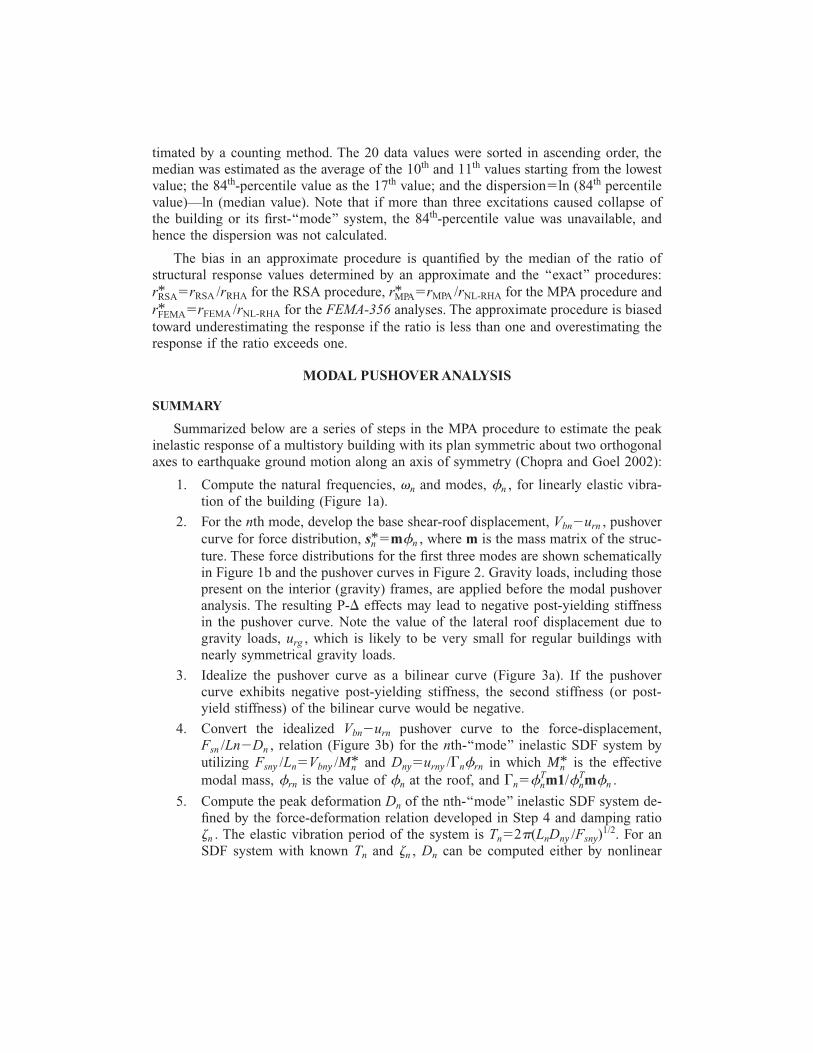
1. Compute the natural frequencies, �n and modes, �n , for linearly elastic vibration of the building (Figure 1a).
2. For the nth mode, develop the base shear-roof displacement, Vbn�urn , pushover
* �rFEMA /rNL-RHA for the FEMA-356 analyses. The approximate procedure is biased
curve for force distribution, s*n �m�n , where m is the mass matrix of the structure. These force distributions for the first three modes are shown schematically in Figure 1b and the pushover curves in Figure 2. Gravity loads, including those present on the interior (gravity) frames, are applied before the modal pushover analysis. The resulting P-� effects may lead to negative post-yielding stiffness in the pushover curve. Note the value of the lateral roof displacement due to gravity loads, urg , which is likely to be very small for regular buildings with nearly symmetrical gravity loads.
3. Idealize the pushover curve as a bilinear curve (Figure 3a). If the pushover curve exhibits negative post-yielding stiffness, the second stiffness (or post-yield stiffness) of the bilinear curve would be negative.
4. Convert the idealized Vbn�urn pushover curve to the force-displacement, Fsn /Ln�Dn , relation (Figure 3b) for the nth-‘‘mode’’ inelastic SDF system by utilizing Fsny /Ln�Vbny /M*n and Dny�urny /�n�rn in which M* is the effective n
TTm1/�n nmodal mass, �rn is the value of �n at the roof, and �n�� m�n .
5. Compute the peak deformation Dn of the nth-‘‘mode’’ inelastic SDF system defined by the force-deformation relation developed in Step 4 and damping ratio
)1/2�n . The elastic vibration period of the system is Tn�2�(LnDny /Fsny . For an SDF system with known Tn and �n , Dn can be computed either by nonlinear
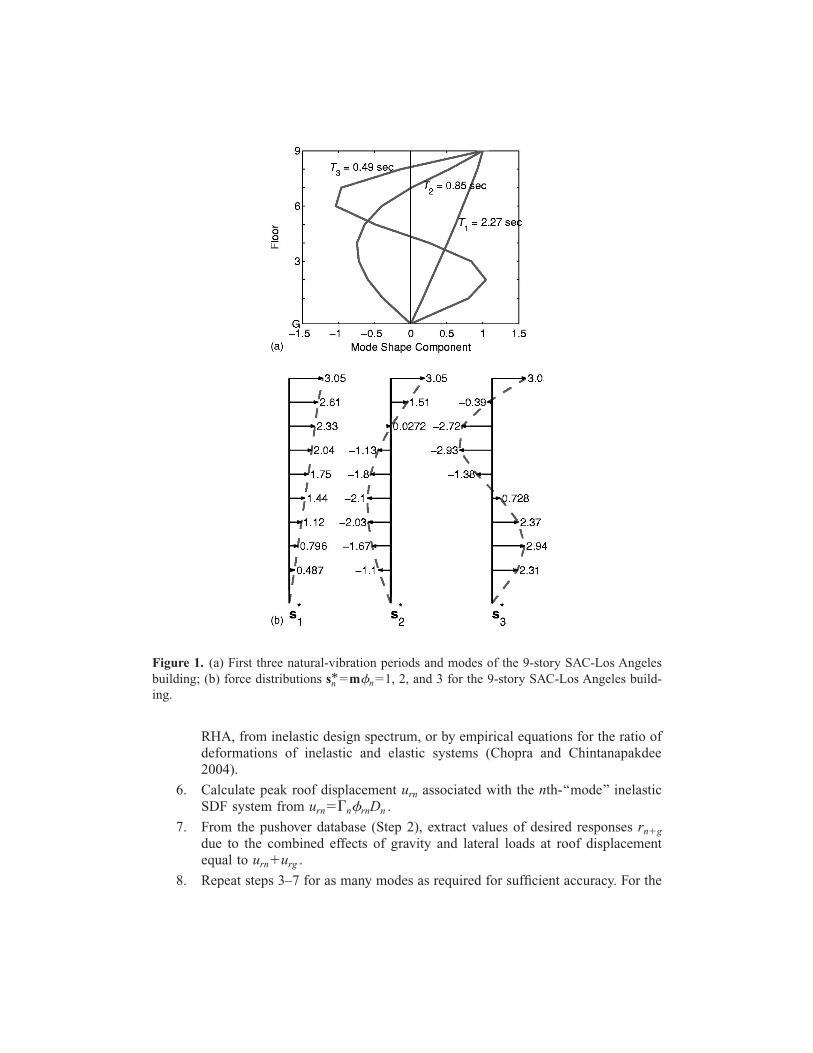
Figure 1. (a) First three natural-vibration periods and modes of the 9-story SAC-Los Angeles building; (b) force distributions s*�m�n�1, 2, and 3 for the 9-story SAC-Los Angeles build-n ing.
RHA, from inelastic design spectrum, or by empirical equations for the ratio of deformations of inelastic and elastic systems (Chopra and Chintanapakdee 2004).
6. Calculate peak roof displacement urn associated with the nth-‘‘mode’’ inelastic SDF system from urn��n�rnDn .
7. From the pushover database (Step 2), extract values of desired responses rn�g due to the combined effects of gravity and lateral loads at roof displacement equal to urn�urg .
8. Repeat steps 3–7 for as many modes as required for sufficient accuracy. For the
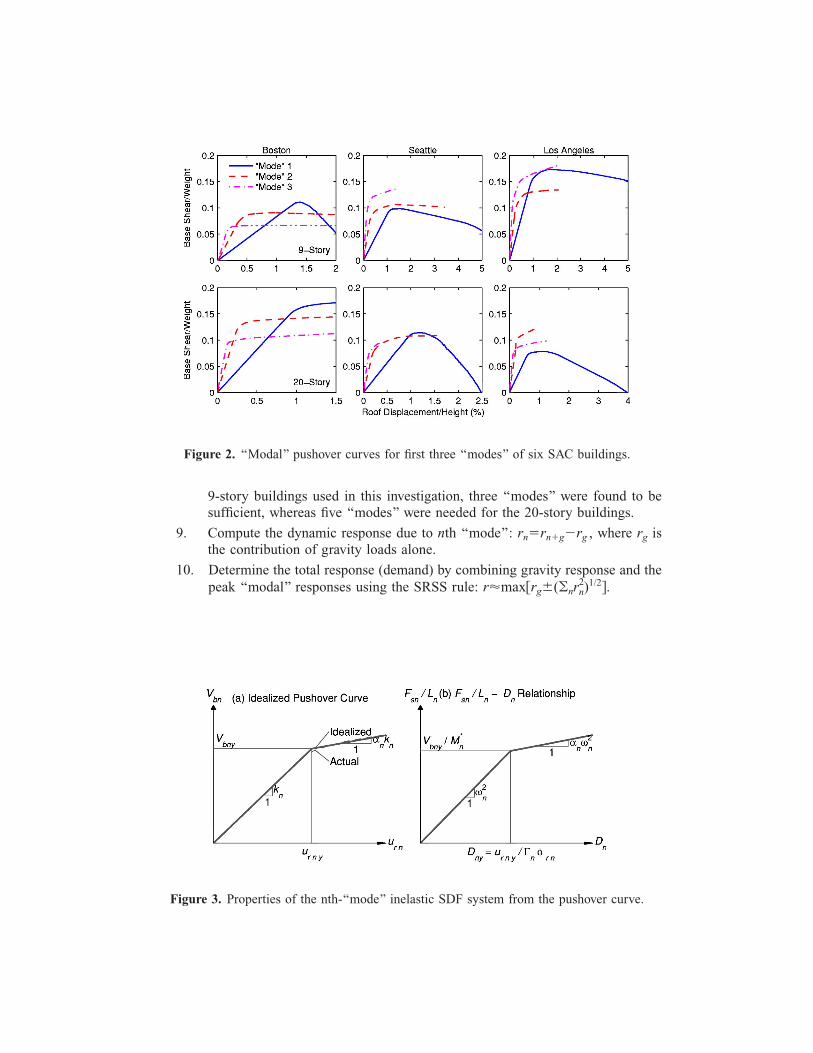
Figure 2. ‘‘Modal’’ pushover curves for first three ‘‘modes’’ of six SAC buildings.
9-story buildings used in this investigation, three ‘‘modes’’ were found to be sufficient, whereas five ‘‘modes’’ were needed for the 20-story buildings.
9. Compute the dynamic response due to nth ‘‘mode’’: rn�rn�g�rg , where rg is the contribution of gravity loads alone.
10. Determine the total response (demand) by combining gravity response and the 2)1/2�.peak ‘‘modal’’ responses using the SRSS rule: r�max�rg�(�nrn
Figure 3. Properties of the nth-‘‘mode’’ inelastic SDF system from the pushover curve.
IMPROVEMENTS IN MPA
The MPA procedure summarized in this paper contains several improvements over the original version presented in Chopra and Goel (2002).
1. The P-� effects due to gravity loads have been included in pushover analysis for all modes; these effects were considered only for the first ‘‘mode’’ in the earlier version.
2. Although the total floor displacements and story drifts are computed by combining the values obtained from gravity load and ‘‘modal’’ pushover analyses (Step 10), the beam plastic rotations are no longer computed by this procedure. They are determined from the total story drift by the approximate procedure described in the Appendix.
3. The nth-‘‘mode’’ pushover curve is idealized in Step 3 at the peak roof displacement obtained from the nth-‘‘mode’’ inelastic SDF system for the selected ground motion; thus the idealization depends slightly on the ground motion. For this purpose, an iterative procedure is used idealizing the pushover curve at an estimated (or assumed) value of peak roof displacement urn . Steps 3 to 6 are repeated until starting and ending values of urn are within specified tolerance. For buildings analyzed in this study, convergence was achieved in less than five iterations.
FEMA-356 NONLINEAR STATIC PROCEDURE
The nonlinear static procedure (NSP) specified in the FEMA-356 (BSSC 2000) document is applicable for any structure and any rehabilitation objective except for structures with significant higher-mode effects. To detect the presence of significant higher-mode effects, two linear response spectrum analyses must be performed: (1) using sufficient number of modes to capture 90% of the total mass, and (2) using only the fundamental mode. Higher-mode effects are significant when shear in any story from the first analysis exceeds 130% of the corresponding shear from the second analysis.
Implementing the FEMA-356 NSP requires performing the following procedure: (1) development of the pushover curve, (2) estimation of the target displacement, and (3) checking acceptability criteria. Each of these three steps are described briefly next.
PUSHOVER CURVE
The FEMA-356 NSP requires development of a pushover curve, which is the relationship between the base shear and lateral displacement of a control node, defined as the center of mass at the roof of a building. The pushover curve is developed by first applying gravity loads, followed by monotonically increasing lateral forces with a specified height-wise distribution.
At least two force distributions must be considered. The first is selected from one of the following: fundamental mode (First Mode) distribution, equivalent lateral force (ELF) distribution, and SRSS distribution. The second distribution is either the ‘‘Uniform’’ distribution or an ‘‘Adaptive’’ distribution. These distributions are defined as follows:
kEquivalent lateral force (ELF) distribution: s*j �mjhj (the floor number j �1,2,...,N) where s* j is the lateral force and mj the mass at jth floor, hj is the height of the jth floor above the base, and the exponent k�1 for fundamental period T1 �0.5 sec, k�2 for T1�2.5 sec, and varies linearly in between. This distribution is permitted when more than 75% of the total mass participates in the fundamental mode and when it is used in conjunction with the ‘‘Uniform’’ distribution (described later).
Fundamental mode distribution: s*j �mj�j1 , where �j1 is the fundamental mode shape component at the jth floor. This distribution is permitted when more than 75% of the total mass participates in the fundamental mode.
SRSS distribution: s* is defined by the lateral forces back-calculated from the story shears determined by linear response spectrum analysis of the structure including sufficient number of modes to capture 90% of the total mass. This distribution is used when the fundamental period of vibration exceeds 1.0 second.
Uniform distribution: s*j �mj , in which mj is the mass and s* j is the lateral force at jth floor. Note that this force distribution is uniform only if all the floor masses are equal.
Adaptive distribution: This force distribution varies with change in deflected shape of the structure after it yields. Distributions such as those specified in Bracci et al. (1997) and Gupta and Kunnath (2000) are permitted.
TARGET DISPLACEMENT
The target displacement in the FEMA-356 NSP is computed by multiplying the elastic deformation of an SDF system by four coefficients—C0 , C1 , C2 , and C3: C0 relates the elastic deformation of an SDF system to the elastic displacement of the MDF building at the control node; C1 is the ratio of maximum deformation of inelastic and corresponding elastic SDF systems; C2 accounts for effects of pinching, stiffness degradation, and strength deterioration of the hysteresis curve on the deformation of an inelastic SDF system; and C3 accounts for the increase in deformation of an inelastic SDF system due to P-� effects.
In this paper, the target displacement was not estimated by the procedure described above but taken to be equal to the value determined in MPA. Thus any differences observed between MPA and FEMA estimates of seismic demand will be due to the height-wise distribution of forces.
ACCEPTABILITY CRITERIA
The deformation/force demands in each structural element are computed at the target displacement for each of the two selected lateral force distributions to both bound the response and to compare against acceptability criteria set forth in the FEMA-356 document. Although not explicitly specified in the FEMA-356 document, the profession typically uses the larger of the two demand values to compare against the specified acceptability criteria. These criteria depend on the material (e.g., concrete or steel), type of
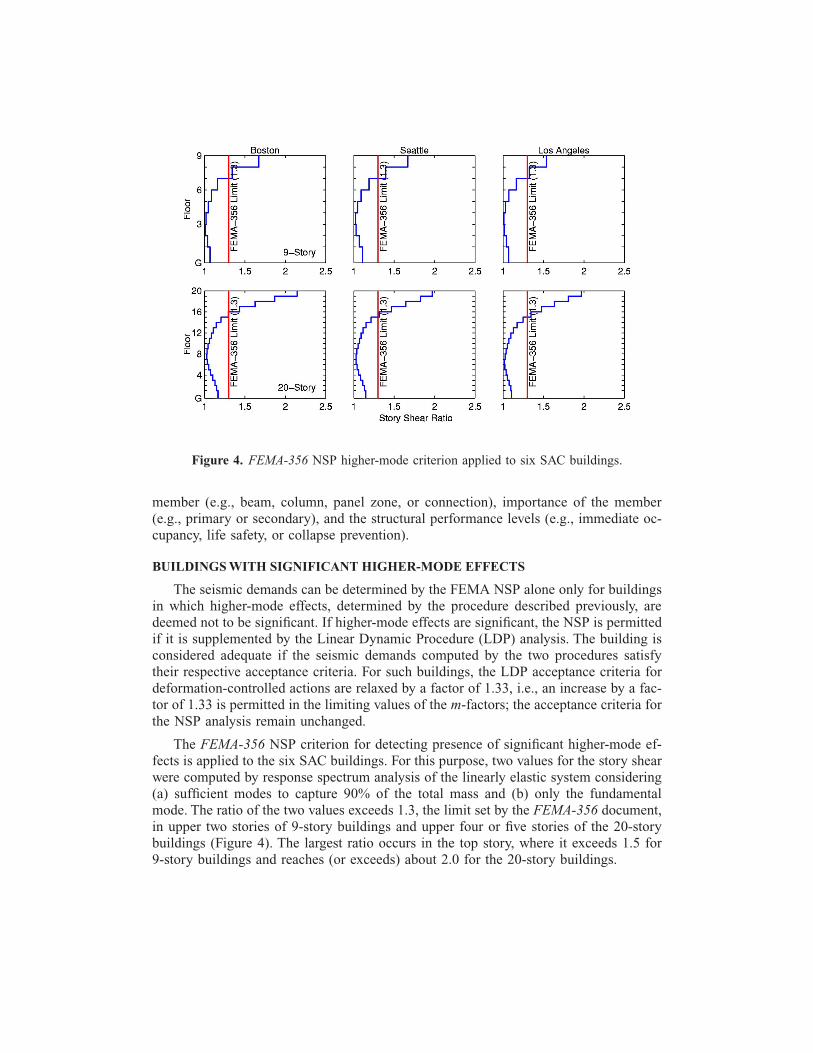
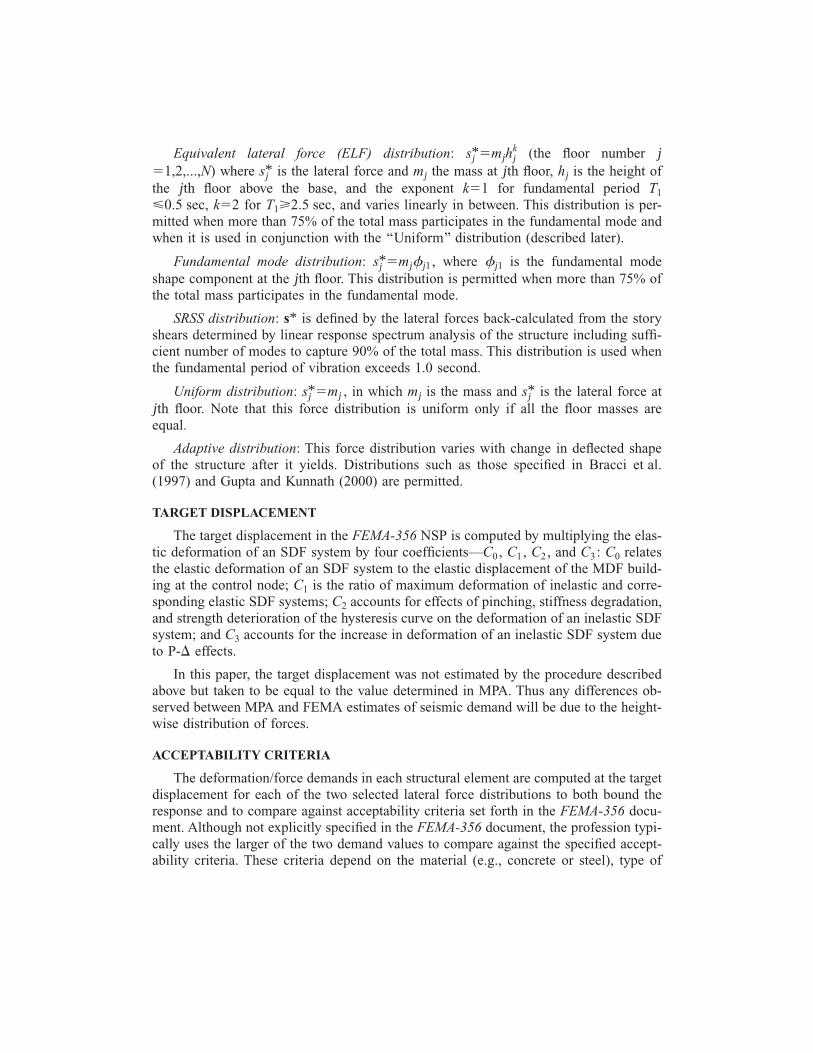
Figure 4. FEMA-356 NSP higher-mode criterion applied to six SAC buildings.
member (e.g., beam, column, panel zone, or connection), importance of the member (e.g., primary or secondary), and the structural performance levels (e.g., immediate occupancy, life safety, or collapse prevention).
BUILDINGS WITH SIGNIFICANT HIGHER-MODE EFFECTS
The seismic demands can be determined by the FEMA NSP alone only for buildings in which higher-mode effects, determined by the procedure described previously, are deemed not to be significant. If higher-mode effects are significant, the NSP is permitted if it is supplemented by the Linear Dynamic Procedure (LDP) analysis. The building is considered adequate if the seismic demands computed by the two procedures satisfy their respective acceptance criteria. For such buildings, the LDP acceptance criteria for deformation-controlled actions are relaxed by a factor of 1.33, i.e., an increase by a factor of 1.33 is permitted in the limiting values of the m-factors; the acceptance criteria for the NSP analysis remain unchanged.
The FEMA-356 NSP criterion for detecting presence of significant higher-mode effects is applied to the six SAC buildings. For this purpose, two values for the story shear were computed by response spectrum analysis of the linearly elastic system considering (a) sufficient modes to capture 90% of the total mass and (b) only the fundamental mode. The ratio of the two values exceeds 1.3, the limit set by the FEMA-356 document, in upper two stories of 9-story buildings and upper four or five stories of the 20-story buildings (Figure 4). The largest ratio occurs in the top story, where it exceeds 1.5 for 9-story buildings and reaches (or exceeds) about 2.0 for the 20-story buildings.
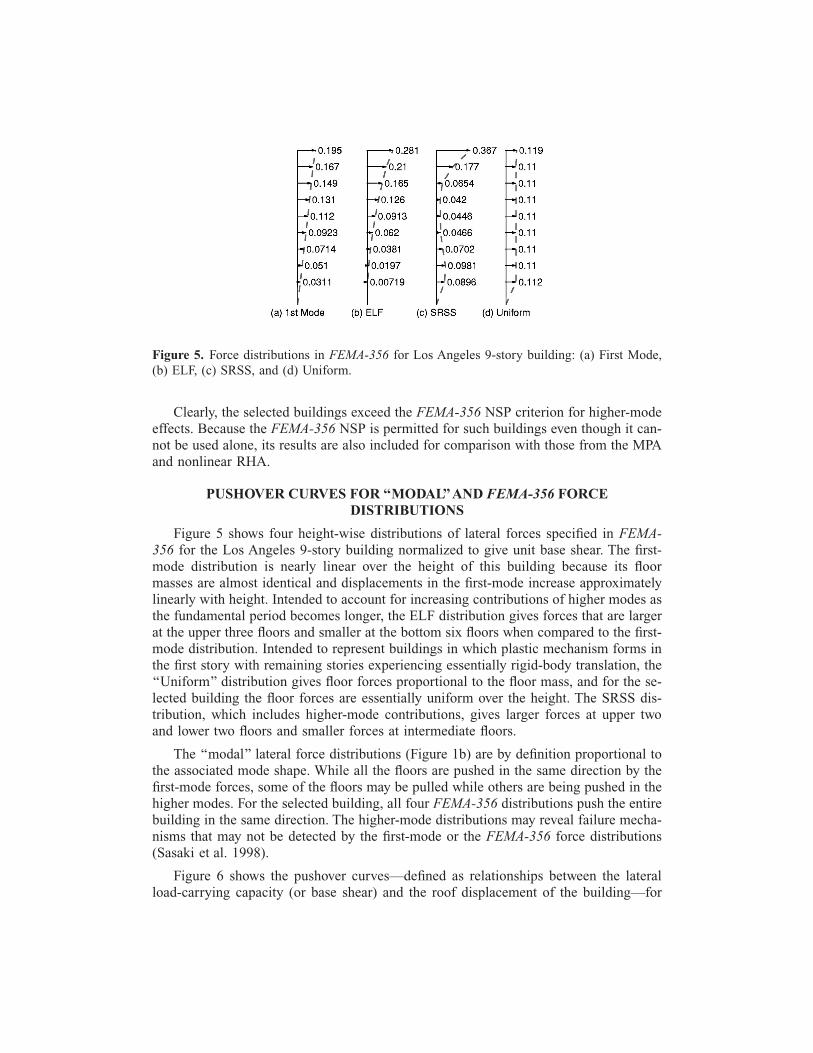
Figure 5. Force distributions in FEMA-356 for Los Angeles 9-story building: (a) First Mode, (b) ELF, (c) SRSS, and (d) Uniform.
Clearly, the selected buildings exceed the FEMA-356 NSP criterion for higher-mode effects. Because the FEMA-356 NSP is permitted for such buildings even though it cannot be used alone, its results are also included for comparison with those from the MPA and nonlinear RHA.
PUSHOVER CURVES FOR ‘‘MODAL’’AND FEMA-356 FORCE DISTRIBUTIONS
Figure 5 shows four height-wise distributions of lateral forces specified in FEMA356 for the Los Angeles 9-story building normalized to give unit base shear. The first-mode distribution is nearly linear over the height of this building because its floor masses are almost identical and displacements in the first-mode increase approximately linearly with height. Intended to account for increasing contributions of higher modes as the fundamental period becomes longer, the ELF distribution gives forces that are larger at the upper three floors and smaller at the bottom six floors when compared to the first-mode distribution. Intended to represent buildings in which plastic mechanism forms in the first story with remaining stories experiencing essentially rigid-body translation, the ‘‘Uniform’’ distribution gives floor forces proportional to the floor mass, and for the selected building the floor forces are essentially uniform over the height. The SRSS distribution, which includes higher-mode contributions, gives larger forces at upper two and lower two floors and smaller forces at intermediate floors.
The ‘‘modal’’ lateral force distributions (Figure 1b) are by definition proportional to the associated mode shape. While all the floors are pushed in the same direction by the first-mode forces, some of the floors may be pulled while others are being pushed in the higher modes. For the selected building, all four FEMA-356 distributions push the entire building in the same direction. The higher-mode distributions may reveal failure mechanisms that may not be detected by the first-mode or the FEMA-356 force distributions (Sasaki et al. 1998).
Figure 6 shows the pushover curves—defined as relationships between the lateral load-carrying capacity (or base shear) and the roof displacement of the building—for
Figure 6. Pushover curves for SAC buildings for four FEMA-356 force distributions: First Mode, ELF, SRSS, and Uniform.
each of the six selected SAC buildings and four FEMA distributions; P-� effects due to gravity load were included. These results lead to the following observations: the pushover curves for Boston 9-story building exhibit a rapid decrease in lateral load-carrying capacity (or lateral capacity in short) soon after the yield displacement, whereas pushover curves for the Boston 20-story building show stable behavior with no post-yielding reduction in lateral capacity observed at the displacement shown; the pushover curves for the Seattle and Los Angeles 9-story buildings develop a small plateau after yielding, followed by gradual decay in lateral capacity and eventually a region of rapid decay in lateral capacity; and the pushover curves for Seattle and Los Angeles 20-story buildings exhibit a short plateau followed by rapid decay in lateral capacity.
The characteristics—elastic stiffness, yield strength and displacement, and post-yield decay in lateral capacity—of the pushover curve depend on the lateral force distribution. The ‘‘Uniform’’ distribution generally leads to pushover curve with higher elastic stiffness, higher yield strength, lower yield displacement, and more rapid decay in post-yield lateral capacity compared to all other distributions. The ELF distribution, on the other hand, leads to pushover curve with lower elastic stiffness, lower yield strength, higher yield displacement, and a more gradual decay in post-yield lateral capacity. The First Mode and SRSS distribution give pushover curves that are essentially identical and are bounded by the pushover curves due to ‘‘Uniform’’ and ELF distributions.
The ‘‘modal’’ pushover curves were shown in Figure 2 for the same six buildings. While the ‘‘mode’’ 1 pushover curves developed in the MPA procedure (Figure 2) are identical to the mode 1 pushover curves in the FEMA-356 NSP (Figure 5), the higher‘‘mode’’ curves in the MPA procedure do not bear any resemblance to the FEMA-356
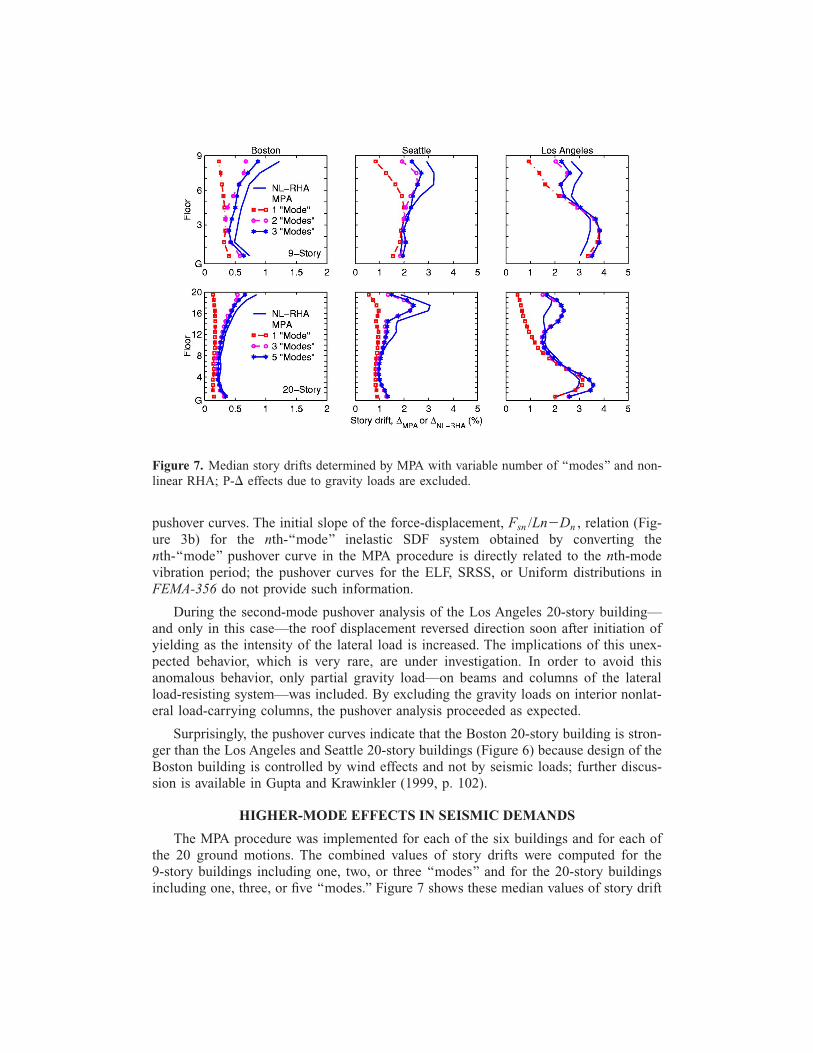
Figure 7. Median story drifts determined by MPA with variable number of ‘‘modes’’ and nonlinear RHA; P-� effects due to gravity loads are excluded.
pushover curves. The initial slope of the force-displacement, Fsn /Ln�Dn , relation (Figure 3b) for the nth-‘‘mode’’ inelastic SDF system obtained by converting the nth-‘‘mode’’ pushover curve in the MPA procedure is directly related to the nth-mode vibration period; the pushover curves for the ELF, SRSS, or Uniform distributions in FEMA-356 do not provide such information.
During the second-mode pushover analysis of the Los Angeles 20-story building— and only in this case—the roof displacement reversed direction soon after initiation of yielding as the intensity of the lateral load is increased. The implications of this unexpected behavior, which is very rare, are under investigation. In order to avoid this anomalous behavior, only partial gravity load—on beams and columns of the lateral load-resisting system—was included. By excluding the gravity loads on interior nonlateral load-carrying columns, the pushover analysis proceeded as expected.
Surprisingly, the pushover curves indicate that the Boston 20-story building is stronger than the Los Angeles and Seattle 20-story buildings (Figure 6) because design of the Boston building is controlled by wind effects and not by seismic loads; further discussion is available in Gupta and Krawinkler (1999, p. 102).
HIGHER-MODE EFFECTS IN SEISMIC DEMANDS
The MPA procedure was implemented for each of the six buildings and for each of the 20 ground motions. The combined values of story drifts were computed for the 9-story buildings including one, two, or three ‘‘modes’’ and for the 20-story buildings including one, three, or five ‘‘modes.’’ Figure 7 shows these median values of story drift
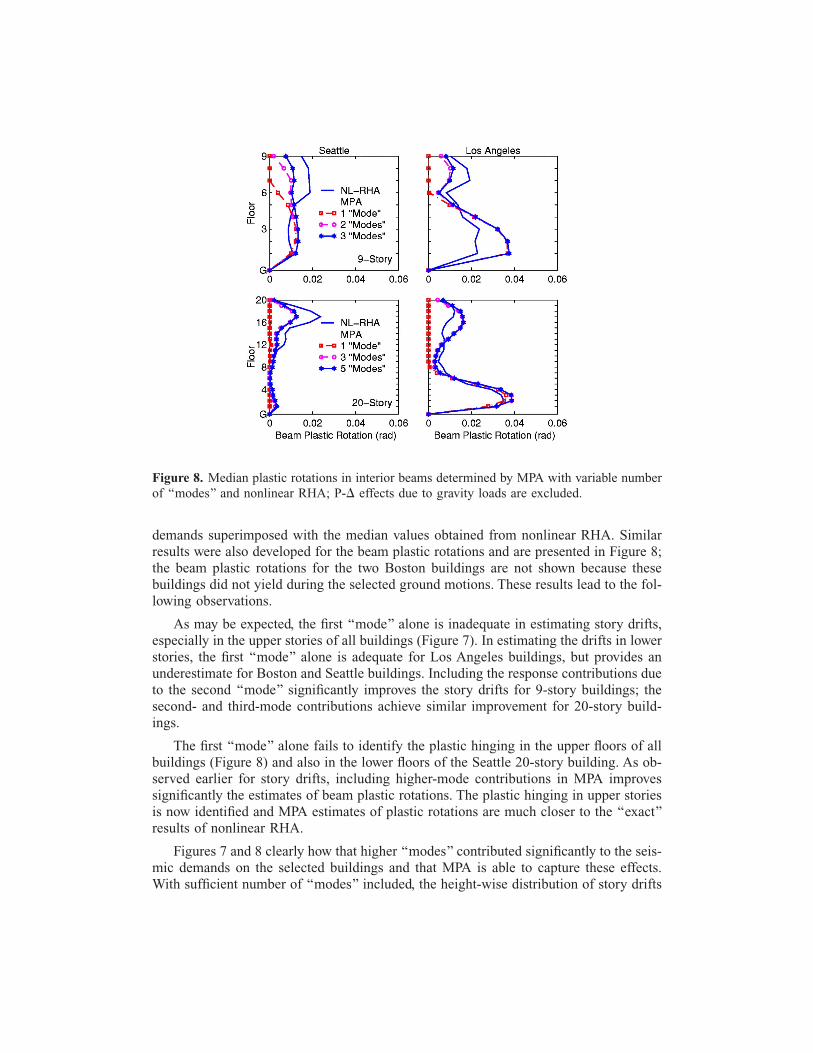
Figure 8. Median plastic rotations in interior beams determined by MPA with variable number of ‘‘modes’’ and nonlinear RHA; P-� effects due to gravity loads are excluded.
demands superimposed with the median values obtained from nonlinear RHA. Similar results were also developed for the beam plastic rotations and are presented in Figure 8; the beam plastic rotations for the two Boston buildings are not shown because these buildings did not yield during the selected ground motions. These results lead to the following observations.
As may be expected, the first ‘‘mode’’ alone is inadequate in estimating story drifts, especially in the upper stories of all buildings (Figure 7). In estimating the drifts in lower stories, the first ‘‘mode’’ alone is adequate for Los Angeles buildings, but provides an underestimate for Boston and Seattle buildings. Including the response contributions due to the second ‘‘mode’’ significantly improves the story drifts for 9-story buildings; the second- and third-mode contributions achieve similar improvement for 20-story buildings.
The first ‘‘mode’’ alone fails to identify the plastic hinging in the upper floors of all buildings (Figure 8) and also in the lower floors of the Seattle 20-story building. As observed earlier for story drifts, including higher-mode contributions in MPA improves significantly the estimates of beam plastic rotations. The plastic hinging in upper stories is now identified and MPA estimates of plastic rotations are much closer to the ‘‘exact’’ results of nonlinear RHA.
Figures 7 and 8 clearly how that higher ‘‘modes’’ contributed significantly to the seismic demands on the selected buildings and that MPA is able to capture these effects. With sufficient number of ‘‘modes’’ included, the height-wise distribution of story drifts
and plastic rotations estimated by MPA is generally similar to the ‘‘exact’’ results from nonlinear RHA, and much superior to the first-mode result. However, because MPA is an approximate method, it does not match the ‘‘exact’’ demands determined by nonlinear RHA. The reasons and extent of such discrepancies are investigated in the next section.
ACCURACY OF THE MPA PROCEDURE
An approximate procedure is invariably biased in the sense that the median of the ratio of the response from ‘‘approximate’’ and ‘‘exact’’ procedures differs from one; the ‘‘approximate’’ procedure is biased toward underestimating the response if the ratio is less than one and overestimating the response if the ratio exceeds one. The accuracy of the MPA procedure is evaluated next by investigating the median and dispersion of the ratio for story drifts; the results for beam plastic rotations are not presented for reasons of brevity and because they are directly related to the story drifts.
The MPA procedure for inelastic systems is based on two principal approximations: (1) neglecting coupling among modal coordinates associated with the modes of the corresponding linear system arising from yielding of the system; and (2) estimating the total response by combining the peak ‘‘modal’’ responses using the SRSS rule.
The aforementioned approximations in the MPA procedure are investigated as follows. First, each of the six SAC buildings was analyzed, under the assumption that it remains elastic, by using the RSA (or MPA) and RHA procedures and the story drift ratios, �RSA * , were computed for each of the twenty ground motions; gravity loads were not included in the analysis. The deviation of the median of ratio �RSA * from 1.0 provides the bias due to the modal combination approximation. Next, the MPA and nonlinear RHA procedures were implemented for inelastic buildings excluding P-� effects and values of �MPA computed for each of the 20 ground motions. The deviation of median * values of �MPA * from 1.0 represents the bias in the MPA procedure due to the combined effects of ‘‘modal’’ combination and ‘‘modal’’ uncoupling approximations. Thus a comparison between the median values of �RSA * for elastic systems with the median values of
* for inelastic systems identifies the additional bias due to the second source. �MPA
The accuracy of the MPA procedure is evaluated also in the presence of P-� effects due to gravity loads. For this purpose, the MPA and nonlinear RHA procedures are implemented for inelastic systems including P-� effects. The additional bias due to P-� effects is investigated by comparing the median values of �MPA * from analyses including and excluding P-� effects.
Also presented are the dispersions of the ratio �RSA * *for elastic systems and �MPA for inelastic systems, which indicate the accuracy (or variability) of both RSA and MPA in estimating response to individual ground motions. It is expected that this dispersion will increase as additional approximations or P-� effects are included. Note that it is not possible to isolate the bias or dispersion due to each of the two approximations or the P-� effects because the resulting effects are not necessarily cumulative.
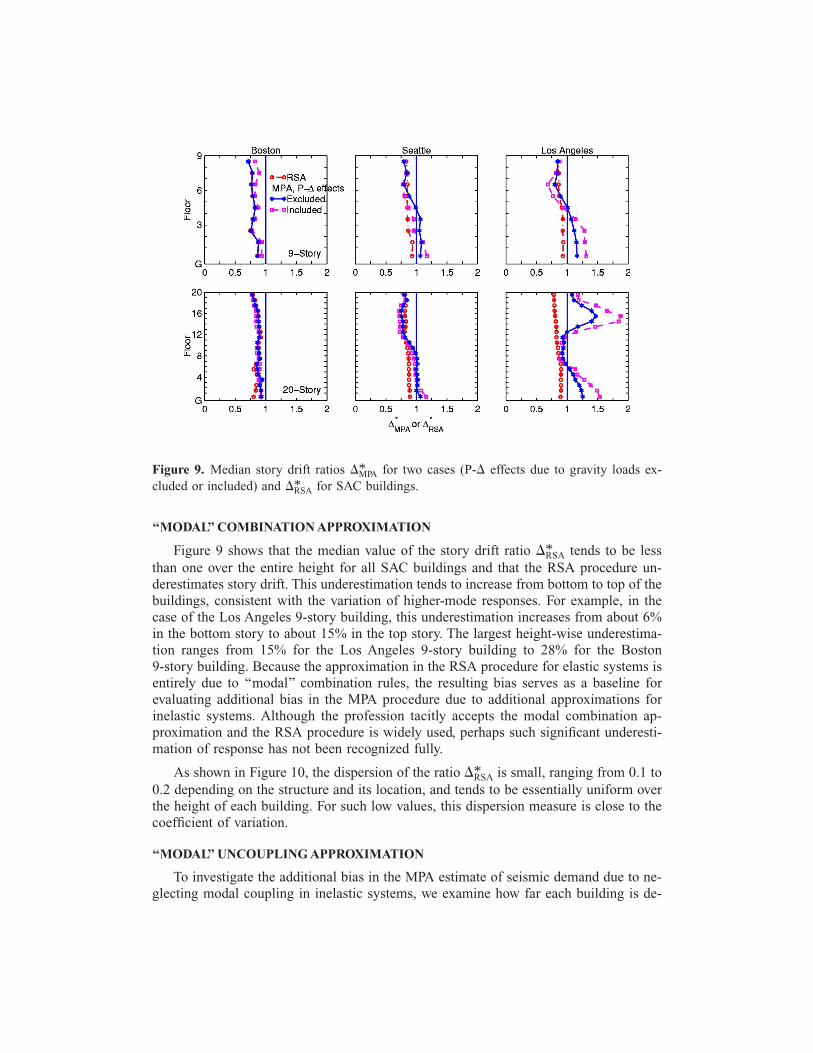
Figure 9. Median story drift ratios �MPA * for two cases (P-� effects due to gravity loads excluded or included) and �RSA * for SAC buildings.
‘‘MODAL’’ COMBINATION APPROXIMATION
Figure 9 shows that the median value of the story drift ratio �RSA * tends to be less than one over the entire height for all SAC buildings and that the RSA procedure underestimates story drift. This underestimation tends to increase from bottom to top of the buildings, consistent with the variation of higher-mode responses. For example, in the case of the Los Angeles 9-story building, this underestimation increases from about 6% in the bottom story to about 15% in the top story. The largest height-wise underestimation ranges from 15% for the Los Angeles 9-story building to 28% for the Boston 9-story building. Because the approximation in the RSA procedure for elastic systems is entirely due to ‘‘modal’’ combination rules, the resulting bias serves as a baseline for evaluating additional bias in the MPA procedure due to additional approximations for inelastic systems. Although the profession tacitly accepts the modal combination approximation and the RSA procedure is widely used, perhaps such significant underestimation of response has not been recognized fully.
As shown in Figure 10, the dispersion of the ratio �RSA * is small, ranging from 0.1 to 0.2 depending on the structure and its location, and tends to be essentially uniform over the height of each building. For such low values, this dispersion measure is close to the coefficient of variation.
‘‘MODAL’’ UNCOUPLING APPROXIMATION
To investigate the additional bias in the MPA estimate of seismic demand due to neglecting modal coupling in inelastic systems, we examine how far each building is de
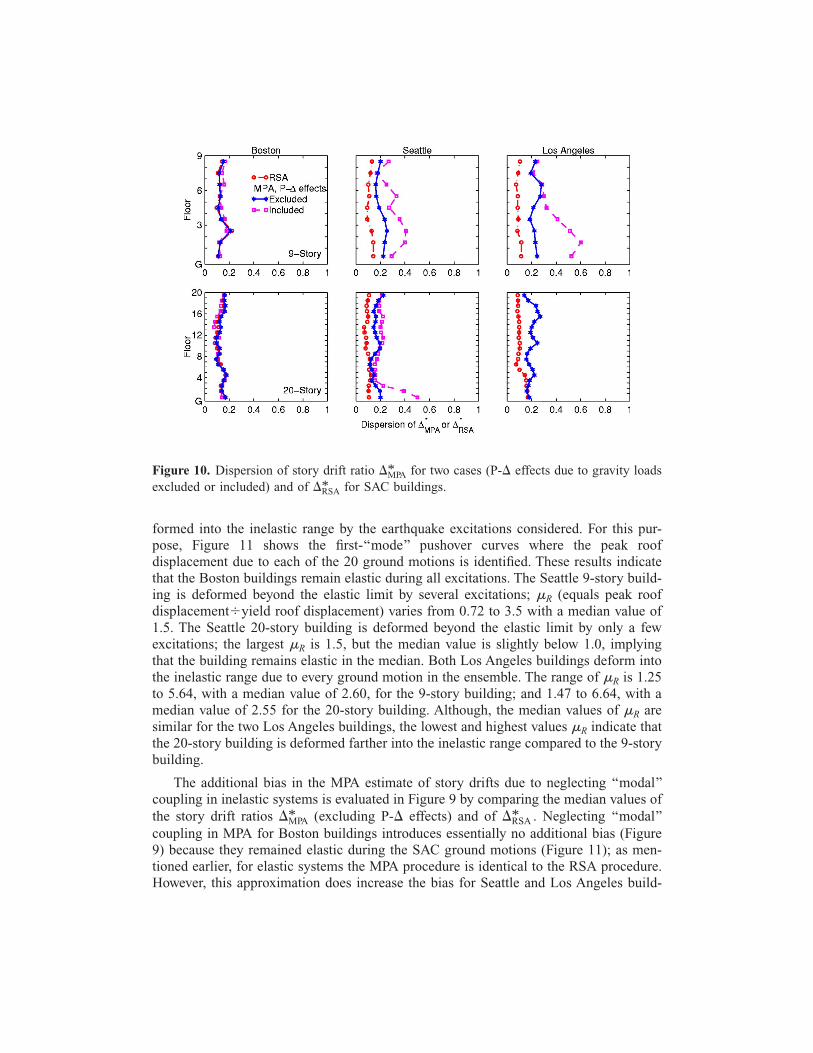
Figure 10. Dispersion of story drift ratio �MPA * for two cases (P-� effects due to gravity loads excluded or included) and of �RSA * for SAC buildings.
formed into the inelastic range by the earthquake excitations considered. For this purpose, Figure 11 shows the first-‘‘mode’’ pushover curves where the peak roof displacement due to each of the 20 ground motions is identified. These results indicate that the Boston buildings remain elastic during all excitations. The Seattle 9-story building is deformed beyond the elastic limit by several excitations; �R (equals peak roof displacement�yield roof displacement) varies from 0.72 to 3.5 with a median value of 1.5. The Seattle 20-story building is deformed beyond the elastic limit by only a few excitations; the largest �R is 1.5, but the median value is slightly below 1.0, implying that the building remains elastic in the median. Both Los Angeles buildings deform into the inelastic range due to every ground motion in the ensemble. The range of �R is 1.25 to 5.64, with a median value of 2.60, for the 9-story building; and 1.47 to 6.64, with a median value of 2.55 for the 20-story building. Although, the median values of �R are similar for the two Los Angeles buildings, the lowest and highest values �R indicate that the 20-story building is deformed farther into the inelastic range compared to the 9-story building.
The additional bias in the MPA estimate of story drifts due to neglecting ‘‘modal’’ coupling in inelastic systems is evaluated in Figure 9 by comparing the median values of the story drift ratios �MPA * (excluding P-� effects) and of �RSA * . Neglecting ‘‘modal’’ coupling in MPA for Boston buildings introduces essentially no additional bias (Figure 9) because they remained elastic during the SAC ground motions (Figure 11); as mentioned earlier, for elastic systems the MPA procedure is identical to the RSA procedure. However, this approximation does increase the bias for Seattle and Los Angeles build
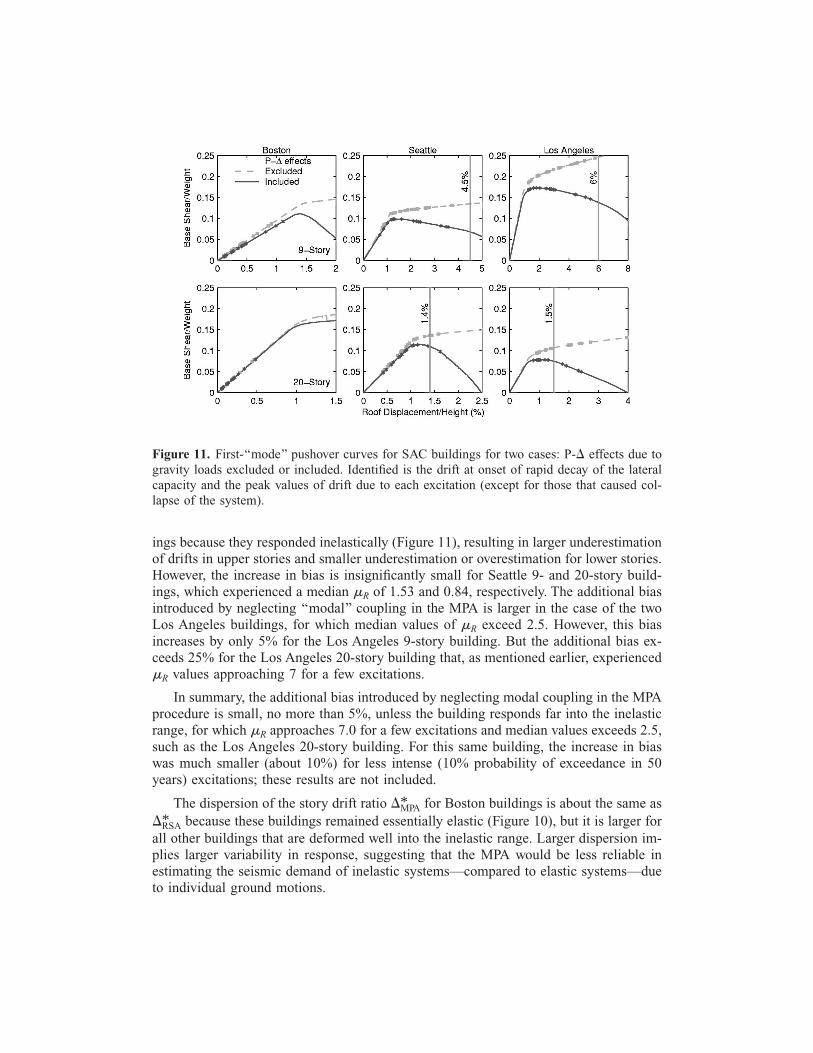
Figure 11. First-‘‘mode’’ pushover curves for SAC buildings for two cases: P-� effects due to gravity loads excluded or included. Identified is the drift at onset of rapid decay of the lateral capacity and the peak values of drift due to each excitation (except for those that caused collapse of the system).
ings because they responded inelastically (Figure 11), resulting in larger underestimation of drifts in upper stories and smaller underestimation or overestimation for lower stories. However, the increase in bias is insignificantly small for Seattle 9- and 20-story buildings, which experienced a median �R of 1.53 and 0.84, respectively. The additional bias introduced by neglecting ‘‘modal’’ coupling in the MPA is larger in the case of the two Los Angeles buildings, for which median values of �R exceed 2.5. However, this bias increases by only 5% for the Los Angeles 9-story building. But the additional bias exceeds 25% for the Los Angeles 20-story building that, as mentioned earlier, experienced �R values approaching 7 for a few excitations.
In summary, the additional bias introduced by neglecting modal coupling in the MPA procedure is small, no more than 5%, unless the building responds far into the inelastic range, for which �R approaches 7.0 for a few excitations and median values exceeds 2.5, such as the Los Angeles 20-story building. For this same building, the increase in bias was much smaller (about 10%) for less intense (10% probability of exceedance in 50 years) excitations; these results are not included.
The dispersion of the story drift ratio �MPA * for Boston buildings is about the same as * because these buildings remained essentially elastic (Figure 10), but it is larger for �RSA
all other buildings that are deformed well into the inelastic range. Larger dispersion implies larger variability in response, suggesting that the MPA would be less reliable in estimating the seismic demand of inelastic systems—compared to elastic systems—due to individual ground motions.
INFLUENCE OF P-� EFFECTS DUE TO GRAVITY LOADS
Before investigating the bias and dispersion in the MPA procedure when P-� effects due to gravity loads are included, the P-� effects in pushover curves are examined. For this purpose, the first-‘‘mode’’ pushover curves for the six SAC buildings with P-� effects due to gravity loads included are also shown in Figure 11. While the curves excluding P-� effects exhibit positive post-yield stiffness and increase in lateral capacity with increasing roof displacement, including P-� effects results in significant degradation in post-yield stiffness and lateral capacity. The peak displacement for each of the 20 ground motions (except for those excitations that caused collapse of the system) is identified on the pushover curves. In the presence of P-� effects, the number of excitations that caused collapse of the first-‘‘mode’’ SDF systems are one for the Seattle 9-story building, three for the Los Angeles 9-story building, and six for the Los Angeles 20story building. In contrast, nonlinear RHA of these buildings for the same ground motions predicted a finite value of displacement without collapse, except in the case of the Los Angeles 20-story building and one ground motion.
The P-� effects due to gravity loads also influence the higher-‘‘mode’’ pushover curves, but to a much lesser degree than the first-‘‘mode’’ pushover curve. Therefore the results for higher-‘‘mode’’ pushover curves are not presented here.
With P-� effects included, the Boston 9-story building exhibits rapid deterioration of the lateral capacity beyond the yield displacement (see Figure 11), but the Boston 20story building is affected very little. Because none of the SAC ground motions excited the Boston buildings beyond their yield displacement (see Figure 11), their seismic response is not likely to be affected by P-� effects.
The pushover curves for the Seattle and Los Angeles 9-story buildings including P-� effects develop a small plateau after yielding, followed by gradual decay in the lateral capacity and eventually a region of rapid decay in the lateral capacity (see Figure 11). The region of rapid decay in the lateral capacity starts at the roof drift (roof displacement expressed as a percentage of building height) of about 4.5% for the Seattle and 6% for the Los Angeles building. Several of the SAC ground motions deform the first‘‘mode’’ SDF system well beyond the elastic limit; the median value of �R for the Seattle and Los Angeles buildings are about 1.8 and 2.75, respectively. Furthermore, one ground motion for the Seattle building and three for the Los Angeles building—the excitations that caused collapse of the first-‘‘mode’’ SDF systems—deformed these buildings into the region of rapid decay in the lateral capacity. Therefore P-� effects are likely to significantly influence seismic demands for these buildings.
The first-‘‘mode’’ pushover curve for Seattle and Los Angeles 20-story buildings including P-� effects exhibits a short plateau followed by rapid decay in the lateral capacity (see Figure 11). The region of rapid decay in the lateral capacity starts at the roof drift of about 1.4% for the Seattle and 1.5% for the Los Angeles building. The first‘‘mode’’ SDF system collapses at relatively low displacements: 2.5% for Seattle and 4% for Los Angeles. The first-‘‘mode’’ SDF system for the Seattle building is deformed beyond the elastic limit by only a few excitations, and into the region of rapid decay in the lateral capacity (roof drift�1.4%) only by one excitation (Figure 11). On the other hand, the first-‘‘mode’’ SDF system for the Los Angeles building is deformed beyond the elas
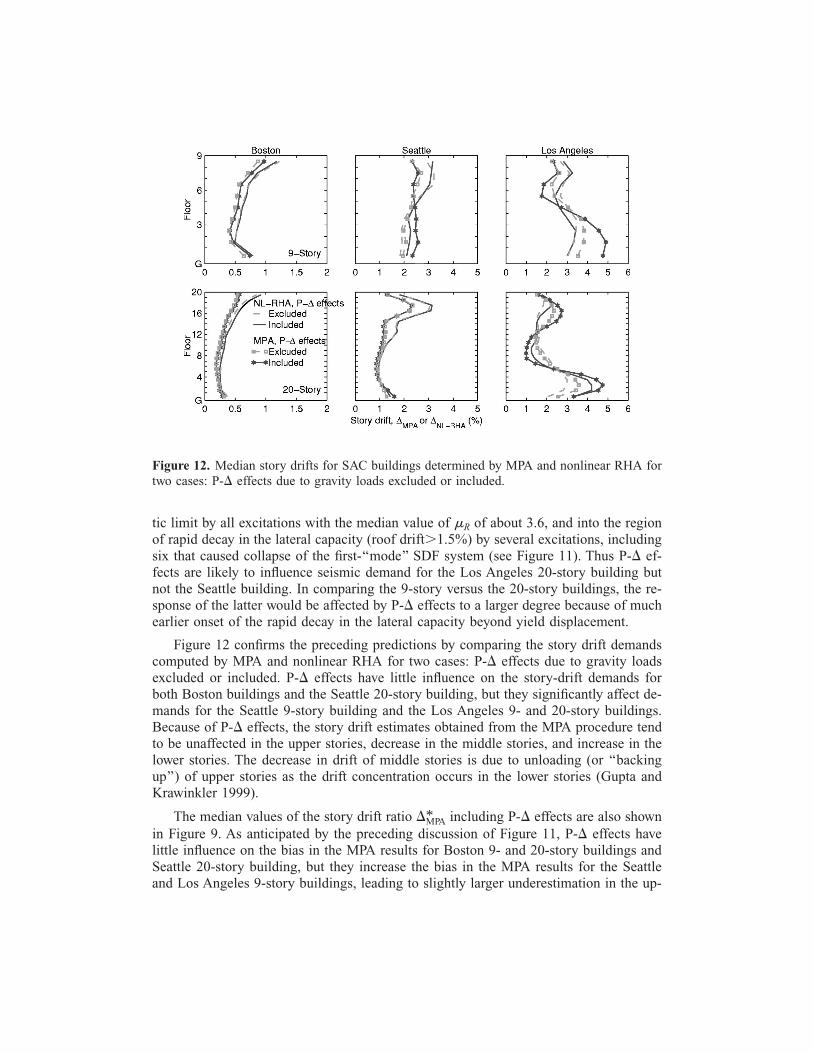
Figure 12. Median story drifts for SAC buildings determined by MPA and nonlinear RHA for two cases: P-� effects due to gravity loads excluded or included.
tic limit by all excitations with the median value of �R of about 3.6, and into the region of rapid decay in the lateral capacity (roof drift�1.5%) by several excitations, including six that caused collapse of the first-‘‘mode’’ SDF system (see Figure 11). Thus P-� effects are likely to influence seismic demand for the Los Angeles 20-story building but not the Seattle building. In comparing the 9-story versus the 20-story buildings, the response of the latter would be affected by P-� effects to a larger degree because of much earlier onset of the rapid decay in the lateral capacity beyond yield displacement.
Figure 12 confirms the preceding predictions by comparing the story drift demands computed by MPA and nonlinear RHA for two cases: P-� effects due to gravity loads excluded or included. P-� effects have little influence on the story-drift demands for both Boston buildings and the Seattle 20-story building, but they significantly affect demands for the Seattle 9-story building and the Los Angeles 9- and 20-story buildings. Because of P-� effects, the story drift estimates obtained from the MPA procedure tend to be unaffected in the upper stories, decrease in the middle stories, and increase in the lower stories. The decrease in drift of middle stories is due to unloading (or ‘‘backing up’’) of upper stories as the drift concentration occurs in the lower stories (Gupta and Krawinkler 1999).
The median values of the story drift ratio �MPA * including P-� effects are also shown in Figure 9. As anticipated by the preceding discussion of Figure 11, P-� effects have little influence on the bias in the MPA results for Boston 9- and 20-story buildings and Seattle 20-story building, but they increase the bias in the MPA results for the Seattle and Los Angeles 9-story buildings, leading to slightly larger underestimation in the up
per stories and much larger overestimation in the lower stories. The overestimation increases by about 10% for the Seattle building and by 16% for the Los Angeles building. The bias is increased more for the Los Angeles 9-story building because more excitations deform its first-‘‘mode’’ SDF beyond into the inelastic range and into the inelastic region where lateral capacity decays rapidly (and cause its collapse) compared to the Seattle 9-story building (Figure 11).
P-� effects due to gravity loads increase the bias in the MPA procedure by over 40% in the case of the Los Angeles 20-story building because this building is deformed much farther into the inelastic range (Figure 11), and into the region of rapid deterioration in the lateral capacity by many more excitations including six of the twenty excitations that caused collapse of the first-‘‘mode’’ SDF system.
The dispersion of the story drift ratio �MPA * including and excluding P-� effects is also shown in Figure 10. Note that the dispersion of the story drift ratio �MPA * including P-� effects could not be computed for the Los Angeles 20-story building; in this case, the 84th percentile value required in calculating the dispersion by the counting method could not be determined because the first-‘‘mode’’ SDF system collapsed during six of the twenty excitations. The remaining results show that P-� effects have little influence on the dispersion for the Boston 9-story building, increases significantly the dispersion for Seattle and Los Angeles 9-story buildings (especially in lower stories of the latter building), and increases only slightly the dispersion for Boston and Seattle 20-story buildings, except for a few lower stories in the Seattle 20-story building where dispersion is significantly larger. Note that among all the buildings considered, Seattle and Los Angeles 9-story buildings are deformed significantly beyond the elastic limit (Figure 11). Therefore the P-� effects increase the variability (or decrease the confidence) in the data for these two buildings.
OVERALL BIAS
The total bias in the MPA estimates of inelastic seismic demands including P-� effects for Boston and Seattle buildings does not exceed 28% over their height. This is about the same as the largest bias observed in the RSA estimate of elastic response of these buildings. However, the bias in MPA is unacceptably large for the Los Angeles 20-story building that, as mentioned earlier, experience roof drifts in the region of rapid decay in lateral capacity of the building, during ten excitations including six that caused collapse of the SDF system. For such cases, MPA (and most other pushover analysis procedures) cannot be expected to provide satisfactory estimates of seismic demands and should be abandoned; nonlinear RHA becomes necessary.
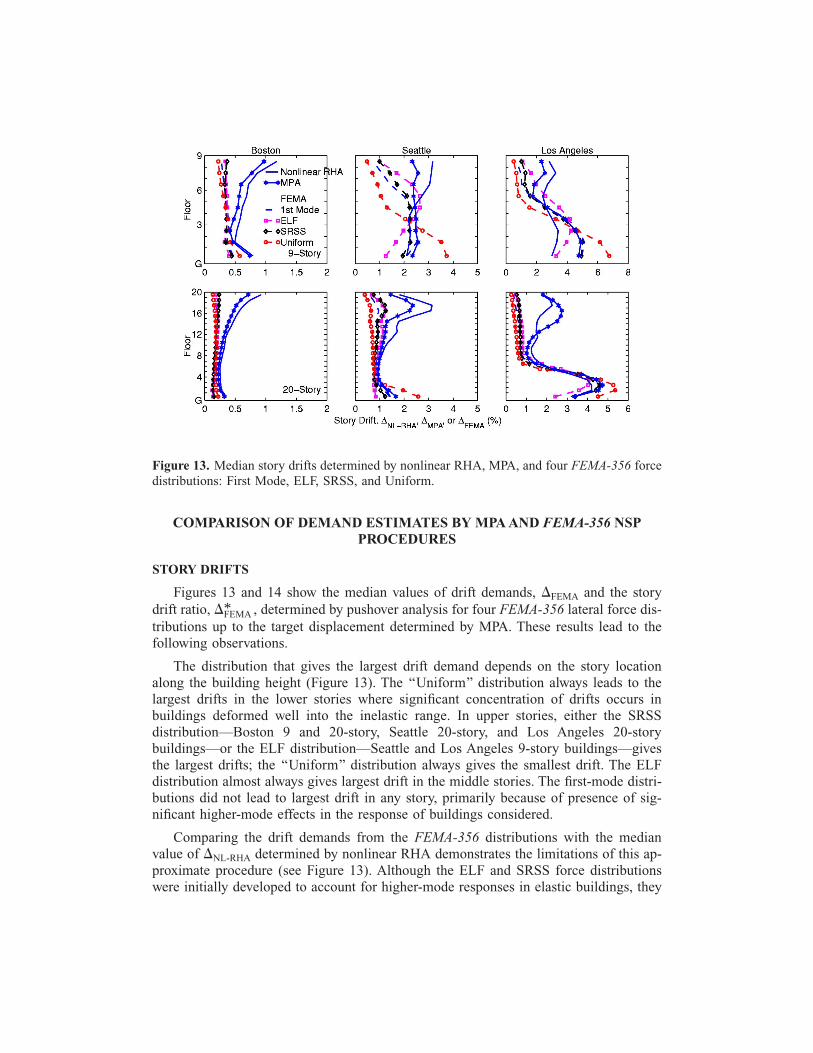
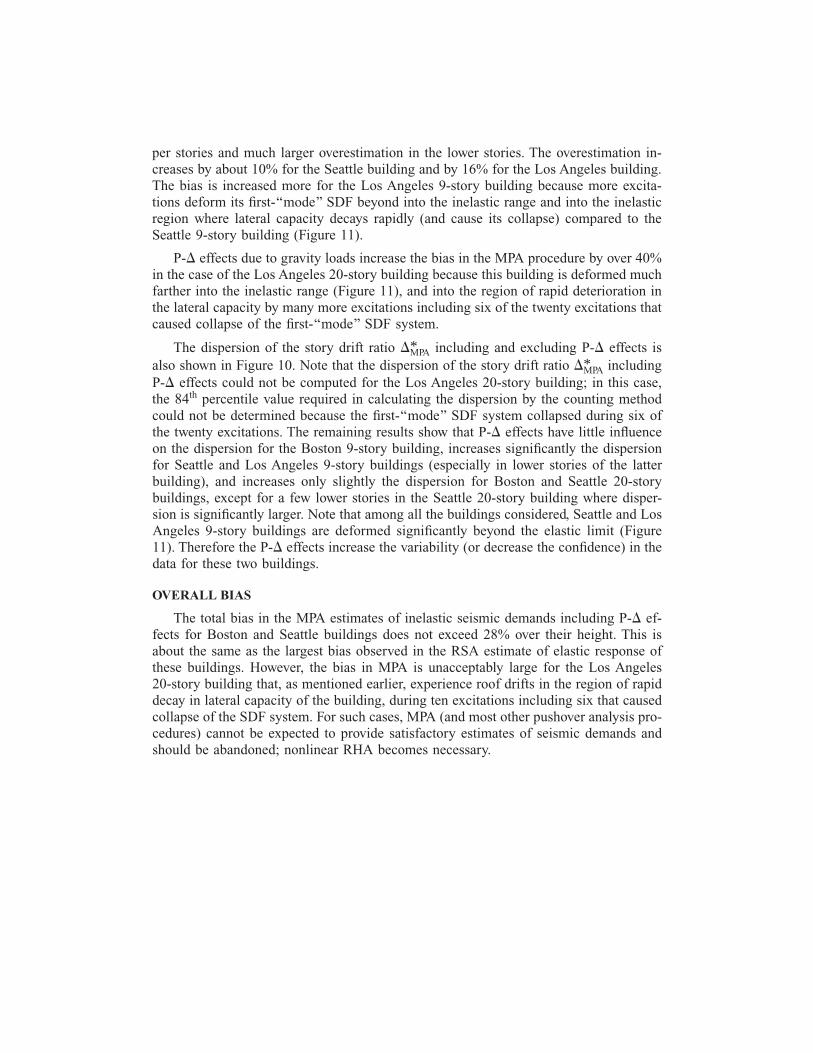
Figure 13. Median story drifts determined by nonlinear RHA, MPA, and four FEMA-356 force distributions: First Mode, ELF, SRSS, and Uniform.
COMPARISON OF DEMAND ESTIMATES BY MPA AND FEMA-356 NSP PROCEDURES
STORY DRIFTS
Figures 13 and 14 show the median values of drift demands, �FEMA and the story drift ratio, �FEMA * , determined by pushover analysis for four FEMA-356 lateral force distributions up to the target displacement determined by MPA. These results lead to the following observations.
The distribution that gives the largest drift demand depends on the story location along the building height (Figure 13). The ‘‘Uniform’’ distribution always leads to the largest drifts in the lower stories where significant concentration of drifts occurs in buildings deformed well into the inelastic range. In upper stories, either the SRSS distribution—Boston 9 and 20-story, Seattle 20-story, and Los Angeles 20-story buildings—or the ELF distribution—Seattle and Los Angeles 9-story buildings—gives the largest drifts; the ‘‘Uniform’’ distribution always gives the smallest drift. The ELF distribution almost always gives largest drift in the middle stories. The first-mode distributions did not lead to largest drift in any story, primarily because of presence of significant higher-mode effects in the response of buildings considered.
Comparing the drift demands from the FEMA-356 distributions with the median value of �NL-RHA determined by nonlinear RHA demonstrates the limitations of this approximate procedure (see Figure 13). Although the ELF and SRSS force distributions were initially developed to account for higher-mode responses in elastic buildings, they
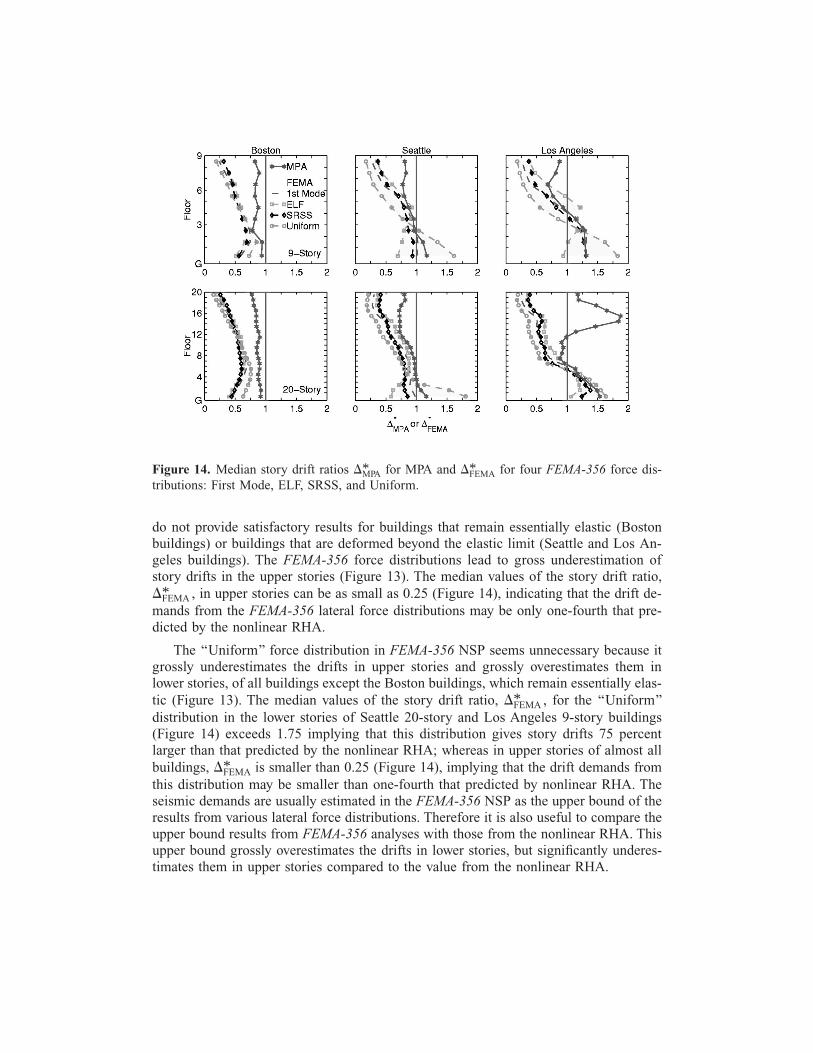
Figure 14. Median story drift ratios �MPA * *for MPA and �FEMA for four FEMA-356 force distributions: First Mode, ELF, SRSS, and Uniform.
do not provide satisfactory results for buildings that remain essentially elastic (Boston buildings) or buildings that are deformed beyond the elastic limit (Seattle and Los Angeles buildings). The FEMA-356 force distributions lead to gross underestimation of story drifts in the upper stories (Figure 13). The median values of the story drift ratio,
* , in upper stories can be as small as 0.25 (Figure 14), indicating that the drift de�FEMA mands from the FEMA-356 lateral force distributions may be only one-fourth that predicted by the nonlinear RHA.
The ‘‘Uniform’’ force distribution in FEMA-356 NSP seems unnecessary because it grossly underestimates the drifts in upper stories and grossly overestimates them in lower stories, of all buildings except the Boston buildings, which remain essentially elastic (Figure 13). The median values of the story drift ratio, �FEMA * , for the ‘‘Uniform’’ distribution in the lower stories of Seattle 20-story and Los Angeles 9-story buildings (Figure 14) exceeds 1.75 implying that this distribution gives story drifts 75 percent larger than that predicted by the nonlinear RHA; whereas in upper stories of almost all buildings, �FEMA * is smaller than 0.25 (Figure 14), implying that the drift demands from this distribution may be smaller than one-fourth that predicted by nonlinear RHA. The seismic demands are usually estimated in the FEMA-356 NSP as the upper bound of the results from various lateral force distributions. Therefore it is also useful to compare the upper bound results from FEMA-356 analyses with those from the nonlinear RHA. This upper bound grossly overestimates the drifts in lower stories, but significantly underestimates them in upper stories compared to the value from the nonlinear RHA.
Figure 15. Median value of plastic rotations in interior beams determined by nonlinear RHA, MPA, and four FEMA-356 force distributions: First Mode, ELF, SRSS, and Uniform.
The MPA procedure, on the other hand, leads to median story drifts that are generally much closer to the ‘‘exact’’ results from nonlinear RHA (Figure 13). The median values of story drift ratios �MPA * (Figure 14) are generally much closer to one indicating much smaller bias in the MPA procedure. The Los Angeles buildings are an exception: the MPA procedure significantly overestimates the drift demands in lower stories of the 9-story building, but these results are still better, however, than those obtained using the ‘‘Uniform’’ distribution and are comparable to First Mode and SRSS distributions in the FEMA-356 NSP. The MPA procedure significantly overestimates the drift demands in upper stories of the 20-story building, whereas the FEMA-NSP procedure underestimates drift demands in these stories. This discrepancy occurs because these buildings deform in to the region with significant degradation in the lateral capacity (beyond roof drift of 6% for the 9-story building and 1.5% for the 20-story building). This is evident from Figure 11 where the displacements are identified for each ground motion on the pushover curve and by recalling that the first-‘‘mode’’ SDF system collapsed under three excitations for the 9-story building and six for the 20-story building.
Results for the Boston buildings demonstrate another limitation of the FEMA-356 NSP. As clearly demonstrated (see Figure 13), this approximate procedure is inaccurate for these buildings, which respond essentially within the elastic range. For such buildings, MPA, which is equivalent to the standard RSA procedure, provides superior results.
BEAM PLASTIC ROTATIONS
Figure 15 shows results for the median values of plastic hinge rotations for interior beams determined by three procedures: (1) nonlinear RHA; (2) MPA, wherein the rotations are determined from the median story drifts (see Appendix); and (3) pushover
analyses using four FEMA-356 force distributions at the same target displacement as MPA. Comparison of these results led to the following observations:
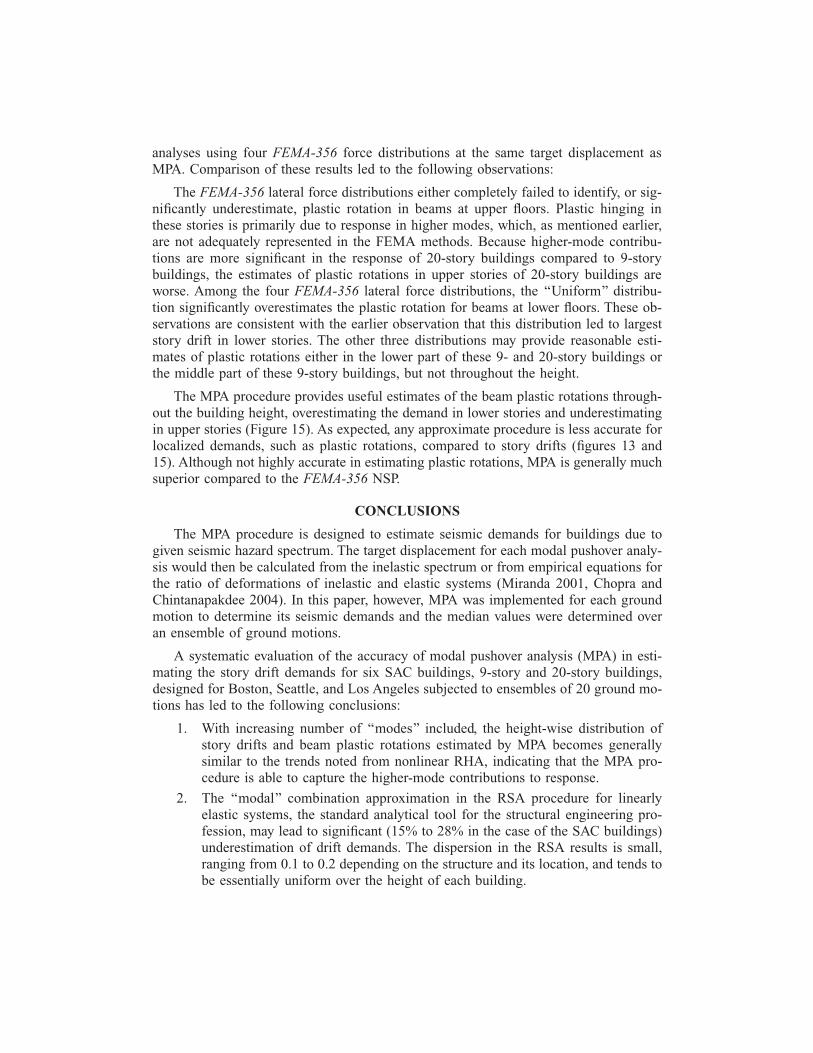
The FEMA-356 lateral force distributions either completely failed to identify, or significantly underestimate, plastic rotation in beams at upper floors. Plastic hinging in these stories is primarily due to response in higher modes, which, as mentioned earlier, are not adequately represented in the FEMA methods. Because higher-mode contributions are more significant in the response of 20-story buildings compared to 9-story buildings, the estimates of plastic rotations in upper stories of 20-story buildings are worse. Among the four FEMA-356 lateral force distributions, the ‘‘Uniform’’ distribution significantly overestimates the plastic rotation for beams at lower floors. These observations are consistent with the earlier observation that this distribution led to largest story drift in lower stories. The other three distributions may provide reasonable estimates of plastic rotations either in the lower part of these 9- and 20-story buildings or the middle part of these 9-story buildings, but not throughout the height.
The MPA procedure provides useful estimates of the beam plastic rotations throughout the building height, overestimating the demand in lower stories and underestimating in upper stories (Figure 15). As expected, any approximate procedure is less accurate for localized demands, such as plastic rotations, compared to story drifts (figures 13 and 15). Although not highly accurate in estimating plastic rotations, MPA is generally much superior compared to the FEMA-356 NSP.
CONCLUSIONS
The MPA procedure is designed to estimate seismic demands for buildings due to given seismic hazard spectrum. The target displacement for each modal pushover analysis would then be calculated from the inelastic spectrum or from empirical equations for the ratio of deformations of inelastic and elastic systems (Miranda 2001, Chopra and Chintanapakdee 2004). In this paper, however, MPA was implemented for each ground motion to determine its seismic demands and the median values were determined over an ensemble of ground motions.
A systematic evaluation of the accuracy of modal pushover analysis (MPA) in estimating the story drift demands for six SAC buildings, 9-story and 20-story buildings, designed for Boston, Seattle, and Los Angeles subjected to ensembles of 20 ground motions has led to the following conclusions:
1. With increasing number of ‘‘modes’’ included, the height-wise distribution of story drifts and beam plastic rotations estimated by MPA becomes generally similar to the trends noted from nonlinear RHA, indicating that the MPA procedure is able to capture the higher-mode contributions to response.
2. The ‘‘modal’’ combination approximation in the RSA procedure for linearly elastic systems, the standard analytical tool for the structural engineering profession, may lead to significant (15% to 28% in the case of the SAC buildings) underestimation of drift demands. The dispersion in the RSA results is small, ranging from 0.1 to 0.2 depending on the structure and its location, and tends to be essentially uniform over the height of each building.
3. The additional bias introduced by neglecting ‘‘modal’’ coupling in the MPA procedure is small—no more than 5%—unless the building responds well beyond the elastic limit, such as the Los Angeles 20-story building for which the ratio of the peak and yield values of roof displacement are about 7 for a few excitations and the median value exceeds 2.5. The dispersion in the MPA results is much larger for inelastic buildings compared to structures that remain elastic.
4. P-� effects significantly affect the first-‘‘mode’’ pushover curve of the Seattle and Los Angeles buildings. For the Seattle and Los Angeles 9-story buildings P-� effects lead to a small plateau after yielding followed by gradual decay in the lateral capacity and eventually a region of rapid decay in the lateral capacity. For the Los Angeles and Seattle 20-story buildings, the region of rapid decay in the lateral capacity starts immediately following a short plateau after yielding. The region of rapid decay in the lateral capacity starts at roof drifts of about 4.5% for the Seattle 9-story building, 6% for the Los Angeles 9-story building, 1.4% for the Seattle 20-story building, and 1.5% for the Los Angeles 20-story building.
5. P-� effects due to gravity loads further increase the bias in the MPA procedure by 10% to 16% for buildings deformed into the inelastic range, such as Seattle and Los Angeles 9-story buildings. The increase in bias can be much larger (by more than 40%) for buildings that experience drifts that are large enough to cause rapid degradation in lateral capacity, such as Los Angeles 20-story building. The dispersion also increases and tends to be larger in lower stories.
6. The MPA procedure estimates the values of story-drift and beam plastic rotation demands for five of the six SAC buildings considered to a degree of accuracy that is comparable to the standard RSA procedure. Therefore the accuracy of the MPA procedure should be sufficient for most building design and retrofit applications. However, the bias is unacceptably large for buildings that are deformed well into the inelastic range with significant degradation in lateral capacity–such an example is the Los Angeles 20-story building subjected to severe ground motions (2% probability of exceedance in 50 years). For such cases, MPA (and most other pushover analysis procedures) cannot be expected to provide satisfactory estimates of seismic demands, and should be abandoned; nonlinear RHA becomes necessary.
The selected ensemble of ground motions (2% probability of exceedance in 50 years) tested the MPA procedure under most extreme conditions as several of the ground motions deformed the Los Angeles buildings far into the region of significant degradation in lateral capacity. The performance of the MPA procedure was found to be much better for the design level earthquakes (10% probability of exceedance in 50 years); the results are not included for reasons of brevity.
A comparison of the seismic demands computed by MPA, FEMA-356 NSP, and nonlinear RHA procedures led to the following conclusions:
1. The FEMA-356 lateral force distributions lead to gross underestimation (by up to 75% compared to the value from the nonlinear RHA) of story drifts and failed to identify plastic rotations in upper stories compared to the values from
the nonlinear RHA. For such cases, where higher modes contribute significantly to seismic demands, the nonlinear static procedure using FEMA-356 force distributions may not provide useful estimates of seismic demands.
2. The ‘‘Uniform’’ force distribution in FEMA-356 NSP seems unnecessary because it grossly overestimates (by up to 75% compared to the value from nonlinear RHA) drifts and plastic rotations in lower stories and grossly underestimates (by up to 75% compared to the value from nonlinear RHA) them in upper stories. Among the four FEMA-356 lateral load distributions, the ‘‘Uniform’’ distribution always leads to largest story drifts in the lower stories and smallest story drifts in upper stories.
3. The MPA procedure demonstrated its effectiveness over a wide range of responses—from essentially elastic response of Boston buildings to strongly inelastic response of Los Angeles buildings. The resulting estimates of demand were much better than from FEMA force distributions.
4. While FEMA-356 NSP failed to provide accurate estimates of drifts for elastic buildings, the MPA procedure gave accurate (bias no more than 28%) results equivalent to the standard RSA procedure, which is widely available in commercial software used by the profession.
In closing, it is emphasized that the selected buildings exceed the FEMA-356 NSP criterion for significant higher more effects. Therefore FEMA-356 allows NSP to be used for these buildings only in conjunction with the LDP analysis.
ACKNOWLEDGMENTS
This research investigation is funded by the National Science Foundation under Grant CMS-9812531, a part of the U.S.-Japan Cooperative Research in Urban Earthquake Disaster Mitigation. This financial support is gratefully acknowledged. Our research has benefited from discussions with Helmut Krawinkler and C. Allin Cornell of Stanford University; and Chris Poland, Jon Heintz, and Kent Yu of Degenkolb Engineers, Inc. Comments from the anonymous reviewers and especially the responsible editor helped in significantly improving the manuscript.
APPENDIX: PLASTIC ROTATIONS FROM STORY DRIFTS
The rotations of plastic hinges can be estimated from the story drifts by a procedure presented earlier by Gupta and Krawinkler (1999), which (1) estimates the story plastic drift, defined as the total story drift minus the story yield drift, demand; and (2) relates the story plastic drift demand to the beam plastic rotation demand. Note that the procedure presented in this paper is specialized to buildings with no panel zone effects.
The following simplifying assumptions were used in estimating the story yield deformation: (1) inflection points are at mid-heights of columns and mid-spans of beams; (2) story elevation has regular geometry and uniform section properties; (3) yielding occurs only in beams, i.e., columns do not yield, and panel zone effects are ignored; (4) effects of gravity loading on yielding in beams are neglected; (5) second-order effects and lateral deflections due to column axial deformation can be neglected; and (6) dynamic interaction between adjacent stories has little effect on story yield drift.
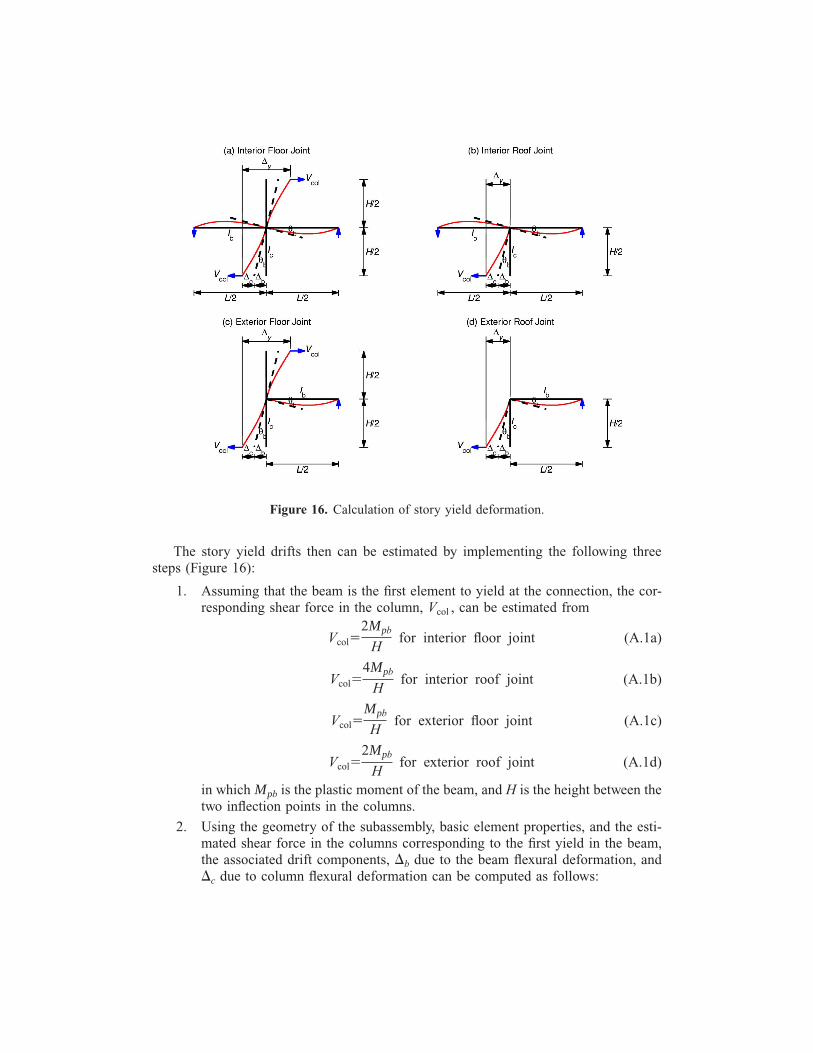
Figure 16. Calculation of story yield deformation.
The story yield drifts then can be estimated by implementing the following three steps (Figure 16):
1. Assuming that the beam is the first element to yield at the connection, the corresponding shear force in the column, Vcol , can be estimated from
Vcol� 2Mpb
H for interior floor joint (A.1a)
Vcol� 4Mpb
H for interior roof joint (A.1b)
Vcol� Mpb
H for exterior floor joint (A.1c)
Vcol� 2Mpb
H for exterior roof joint (A.1d)
in which Mpb is the plastic moment of the beam, and H is the height between the two inflection points in the columns.
2. Using the geometry of the subassembly, basic element properties, and the estimated shear force in the columns corresponding to the first yield in the beam, the associated drift components, �b due to the beam flexural deformation, and �c due to column flexural deformation can be computed as follows:
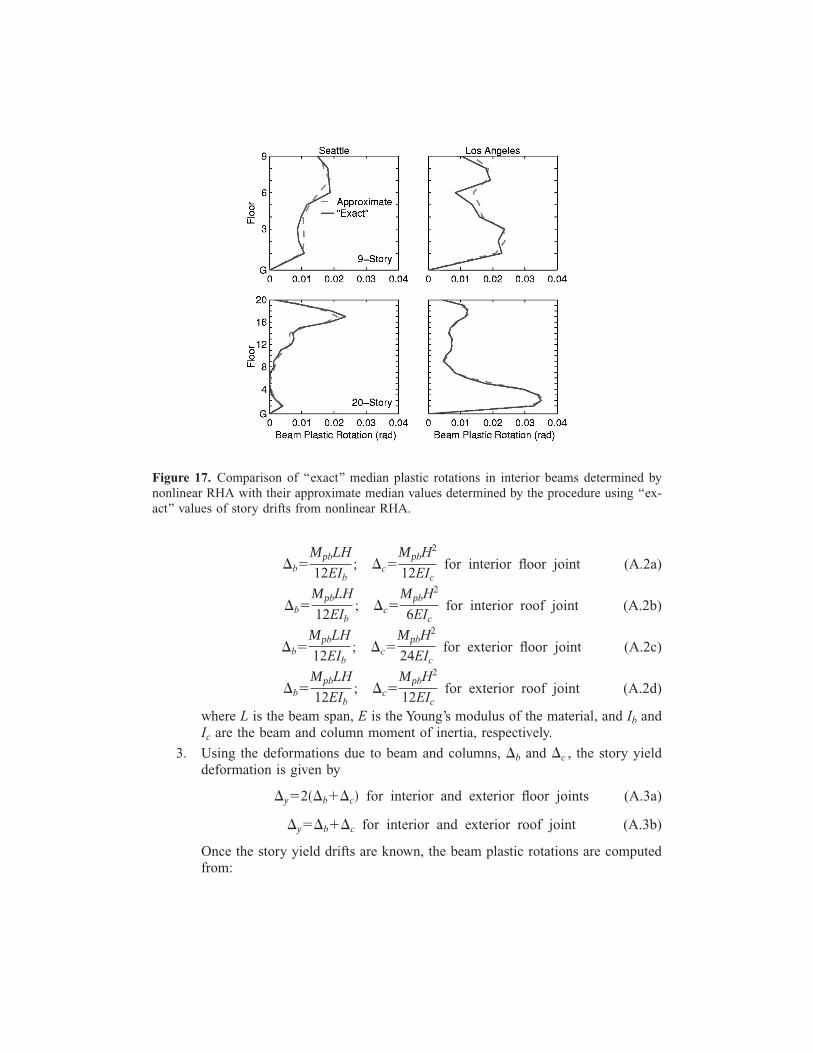
Figure 17. Comparison of ‘‘exact’’ median plastic rotations in interior beams determined by nonlinear RHA with their approximate median values determined by the procedure using ‘‘exact’’ values of story drifts from nonlinear RHA.
�b� MpbLH
12EIb ; �c�
MpbH2
12EIc for interior floor joint (A.2a)
�b� MpbLH
12EIb ; �c�
MpbH2
6EIc for interior roof joint (A.2b)
�b� MpbLH
12EIb ; �c�
MpbH2
24EIc for exterior floor joint (A.2c)
�b� MpbLH
12EIb ; �c�
MpbH2
12EIc for exterior roof joint (A.2d)
where L is the beam span, E is the Young’s modulus of the material, and Ib and Ic are the beam and column moment of inertia, respectively.
3. Using the deformations due to beam and columns, �b and �c , the story yield deformation is given by
�y�2��b��c� for interior and exterior floor joints (A.3a)
�y��b��c for interior and exterior roof joint (A.3b)
Once the story yield drifts are known, the beam plastic rotations are computed from:
����y� �pb� for interior and exterior floor joint (A.4a)
H
2����y� �pb� for interior and exterior roof joint (A.4b)
H
in which � is the story drift.
For computing the beam plastic rotations, the following assumptions can also be used for regular buildings: (1) H is the average of heights above and below a selected floor level, and story height below the roof level; (2) L is average of beam lengths to the right and left of the interior column line, and beam length to the right of the exterior column; (3) Ib is the average moment of inertia of beams to the right and left of the interior column, and of beam to the right of the exterior column; and (4) Ic is the average moment of inertia of columns above and below a selected floor level, and of column below for roof level.
Figure 17 compare approximate values of beam plastic rotations determined by the above described procedure using the story drifts determined by nonlinear RHA and their ‘‘exact’’ values directly from nonlinear RHA. It is evident that this approximate procedure provides very good estimates for beam plastic rotations. This procedure to compute plastic rotations from drifts has been developed with several assumptions, such as no yielding in the columns and midpoint inflection points. Though these are reasonable assumptions for many cases, they are far from reality for certain cases such as Los Angeles 20-story building. Even for this building, this procdure gives excellent estimates of the beam plastic rotations (Figure 17).
REFERENCES
Benjamin, J. R., and Cornell, C. A., 1970. Probability, Statistics, and Decision for Civil Engineers, McGraw-Hill, New York, 684 pp.
Bracci, J. M., Kunnath, S. K., and Reinhorn, A. M., 1997. Seismic performance and retrofit evaluation for reinforced concrete structures, ASCE, J. Struct. Eng. 123 (1), 3–10.
Building Officials and Code Administration International Inc. (BOCA), 1993. National Building Code, 12th Edition, Country Club Hills, IL.
Building Seismic Safety Council (BSSC), 1997. NEHRP Guidelines for the Seismic Rehabilitation of Buildings, FEMA-273, Federal Emergency Management Agency, Washington, D.C.
Building Seismic Safety Council (BSSC), 2000. Prestandard and Commentary for the Seismic Rehabilitation of Buildings, FEMA-356, Federal Emergency Management Agency, Washington, D.C.
Chopra, A. K., 2001. Dynamics of Structures: Theory and Applications to Earthquake Engineering, 2nd Edition, Prentice Hall, Englewood Cliffs, NJ.
Chopra, A. K., and Chintanapakdee, C., 2004. Inelastic deformation ratios for design and evaluation of Structures: Single-degree-of-freedom bilinear systems, J. Struct. Eng., accepted for publication.
Chopra, A. K., and Goel, R. K., 2002. A modal pushover analysis procedure for estimating seismic demands for buildings, Earthquake Eng. Struct. Dyn. 31 (3), 561–582.
Gupta, A., and Krawinkler, H., 1999. Seismic demands for performance evaluation of steel mo
ment resisting frame structures (SAC Task 5.4.3), Report No. 132, John A. Blume Earthq. Engineering Center, Stanford University, Stanford, CA.
Gupta, B., and Kunnath, S. K., 2000. Adaptive spectra-based pushover procedure for seismic evaluation of structures, Earthquake Spectra 16 (2), 367–392.
International Conference of Building Officials (ICBO), 1994. Uniform Building Code, Whittier, CA.
Kunnath, S. K., and Gupta, B., 2000. Validity of deformation demand estimates using nonlinear static procedures, Proceedings, U.S. Japan Workshop on Performance-Based Engineering, Sapporo, Hokkaido, Japan.
Matsumori, T., Otani, S., Shiohara, H., and Kabeyasawa, T., 1999. Earthquake member deformation demands in reinforced concrete frame structures, Proceedings, U.S.-Japan Workshop on Performance-Based Earthquake Engineering, Maui, Hawaii, pp. 79–94.
Miranda, E., 2001. Estimation of inelastic deformation demands of SDOF systems, J. Struct. Eng. 127 (9), 1005–1012.
Paret, T. F., Sasaki, K. K., Eilbekc, D. H., and Freeman, S. A., 1996. Approximate inelastic procedures to identify failure mechanisms from higher mode effects, Proceedings, 11th World Conference on Earthquake Engineering, Paper No. 966, Acapulco, Mexico.
Sasaki, K. K., Freeman, S. A., and Paret, T. F., 1998. Multimode pushover procedure (MMP)—A method to identify the effects of higher modes in a pushover analysis, Proceedings, 6th U.S. National Conference on Earthquake Engineering, Seattle, Washington.
Somerville, P., Smith, N., Punyamurthula, S., and Sun, J., 1997. Development of ground motion time histories for phase 2 of the FEMA/SAC steel project, SAC Background Document Report No. SAC/BD-9/04, SAC Joint Venture, 555 University Ave., Sacramento, CA.