Embed Size (px)
Citation preview

Archived version from NCDOCKS Institutional Repository http://libres.uncg.edu/ir/asu/
A National Survey Of Managed Honey Bee 2012-2013 Annual Colony Losses In The USA: Results From The Bee Informed Partnership
Authors:Nathalie A Steinhauer, Karen Rennich, Michael E Wilson, Dewey M Caron, Eugene J Lengerich, Jeff S Pettis, Robyn
Rose, John A Skinner, David R Tarpy, James T Wilkes and Dennis vanEngelsdorp
AbstractFor the past six years in which overwintering mortality of honey bee colonies has been surveyed in the USA, estimates of colony loss have fluctuated around one-third of the national population. Here we report on the losses for the 2012-2013 seasons. We collected data from 6,482 US beekeepers (6,114 backyard, 233 sideline, and 135 commercial beekeepers) to document overwintering mortality rates of honey bee colonies for the USA. Responding beekeepers reported a total 30.6% (95% CI: 30.16-31.13%) loss of US colonies over the winter, with each beekeeper losing on average 44.8% (95% CI: 43.88-45.66%) of their colonies. Total winter losses varied across states (range: 11.0% to 54.7%). The self-reported level of acceptable winter loss was 14.6%, and 73.2% of the respondents had mortality rates greater than this level. The leading self-identified causes of overwintering mortality were different according to the operation type; backyard beekeepers generally self-identified “manageable” factors (e.g., starvation, weak colony in the fall), while commercial beekeepers generally identified non-manageable factors (e.g., queen failure, pesticides) as the main cause of losses. For the first time in this series of surveys, we estimated mortality during the summer (total loss = 25.3% (95% CI: 24.80-25.74%), average loss = 12.5% (95% CI: 11.92-13.06%)). The entire 12-months period between April 2012 and April 2013 yielded a total loss of 45.2% (95% CI: 44.58-45.75%), and an average loss of 49.4% (95% CI: 48.46-50.43%). While we found that commercial beekeepers lost fewer colonies than backyard beekeepers in the winter (30.2% (95% CI: 26.54-33.93% vs 45.4% (44.46-46.32%) respectively), the situation was reversed in the summer where commercial beekeepers reported higher average losses than backyard beekeepers (21.6% (95% CI: 18.4-24.79%) vs 12.1% (11.46-12.65%)). These findings demonstrate the ongoing difficulties of US beekeepers in maintaining overall colony heath and survival.
Nathalie A Steinhauer, Karen Rennich, Michael E Wilson, Dewey M Caron, Eugene J Lengerich, Jeff S Pettis, Robyn Rose, John A Skinner, David R Tarpy, James T Wilkes and Dennis vanEngelsdorp (2014) "A National Survey Of Managed Honey Bee 2012-2013 Annual Colony Losses In The USA: Results From The Bee Informed Partnership" Journal of Apicultural Research 53(1): 1-18 (2014) Version of Record Available At www.tandfonline.com [DOI 10.3896/IBRA.1.53.1.01]

A National Survey Of Managed Honey Bee
2012-2013 Annual Colony Losses In The USA:
Results From The Bee Informed Partnership
Nathalie A Steinhauer1, Karen Rennich1, Michael E Wilson2, Dewey M Caron3, Eugene J Lengerich4, Jeff
S Pettis5, Robyn Rose6, John A Skinner2, David R Tarpy7, James T Wilkes8 and Dennis vanEngelsdorp1*, for the Bee Informed Partnership
1Department of Entomology, University of Maryland, College Park, MD 20742 USA. 2Department of Entomology and Plant Pathology, University of Tennessee, Knoxville, TN 37996 USA. 3Horticulture Department, Oregon State University, Corvallis, OR 97224, USA. 4Department of Public Health Sciences, Penn State University, Hershey, PA 17033, USA. 5United States Department of Agriculture, Agricultural Research Service, Beltsville, MD 20705, USA. 6United States Department of Agriculture, Animal and Plant Health Inspection Service, Riverdale, MD 20737, USA. 7Department of Entomology, North Carolina State University, Raleigh, NC 27695 USA. 8Department of Computer Science, Appalachian State University, Boone, NC 28608 USA.
Summary
For the past six years in which overwintering mortality of honey bee colonies has been surveyed in the USA, estimates of colony loss have
fluctuated around one-third of the national population. Here we report on the losses for the 2012-2013 seasons. We collected data from 6,482
US beekeepers (6,114 backyard, 233 sideline, and 135 commercial beekeepers) to document overwintering mortality rates of honey bee
colonies for the USA. Responding beekeepers reported a total 30.6% (95% CI: 30.16-31.13%) loss of US colonies over the winter, with each
beekeeper losing on average 44.8% (95% CI: 43.88-45.66%) of their colonies. Total winter losses varied across states (range: 11.0% to
54.7%). The self-reported level of acceptable winter loss was 14.6%, and 73.2% of the respondents had mortality rates greater than this
level. The leading self-identified causes of overwintering mortality were different according to the operation type; backyard beekeepers
generally self-identified “manageable” factors (e.g., starvation, weak colony in the fall), while commercial beekeepers generally identified non-
manageable factors (e.g., queen failure, pesticides) as the main cause of losses. For the first time in this series of surveys, we estimated
mortality during the summer (total loss = 25.3% (95% CI: 24.80-25.74%), average loss = 12.5% (95% CI: 11.92-13.06%)). The entire 12-
months period between April 2012 and April 2013 yielded a total loss of 45.2% (95% CI: 44.58-45.75%), and an average loss of 49.4% (95%
CI: 48.46-50.43%). While we found that commercial beekeepers lost fewer colonies than backyard beekeepers in the winter (30.2% (95% CI:
26.54-33.93% vs 45.4% (44.46-46.32%) respectively), the situation was reversed in the summer where commercial beekeepers reported
higher average losses than backyard beekeepers (21.6% (95% CI: 18.4-24.79%) vs 12.1% (11.46-12.65%)). These findings demonstrate the
ongoing difficulties of US beekeepers in maintaining overall colony heath and survival.
Encuesta nacional anual sobre pérdidas de colonias
manejadas de la abeja de la miel 2012-2013 en EE.UU.:
resultados de la Asociación Abeja Informada
Resumen
Durante los últimos 6 años en los que la mortalidad invernal de colonias de abejas de la miel ha sido monitoreada en los EE.UU., las
estimaciones de pérdida de colonias han fluctuado en torno a un tercio de la población nacional. Aquí informamos sobre las pérdidas para las
temporadas 2012-2013. Se recogieron datos de 6,482 apicultores de Estados Unidos (6,114 tradicionales, 233 como negocio complementario,

y 135 apicultores comerciales) para documentar las tasas de mortalidad invernal de colonias de abejas de la miel en los Estados Unidos . Los
apicultores que respondieron reportaron una pérdida del 30.6% (IC del 95%: 30.16-31.13%) de colonias de EE.UU. durante el invierno, con
un promedio de pérdidas del 44.8% de colonias por apicultor (IC del 95%: 43.88-45.66%). Las pérdidas totales de invierno varían entre
estados (rango: 11.0% al 54.7%). El nivel de pérdidas inviernales reportado por los propios apicultores como aceptable fue de 14.6%, y 73.2%
de los encuestados tenían tasas de mortalidad superiores a este nivel. Las causas principales identificados por los propios apicultores de
mortalidad de hibernación fueron diferentes según el tipo de apicultura; apicultores tradicionales generalmente identificaron factores "
manejables " (por ejemplo, el hambre, debilidad de las colonias en otoño), mientras que los apicultores comerciales generalmente
identificaron factores no controlables (por ejemplo, problemas con la reina, pesticidas) como la causa principal de las pérdidas. Por primera
vez en esta serie de encuestas, se estima la mortalidad durante el verano (pérdida total= 25.3% (IC del 95%: 24.80 a 25.74%), pérdida
media = 12.5% (IC del 95%: 11.92 a 13.06%)). Todo el período de 12 meses entre abril de 2012 y abril de 2013 arrojó una pérdida total del
45.2% (IC del 9 %: 44.58 a 45.75%), y una pérdida promedio de 49.4% (IC del 95%: 48.46 a 50.43%). Si bien hemos encontrado que los
apicultores comerciales perdieron menos colonias que los apicultores tradicionales durante el invierno (30.2% (IC del 95%: 26.54 a 33.93%
frente a 45.4% (44.46-46.32%), respectivamente), la situación se invirtió en el verano donde los apicultores comerciales reportaron pérdidas
promedio más altas que los apicultores tradicionales (21.6% (IC 95%: 18.4 a 24.79%) frente a 12.1% (11.46-12.65%)). Estos hallazgos
demuestran las dificultades actuales de los apicultores de Estados Unidos en el mantenimiento de la salud general de las colonias y su
supervivencia.
Introduction
The global population of honey bee (Apis mellifera) colonies has
shown a 64% increase between 1961 and 2007 (Aizen et al., 2009),
but not all regions have shown this expansion. For example, during
the same period, both Europe (-26.5%) and North America (-49.5%)
experienced severe reductions in their total number of managed
colonies (Aizen et al., 2009). In the USA, managed colony numbers
have declined by 61% from 1947 to 2008 (vanEngelsdorp & Meixner,
2010). A reduction in colonies is of concern because honey bees provide
vital pollination services to agricultural crops. In the US, the value
attributed to honey bees from crops directly dependent upon pollination
has been was estimated at $11.68 billion by 2009 (Calderone, 2012).
Although global crop yields have not yet been affected by pollinator
decline (Aizen et al., 2008), the last 50 years of agriculture have been
marked by a shift toward more pollinator-dependent crops (Aizen et al.,
2008) that could soon exceed the pollination services provided by
declining pollinator stocks (Aizen & Harder, 2009; Calderone, 2012).
Efficient pollination has already been documented as a limiting factor
for some crops at regional or local levels (Klein et al., 2007; Garibaldi
et al., 2009).
The suspected factors behind this population decline are both
biologic (Potts et al., 2010b; vanEngelsdorp & Meixner, 2010) and
socio-economic (Potts et al., 2010a; vanEngelsdorp & Meixner, 2010).
While longitudinal estimates of honey bee colony populations can help
predict shortages or surpluses of pollination service, they do not fully
capture the year-to-year mortality rates. Beekeepers can replace lost
colonies by either dividing surviving colonies (‘splitting’) or creating
new colonies (installing ‘packages’ of bees or nucs (nucleus colonies))
purchased from other beekeepers (vanEngelsdorp et al., 2007). Over-
wintering losses have been proposed as a more direct indicator of
honey bee health (vanEngelsdorp et al., 2007; van der Zee et al., 2012).
For the past six years, overwintering mortality of honey bee colonies
have been surveyed in the US, estimating total overwintering losses as
32%, 36%, 29%, 34%, 30% and 22% for the winters of 2006-7,
2007-8, 2008-9, 2009-10, 2010-11 and 2011-12, respectively
(vanEngelsdorp et al., 2007, 2008, 2010, 2011a, 2012; Spleen et al.,
2013). High overwintering mortality rates of honey bee colonies have
also been reported in many other countries, mostly in Europe, but also
in the Middle East, Africa, and Asia (Neumann & Carreck, 2010; Nguyen
et al., 2010; van der Zee et al., 2012, Pirk et al., 2014). The underlying
factors responsible for this mortality are unclear. There is, however, a
general consensus that the causes of colony mortality are multi-factorial
and interacting (Potts et al., 2010b; USDA, 2002). When asking bee-
keepers to self-identify the reasons their colonies died, the most
commonly reported factors have been queen failure, starvation,
parasitic varroa mites (Varroa destructor), and weak colonies in the
fall (vanEngelsdorp et al., 2007, 2008, 2010, 2011a, 2012; Spleen et
al., 2013). This is suggestive of the wide range of causes that can
contribute to colony death, some of them resulting directly from bee-
keeping management strategies (vanEngelsdorp et al., 2012).
Continuing the series of winter loss papers produced by the Bee
Informed Partnership (www.beeinformed.org), this study documents
the 2012-2013 mortality rate of honey bee colonies for the US at
national and state levels. We also compare rate of loss between varying
sized operations, beekeeping activity, and by the symptom of having
“no dead bees found in the hive.” This study further quantifies the
prevalence of self-reported suspected causes of death from the bee-
keepers. For the first time, we additionally present estimates of summer,
and annual (year-long) losses.

Material and methods
A combined 2012-2013 winter loss and management survey was
posted on an internet platform (SelectSurvey.com) and an invitation
to participate in the survey was sent by email to national (n = 2), state
(n = 47), and local (n = 466) beekeeping organizations. Invitations
were also distributed through a beekeeping supply company’s email
list (Brushy Mountain Bee Farm) and through honey bee brokers (n = 20;
for almond pollination in California). Advertisements were published in
two beekeeping journals; American Bee Journal and Bee Culture, who
forwarded the invitation to their subscription listservs (Catch the Buzz
and ABF Alert). Previous years’ participants that had requested to be
included in future surveys and individuals who indicated their wish to
be contacted (by signing up on the beeinformed.org web site or at
talks and meetings) received the invitation by email (n = 5,662). To
increase recruitment, announcements were posted on web-forums and
on social media websites (e.g., Facebook). All solicitations
encouraged the recipient to forward the request to other beekeepers.
Personal letters were also sent to the Apiary Inspectors of America
(AIA), a majority of state extension apiculturists, club newsletters, and
industry leaders.
Because our previous surveys showed a shortfall in the
representation of commercial beekeepers, a more targeted strategy
was used to increase large-scale beekeeper’s participation. Paper
versions of the survey (n = 1,300) were mailed to large commercial
beekeepers directly or through their state apiarists. At their request,
we also extended the survey time by two weeks compared to previous
years. Our recruitment method prevents us from calculating a response
rate, as the total number of beekeepers contacted is unknown.
All the data analysed in this study were gathered through 18
questions (Box 1). To ensure consistency with other international
estimates, core survey questions (1 to 13) were derived from the
efforts of Working Group 1 of the international honey bee research
network COLOSS (prevention of honey bee COlony LOSSes) (van der
Zee, 2013). After answering this traditional “winter loss survey”,
participants were offered an optional survey (“management survey”)
from which this study estimates summer and annual losses.
The online survey was open from 29 March to 30 April 2013. The
paper versions were distributed through mail on 13 March and all the
completed surveys sent back before 30 April were integrated into the
survey database.
The database was then edited for processing (i.e., replacing text
with numbers – 2 instead of “two”) where appropriate, and filters were
developed to exclude invalid responses from the analytical dataset. All
obvious duplicate answers, all non-US entries (information from Survey
Question 1), those with insufficient answers to calculate a valid winter
Box 1: Questions as presented to the participating beekeepers and associated validation rules. Questions 1-13 are consistent to the survey
questions developed by COLOSS. Participants who accepted to continue to the second part of the survey were presented with questions 14-18
(among others). The * indicates required questions that would not allow a blank response on the online survey.
Box 1: The survey questions
The following questions pertain to any losses you may have suffered over the winter (defined as the period between Oct 1 2012 and April 1 2013).
1. In what state(s) did you keep your colonies in between April 2012 - April 2013?*
Multiple choice question, multiple selection allowed.
Possible answers presented all US States, the District of Columbia, Puerto Rico and an “other” category to specify in open entry.
2. How many living colonies did you have on October 1, 2012?*
A colony is a queen right unit of bees that include full size colonies and queen right nucs (do NOT include mating nucs).
Numeric entry (positive integers).
3. How many splits, increases, and / or colonies did you make / buy between October 1, 2012 and April 1, 2013?*
(increases surviving on April 1, 2013 should have been included in the total provided in the question above.)
Numeric entry (positive integers).
4. How many splits, increases, and / or colonies did you sell / give away between October 1, 2012 and April 1, 2013?*
Numeric entry (positive integers).
5. How many living colonies did you have on April 1, 2013?*
A colony is a queen right unit of bees that include full size colonies and queen right nucs (do NOT include mating nucs).
Numeric entry (positive integers).
6. Is this year's winter loss higher or lower than last year?
Higher
Lower
Same
Don’t Know
Did not keep bees last year
Multiple choice, single selection allowed.
7. What percentage of the colonies that died between October 1st and April 1st were lost without dead bees in the hive or apiary?
Percentage: The value must be between 0 and 100, inclusive.
8. What percentage of loss, over this time period, would you consider acceptable?
Percentage: The value must be between 0 and 100, inclusive.
Box 1 Cont’d: Questions as presented to the participating beekeepers and associated validation rules. Questions 1-13 are consistent to the
survey questions developed by COLOSS. Participants who accepted to continue to the second part of the survey were presented with questions
14-18 (among others). The * indicates required questions that would not allow a blank response on the online survey.
or summer loss (between 0 and 100%), and obvious typing errors
(e.g., number of colonies either non-integer or exceedingly large
>80,000) were excluded from our analyses.
As in previous studies, beekeepers were assigned to 3 levels of
operational size groups according to the number of colonies managed
on 1 October 2012: beekeepers managing 50 or fewer colonies are
referred hereafter and in the analyses as “backyard beekeepers”;
those managing between 51 and 500 colonies as “sideline beekeepers”;
and those managing 501 or more as “commercial beekeepers”.
Statistical analyses
Based on the numbers provided by the respondents, we calculated
total and average colony losses, following the standard outlined by
vanEngelsdorp et al. (2013a). Each beekeeper manages one operation,
which may or may not be divided into several apiaries, comprised of
various numbers of colonies. For each respondent, his or her individual
operational overwintering loss was calculated using equation 1:
Equation 1:
Operational Winter Losses
Where the number of colonies on 1 October 2012 was provided by
survey question #2; the number of increases between October 2012
and April 2013 by question #3; the number of reductions during the
same period by question #4 and finally the number of colonies managed
9. In your opinion, what factors were the main cause (or causes) of colony death in your operation between October 1, 2012 and April 1, 2013? Select all that apply.
Queen failure
Starvation
Varroa mites
Nosema disease
Small Hive Beetles
Poor wintering conditions
Pesticides
Weak in the fall
Colony Collapse Disorder (CCD)
Don’t know
Other, please specify:
Multiple choice question, multiple selection allowed.
10. What percentage of your hives did you send to or move into California almond orchards for pollination?
Percentage: The value must be between 0 and 100, inclusive.
11. How many times, on average, did you move your colonies last year?
Numeric entry (positive integers)
12. In what zip code is your operation based (optional)?
13. Would you be willing to be contacted by our survey team in order to participate in other honey bee related surveys and review this survey?
Yes
No
Multiple choice, single selection allowed
End of Winter Loss Survey
(…)
14. What was the largest number of living colonies you owned between April 1, 2012 and April 1, 2013?
A colony is a queen right unit of bees that include full size colonies and queen right nucs (do NOT include mating nucs).
Numeric entry (positive integers).
15. What was the smallest number of living colonies you owned between April 1, 2012 and April 1, 2013?
A colony is a queen right unit of bees that include full size colonies and queen right nucs (do NOT include mating nucs).
Numeric entry (positive integers).
16. How many living colonies did you have last spring (on April 1, 2012)?*
A colony is a queen right unit of bees that include full size colonies and queen right nucs (do NOT include mating nucs).
Numeric entry (positive integers).
17. How many splits, increases, and / or colonies did you make / buy between April 1, 2012 and October 1, 2012?*
“Increases” include successfully hived swarms and/or feral colonies. A colony is a queen right unit of bees that include full size colonies and queen right
nucs (do NOT include mating nucs).
Numeric entry (positive integers).
18. How many splits, increases, and / or colonies did you sell or give away between April 1, 2012 and October 1, 2012?*
A colony is a queen right unit of bees that include full size colonies and queen right nucs (do NOT include mating nucs).
Numeric entry (positive integers).

on 1 April 2013 by question #5. The numerator of this quotient is also
referred to as the number of colonies ‘lost’ and the denominator as
the number of colonies ‘at risk’ over the winter period.
From there, the total overwintering colony loss (TWL) of the
population of concern was calculated as the quotient of the total number
of colonies lost and colonies at risk in that population (Equation 2)
while the average colony losses (AWL) was calculated as the mean of
the individual operational overwintering loss (obtained from Equation
1) of all beekeepers in the population (Equation 3).
Equation 2:
Equation 3:
For the first time in this series of surveys, we also calculated and
report summer and annual losses. For each respondent, his/her individual
operational summer (Equation 4) and annual loss (Equation 5) were
calculated. Equation 4:
Operational Summer Losses
Equation 5:
Operational Annual Losses
Where the number of colonies on 1 April 2012 was provided by survey
question #16 and the number of increases and reductions that pertain
to the relevant period: by question #17 for the number of increases
between April 2012 and October 2012 for the calculation of summer
loss and by the sum of question # 3 and # 17 for the number of
increases during the whole year for annual loss. Similarly, the relevant
number of reductions was provided by question #18 for summer loss
and by the sum of question #4 and #18 for annual loss.
The total colony loss (for winter TWL, summer TSL, and annual
TAL) corresponds to the accepted method for averaging proportions,
but in our case it is highly influenced by the responses of commercial
beekeepers who manage a disproportionate number of colonies in the
US. It is, however, a more appropriate representation of the total loss
experienced in an area.
The mean of the individual losses method used to calculate average
colony loss (for winter AWL, summer ASL, and annual AAL) gives
each beekeeper the same weight, independently of the size of its
operation, providing more relevance when comparing sub-groups of
beekeepers. Given the non-independence of colonies managed by the
same beekeeper, averaging out the pseudo-replication is an accepted
method for dealing with this kind of spatial pseudo-replication
(Crawley, 2007). One disadvantage of this is that smaller operations
can only have a limited number of loss outcomes and have a higher
chance of zero or 100% loss than larger operations (vanEngelsdorp
et al., 2011b).
Therefore, we calculated total loss (TL) for national and regional
losses, while average colony loss (AL) was used to contrast sub-groups
of beekeepers, using the Kruskal-Wallis rank sum test and its follow-up
Mann-Whitney U test (also called Wilcoxon Rank Sum test). Those
tests compare two (or more) vectors of numeric data for a difference
in their medians, without assuming normal distributions, but assuming
that the vectors share an identically shaped distribution.
The 95% confidence intervals (95% CI) for total loss (TL) were
calculated using the standard outlined by vanEngelsdorp et al. (2013a)
using a glm model (of family quasibinomial) to account for the structure
of the data (R Development Core Team, 2009; code provided by Y
Brostaux and B K Nguyen). The confidence intervals for average loss
(AL) were calculated using the general Wald formula (vanEngelsdorp
et al., 2013a). The Wald formula is a normal approximation interval
which is appropriate given the large sample size.
For the calculation of the number of colonies managed in each
state, colonies belonging to beekeepers reporting managed colonies in
more than one state were counted in each of those selected states,
according to the practice used by the USDA National Agricultural
Statistics Service (NASS) for their calculation of the state-level number
of honey-producing colonies (USDA-NASS, 2013). The percentage of
colonies lost with the symptom of “no dead bees in the hive or apiary”
(survey Question #7) was used to calculate the total number of colonies
lost with that symptom after multiplication with the reported number
of lost colonies. The ratios of beekeepers grouped by operation size
who suffered losses with the symptom of “no dead bees in the hive or
apiary” were compared using the Chi square test.
All analyses were performed using the statistical program R
(version 3.0.1 (2013-05-16)). All statistical tests were two-sided and
used a level of significance of α = 0.05. Responses for any group
containing fewer than five respondents were not published to protect
the privacy of the respondents.
Results
National losses
Average and total losses
The survey recorded 6,876 responses, from which 200 duplicates and
55 non-US residents were removed. From there, 3 subsets were created.
The winter loss subset was reduced by an additional 139 responses
for missing or invalid information needed for the calculation of winter
loss (numbers leading to a negative or over 100% loss, zero colonies

Table 1. Self-reported 2012-2013 US colony loss (total and average loss (%) [95% CI]), showing the sample size (n) as the number of bee-
keepers having provided valid responses for each period of interest, the total number of colonies at the start of the respective period, the
number of increases (+) and decreases (-) and the total number of colonies at the start of the respective period. Summer Loss represents loss
between April 1, 2012 and October 1, 2012; Winter Loss between October 1, 2012 and April 1, 2013; and Annual Loss between April 1, 2012
and April 1, 2013.
Period
n
Total number of colonies managed on:
04/01/2012 10/01/2012
04/01/2013
Total Loss (%)
Average Loss (%)
Summer Loss 4,181 509,038 (+234,454)
537,694 (-23,979)
. 25.3
[24.8-25.74] 12.5
[11.91-13.06]
Winter Loss 6,482 . 635,971 (+145,584) (-30,437)
520,965 30.6
[30.16-31.13] 44.8
[43.88-45.67]
Annual Loss 4,429 520,168 (+238,020)
555,454 (-27,973)
(+122,529) (-24,705)
454,072 45.2
[44.58-45.75] 49.4
[48.45-50.43]
at the start of the period or an obvious typing error). All analyses
regarding winter loss were performed on the remaining 6,482 valid
respondents. Similarly, two other subsets of responses were created
by filtering out 2,440 responses for missing or invalid information needed
for the calculation of summer loss and 2,192 responses for annual loss,
leaving an analytical sample size of 4,181 for summer loss and 4,429
for annual loss.
On 1 October 2012, those 6,482 respondents managed a total of
635,971 living colonies, representing 25.5% of the estimated 2.491
million honey-producing colonies managed in the US in 2012 (USDA-
NASS, 2013). The same 6,482 beekeepers reported managing 520,965
colonies on 1 April 2013, after having made or bought a total of 145,581
colonies and having sold a total of 30,437 colonies. According to those
numbers, we calculated a total overwintering loss of 30.6% (TWL; 95%
CI: 30.16-31.13%) of the US managed honey bee colonies, while
individual respondent beekeepers lost on average 44.8% (AWL; 95%
CI: 43.88-45.66%) of their colonies over the winter 2012-2013 (see
Table 1). Approximately 24% (99.1% of which were backyard bee-
keepers) reported no (zero) overwintering colony loss. We also asked
beekeepers to directly compare their winter losses to the previous
year (Question 6). Of the 6,193 beekeepers who responded to this
Question, 1,123 did not keep bees the previous year. Of the remaining
beekeepers who did keep bees the previous year, 52.3% (n = 2,651)
indicated that they lost more colonies over the 2012-2013 winter than
the previous year.
The 4,181 beekeepers who provided valid responses for the
calculation of loss between 1 April 2012 and 1 October 2012 (hereafter
referred to as “summer” loss) managed a total of 509,038 colonies at
the start of the period, increased their operation by adding a total of
234,454 colonies, and sold a total of 23,979 during the same period.
At the end of the period, on 1 October 2012, they managed a total of
537,694 colonies, leading to a total summer loss of 25.3% (TSL; 95%
CI: 24.80-25.74%) of the US managed honey bee colonies while
individual respondent beekeepers lost on average 12.5% (ASL; 96% CI:
11.91-13.06%) of their colonies over the summer 2012 (see Table 1).
More than 58% of the respondents reported no (zero) summer colony
loss.
Beekeepers (n = 429) who provided valid responses toward an
annual loss calculation managed a total of 520,168 colonies on 1 April
2012. These beekeepers increased their operations during that year by
a total of 360,549 colonies and sold a total of 52,678 colonies over
the course of the year. On 1 April 2013, these beekeepers reported
that they managed a total of 454,072 colonies. We calculated a total
annual loss of 45.2% (TAL; 95% CI: 44.5-45.75%) of the US managed
honey bee colonies. On average, individual respondent beekeepers
lost 49.4% (AAL; 95% CI: 48.46-50.43%) of their colonies over the one
year period between April 1, 2012 and April 1, 2013 (see Table 1).
Less than 16% of the respondents reported no (zero) annual colony
loss.
Losses by operation type
The differences between total and average loss are explained by the
difference in operation size from our respondents. Looking at the
winter loss dataset (see Table 2), of the 6,482 participating beekeepers,
94.3% (n = 6,114) qualified as “backyard beekeepers”, 3.6% (n = 233)
as “sideline beekeepers” and 2.1% (n = 135) as “commercial bee-
keepers”. However, each of those operation types managed a total of
39,414 (6.2%), 35,937 (5.6%), and 560,620 (88.2%) colonies,
respectively, on 1 October 2012. Therefore, more than 88% of the
colonies represented in our study were managed by approximately 2%
of the respondents.
The 3 operation types differed significantly in their levels of
seasonal losses (Kruskall-Wallis rank sum test: χ2 = 124.5253; 18.5757
and 15.881 for ASL, AWL and AAL, respectively, between Operation
Types; all df = 2, all p-value < 0.001; see Fig.1 and Table 2 for loss
estimates for each category). For all operation types, the winter period
brought about a higher mortality than the preceding summer (Mann
Whitney U test: U = 5765637, p-value < 0.001 for backyard beekeepers;
U = 9128, p-value < 0.001 for sideline beekeepers and U = 5489.5,
p-value < 0.05 for commercial beekeepers; see Table 2 for loss
estimates). Where commercial beekeepers lost, on average, fewer
colonies than backyard beekeepers over the winter (U = 487737,
p-value < 0.001, see Table 3) (AWL 30.2% for commercial vs. 45.3%
for backyard beekeepers, see Table 2), this was reversed in the summer,

Table 2. Self-reported 2012-2013 US colony loss by operation type (total and average loss (%) [95% CI]), showing the sample size (n) as the
number of beekeepers having provided valid responses for each period of interest, the total (#Colonies (start)) and proportional (% Colonies
(start) (%)) number of colonies at the start of the respective period for each of the operation type categories: backyard beekeepers (50 colonies),
sideline beekeepers (>50 and 500 colonies) and commercial beekeepers (>500 colonies).
Operation Type n # Colonies
(start) % Colonies (start) (%)
Total Loss Average Loss
Summer Loss
Backyard 3,936 21,066 4.14 14.8 [14.22-15.37] 12.1 [11.46-12.65]
Sideline 141 23,204 4.56 18.3 [15.78-20.97] 17.8 [14.96-20.54]
Commercial 104 464,768 91.30 26.3 [23.42-29.24] 21.6 [18.4-24.79]
Winter Loss
Backyard 6,114 39,414 6.20 42.7 [41.96-43.53] 45.4 [44.46-46.32]
Sideline 233 35,937 5.65 35.6 [32.44-38.85] 36.9 [33.56-40.26]
Commercial 135 560,620 88.15 29.6 [26.54-32.71] 30.2 [26.54-33.93]
Annual Loss
Backyard 4,164 22,924 4.41 49.6 [48.75-50.5] 49.9 [48.91-50.98]
Sideline 156 25,218 4.85 45.3 [41.55-49] 42.7 [38.7-46.76]
Commercial 109 472,026 90.74 44.9 [41.36-48.49] 40.1 [36.17-44.04]
Table 3. Comparison of average seasonal colony loss (ASL, AWL and AAL) among operation types, showing the value of the statistical tests
(Mann-Whitney “U”, or Wilcoxon Rank Sum test with continuity correction) and the associated p-value. The “*” indicates significance (α = 0.05).
Operation Type n Operation Type n U p-value
Summer Loss
Backyard 3936 vs. Sideline 141 177880 < 0.0001 *
Backyard 3936 vs. Commercial 104 122055 < 0.0001 *
Sideline 141 vs. Commercial 104 6143.5 0.03003 *
Winter Loss
Backyard 6114 vs. Sideline 233 776077 0.01867 *
Backyard 6114 vs. Commercial 135 487737 0.0002473 *
Sideline 233 vs. Commercial 135 17853 0.03071 *
Annual Loss
Backyard 4164 vs. Sideline 156 365968 0.006803 *
Backyard 4164 vs. Commercial 109 264999 0.002615 *
Sideline 156 vs. Commercial 109 8773.5 0.6589
where commercial beekeepers experienced higher average mortality
rate than backyard beekeepers (U = 122055, p-value < 0.001, see
Table 3) (ASL 21.6% for commercial vs. 12.1% for backyard beekeepers,
see Table 2).
Looking only at commercial and sideline beekeepers, we did not
detect a difference between average winter loss (AWL) of beekeepers
who indicated they moved at least part of their colonies to California
almond orchards for pollination in 2012 and those who did not (see
Table 4), nor between those who indicated that they moved their
colonies at least once during the last year (“migratory”) and those who
did not (see Table 4).
Fig. 1. Average seasonal colony loss by operation type for summer
2012, winter 2012-2013, and for the complete annual period from
April 2012 to April 2013. Bars represent 95% CI.
Reported cause of overwintering loss
Of the 4,680 beekeepers who experienced at least some loss and
answered Question #7, 38.8% (n = 1,816) answered that at least some
of their colonies died without visible dead bees in the hive or the apiary.
Those beekeepers experienced a significantly higher average winter
loss than beekeepers who did not report this symptom, whether we
looked at the overall population (U = 2806325, p-value < 0.01) or by
specific operation types (U = 2472222, 5976, and 1369 respectively;
all p-values < 0.05; see Table 5). Of the 230,153 colonies lost during

Table 4. Comparison of average winter colony loss (AWL (%) [95%CI]) between sub-groups based on activities (for commercial and sideline
beekeepers), showing the value of the statistical test (Mann-Whitney “U”, or Wilcoxon Rank Sum test with continuity correction) and the
associate p-value. Beekeepers are considered to be present for almond pollination in California if they indicated that they rented at least part
of their operation when asked Question 10 of the survey. Beekeepers are considered “migratory” if they indicated at least 1 move during the
year in Question 11 of the survey. We considered only commercial and sideline beekeepers for those 2 questions.
Factor Selection n AWL (%) [95%CI] U p-value
Almond pollination (CA) Yes
No
126
223
32.04 [28.43-35.65]
36.35 [32.8-39.91]
13370
0.4535
Migratory Yes
No
238
108
33.81 [30.76-36.87]
35.08 [30.13-40.03]
12733.5
0.8911
Table 5. Average winter colony loss (AWL (%) [95%CI]) by CCD symptom and operation type, showing the value of the statistical test (Mann
-Whitney “U”, or Wilcoxon Rank Sum test with continuity correction) and the associated p-value. Presence of CCD symptom was attributed to
the beekeepers who reported that at least part of their dead colonies did not show any dead bees in the hive or in the apiary. The “*” indicates
significance (α = 0.05).
Operation Type CCD symptom n AWL (%) [95%CI] U p-value
All Present
Absent
1816
2864
61.58 [60.22-62.93]
57.41 [56.27-58.55]
2806325
< 0.0001
*
Backyard Present
Absent
1582
2773
65.09 [63.67-66.5]
58.33 [57.18-59.48]
2472222
< 0.0001
*
Sideline Present
Absent
133
72
41.03 [36.92-45.14]
31.54 [25.45-37.63]
5976
0.003402
*
Commercial Present
Absent
101
19
33.63 [29.59-37.68]
21.56 [10.98-32.14]
1369
0.003279
*
Table 6. Average winter colony loss (AWL (%) [95%CI]) by self-reported cause of death, showing the value of the statistical test (Mann-
Whitney “U”, or Wilcoxon Rank Sum test with continuity correction) and the associated p-value. Contrasts between groups of beekeepers
having selected or not the respective factor as main cause of death for their reported winter losses. The “*” indicates a significant (α = 0.05)
difference between the 2 sub-groups.
Factor
n
Factor selected
AWL [95%CI]
n
Factor not selected
AWL (%) [95%CI]
U
p-value
Weak in the fall 1,516 56.13 [54.62-57.64] 3,165 60.58 [59.50-61.65] 2197083 < 0.0001 *
Starvation 1,406 55.4 [53.86-56.94] 3,275 60.74 [59.68-61.8] 2078126 < 0.0001 *
Queen Failure 1,199 51.1 [49.41-52.8] 3,482 61.90 [60.89-62.91] 1662428 < 0.0001 *
Varroa 1,082 57.41 [55.65-59.17] 3,599 59.65 [58.64-60.66] 1867732 0.03989 *
Poor Winter 850 65.26 [63.31-67.22] 3,831 57.78 [56.8-58.75] 1857328 < 0.0001 *
CCD 507 67.36 [65-69.73] 4,174 58.14 [57.2-59.07] 1241739 < 0.0001 *
Pesticides 379 63.02 [60.17-65.86] 4,302 58.79 [57.87-59.71] 877497 0.01267 *
SHB 299 59.94 [56.59-63.29] 4,382 59.08 [58.17-59.99] 667709.5 0.5736
Nosema 298 54.33 [51.24-57.43] 4,383 59.46 [58.55-60.37] 593141 0.007354 *
Don't know 1,344 68.01 [66.48-69.54] 3,337 55.56 [54.52-56.60] 2769497 < 0.0001 *
the winter, an estimated 51.3% (n = 117,960) died with the symptom
“no dead bees in the hive or apiary”. When reporting loss, commercial
beekeepers were 2.32- and 1.30-times as likely to report this symptom
as were backyard and sideline beekeepers (χ2 = 113.9, df = 1, p-value
< 0.001 and χ2 = 13.97, df = 1, p-value < 0.001, respectively).
Of the 4,892 respondents who reported a winter loss, 95.7% (n =
4,681) recorded at least one answer to Question # 9 relating to self-
reported main cause of colony death overwinter. Respondents could
select multiple answers. Of the 4,681 respondents, 28.7% (n = 1,344)
indicated that they did not know the cause of death of the colonies
that died in their operation (see Table 6). Those beekeepers lost over
the winter, on average, 68% of their colonies (see Table 6); significantly
more than those who lost colonies and identified at least one reason
for their loss (AWL = 55.6%, U = 2769497, p-value < 0.001, see
Table 6).
Overall, the most frequently self-reported causes of death included:
colony weak in the fall, starvation, queen failure, and varroa mites
(see Table 6). This list is highly biased towards backyard beekeeper’s

Fig. 2. Frequency of self reported cause of colony death by operation type. Shows the frequency of selection from beekeepers of each factor
as a main cause of death for colonies that died in their apiaries over the winter.
responses. When accounted separately, commercial beekeepers have
a contrasting list of “top” self-reported cause of death (see Fig. 2):
their most frequently self-reported causes of death included queen
failure, varroa mites, pesticides, and Colony Collapse Disorder (CCD).
Survey respondents who selected poor wintering conditions, CCD,
or pesticides as a main cause of winter colony loss suffered significantly
higher losses on average than respondents who did not select these
items (U = 1857328, 1241739, and 877497, respectively; all p-values
< 0.05; see Table 6). Conversely, beekeepers who selected weak in
the fall, starvation, queen failure, varroa mites, or nosema (Nosema
apis or Nosema ceranae) as a factor contributing to their winter colony
loss experienced significantly lower losses on average than respondents
who did not select those factors (U = 2197083, 2078126, 1662428,
1867732, and 593141, respectively; all p-values < 0.05; see Table 6).
Acceptable overwintering losses
For the question “What percentage of loss, over this time period, would
you consider acceptable?”, responding beekeepers (n = 5,876) reported
on average that they would consider a winter loss of 14.6% (95% CI:
14.21-15.09) to be acceptable. The answer provided was very similar
Fig. 3. Total summer colony loss (%) by state. Respondents who managed colonies in more than one state had all of their colonies counted in
each state in which they reported managing colonies. Data for states with fewer than five respondents are withheld.

Fig. 4. Average summer colony loss (%) by state. Respondents who managed colonies in more than one state had all of their colonies counted
in each state in which they reported managing colonies. Data for states with fewer than five respondents are withheld.
across operation types (backyard beekeepers: n = 5,533 reported
14.6% (95% CI: 14.15-15.08); sideline beekeepers: n = 216 reported
15.0% (13.59-16.36) and commercial beekeepers: n = 127 reported
15.7% (95% CI: 13.66-17.8 )). 73.2% (n = 4,300) of the responding
beekeepers suffered losses higher than this average acceptability level.
When compared to their individual acceptable level, 70.2% (n = 4,122)
of the beekeepers experienced winter loss above the level they judge
acceptable.
State losses
The number of respondents to the survey was highly variable across
states (see Table 7, number of operations). The total and average
seasonal losses calculated from beekeepers’ reports also varied sub-
stantially across states. The total winter loss (TWL) experienced by a
state ranged from 11.0% to 54.7% with a median of 27.0% (see
Table 7 and Fig. 5), while total summer loss at the state level ranged
from 4.0% to 59.8% with a median of 20.0% (see Table 7 and Fig. 3).
Fig. 5. Total winter colony loss (%) by state. Respondents who managed colonies in more than one state had all of their colonies counted in
each state in which they reported managing colonies. Data for states with fewer than five respondents are withheld.
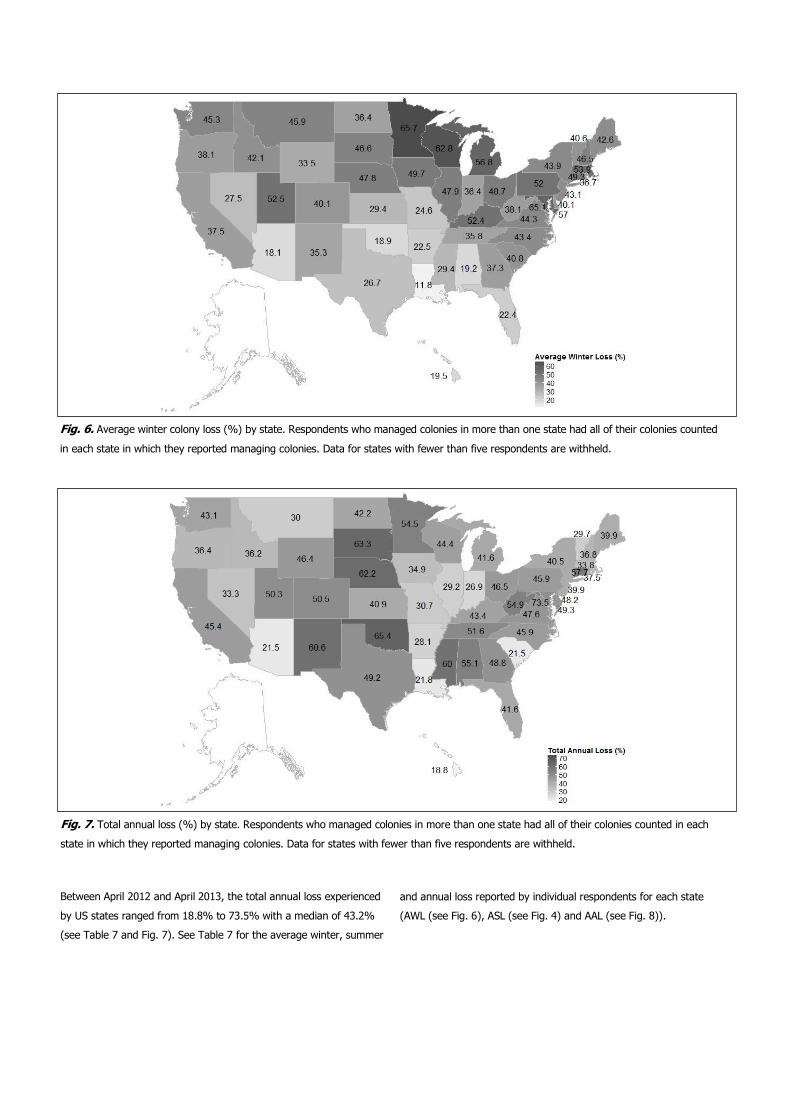
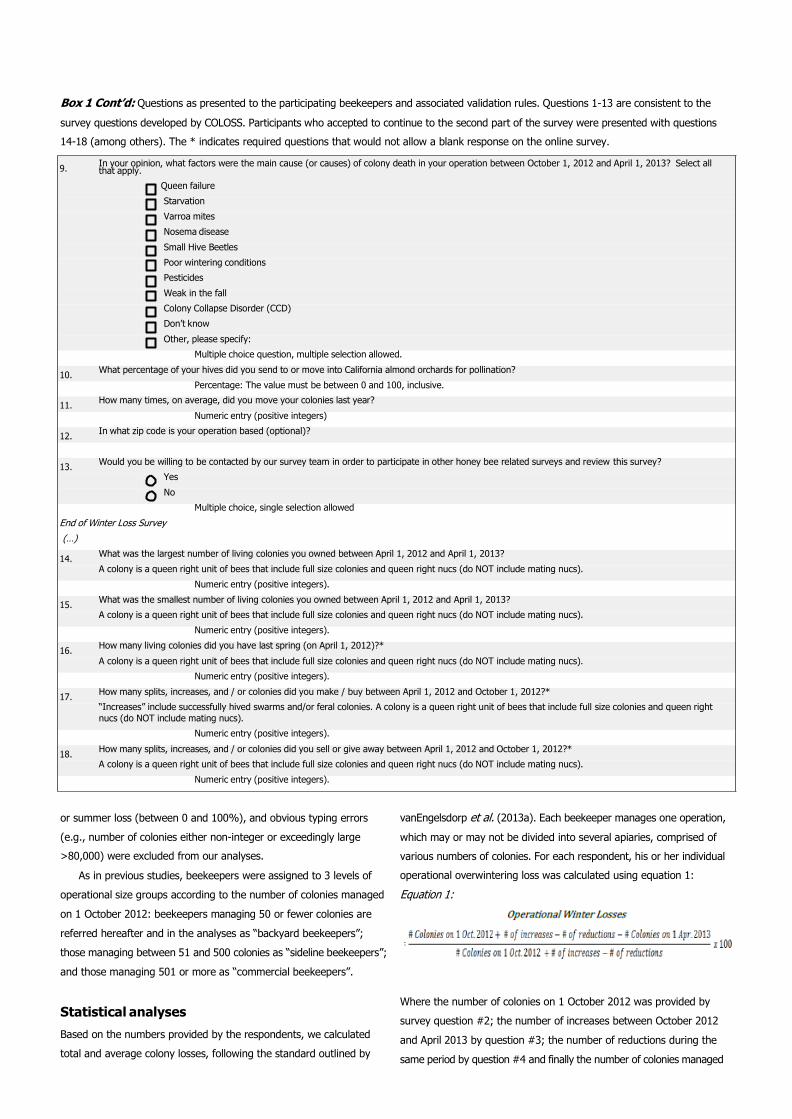
Fig. 6. Average winter colony loss (%) by state. Respondents who managed colonies in more than one state had all of their colonies counted
in each state in which they reported managing colonies. Data for states with fewer than five respondents are withheld.
Fig. 7. Total annual loss (%) by state. Respondents who managed colonies in more than one state had all of their colonies counted in each
state in which they reported managing colonies. Data for states with fewer than five respondents are withheld.
Between April 2012 and April 2013, the total annual loss experienced
by US states ranged from 18.8% to 73.5% with a median of 43.2%
(see Table 7 and Fig. 7). See Table 7 for the average winter, summer
and annual loss reported by individual respondents for each state
(AWL (see Fig. 6), ASL (see Fig. 4) and AAL (see Fig. 8)).

Table 7. Estimates of total and average summer, winter and annual colony loss by US states, showing the number of operations (or number of valid respondents), number of colonies at the start of
the period of interest, total colony loss (%), and average colony loss (%), by state of operation, for each season (summer, winter and annual). Each loss estimate (%) is presented along with its 95%
CI. Data for states with fewer than five respondents are withheld. Total Loss was calculated by dividing the sum of colonies lostᵃ by the sum of colonies at riskᵇ of all participants combined.
ᵃ Colonies Lost: the sum of colonies at risk minus the sum of the number of colonies managed on April 2013. ᵇ Colonies at risk: the sum of the total number of colonies managed on October 2012 and
colonies bought or made between October 2012 and April 2013 subtracting the total number of colonies sold between October 2012 and April 2013. Average Loss was calculated as the mean of all
individual winter loss (a mean of proportions).
Summer Loss Winter Loss Annual Loss n (# of
operations)
Total # of colonies
(04/2012)
Total Loss mean
[95% CI]
Average Loss mean
[95% CI]
n (# of n n
operations) Backyard Sideline
BK BK
n Commercial
BK
Median # of Mean # of colonies colonies
(10/2012) (10/2012)
Total # of colonies
(10/2012)
Total Loss mean
[95% CI]
Average Loss mean
[95% CI]
n (# of operations)
Total Loss mean
[95% CI]
Average Loss mean
[95% CI]
US 4,181 509,038 25.27
[24.8-25.75] 12.49
[11.91-13.06] 6,482 6,114 233 135 4 98.11 635,971
30.64 [30.16-31.13]
44.77 [43.88-45.67]
4,429 45.16
[44.58-45.75] 49.44
[48.46-50.43]
STATE:
36
422
16.89 [12.26-22.33]
12.67 [7.05-18.3]
50
45
4
1
5
53.34
2,667
15.76 [9.92-23.1]
19.16 [11.44-26.88]
36
55.08 [45.34-64.57]
25.54 [16.5-34.58]
Alabama
Alaska 2 . . . 2 . . . . . . . . 2 . .
Arizona
9
1,770 10.07
[8.78-11.45] 11.12
[1.21-21.02]
13
12
0
1
3
159.15
2,069 12.6
[10.4-15.05] 18.13
[6.13-30.13]
9 21.45
[18.75-24.32] 30.68
[11.91-49.44]
Arkansas 37 1,312 17.35
[14.51-20.46] 14.91
[7.39-22.43] 56 53 1 2 3 35.50 1,988
13.93 [11.66-16.43]
22.53 [14.19-30.87]
38 28.13
[25.72-30.63] 30.25
[21.34-39.17]
California 216 404,981 27.1
[25.17-29.08] 17.03
[14.69-19.36] 291 163 36 92 18 1652.02 480,737
28.58 [26.67-30.54]
37.5 [33.92-41.08]
226 45.38
[43.01-47.75] 46.27
[42.66-49.89]
Colorado 167 819 12.22
[9.8-14.95] 10.52
[7.6-13.44] 314 310 4 0 2 5.39 1,694
47.27 [44.08-50.48]
40.12 [35.73-44.52]
178 50.46
[46.43-54.49] 43.77
[38.3-49.24]
Connecticut 57 517 13.1
[9.33-17.61] 17.15
[11.51-22.78] 78 75 3 0 3.5 12.94 1,009
52.43 [46.11-58.7]
49.29 [40.53-58.06]
58 57.69
[51.34-63.86] 55.72
[46.97-64.47]
District of Columbia
10 242 42.91
[30.72-55.71] 14.77
[1.06-28.48] 14 12 2 0 2 21.43 300
54.72 [43.91-65.24]
65.05 [49.27-80.84]
10 73.48
[68.37-78.2] 67.43
[48.47-86.39]
Delaware 23 11,817 48.43
[43.28-53.6] 13.53
[5.92-21.13] 33 29 2 2 4 303.33 10,010
17.07 [12.14-22.9]
40.07 [29.23-50.9]
25 48.15
[46.04-50.27] 45.87
[35.17-56.57]
Florida 103 46,986 29.46
[25.9-33.2] 18.23
[14.31-22.14] 136 107 14 15 6 365.46 49,702
24.66 [21.8-27.69]
22.42 [18.18-26.67]
107 41.55
[38.92-44.22] 32.77
[28.2-37.33]
Georgia 74 6,874 14.3
[12.01-16.81] 12.41
[8.34-16.47] 117 108 6 3 5 81.05 9,483
43.31 [38.86-47.84]
37.3 [31.21-43.4]
78 48.78
[44.15-53.41] 37.38
[30.09-44.67]
Hawaii 45 10,107 15.08
[8.8-23.24] 18.78
[10.94-26.63] 61 50 7 4 9 211.48 12,900
11 [7.28-15.65]
19.46 [12.38-26.55]
46 18.84
[13.81-24.67] 29.42
[21.13-37.71]
Idaho 31 64,792 24.08
[20.25-28.2] 20.11
[12.96-27.27] 41 24 5 12 23 1625.85 66,660
20.78 [16.5-25.54]
42.13 [32.69-51.57]
31 36.15
[31.44-41.06] 49.29
[41.18-57.4]
Illinois 132 3,694 4.04
[2.1-6.85] 9.64
[6.59-12.7] 202 199 2 1 4 26.14 5,281
27.91 [25.27-30.65]
47.93 [42.69-53.17]
136 29.16
[25.8-32.68] 50.53
[44.41-56.64]
Indiana 108 2,625 6.03
[4.6-7.71] 9.74
[6.82-12.66] 173 166 6 1 5 23.29 4,030
24.5 [22.19-26.92]
36.37 [31.82-40.93]
115 26.88
[24.21-29.66] 38.87
[33.6-44.15]
Iowa 45 4,701 10.29
[6.18-15.69] 12.18
[7.24-17.13] 63 51 10 2 8 103.73 6,535
28.77 [23.99-33.89]
49.67 [41.92-57.42]
49 34.88
[28.93-41.17] 51.19
[43.29-59.08]
Kansas 39 1,382 19.97
[14.91-25.76] 13
[7.5-18.51] 51 44 6 1 6 45.67 2,329
30.31 [25.52-35.42]
29.39 [20.94-37.85]
40 40.9
[34.96-47.02] 41.3
[32.01-50.58]
Kentucky 46 421 18.35
[12.79-24.95] 10.28
[5.24-15.33] 67 63 4 0 5 11.18 749
33.25 [27.28-39.59]
52.37 [43.96-60.78]
49 43.42
[36.5-50.51] 55.62
[46.22-65.02]
Louisiana 14 490 38.83
[31.39-46.62] 13.27
[3.85-22.7] 22 20 1 1 9 102.91 2,264
18.36 [16.69-20.12]
11.81 [6.55-17.07]
14 21.78
[15.71-28.8] 23.25
[14.32-32.19]
Maine 103 45,213 29.01
[26.12-32.01]
12.07
[8.46-15.68] 177 169 3 5 3 270.34 47,851
21.08
[19.46-22.76]
42.59
[37.18-48.01] 108
39.85
[38.19-41.53]
48.22
[42.22-54.22]

Table 7 Cont’d.
Summer Loss Winter Loss Annual Loss n (# of
operations)
Total # of colonies
(04/2012)
Total Loss mean
[95% CI]
Average Loss mean [95% CI]
n (# of n n
operations) Backyard Sideline
BK BK
n Commercial
BK
Median # of Mean # of colonies colonies
(10/2012) (10/2012)
Total # of colonies
(10/2012)
Total Loss mean
[95% CI]
Average Loss mean [95% CI]
n (# of operations)
Total Loss mean
[95% CI]
Average Loss mean
[95% CI]
Maryland 182 12,840 47.59
[45.53-49.66] 13.74
[10.74-16.75] 271 260 9 2 3 43.69 11,840
21.18 [18.78-23.72]
57.04 [52.7-61.38]
198 49.34
[48.08-50.59] 59.75
[55.03-64.46]
Massachusetts 151 14,518 19.75
[19.17-20.34]
13.29
[10.19-16.39] 245 241 2 2 2 73.04 17,896
21.91
[20.47-23.41]
53.85
[48.9-58.8] 160
33.83
[32.37-35.3]
58.7
[53.49-63.91]
Michigan 205 22,462 31.75
[28.58-35.04] 13.64
[10.94-16.34] 313 293 15 5 4 75.14 23,519
21.56 [19.21-24.03]
56.8 [52.77-60.82]
220 41.58
[39.33-43.86] 61.72
[57.27-66.17]
Minnesota 75 45,195 30.39
[26.43-34.56] 16.67
[11.92-21.43] 117 101 2 14 5 459.26 53,734
38.73 [35.17-42.38]
65.68 [59.97-71.39]
81 54.48
[51.27-57.68] 70.33
[64.68-75.99]
Mississippi 27 108,564 38.85
[36.35-41.39] 15.95
[9.03-22.86] 41 31 6 4 9 2187.93 89,705
37.57 [35.25-39.91]
29.41 [20.72-38.09]
31 60.03
[56.54-63.46] 34.27
[24.86-43.67]
Missouri 76 937 11.21
[8.24-14.72] 13.04
[8.87-17.21] 104 98 6 0 5 15.35 1,596
22.94 [18.98-27.24]
24.62 [19.31-29.93]
78 30.69
[25.77-35.94] 34.4
[28.27-40.53]
Montana 26 30,236 13.97
[9.7-19.12] 17.66
[10.05-25.27] 45 30 3 12 5 1178.09 53,014
20.39 [15.99-25.31]
45.9 [36.59-55.21]
27 30.01
[21.47-39.6] 54.51
[43.58-65.44]
Nebraska 14 85,765 39.22
[35-43.55] 16.73
[2.19-31.27] 23 19 1 3 8 3355.35 77,173
37.85 [34.21-41.59]
47.77 [34.86-60.68]
16 62.18
[56.26-67.85] 47.41
[32.37-62.45]
Nevada 4 . . . 11 7 2 2 4 610.91 6,720 32.24
[24.44-40.76] 27.52
[7.9-47.14] 6
33.27 [24.44-42.96]
31.57 [10.85-52.29]
New
Hampshire 57 511
7.46 [4.85-10.78]
10.33 [5.76-14.9]
96 93 3 0 2 9.35 898 35.12
[29.36-41.18] 46.52
[38.15-54.89] 58
36.77 [29.7-44.25]
53.74 [43.9-63.58]
New Jersey 61 24,259 34.93
[30.84-39.19] 15.81
[10.86-20.76] 87 84 1 2 4 284.44 24,746
17.07 [15.56-18.66]
43.13 [35.09-51.16]
65 39.91
[38.09-41.75] 49.32
[40.9-57.73]
New Mexico 9 42 6.41
[1.19-17.93] 11.48
[0.71-22.25] 27 27 0 0 3 4.74 128
33.15 [21.53-46.34]
35.35 [22.6-48.1]
9 60.56
[39.75-79.03] 50.37
[27.46-73.28]
New York 178 39,988 31.19
[28.72-33.72] 11.33
[8.83-13.83] 270 247 11 12 5 171.10 46,196
26.54 [23.98-29.21]
43.91 [39.85-47.98]
189 40.46
[38.45-42.5] 47.74
[43.41-52.07]
North Carolina 277 3,578 26.26
[23.45-29.21] 13.76
[11.34-16.18] 415 405 9 1 4 12.48 5,181
34.1 [31.45-36.81]
43.37 [39.87-46.87]
295 45.89
[43.42-48.38] 49.4
[45.58-53.22]
North Dakota 36 189,516 23.7
[19.78-27.96] 24.03
[18.78-29.28] 38 5 1 32 2894 5532.37 210,230
26.89 [22.02-32.15]
36.42 [28.15-44.69]
35 42.23
[36.62-47.97] 47.65
[39.98-55.33]
Ohio 182 11,444 48.93
[46.88-50.98] 11.16
[8.57-13.75] 281 273 6 2 4 42.67 11,989
18.56 [16.53-20.72]
48.69 [44.58-52.8]
200 46.53
[45.41-47.65] 51.5
[47.02-55.97]
Oklahoma 29 3,632 59.79
[55.16-64.31] 20.22
[11.5-28.94] 37 34 2 1 5 91.59 3,389
14.1 [11.46-17.04]
18.85 [10.62-27.09]
29 65.41
[61.21-69.45] 34.54
[25.78-43.31]
Oregon 123 22,059 18.56
[17.02-20.17] 8.94
[6.13-11.75] 194 178 10 6 3 195.56 37,938
26.54 [24.31-28.85]
38.14 [33.1-43.18]
125 36.35
[34.2-38.54] 44.45
[38.51-50.4]
Pennsylvania 351 22,097 34.22
[32.15-36.33] 9.82
[8.14-11.5] 565 538 22 5 4 45.03 25,443
27.94 [25.91-30.03]
51.99 [48.91-55.07]
376 45.91
[44.43-47.4] 54.73
[51.34-58.13]
Puerto Rico 0 . . . 1 . . . . . . . . 0 . .
Rhode island
15
62 5.06
[0.5-17.67] 8.93
[-1.49-19.35]
28
28
0
0
3
7.32
205 34.7
[27.03-42.95] 36.66
[23.64-49.67]
15 37.5
[27.69-48.06] 36.26
[21.51-51.02]
South Carolina 67 4,059 13.51
[11.93-15.21] 11.06
[7.23-14.89] 96 93 2 1 4 42.57 4,087
15.53 [11.65-20.03]
40.79 [34.34-47.23]
72 21.5
[17.57-25.82] 44.08
[37.03-51.13]
South Dakota 6 85,132 39.96
[35.38-44.66] 17.49
[4.56-30.41] 8 4 0 4 1026 9723.75 77,790
39.03 [35.52-42.61]
46.58 [24.72-68.43]
6 63.32
[57.31-69.06] 51.19
[29.28-73.11]
Tennessee 56 626 16.03
[13.1-19.28] 8.07
[4.4-11.74] 94 88 6 0 5.5 13.62 1,280
43.06 [37.29-48.96]
35.77 [29.34-42.2]
61 51.57
[44.82-58.29] 38.09
[30.5-45.68]
Texas 56 66,951 24.56
[22.39-26.83] 12.88
[8.51-17.26] 77 58 4 15 7 1039.14 80,014
36.53 [32.87-40.3]
26.71 [20.81-32.61]
56 49.17
[45.17-53.17] 31.49
[24.31-38.67]
Utah 46 9,736 17.5
[15.49-19.65]
16.08
[10.24-21.93] 80 70 6 4 5 161.21 12,897
40.83
[34.64-47.22]
52.5
[45.01-60] 50
50.25
[43.62-56.88]
58.64
[50.96-66.33]

Table 7 Cont’d.
Summer Loss Winter L oss Annual Loss n (# of
operations)
Total # of
colonies (04/2012)
Total Loss
mean [95% CI]
Average
Loss mean [95% CI]
n (# of n n
operations) Backyard Sideline
BK BK
n
Commercial BK
Median # of Mean # of
colonies colonies (10/2012) (10/2012)
Total # of
colonies (10/2012)
Total Loss
mean [95% CI]
Average
Loss mean [95% CI]
n (# of
operations)
Total Loss
mean [95% CI]
Average Loss
mean [95% CI]
Vermont 39 2,854 8.53
[6.38-11.06] 10.74
[4.71-16.77] 76 67 6 3 4 54.63 4,152
27.09 [23.29-31.14]
40.62 [32.72-48.52]
45 29.67
[26.35-33.14] 41.9
[32.81-50.99]
Virginia 470 14,497 42.94
[41.29-44.6]
12.82
[11.04-14.6] 698 684 12 2 3 21.13 14,750
22.91
[21.26-24.62]
44.26
[41.57-46.95] 493
47.62
[46.49-48.76]
48.85
[45.86-51.84]
Washington 110 49,972 28.52
[26.84-30.23] 14.14
[10.18-18.09] 178 164 6 8 4 390.97 69,593
22.71 [21.33-24.12]
45.32 [39.83-50.8]
116 43.06
[41.19-44.94] 50.44
[44.07-56.82]
West Virginia 60 2,124 14.12
[12.57-15.77] 8.65
[5.3-12] 86 83 2 1 6 29.79 2,562
45.41 [40.99-49.88]
38.07 [30.82-45.32]
64 54.85
[50.19-59.45] 40.02
[32.17-47.88]
Wisconsin 131 19,153 35.33
[31.46-39.32] 16.55
[12.71-20.39] 184 165 12 7 5 113.34 20,854
23.31 [20.26-26.55]
62.76 [57.79-67.74]
138 44.42
[41.89-46.98] 67.29
[62.49-72.09]
Wyoming 13 13,370 15.58
[11.17-20.8] 10.89
[3.47-18.31] 21 13 3 5 15 778.81 16,355
37.52 [26.96-48.94]
33.53 [18.27-48.8]
13 46.37
[32.13-61.02] 38.65
[22.86-54.44]
Fig. 8. Average annual loss (%) by state. Respondents who managed colonies in more than one state had all of their colonies counted in each
state in which they reported managing colonies. Data for states with fewer than five respondents are withheld.
Discussion
This survey reports the seventh year of consecutive estimates of over-
wintering colony losses for the US and for the first time reports summer
and annual losses. With the exception of the winter of 2011-2012
(TWL = 22.5%; Spleen et al., 2013), US total overwintering loss
estimates have fluctuated around 30% (31.8%, 35.8%, 28.6%, 34.4%,
and 29.9% for the winters of 2006-7, 2007-8, 2008-9, 2009-10 and
2010-11, respectively; vanEngelsdorp et al., 2007, 2008, 2010, 2011a,
2012). Our estimate for the winter 2012-2013 at 30.6% (TWL) conforms
to the current pattern of high overwintering colony losses.
Several of our results point out that the 2012-2013 winter has
been particularly challenging for beekeepers to keep their colonies alive.
Since winter losses have been quantified by surveys, average winter
loss has mostly been higher than total winter loss (with total vs.
averages of 31.8% vs 37.6%, 35.8% vs 31.3%, 28.6% vs 34.2%, 34.4%
vs 42.2%, 29.9% vs 38.4%, 22.5% vs 25.4% for the winters of 2006-7,
2007-8, 2008-9, 2009-10, 2010-11 and 2011-12, respectively;
vanEngelsdorp et al., 2007, 2008, 2010, 2011a, 2012; Spleen et al.,
2013) and it is yet again the case with the estimates in the current
study. However, this survey year’s average winter loss was higher than
in previous years at 44.8%. This means that during this winter 2012-
2013, while the US region as a whole lost 30.6% of its colonies, each
beekeeper lost on average 44.8% of his/her colonies. Moreover, during
the winter of 2012-13, only 24% of respondents reported zero colony
losses, while over the previous two winters, 45% and 33% of
respondents, respectively, made this claim (Spleen et al., 2013;
vanEngelsdorp et al., 2012). Finally, 52.3% of respondents to this
survey claimed that their overwintering losses were higher in 2013
compared to the previous year. A higher average loss per beekeeper,
fewer individual beekeepers reporting no loss and more than one in
two beekeepers reporting worse losses compared to the previous
year, all indicate a particularly difficult 2012-2013 wintering season.
Even though our survey size represents 25.5% of the colonies
managed in the US as compared to USDA-NASS population estimate
mentioned earlier, there is no census of the US beekeepers available,
which prevents us from quantifying and adjusting for potential bias in
our respondent pool. Despite our efforts to multiply the channels of
solicitations, most of our approaches still rely on the internet, which
might bias participation towards internet-savvy beekeepers. Knowing
that previous results had repeatedly under-represented commercial
beekeepers, strong efforts have been deployed this year to seek to
increase their participation, with success, as their representation in
the analytic sample for winter loss rose from 1.22% (n = 67 of 5,500
respondents in 2012; Spleen et al., 2013) to 2.08% (n = 135 of 6,482
respondents in this survey). Overall, the number of colonies represented
in our survey (on 1 October) increased by 78.9% compared to the
previous year’s survey (635,971 colonies compared to 355,532 colonies;
Spleen et al., 2013), perhaps indicating that the outreach efforts were
productive.
This survey was not designed to identify causes of winter colony
losses but instead to document trends in reported levels of loss and
self-reported causes of death as identified by the beekeeper themselves.
Difference in results from past surveys may result from changes in the
respondent pool, which are difficult to correct without a comprehensive
census of US beekeepers.
Commercial beekeepers lost, on average, a significantly lower
percentage of colonies than sideline beekeepers and backyard bee-

keepers over the winter. They were also more likely to report the
symptom “no dead bees in the hive or apiary” when experiencing
winter loss, a symptom which is one of the defining characteristics of
CCD (Cox-Foster et al., 2007; vanEngelsdorp et al., 2009).
This study’s estimate of the proportion of colonies that died with
the symptom “no dead bees in the hive or apiary” is more than double
compared to past years (51.3% of the colonies lost this winter 2012-
2013 compared to 20.5% in 2012 and 26.3% in 2011; Spleen et al.,
2013 and vanEngelsdorp et al., 2012). This was also reflected in the
frequency of selecting “CCD” as a main cause of colony loss over the
winter: 10.83% of the respondents who suffered a certain amount of
loss identified CCD as main cause of overwintering loss in this survey.
Only 8.6% (n = 247 on 2,887 respondents) and 5.9% (n = 199 on 3,389
respondents) did the same last year (Spleen et al., 2013;
vanEngelsdorp et al., 2012). Beekeepers who reported they lost at
least part of their colonies to the symptom “no dead bees in the hive
or apiary” experienced greater loss on average than those not reporting
this condition. Similarly, beekeepers who selected “CCD” as a self-
reported cause of overwintering colony loss also experienced greater
losses compared to beekeepers who did not select this factor. Only
commercial beekeepers listed “CCD” as one of their most frequently
reported factors of overwintering colony loss. Typically, as was the case
in previous years (vanEngelsdorp et al., 2011a), we see that commercial
beekeepers self-identified mostly non-manageable conditions (queen
failure, pesticides or CCD) as leading causes of overwintering loss, while
backyard beekeepers were more likely to report manageable conditions
(starvation, colony weak in the fall).
Ideally we would compare our survey results with loss data from
in field longitudinal studies. Unfortunately, few in field studies are
available. A total loss of 56% was reported in a cohort of migratory
honey bee colonies monitored for 10 months, which is higher than the
estimate in this study (vanEngelsdorp et al., 2013b). The same study
also identified “queen event” as one of the major risk factor of short-
term colony mortality (vanEngelsdorp et al., 2013b), which supports
our participating beekeepers’ judgment of identifying this factor as one
of the leading cause of colony mortality. A field study in Ontario Canada
identified fall varroa mite levels, small fall bee populations, and low
food reserves as leading causes of colony mortality (Guzmán-Novoa
et al., 2010). Our ranking of the top-4 leading self-reported cause of
death (colony weak in the fall, starvation, queen failure and varroa
mites) appears well supported by those two in the field studies, however,
more in field verification of losses and causes of losses should be done
to test the accuracy of our survey results.
Overall, more than 70% of the beekeepers experienced over-
wintering loss above the level US beekeepers consider acceptable in
this winter 2012-2013, which might reflect the unusually high level of
average winter loss, though there was considerable variation across
states. In addition to a high overwintering loss, beekeepers also lost
colonies during the summer period. On average, US beekeepers lost
12.5% of their colonies last summer and 49.4% over the entire course
of the year. Commercial beekeepers lost significantly fewer colonies
than backyard beekeepers in the winter but the situation is reversed
in the summer where they experience a higher average loss than
backyard beekeepers (30.2% (95% CI: 26.54-33.93 % vs 45.4 %
(44.46-46.32 %) respectively). This also explains the inversion between
total and average loss for the summer estimates where total loss,
strongly influenced by larger apiaries, is higher than average loss.
This, together with the contrasted results concerning CCD symptoms
and other self-reported causes of death, strongly suggests that bee-
keepers from different operation types are facing divergent challenges
and encourages us to consider operation type as an important factor
in understanding the causes of colony mortality.
We selected 1 October to 1 April to estimate overwintering colony
loss because this period is thought to encompass the traditional inactive
season of the colony and enables the beekeeper to make a first spring
visit to estimate the mortality in his/her operation. However, the length
of the inactive season varies according to the region and some
important pollination activities occur during that period. While some-
what subjective, this constant reference period throughout studies
enables for comparison of rates across time and regions. Overwintering
has always been seen as the period of the year with the highest
mortality risk, but with a total loss of 25.3% (95% CI: 24.8-25.75%)
and an average loss per beekeeper of 12.5 % (95% CI: 11.91-13.06%),
the mortality over summer is far from negligible. Those results suggest
that to capture a more complete picture of honey bee colony mortality
and understand its drivers, survey studies documenting colony losses
should report annual losses rather than winter losses only.
Acknowledgments
We thank all respondents for their participation. We thank Rachel
Bozarth, Heather Eversole, Andrew Garavito, and Meghan McConnell
for entering the answers from paper surveys. Our gratitude goes out
to the many beekeeping organizations, industry leaders, and beekeeping
clubs that forwarded our appeal for participation emails. A special thank
you is owed to USDA APHIS, the Apiary Inspectors of America, the
American Honey Producers Association, Brushy Mountain Bee Farm,
Bee Culture magazine, and American Bee Journal for sending out
participation requests to their online audiences. We are grateful to
two anonymous reviewers for their comments and editing suggestions.
This project was funded by a CAP grant from USDA-NIFA: the Bee
Informed Partnership and includes, in addition to several of the authors,
Kathy Baylis, Joseph Connell, Keith Delaplane, Susan Donohue, Wayne
Esaias, Marla Spivak, Robyn Underwood, and the USDA-ARS Area wide
Program on Bee Health.

References
AIZEN, M A; GARIBALDI, L A; CUNNINGHAM, S A; KLEIN, A M (2008)
Long-term global trends in crop yield and production reveal no
current pollination shortage but increasing pollinator dependency.
Current Biology 18(20): 1572–1575.
http://dx.doi.org/10.1016/j.cub.2008.08.066
AIZEN, M A; HARDER, L D (2009) The global stock of domesticated
honey bees is growing slower than agricultural demand for
pollination. Current Biology 19(11): 915–918.
http://dx.doi.org/10.1016/j.cub.2009.03.071
CALDERONE, N W (2012) Insect pollinated crops, insect pollinators and
US agriculture: trend analysis of aggregate data for the period
1992-2009. PLoS ONE 7(5).
http://dx.doi.org/10.1371/journal.pone.0037235
COX-FOSTER, D L; CONLAN, S; HOLMES, E C; PALACIOS, G; EVANS, J
D; MORAN, N A; QUAN, P-L; BRIESE, T; HORNIG, M; GEISER, D M;
MARTINSON, V; VANENGELSDORP, D; KALKSTEIN, A L; DRYSDALE,
A; HUI, J; ZHAI, J; CUI, L; HUTCHISON, S K; SIMONS, J F; EGHOLM,
M; PETTIS, J S; LIPKIN, W I (2007) A metagenomic survey of
microbes in honey bee Colony Collapse Disorder. Science 318 (5848):
283–287. http://dx.doi.org/10.1126/science.1146498
CRAWLEY, M J (2007) Mixed-effects models. In The R Book. John
Wiley & Sons, Ltd, pp. 627–660.
GARIBALDI, L A; AIZEN, M A; CUNNINGHAM, S A; KLEIN, A M (2009)
Pollinator shortage and global crop yield. Communicative &
Integrative Biology 2(1): 37–39.
GUZMÁN-NOVOA, E; ECCLES, L; CALVETE, Y; MCGOWAN, J; KELLY, P G;
CORREA-BENÍTEZ, A (2010) Varroa destructor is the main culprit
for the death and reduced populations of overwintered honey bee
(Apis mellifera) colonies in Ontario, Canada. Apidologie 41(4): 443
-450. http://dx.doi.org/10.1051/apido/2009076
KLEIN, A-M; VAISSIERE, B E; CANE, J H; STEFFAN-DEWENTER, I;
CUNNINGHAM, S A; KREMEN, C; TSCHARNTKE, T (2007)
Importance of pollinators in changing landscapes for world crops.
Proceedings of the Royal Society B: Biological Sciences 274 (1608):
303–313. http://dx.doi.org/10.1098/rspb.2006.3721
NEUMANN, P; CARRECK, N L (2010) Honey bee colony losses. Journal
of Apicultural Research 49(1): 1–6.
http://dx.doi.org/10.3896/IBRA.1.49.1.01
NGUYEN, B K; MIGNON, J; LAGET, D; DE GRAAF, D C; JACOBS, F J;
VANENGELSDORP, D; BROSTAUX, Y; SAEGERMAN, C; HAUBRUGE,
E (2010) Honey bee colony losses in Belgium during the 2008-9
winter. Journal of Apicultural Research 49(4): 337–339.
http://dx.doi.org/10.3896/IBRA.1.49.4.07
PIRK, C W W; HUMAN, H; CREWE, R M; VANENGELSDORP, D (2014)
A survey of managed honey bee colony losses in the Republic of
South Africa - 2009 to 2011. Journal of Apicultural Research 53(1):
35-42. http://dx.doi.org/10.3896/IBRA.1.53.1.03
POTTS, S; ROBERTS, S; DEAN, R; MARRIS, G; BROWN, M; JONES, R;
NEUMANN, P; SETTELE, J (2010a) Declines of managed honey
bees and beekeepers in Europe. Journal of Apicultural Research
49(1): 15. http://dx.doi.org/DOI:10.3896/IBRA.1.49.1.02
POTTS, S G; BIESMEIJER, J C; KREMEN, C; NEUMANN, P; SCHWEIGER,
O; KUNIN, W E (2010b) Global pollinator declines: trends, impacts
and drivers. Trends in Ecology & Evolution 25(6): 345–353.
http://dx.doi.org/10.1016/j.tree.2010.01.007
RICKETTS, T H; REGETZ, J; STEFFAN-DEWENTER, I; CUNNINGHAM,
S A; KREMEN, C; BOGDANSKI, A; GEMMILL-HERREN, B; GREEN-
LEAF, S S; KLEIN, A M; MAYFIELD, M M; MORANDIN, L A;
OCHIENG’, A; POTTS, S G; VIANA, B F (2008) Landscape effects
on crop pollination services: are there general patterns? Ecology
letters 11(5): 499–515.
http://dx.doi.org/10.1111/j.1461-0248.2008.01157.x
SPLEEN, A M; LENGERICH, E J; RENNICH, K; CARON, D; ROSE, R;
PETTIS, J S; HENSON, M; WILKES, J T; WILSON, M; STITZINGER,
J; LEE, K; ANDREE, M; SNYDER, R; VANENGELSDORP, D (2013) A
national survey of managed honey bee 2011-12 winter colony
losses in the United States: results from the Bee Informed
Partnership. Journal of Apicultural Research 52(2): 44–53.
http://dx.doi.org/10.3896/IBRA.1.52.2.07
UNITED STATES DEPARTMENT OF AGRICULTURE NATIONAL
STATISTICS SERVICE (USDA-NASS) (2002) Report on the National
Stakeholders Conference on Honey Bee Health: National Honey
Bee Health Stakeholder Conference Steering Committee - Alexandria,
Virginia October 15-17, 2002. [WWW Document] (n.d.) United
States Department of Agriculture (USDA).
http://www.usda.gov/documents/ReportHoneyBeeHealth.pdf
UNITED STATES DEPARTMENT OF AGRICULTURE NATIONAL
STATISTICS SERVICE (USDA-NASS) (2013) Honey. Department of
Agriculture; Washington DC, USA. 6 pp.
http://usda01.library.cornell.edu/usda/current/Hone/Hone-03-18-
2013.pdf
VAN DER ZEE, R; PISA, L; ANDONOV, S; BRODSCHNEIDER, R;
CHARRIERE, J-D; CHLEBO, R; COFFEY, M F; CRAILSHEIM, K; DAHLE,
B; GAJDA, A; GRAY, A; DRAZIC, M M; HIGES, M; KAUKO, L; KENCE,
A; KENCE, M; KEZIC, N; KIPRIJANOVSKA, H; KRALJ, J;
KRISTIANSEN, P; MARTIN HERNANDEZ, R; MUTINELLI, F; NGUYEN,
B K; OTTEN, C; OZKIRIM, A; PERNAL, SF; PETERSON, M; RAMSAY,
G; SANTRAC, V; SOROKER, V; TOPOLSKA, G; UZUNOV, A;
VEJSNAES, F; WEI, S; WILKINS, S (2012) Managed honey bee
colony losses in Canada, China, Europe, Israel and Turkey, for the
winters of 2008-9 and 2009-10. Journal of Apicultural Research 51
(1): 91-114. http://dx.doi.org/10.3896/IBRA.1.51.1.12

VAN DER ZEE, R; GRAY, A; HOLZMANN, C; PISA, L; BRODSCHNEIDER,
R; CHLEBO, R; COFFEY, M F; KENCE, A; KRISTIANSEN, P;
MUTINELLI, F; NGUYEN, B K; ADJLANE, N; PETERSON, M;
SOROKER, V; TOPOLSKA, G; VEJSNÆS, F; WILKINS, S (2013)
Standard survey methods for estimating colony losses and
explanatory risk factors in Apis mellifera. In V Dietemann; J D Ellis;
P Neumann (Eds) The COLOSS BEEBOOK, Volume II: Standard
methods for Apis mellifera research. Journal of Apicultural Research
52(4): http://dx.doi.org/10.3896/IBRA.1.52.4.18
VANENGELSDORP, D; UNDERWOOD, R; CARON, D; HAYES, J (2007)
An estimate of managed colony losses in the winter of 2006-2007:
A report commissioned by the apiary inspectors of America.
American Bee Journal 147(7): 599–603.
VANENGELSDORP, D; HAYES, J; UNDERWOOD, RM; PETTIS, J (2008)
A survey of honey bee colony losses in the US, Fall 2007 to Spring
2008. PLoS ONE 3(12):
http://dx.doi.org/10.1371/journal.pone.0004071
VANENGELSDORP, D; EVANS, J D; SAEGERMAN, C; MULLIN, C;
HAUBRUGE, E; NGUYEN, B K; FRAZIER, M; FRAZIER, J; COX-
FOSTER, D; CHEN, Y; UNDERWOOD, R; TARPY, D R; PETTIS, J S
(2009) Colony Collapse Disorder: a descriptive study. PLoS ONE 4(8).
http://dx.doi.org/10.1371/journal.pone.0006481
VANENGELSDORP, D; MEIXNER, M D (2010) A historical review of
managed honey bee populations in Europe and the United States
and the factors that may affect them. Journal of Invertebrate
Pathology 103: S80–S95.
http://dx.doi.org/10.1016/j.jip.2009.06.011
VANENGELSDORP, D; HAYES, J; UNDERWOOD, R M; PETTIS, J S (2010)
A survey of honey bee colony losses in the United States, fall 2008
to spring 2009. Journal of Apicultural Research 49(1): 7–14.
http://dx.doi.org/10.3896/IBRA.1.49.1.03
VANENGELSDORP, D; HAYES, J; UNDERWOOD, R M; CARON, D; PETTIS,
J S (2011a) A survey of managed honey bee colony losses in the
USA, fall 2009 to winter 2010. Journal of Apicultural Research, 50
(1): 1-10. http://dx.doi.org/10.3896/IBRA.1.50.1.01
VANENGELSDORP, D; BRODSCHNEIDER, R; BROSTAUX, Y; VAN DER
ZEE, R; PISA, L; UNDERWOOD, R; LENGERICH, E J; SPLEEN, A;
NEUMANN, P; WILKINS, S; BUDGE, G E; PIETRAVALLE, S; ALLIER,
F; VALLON, J; HUMAN, H; MUZ, M; LE CONTE, Y; CARON, D;
BAYLIS, K; HAUBRUGE, E; PERNAL, S; MELATHOPOULOS, A;
SAEGERMAN, C; PETTIS, J S; NGUYEN, B K (2011) Calculating
and reporting managed honey bee colony losses. In D Sammataro;
J Yoder (Eds). Honey bee colony health: challenges and sustainable
solutions. pp. 229–236.
VANENGELSDORP, D; CARON, D; HAYES, J; UNDERWOOD, R; HENSON,
M; RENNICH, K; SPLEEN, A; ANDREE, M; SNYDER, R; LEE, K;
ROCCASECCA, K; WILSON, M; WILKES, J; LENGERICH, E; PETTIS,
J S (2012) A national survey of managed honey bee 2010-11
winter colony losses in the USA: results from the Bee Informed
Partnership. Journal of Apicultural Research 51(1): 115–124.
http://dx.doi.org/10.3896/IBRA.1.51.1.14
VANENGELSDORP, D; LENGERICH, E; SPLEEN, A; DAINAT, B;
CRESSWELL, J; BAYLISS, K; NGUYEN, K B; SOROKER, V;
UNDERWOOD, R; HUMAN, H; LE CONTE, Y; SAEGERMAN, C (2013a)
Standard epidemiological methods to understand and improve
Apis mellifera health. In V Dietemann; J D Ellis, P Neumann (Eds)
The COLOSS BEEBOOK: Volume II: Standard methods for Apis
mellifera pest and pathogen research. Journal of Apicultural
Research 52(4): http://dx.doi.org/10.3896/IBRA.1.52.4.15
VANENGELSDORP, D; TARPY, D R; LENGERICH, E J; PETTIS, J S
(2013b) Idiopathic brood disease syndrome and queen events as
precursors of colony mortality in migratory beekeeping operations
in the eastern United States. Preventive Veterinary Medicine 108
(2–3): 225–233.
http://dx.doi.org/10.1016/j.prevetmed.2012.08.004