Embed Size (px)
Citation preview
1
A Nested Logit Model of Green Electricity Consumption
in Western Australia
Chunbo Ma† and Michael Burton†*
†School of Agricultural and Resource Economics
The University of Western Australia, Crawley, WA 6009, Australia
*E-mail addresses: [email protected]
26 April 2013
Working Paper 1306
School of Agricultural and Resource Economics
http://www.are.uwa.edu.au
Citation: Ma, Chunbo and Michael Burton, (2013). A Nested Logit Model of Green Electricity Consumption in Western
Australia, Working Paper 1306, School of Agricultural and Resource Economics, University of Western Australia,
Crawley, Australia.
© Copyright remains with the authors of this document.

2
A Nested Logit Model of Green Electricity Consumption in Western Australia
Abstract
Green electricity products are increasingly made available to consumers in many countries in an effort to
address a number of environmental and social concerns. Most of the existing literature on this green
electricity market focuses on consumer’s characteristics and product attributes that could affect
participation. However, the contribution of this environmental consumerism to the overall
environmental good does not depend on participation alone. The real impact made relies on market
penetration for green consumers (the proportion of green consumers) combined with the level of green
consumption intensity – the commitment levels, or proportion of consumption that is green. We design
an online interface that closely mimics the real market environment for electricity consumers in Western
Australia and use a three-level nested logit model to analyze consumers’ choice of green electricity
products as well as their commitment levels. Our main conclusions are that the choice of green products
is strongly influenced by beliefs in the nature of climate change, and trust in the government and utilities
in delivering the product. When green products are selected, the vast majority select the minimum
commitment possible, and this is insensitive to the premium being charged on green power, suggesting
that we are largely observing a ‘warm glow’ for carbon mitigation.
Key words: Green Power; Nested Logit; Warm Glow; Green Electricity

3
1. Introduction
The past few decades have witnessed a significant increase in the demand and supply of
“environmentally friendly” or “green” products. Market research on consumers behavioural patterns
involved in green product choice has shown a very high percentage of consumers willing to buy green
products. Another body of research, however, indicates that consumers are only willing to purchase
green products with preferred attributes within certain constraints. Research in this field has been
primarily conducted by market research companies, the results of which are not in the public domain
(Blamey et al., 2001). Academic research in the area only focuses on the factors and attributes that
influence consumers’ choice of green products. Very little research looks at the level of commitment
(defined here as the proportion of an individual use of a product that is ‘green’) beyond the choice of
green products. The environmental impact as a result of green consumption not only depends on
consumers’ choice of environmentally friendly products, the level of commitment or demand is also
crucial. For instance, the contribution of residential rooftop solar panel adoption to a clean energy
supply depends on the size (capacity) of each installation as well as the number of installations. However,
Andreoni (1989; 1990) argued that consumers not only derive utility from the contribution to the
environmental good which is pure altruism and is linked to the level of commitment, utility is also
derived from the pro-environmental behavior itself – often termed as a “warm glow” effect which is not
necessarily linked to the level of commitment. The amount that consumers are willing to pay has been
found to be highly non-linear in the percent of energy that is generated from renewables (Farhar, 1999)
and customers are more concerned about the concept of consuming green energy than its actual
environmental impact (Goett et al., 2000). One implication is that if a “warm glow” effect is significant,
the actual contribution to the environmental good may be limited even if there are a substantial number
of green consumers. More importantly, this will also have implications for the actual impact of policies
that aim to promote pro-environmental behaviors. It is thus important to study both consumers’ choice
of green products and their commitment levels. In this paper, we study consumers’ participation in
green electricity programs in Western Australia. We design a survey that closely mimics the real decision
context facing the consumers in Western Australia and use a 3-level nested logit model to investigate
both consumers’ choices of products and commitment levels. The rest of the paper proceeds as follows.
Section 2 provides the background of Australian green electricity programs and reviews relevant
4
literature. Section 3 describes our experimental design. Section 4 introduces our statistical model. We
present results in Section 5 and conclusions in the last section.
2. Background and Literature
The option to purchase green electricity products is increasingly available to consumers in many
countries. For instance, Kotchen and Moore (2007) identified 29 green electricity suppliers currently
competing in eight US states. Mewton and Cacho (2011) also studied 21 green electricity schemes
provided by utility retailers in Australia. The willingness of consumers to pay for green electricity or
actual participation in the green electricity market has been investigated in a large number of countries
including the US (Farhar and Houston, 1996; Wiser, 2007; Bird et al., 2007; Kotchen and Moore, 2007),
Australia (Mewton and Cacho, 2011, Ivanova, 2012), Sweden (Ek and Söderholm, 2008), Norway
(Navrud and Bråten, 2007), Finland (Salmela and Varho, 2006), UK (Scarpa and Willis, 2010;
Diaz-Rainey, 2012), Germany (Menges et al., 2005), Canada (Rowlands et al., 2003) and Japan (Nomura
and Akai, 2004). These studies primarily address two questions: 1) what motivates consumers to
participate in green electricity programs? 2) how do consumers’ characteristics and a product’s attributes
(eg. energy sources and payment mechanisms) affect participation? Conventional electricity is mostly
generated from fossil fuels, which is by far the largest emitter of a number of local as well as global air
pollutants such as carbon and fine particulates. Demand for green electricity thus contributes to the
mitigation of these pollutants. However, the contribution of this environmental consumerism to the
overall environmental good does not depend on participation alone. If a “warm glow” effect is the
dominant driver for participation, we would expect a low commitment level overall. As a result, the real
impact of this green consumerism and policies promoting it may also be rather limited. It is thus
important to investigate both participation and commitment levels.
Under all-or-none schemes, where consumers either choose a conventional electricity product or commit
100% to electricity generated from renewable sources, it is understandable that studies mostly focus on
participation. However, this all-or-none approach is increasingly being moderated in real markets, with
many green electricity products offering different commitment levels. In Australia, the green electricity
market is largely driven by the Australian National Green Power Accreditation Program (NGPAP) which

5
is a market-based program initiated by the NSW government in 1997. The objective of the program is to
encourage investment in new renewable energy generation by increasing consumer demand and
confidence in accredited “GreenPower” products by letting consumers opt-in to pay a premium and buy
more expensive green electricity on a voluntary basis. Currently, a total of 44 “GreenPower” products
are provided by 28 NGPAP accredited retailers nationally. In addition, there are other unaccredited green
electricity products offered in the market. For instance, Synergy which is the electric utility company that
serves the metropolitan Perth area offers residential customers two NGPAP accredited “GreenPower”
products – “EasyGreen” and “NaturalPower”, and one unaccredited product – “EarthFriendly”.
Consumers can make a choice between conventional electricity product and these accredited and
unaccredited green electricity products. In addition, they can also choose the level of commitment
through different payment schemes. For “EasyGreen”, consumers can commit a fixed amount (ranging
from $10 - $80 in $10 steps) on top of their regular bill. For “NaturalPower” and “Earth Friendly”,
customers can choose a fixed proportion of their electricity to be generated from renewable sources (25%
- 100%) or choose to offset the carbon emission of a fixed proportion of their conventional electricity
consumption (25% - 100%). This green electricity market thus provides an excellent setting to study
consumers’ commitment levels as well as product choices.
3. Choice Experiment Design
The majority of the WA households are served by Western Power’s South West Interconnected Systems
(SWIS). Synergy is responsible for the retail delivery of electricity in this area. The SWIS covers the entire
metropolitan Perth area where we recruit all our respondents. There are currently four electricity products
offered by Synergy – the conventional fossil fuel generated electricity, two NGPAP accredited
“GreenPower” products – “EasyGreen” and “NaturalPower”, and one unaccredited product –
“EarthFriendly”. Synergy provides an online interface for consumers to compare and make a choice
among electricity products and commitment levels. Information on the cost of selecting different products
and commitment levels and associated environmental impacts is also provided through the interactive
interface. This online interface thus represents the real market environment that households face in
metropolitan Perth area. In the hypothetical experimental setting we slightly modify this interface to
include extra information regarding the attributes of the electricity products, while trying to closely mimic

6
the real market environment. Figure 1 and Figure 2 present images of Synergy’s actual interface and our
modified version where we embed our choice experiments1.
Consumers (respondents in our case) can navigate across products (tabs) to see attribute differences. They
can also change commitment levels by moving the slider bar to see the extra cost to their electricity bill and
the impact on the level of carbon emissions (shown in panel 2). Once a consumer (respondent) is satisfied
with a specific combination of a product and a commitment level, they can make an order (choice in our
case). It is reasonable to think that consumers in the real market would need time to get familiar with the
structure of the interface before they can make an order. To facilitate this process in our choice experiment,
we provide a 5-minute video demonstration to explain how to compare alternative products, adjust
commitment levels and make a choice. This video is placed before respondents start with the formal choice
questions. Each respondent answers six choice sets. When making the commitment level respondents
were restricted to the discrete levels available: $10-$80 for EasyGreen (in steps of $10), or 25, 50, 75, 100%
for NaturalPower and EarthFriendly2. Thus respondents can be considered to have selected 1 out of 4
products, if the analysis is considered at the product level, or 1 of 17 product/commitment levels, if one
considers the full choice process.
1 Although Synergy approved the use of a simile of their web site, they are not responsible for any of the implementation and conclusions drawn from this study. 2 These are also the actual discrete commitment levels marketed by Synergy.

7
Figure 1: Synergy’s Green Power Web Interface

8
Figure 2: Modified Choice Set Presentation
Table 1 summarizes the attributes and associated values that are used to describe the products. These
attributes and values are carefully chosen to capture the differences in existing green electricity products
in the Australian market, but it should be noted that the type of source, accreditation, contract terms and
location of renewable energy source are not attributes that are described as part of the actual Synergy
products. The regular charge (which defines the cost of the conventional electricity, and provides the
baseline costs for the green products, to which the elected contribution is added) is fixed within any
choice set, but varies across choice sets. The implication is that this cannot be considered as a direct
attribute to explain choices across products. However, we anticipate that the level of the regular charge
(or more specifically, the expected total utility bill, which will also be influenced by average daily use) may
influence the choice between conventional and green products. Thus, if regular charge is high, leading to
a high baseline bill, respondents may be less willing to commit to further expenditure. The
appropriateness of the attributes and associated value ranges were verified in a pilot study.

9
The design of the survey used an s-efficiency criteria (using Ngene), with 12 choice sets, blocked into 2
groups of 6. For the 6 choice sets each respondent saw, there was a different regular charge (which was
common to all alternatives within the choice set, and hence not used in the design itself). These
progressively increased in value (from 19 to 29) through the design for half of the sample, while they
declined for the other half (29 through 19). The online survey was conducted in the June of 2012, with
831 completed responses.
Table 1: Product Attributes and Attribute Values
Attributes Attribute Values
Regular Charge 19,21,23,25,27,29
Charge Premium 0,1,2,4,6
Energy Source Coal & Gas, Hydro, Bio, Wind, Solar
Accreditation Yes, No
Contract Terms Fixed (2-Year), Flexible
Location WA, Non-WA
4. Modeling Approach
Consumer choice analysis has made extensive use of random utility models where
U (choice j for consumer i ) = Uij = Vij + εji
The utility Uij consists of a systematic component Vij and a random disturbance εji. Utility maximization
implies that the probability that consumer i will choose alternative j, Pij, is determined by
Pij = Pr (Uij > Uik) ∀ k ≠ j The probability can be empirically estimated once the specification of the deterministic component Vij
and the characteristics of the stochastic component εji are known. A large number of choice analyses
have focused on multinomial or conditional logit models where the stochastic disturbance is assumed to
be independently and identically distributed (IID) with a Gumbel distribution. The IID assumption has
an important behavioral association with a property known as the Independence of Irrelevant
Alternatives (IIA) which states that the ratio of the choice probabilities of any pair of alternatives is
independent of the presence or absence of any other alternative in a choice set. An important behavioral
implication of IIA is that any pair of alternatives (choices) are equally similar or dissimilar (Hensher et
al., 2005). In our choice setting where households need to choose among different electricity products as
well as different commitment levels, it is very likely that the IIA/IID assumption is violated if

10
commitment levels for the same product are perceived as closer substitutes. The assumption is also
violated if households perceive green electricity products are closer substitutes as compared to the
conventional electricity product. If there is unobserved correlation among alternatives, multinomial or
conditional logit models will generate inconsistent parameter estimates. When the IIA/IID assumption
is thought to be possibly violated, the nested logit model is an appropriate method to accommodate the
violations.
Figure 3: Alternatives Nesting Structure
Figure 3 presents the nesting structure of our model. The structure shown is intended to capture the
similarity or dissimilarity of alternatives or products. We assume that a household makes a simultaneous
decision rather than a sequential decision regarding the type of electricity products and associated
commitment levels. Formally a three-level nested logit model can be specified as
Pr(twig, branch�, limb�) = ���� =��|�,���|��� where j, k, and l refer to choice of commitment levels, choice of green electricity products and choice of
type of electricity products respectively (for convenience, we have suppressed the subscript associated
with individuals), and
��|�,� =exp(�� !"|#,$) %exp(&'
�()* �� !"|#,$)
��|� =exp(+�,-#|$ +τ�01�) %exp(23
�()* +�,-#|$ +τ�01�)
Type of Electricity Products
Conventional
Green
EarthFriendly EasyGreen
$10/$20/$30/$40/$50/$60/$70/$80 25/50/75/100%
NaturalPower
25/50/75/100%
11
�� =exp(4�56$ +7�08�) %exp(9
�()* 4�56$ +7�08�)
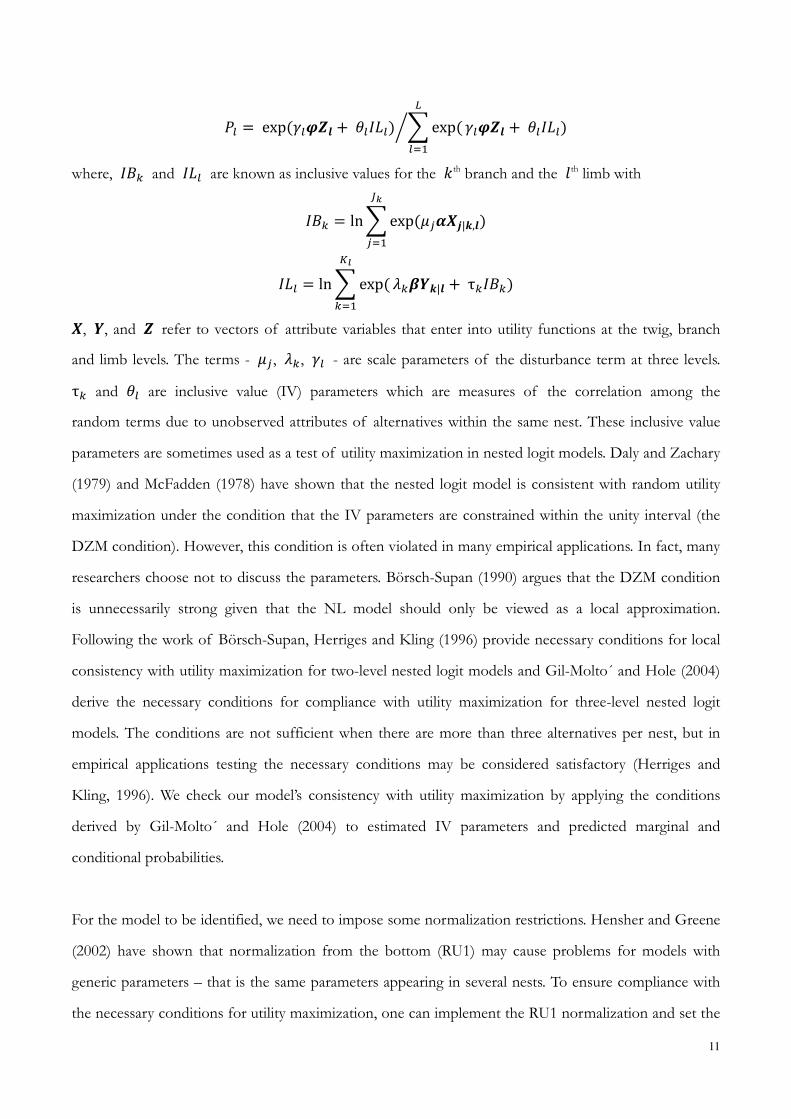
where, 01� and 08� are known as inclusive values for the �th branch and the �th limb with
01� = ln%exp(�� !"|#,$)&'
�()
08� = ln%exp(23
�()+�,-#|$ +τ�01�)
!, -, and 6 refer to vectors of attribute variables that enter into utility functions at the twig, branch and limb levels. The terms - �� , +�, 4� - are scale parameters of the disturbance term at three levels. τ� and 7� are inclusive value (IV) parameters which are measures of the correlation among the random terms due to unobserved attributes of alternatives within the same nest. These inclusive value
parameters are sometimes used as a test of utility maximization in nested logit models. Daly and Zachary
(1979) and McFadden (1978) have shown that the nested logit model is consistent with random utility
maximization under the condition that the IV parameters are constrained within the unity interval (the
DZM condition). However, this condition is often violated in many empirical applications. In fact, many
researchers choose not to discuss the parameters. Börsch-Supan (1990) argues that the DZM condition
is unnecessarily strong given that the NL model should only be viewed as a local approximation.
Following the work of Börsch-Supan, Herriges and Kling (1996) provide necessary conditions for local
consistency with utility maximization for two-level nested logit models and Gil-Molto´ and Hole (2004)
derive the necessary conditions for compliance with utility maximization for three-level nested logit
models. The conditions are not sufficient when there are more than three alternatives per nest, but in
empirical applications testing the necessary conditions may be considered satisfactory (Herriges and
Kling, 1996). We check our model’s consistency with utility maximization by applying the conditions
derived by Gil-Molto´ and Hole (2004) to estimated IV parameters and predicted marginal and
conditional probabilities.
For the model to be identified, we need to impose some normalization restrictions. Hensher and Greene
(2002) have shown that normalization from the bottom (RU1) may cause problems for models with
generic parameters – that is the same parameters appearing in several nests. To ensure compliance with
the necessary conditions for utility maximization, one can implement the RU1 normalization and set the

12
IV parameters to be equal at the same level in the nest or use the RU2 normalization (from the top) and
allow the IV parameters to be free between partitions of a nest. Alternatively, one can estimate a
non-normalized nested logit model (NNNL) by either setting the scale parameters to be equal at a level
in the nest or allowing the IV parameters to be free but adding an additional level at the bottom of the
tree through dummy nodes and links. However, there is no a priori reason for restricting equal IV
parameters across nests (as in RU1). Hensher and Greene also show that the application of the RU2
normalization with unrestricted IV parameters in the presence of generic parameters is identical to the
results obtained by estimating a NNNL model with dummy nodes and links. The RU2 specification thus
avoids the need to introduce dummy nodes and links. In our empirical model, we implement the RU2
normalization. We now turn to our empirical identification.
We define utility at the lowest level, i.e. at the commitment level, but assume that there are some cross
utility function parameter restrictions e.g. that the effect of a green product characteristic has the same
effect on utility derived from all commitment levels of that product. We assume that utility of
conventional depends on the total cost, and individual attributes. The utilities for the commitment levels
of each of the green products depends on the attributes of the product, and the total cost and carbon
emission savings at each of the commitment levels. As the premium level differs across products, there is
not a collinear relationship between costs and emissions within the alternatives of a choice set (the lower
the premium, the higher the emissions savings for any particular level of total cost). An alternative
specific constant is introduced for each of the green products (:;<=>, :;<?@, :;<=A) as they are effectively labelled alternatives, and an ASC is introduced for each of the minimum contribution levels
within the products(:;<_C>=>, :;<_C>?@, :;<_C>=A). Green product attributes are effects coded and other variables are described in Table 2.
DEFGHIGJKFGL$ = 56= M)TotalCost + MRFemale + MTHighSchool + MWTertiaryUndergraduate
+ M\TertiaryPostgraduate + M]TradeTAFE + M`ClimateBelief2
+ MdClimateBelife3 + MfGreenParty + M)hTrust1 + M))Trust2
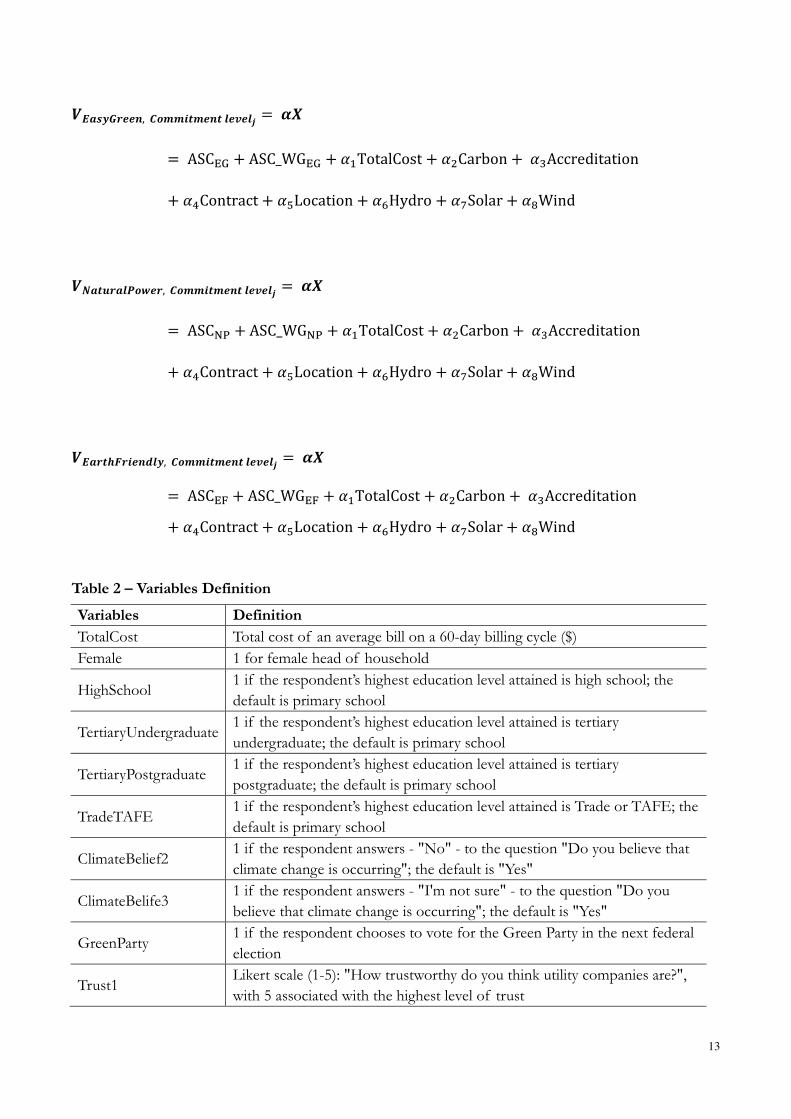
13
DjLklmnIIG,EFooKJoIGJ$IHI$" = !
= ASCpq + ASC_WGpq + s)TotalCost + sRCarbon +sTAccreditation
+ sWContract + s\Location + s]Hydro + s`Solar + sdWind
DuLJvnL$wFxIn,EFooKJoIGJ$IHI$" = !
= ASCyz + ASC_WGyz + s)TotalCost + sRCarbon +sTAccreditation
+ sWContract + s\Location + s]Hydro + s`Solar + sdWind
DjLnJ{|nKIG}$l,EFooKJoIGJ$IHI$" = !
= ASCp~ + ASC_WGp~ + s)TotalCost + sRCarbon +sTAccreditation+ sWContract + s\Location + s]Hydro + s`Solar + sdWind
Table 2 – Variables Definition
Variables Definition
TotalCost Total cost of an average bill on a 60-day billing cycle ($)
Female 1 for female head of household
HighSchool 1 if the respondent’s highest education level attained is high school; the
default is primary school
TertiaryUndergraduate 1 if the respondent’s highest education level attained is tertiary
undergraduate; the default is primary school
TertiaryPostgraduate 1 if the respondent’s highest education level attained is tertiary
postgraduate; the default is primary school
TradeTAFE 1 if the respondent’s highest education level attained is Trade or TAFE; the
default is primary school
ClimateBelief2 1 if the respondent answers - "No" - to the question "Do you believe that
climate change is occurring"; the default is "Yes"
ClimateBelife3 1 if the respondent answers - "I'm not sure" - to the question "Do you
believe that climate change is occurring"; the default is "Yes"
GreenParty 1 if the respondent chooses to vote for the Green Party in the next federal
election
Trust1 Likert scale (1-5): "How trustworthy do you think utility companies are?",
with 5 associated with the highest level of trust

14
Trust2
Likert scale (1-5): "How trustworthy do you think the government's
accreditation and annual auditing of green electricity products is?", with 5
associated with the highest level of trust
Carbon Tonnes of carbon saved each year
Accreditation* 1 for products accredited by the National GreenPower Accreditation
Program
Contract* 1 if the electricity contract is fixed (2 years)
Location* 1 if renewable or offset projects are located in Western Australia
Hydro* 1 if energy source is hydro; the default is bio-energy
Solar* 1 if energy source is solar; the default is bio-energy
Wind* 1 if energy source is wind; the default is bio-energy
* Green products attributes are effects coded.
Although not reported below, we have also investigated whether there are any effects of the level of the
regular charge (beyond the implications for total cost) on choices. Because the regular charge is
constant across all alternatives we do this by introducing it as a factor that may affect only the utility of
the conventional electricity choice. Our prior hypothesis was that a higher regular charge may crowd
out the green products (even if, relatively, costs of all products will be increased/reduced ). We did not
find any evidence of this effect.
5. Results
Table 2 presents our results from a 3-level nested logit model with the RU2 normalization. Most
variables are significant with expected signs. Female customers with higher education levels are more
likely to choose green electricity products. Customers who believe that climate change is occurring, those
who would like to vote for the Green Party, and those who have higher level of trust in utility companies
and government’s accreditation and auditing programs are all also more likely to buy green electricity
products. Among different green electricity products, people favor products that have been accredited by
the NGPAP. Flexible contract terms are preferred. People would like renewable energy projects or
carbon offset projects to be located locally in WA. Among all renewable energy sources, only solar is
significantly favored, which is possibly a reflection of the high penetration of solar energy in the
Australian residential sector. The ASCs for minimum commitment levels are all significant and positive.
Controlling for cost and carbon saved, consumers strongly favor the entry level. In fact, for all cases

15
where a green electricity product is chosen, over 60 percent have selected the minimum commitment
levels – that is, $10 for EasyGreen, 25% for Natural Power and 25% for EarthFriendly. The utility
associated with carbon contribution is out of pure altruism while the utility associated with entry level
ASCs can be interpreted as impure altruism or warm glow effect.
The IV parameters at the branch level are all well within the unity interval. The IV parameter for the
Green limb is larger than unity. This does not necessarily indicate a violation of utility maximization as
nested logit models can be viewed as a local approximation. We thus check our model’s local consistency
with utility maximization by applying the conditions derived by Gil-Molto´ and Hole (2004) to estimated
IV parameters and predicted marginal and conditional probabilities. McFadden (1981) has shown that to
ensure consistency with utility maximization, any set of choice probabilities need to satisfy a number of
conditions including non-negativity, adding-up to unity, translation invariance, equal cross partial
derivatives with respect to utilities, and non-negative even and non-positive odd cross partial derivatives
with respect to utilities depending on the number of alternatives within a choice set. In the case of the
nested logit model only the final condition is restrictive, which is essential for the implied probability
distribution function to be properly behaved, i.e., to have a nonnegative density function. Given our set
structure at limb and branch levels, it is necessary to check the first order condition at the limb level and
second order condition at the branch level. We find that for 97.6% of all choice occasions, our model
passes these conditions. The majority of the small proportion of occasions that fail to pass are
associated with respondents who never make a choice of any green products, i.e., always choose the
conventional product.

16
Table 3 - FIML 3-level Nested Multinomial Logit Model (with RU2 normalization)
Attributes Coefficient Std. Error z Conf. Int. = 95%
Common to all alternatives
TotalCost -.0608*** 0.0035 -17.34 -0.0676 -0.0539
Specific to conventional
Female -.4703*** 0.0623 -7.54 -0.5925 -0.3481
HighSchool -1.3000*** 0.3595 -3.62 -2.0047 -0.5954
TertiaryUndergraduate -1.6378*** 0.3590 -4.56 -2.3413 -0.9342
TertiaryPostgraduate -1.6411*** 0.3625 -4.53 -2.3516 -0.9306
TradeTAFE -1.4948*** 0.3605 -4.15 -2.2013 -0.7883
ClimateBelief2 .8018*** 0.1203 6.66 0.5659 1.0374
ClimateBelife3 .6632*** 0.0812 8.17 0.5041 0.8223
GreenParty -1.0890*** 0.1211 -8.99 -1.3264 -0.8516
Trust1 -.1984*** 0.0365 -5.43 -0.2700 -0.1269
Trust2 -.1826*** 0.0357 -5.11 -0.2526 -0.1125
Specific to green products
Carbon .0253*** 0.0081 3.14 0.0095 0.0410
Accreditation .1227*** 0.0173 7.08 0.0887 0.1567
Contract -.0905*** 0.0192 -4.71 -0.1282 -0.0528
Location .1380*** 0.0182 7.57 0.1023 0.1737
Hydro -0.0121 0.0299 -0.41 -0.0707 0.0464
Solar .0674** 0.0305 2.21 0.0076 0.1271
Wind 0.0192 0.0287 0.67 -0.0370 0.0753
ASC’s for green products
ASCEG -4.6179*** 0.4643 -9.95 -5.5279 -3.7078
ASCNP -5.9997*** 0.8375 -7.16 -7.6412 -4.3582
ASCEF -5.3142*** 0.7583 -7.01 -6.8005 -3.8280
ASC’s for minimum commitment
ASC_WGEG 1.3957*** 0.2505 5.57 0.9047 1.8866
ASC_WGNP 2.2895*** 0.5531 4.14 1.2055 3.3736
ASC_WGEF 1.7591*** 0.5130 3.43 0.7537 2.7644
IV parameters, RU2 form = mu(b|l),gamma(l)
Conventional(BRANCH) 1 .....(Fixed Parameter).....
EasyGreen(BRANCH) .9019*** 0.0981 9.19 0.7096 1.0942
NaturalPower(BRANCH) .5236*** 0.1038 5.04 0.3201 0.7271
EarthFriendly(BRANCH) .7468*** 0.1764 4.23 0.4012 1.0925
Conventional(LIMB) 1 .....(Fixed Parameter).....
Green(LIMB) 1.2935*** 0.0230 56.17 1.2484 1.3386
Restricted log likelihood -10998.68245
Maximized log likelihood -8961.9545
Chi squared [28 d.f.] 4073.4559
Significance level .0000
Number of obs.= 4986
Note: ***, **, * ==> Significance at 1%, 5%, 10% level.

17
Table 4 – Direct and Cross Marginal Effects of a Change in a Product Attribute and Individual Characteristics on the Probability of
Choice at Product$ Level
Attributes
Unconditional Marginal Effects of Attributes of Green Electricity†
Change in EasyGreen
on
C EG NP EF
Change in Natural Power
on
C EG NP EF
Change in Earth Friendly
on
C EG NP EF
Accreditation -0.0161, 0.0393, -0.0132, -0.0101 -0.0212, -0.0134, 0.0477, -0.0131 -0.0163, -0.0099, -0.0132, 0.0394
Contract 0.0112, -0.0290, 0.0097, 0.0074 0.0156, 0.0098, -0.0352, 0.0099 0.0120, 0.0073, 0.0097, -0.0290
Location -0.0180, 0.0442, -0.0151, -0.0111 -0.0239, -0.0151, 0.0539, -0.0149 -0.0183, -0.0113, -0.0148, 0.0443
Solar -0.0091, 0.0221, -0.0074, -0.0056 -0.0119, -0.0074, 0.0266, -0.0074 -0.0095, -0.0057, -0.0075, 0.0227
Premium 0.0058, -0.0096, 0.0021, 0.0016 0.0054, 0.0032, -0.0104, 0.0018 0.0089, 0.0047, 0.0022, -0.0159
Unconditional Marginal Effects of Personal Characteristics †
Variable
on
C EG NP EF Variable
on
C EG NP EF
Female -0.1045, 0.0314, 0.0411, 0.0320 ClimateBelief3 0.1506, -0.0451, -0.0594, -0.0461
HighSchool -0.2692, 0.0790, 0.1082, 0.0820 GreenParty -0.2194, 0.0668, 0.0851, 0.0675
TertiaryUndergraduate -0.3441, 0.1015, 0.1376, 0.1050 Trust1 (1-3) †† -0.0891, 0.0267, 0.0351, 0.0273
TertiaryPostgraduate -0.3448, 0.1017, 0.1379, 0.1052 Trust1 (1-5) ††† -0.1734, 0.0523, 0.0680, 0.0532
TradeTAFE -0.3127, 0.0920, 0.1253, 0.0954 Trust2 (1-3) †† -0.0821, 0.0246, 0.0323, 0.0251
ClimateBelief2 0.1819, -0.0543, -0.0719, -0.0557 Trust3 (1-5) ††† -0.1600, 0.0482, 0.0627, 0.0491 $ C, EG, NP, EF indicate Conventional, Easy Green, Natural Power and Earth Friendly respectively
† Unconditional direct marginal effects at the product level are marked in bold and unbolded numbers are cross marginal effects †† Marginal effects for a change from the lowest level of trust to the medium level of trust ††† Marginal effects for a change from the lowest level of trust to the highest level of trust

18
Table 5 – Unconditional Marginal Effects of a Simultaneous Change in Green Product Attribute Values
across all Products on Probability of Selecting Green Products
Attribute Values Unconditional Marginal Effects
Green Total† EasyGreen NaturalPower EarthFriendly
Accredited 0.0538 0.0160 0.0214 0.0164
Flexible Contract 0.0397 0.0122 0.0157 0.0119
Local Projects 0.0605 0.0180 0.0241 0.0184
Solar (vs. Hydro) 0.0348 0.0103 0.0135 0.0109 ††Total 0.1871 0.0552 0.0748 0.0571
† “Green Total” provides marginal effects on the Green nest of a generic value change †† “Total” gives marginal effects of simultaneous changes for all four green attributes from the baseline
value i.e. of shifting from least preferred to most preferred level
Table 6 – Conditional Marginal Effects of Premium on Commitment Levels
EasyGreen NaturalPower
Commitment Levels Marginal Effects Commitment Levels Marginal Effects
25% 0.0089
$10 0.0156 50% -0.0024
$20 -0.0001 75% -0.0031
$30 -0.0023 100% -0.0034
$40 -0.0030 EarthFriendly
$50 -0.0031 Commitment Levels Marginal Effects
$60 -0.0028 25% 0.0252
$70 -0.0024 50% -0.0056
$80 -0.0019 75% -0.0090
100% -0.0107
Table 4 provides unconditional direct and cross marginal effects of attributes of interest. Unconditional
direct marginal effects represent the change in the unconditional choice probability for an alternative
given a 1-unit change in an attribute of interest for the same alternative, ceteris paribus. Unconditional
cross marginal effects represent the impact that a 1-unit change in an attribute of interest to one
alternative has upon the unconditional choice probabilities of competing alternatives, ceteris paribus.
Direct and cross marginal effects for the each product and each attribute should sum to unity with
possible rounding errors. As suggested by Louviere et al. (2000) we use the probability weighted sample
enumeration (PWSE) rather than sample average or “naïve pooling” to simulate these marginal effects.
As shown in the table, individual characteristics have large impacts on unconditional probabilities of
product choice. The impacts of product attributes on choice probabilities are relatively smaller. This is

19
also confirmed in Table 5 where we provide marginal effects for generic changes to all three green
products in the value of a single green attribute as well as changes to all green attributes. This is to
simulate the situation where a supplier changes the attributes of all the products in their portfolio
simultaneously. Even with all green attributes changing from the most unfavorable values to the most
favorable values generically, the probability of selecting the Green nest increases by only 18.71%. The
decomposition of this change across the three green products is 5.52%, 7.48% and 5.71% for
EasyGreen, NaturalPower and EarthFriendly respectively.
Table 6 reports the conditional (on the product being selected) marginal effect of a change in the
premium on the level of commitment selected. Similarly, conditional marginal effects for each product
should also sum to unity with only rounding errors. Increasing the premium makes the minimum
commitment level more attractive (positive conditional marginal effect) compared to higher commitment
levels (negative conditional marginal effect). However, this effect is very small if one considers that the
maximum difference in premium in our experimental design is 6 cents: the probability of selecting the
minimum commitment increases by only 7.5%, 5% and 10% for the green products for this change in
premium, reflecting the lack of price sensitivity of commitment. This suggests that the (conditional)
price elasticity of demand for green electricity within each product category is very low.
6. Conclusion
This paper has made a number of contributions to understanding consumer preferences for green
electricity products. The design has allowed us to evaluate not just the choice of product, but also the
level of commitment (i.e. the quantity of green power) that consumers purchase. We do that within a
nested logit model that exploits the fact that commitment level in the real market is discrete, and hence
there are limited numbers of levels that are open to consumers.
We find that the decision to opt into the green market is strongly influenced by characteristics of the
individual, with greater participation driven by higher education, and being female. One’s belief in
whether climate change is occurring is also important, which is consistent with a prior expectations:
those who do not see carbon emissions as an issue are not willing to mitigate them. In addition, voting

20
for the Greens party (which may indicate an additional level of environmental commitment, and belief
in the need for change), increases choice of green power. Increased trust in the utility companies and in
government to deliver effective accreditation also increases uptake. This is potentially an area where
more progress can be made, as, on a 5 point ‘trust’ scale, over 85% of respondents rate both utility
companies and government at 3 or below. The nature of the green products themselves seems to have
relatively little impact on demand, although there are preferences for ‘local’ generation and solar power
as the source of the renewable. Comparing Easy Green and Natural Power (where the only substantive
difference in the products offered by Synergy is in the method of making the commitment: fixed
contribution or % of bill), then Natural Power is the preferred product. At the level of commitment,
respondents had a strong preference for the minimum commitment level available, and this is insensitive
to the level of premium. Respondents appear to be willing to pay $2.50 per tonne of carbon emissions
reduced. This is relatively low, and much lower than the current price ($23/t) operating at the national
level. This is consistent with our interpretation of the commitment being made as largely ‘warm glow’,
given the high proportion who are selecting the minimum contribution.
This raises an interesting issue which we can address here: what would the consequences for choices be
if the minimum levels were increased (e.g. from $10 to $40, or from 25% to 50%)? Would adoption of
the green products remain at the current levels?
Our results are also consistent with the market data. The NGPAP releases quarterly report on each
utility company’s aggregated customer numbers and sales for accredited GreenPower products. As
Synergy only has two accredited products – EasyGreen and NaturalPower, the reported statistics covers
these two products only. Assuming a representative household with 15-unit consumption per day, the
latest quarterly statistics translates to a mere 32% average commitment level.
Reference
Andreoni, J. (1989), Giving with Impure Altruism: Applications to Charity and Ricardian Equivalence,
Journal of Political Economy 97: 1447-1458.
Andreoni, J. (1990), Impure Altruism and Donations to Public Goods: A Theory of Warm-Glow Giving,
21
Economic Journal 100: 464-477.
Blamey, R., J. Bennett, J.J. Louviere and M. Morrison (2001), Green Product Choice, in: J. Bennett and R.
Blamey, eds., The Choice Modelling Approach to Environmental Valuation, Edward Elgar, Cheltenham,
UK.
Börsch-Supan, A. (1990), On the compatibility of nested logit models with utility maximization, Journal
of Econometrics 43: 373:388.
Daly, A. and S. Zachary (1979), Improved multiple choice models, in: D. Hensher and Q. Dalvi, eds.,
Identifying and measuring the determinants of mode choice (Teakfield, London) 335-357.
Diaz-Rainey, I. and Tzavara, D (2012), Financing the Decarbonized Energy System Through Green
Electricity Tariffs: A Diffusion Model of an Induced Consumer Environmental Market, Technological
Forecasting and Social Change 79(9): 1693-1704.
Ek, K., P. Söderholm (2008), Norms and economic motivation in the Swedish green electricity market,
Ecological Economics 68: 169-182.
Farhar, B. (1999), Willingness to Pay for Electricity from Renewable Resources: A Review of Utility
Market Research, NREL/TP.550.26148. Golden, CO: National Renewable Energy Laboratory.
Farhar, B.C. and A. H. Houston (1996), Willingness to Pay for Electricity from Renewable Energy,
NERL Report No. TP-460-21216, National Renewable Energy Laboratory, Golden, Colorado, USA.
Goett, A.A., K. Hudson and K.E. Train (2000), Customers Choice among Retail Energy Suppliers: The
Gil-Molto´, M.J. and A.R. Hole (2004), Tests for the consistency of three-level nested logit models with
utility maximization, Economics Letters 85: 133-137.
Willingness-to-Pay for Service Attributes, The Energy Journal 21: 1-28.
Hensher, D.A and W. H. Greene (2002), Specification and estimation of the nested logit model:
alternative normalizations, Transportation Research Part B 36: 1-17.
Hensher, D.A, J.M Rose and W.H. Greene (2005), Applied Choice Analysis A Primer, Cambridge
University Press.
Herriges, J.A. and C.L. Kling (1996), Testing the consistency of nested logit models with utility
maximization, Economics Letters 50: 33-39.
Ivanova, G. (2012), Are Consumers Willing to Pay Extra for the Electricity from Renewable Energy
Sources? An example of Queensland, Australia, International Journal of Renewable Energy Research 2
(4): 758-766.
22
Kotchen, M.J. and M.R. Moore (2007), Private provision of environmental public goods: Household
participation in green-electricity programs, Journal of Environmental and Economics and Management
53: 1-16.
Louviere, J.J., D.A. Hensher and J. Swait (2000), Stated Choice Methods: Analysis and Applications in
Marketing, Transportation and Environmental Evaluation, Cambridge: Cambridge University Press.
McFadden, D. (1978), Quantitative methods for analyzing travel behavior of individuals: Some recent
developments, in: D. Hensher and P. Stopher, eds., Behavioral Travel Modelling (Croom Helm, London)
279-318.
McFadden, D. (1981), Econometric models of probabilistic choice, in: C.F. Manski and D. McFadden,
eds., Structural analysis of discrete data with econometric applications (MIT Press, Cambridge, MA).
Menges, R., C. Schroeder and S. Traub (2005), Altruism, Warm Glow and the Williness-to-Donate for
Green Electricity: An Artefactual Field Experiment, Environmental and Resource Economics 31:
431-458.
Mewton, R.T and O.J. Cacho (2011), Green Power voluntary purchases: Price elasticity and policy
analysis, Energy Policy 39: 377-385.
Navrud, S. and K.G. Bråten (2007), Consumers’ Preferences for Green and Brown Electricity: a Choice
Modelling Approach, Revue d'économie politique 5 (117): 795-811.
Nomura, N. and M. Akai (2004), Willingness to pay for green electricity in Japan as estimated through
contingent valuation method, Applied Energy 78: 453-463.
Rowlands, I., D. Scott and P. Parker (2003), Consumers and green electricity: Profiling potential
purchasers, Business and Strategy and the Environment 12: 36-48.
Salmela, S. and V. Varho (2006), Consumers in the green electricity market in Finland, Energy Policy 34:
3669-3683.
Scarpa, R. and K. Willis (2010), Willingness-to-pay for renewable energy: Primary and discretionary
choice of British households’ for micro-generation technologies, Energy Economics 32: 129-136.
Wiser, R.H. (2007), Using contingent valuation to explore willingness to pay for renewable energy: A
comparison of collective and voluntary payment vehicles, Ecological Economics 62: 419-432.

![Discrete Choice Modeling - pages.stern.nyu.edupages.stern.nyu.edu/~wgreene/DiscreteChoice/2014/... · [Part 8] 3/26 Discrete Choice Modeling Nested Logit Correlation Structure for](https://img.pdfslide.net/doc/110x75/5fd89d10161e3b1e8e50006b/discrete-choice-modeling-pagessternnyu-wgreenediscretechoice2014-part.jpg)


![[Part 8] 1/26 Discrete Choice Modeling Nested Logit Discrete Choice Modeling William Greene Stern School of Business New York University 0Introduction](https://img.pdfslide.net/doc/110x75/5a4d1b717f8b9ab0599b547e/part-8-126-discrete-choice-modeling-nested-logit-discrete-choice-modeling-william.jpg)