Embed Size (px)
Citation preview
SP-579-09-03E

September 2003

1A New Generation of Canadian Families Raising Young Children
What a difference a generation canmake! When Canadian parents lookback on their own lives and thelives of their parents, they seechanges across a generation thathave profoundly affected theirparenting experience, compared towhen they themselves were youngchildren. Supports for today’sparents must take into considerationthese changes that affect the careand nurturing of children.
Over the past two decades, thefamily environment in which youngchildren have grown up in Canadahas changed dramatically. Today,most young women complete theireducation and begin their careersbefore they have children. Babiesare born into many different typesof families — married couples,common-law couples, single parentfamilies, and blended families.Many children — even in the firstfive years of their lives — willexperience a change in their familycircumstances as their parents
separate or divorce, marry orremarry. Today, most youngchildren have two parents who bothhold jobs in the paid workforcebecause today it more often takestwo earners to maintain a desirablefamily income. Nonetheless, moreparents understand the importanceof the first five years and, despitetoday’s pressures of balancing workand family, they spend more timewith their young children thanparents did a decade ago. Today,young children are surrounded bymore adults than children were ageneration ago, mainly due to therising importance of caregivers in a child’s life. The following pagesvisually show how these changesrelate to child development andexplain how families have adaptedtheir parenting roles. On each page,findings from current research areused to discuss the implications ofthe data presented in the chart. In the concluding section, policies to support families with youngchildren are described.
Introduction

A New Generation of Canadian Families Raising Young Children
Data:Since the 1960s, the average ageof mothers at the birth of theirfirst child has been increasingsteadily, along with a decrease inthe total number of childbirths.1
By the mid-1990s, the proportionof women over 40 giving birthsurpassed the proportion ofwomen aged 15-19 years givingbirth.2 This is different from theperiod 1940 to 1965 when fertilityrates were higher and maternalage decreased steadily.1
Research:On average, mothers are moreeducated and start their careersbefore having children. Childrenof these mothers are born intofamilies with higher incomes,more stable careers and fewersiblings.3 However, older mothersmay be at higher risk forcomplications during pregnancy.4
1 Bélanger, A. (2002). Report on the demographic situation in Canada 2001: Current demographic analysis for Canada.Statistics Canada. 91-209-XPE.
2 Labour Force Survey, microdata files. 3 Ross, D.P., Scott, K., & Kelly, M.A. (1996). Overview: Children in Canada in the 1990s. In Growing up in Canada.
Human Resources Development Canada & Statistics Canada.4 Canadian Perinatal Health Report 2000. (2000). Health Canada. H49-142/2000E.
Source:Health Statistics Division,
Statistics Canada1
2
Trends in maternal age at the birth of the first child,1944-1999
Today, canadian mothers are older at the birth of their first child
compared to mothers in the 1960s.
1944 1949 1954 1959 1964 1969 1974 1979 1984 1989 1994 1999
Year
Mot
hers
’ age
(in
year
s) a
t the
firs
t chi
ldbi
rth
21
22
23
24
25
26
27
28

Data:Since the 1980s, the percentage ofmothers with young children whohave a university degree or collegediploma has been increasingsteadily. At the same time, theproportion of women withsecondary school education or lesshas been decreasing. Today, morewomen graduate from universitywith bachelor’s and master’sdegrees than men. More men thanwomen graduate with doctorates,but the gap is narrowing.5
Research:Maternal education level ispositively associated with childoutcomes such as academicachievement. Higher maternaleducation levels are also linked tohigher family income and with theamount of time parents spendencouraging and helping childrenwith schoolwork.6
3A New Generation of Canadian Families Raising Young Children
Source:Censuses – Statistics Canada
3
University degree Secondary completed or trade certificate
Some post-secondary Secondary incomplete or less
1981 1986 1991 1996Census Year
0%10%20%30%40%50%60%70%80%90%
100%
8.7
32.5
22.8
36.0
12.0
34.3
21.7
31.9
14.6
38.4
22.5
24.5
20.4
42.6
19.2
17.8
Trends in the percentage of highest education levelsattained by mothers of young children (age 0-5 years),
1981-1996
5 National Graduate Survey – The Class of 1995. Human Resources Development Canada & Statistics Canada.6 Ross, D.P., Scott, K., & Kelly, M.A. (1996). Overview: Children in Canada in the 1990s. In Growing up in Canada.
Human Resources Development Canada & Statistics Canada.
Today, mothers of young children are more educated.

Source:National Longitudinal
Survey of Children andYouth, (NLSCY) Cycle 3,
1998-99
A New Generation of Canadian Families Raising Young Children 4
Children with mothers who havehigher education levels are less likely
to have delayed vocabulary skills.
Data:Most children have normal oradvanced vocabulary skills at age4-5 years. Children whose mothershave a university or college degreeare much less likely to have lowvocabulary scores7 than childrenwhose mothers have secondaryschool graduation or less.
Research:Current research suggests thatmaternal education has animportant effect on childoutcomes, particularly cognitiveoutcomes.8 Vocabulary skills arean important cognitive measurefor children aged 4-5, and areconsidered a good predictor ofearly literacy at age 8-9.9
7 The Peabody Picture Vocabulary Test-Revised (PPVT-R) is a measure of receptive vocabulary skills for children.8 Willms, J.D. (2002). Research findings bearing on Canadian social policy. In J.D. Willms (ed.) Vulnerable children.
University of Alberta Press & Applied Research Branch, Human Resources Development Canada.9 Hoddinott, J., Lethbridge, L., & Phipps, S. (in press). Is history destiny? Resources, transitions and child education
attainments in Canada. Applied Research Branch, Human Resources Development Canada.
010
20
30
40
50
60
70
80
Less than secondarySecondary school graduation
Some post secondary educationUniversity or college degree
Delayed
* – marginal data quality
AveragePPVT score categories7
Mother’s level of education
Perc
enta
ge o
f chi
ldre
n ag
ed 4
-5 ye
ars
Advanced
29.7
18.5 179.7
62.1
72.6 72 72.2
8.3* 8.9 1117.7
Mothers’ level of education and their children’svocabulary scores (age 4-5 years), 1998/99

Source:Labour Force Survey, PublicUse Micro-file
5A New Generation of Canadian Families Raising Young Children
Today, in most Canadian families,both parents are employed.
10 Due to data collection problems, data for 2000 has been omitted.11 Silver, C. (2001, Summer) Being there: The time dual-earner couples spend with their children. Canada Social Trends.
Statistics Canada.
Data:In previous generations, mostmothers were at home throughoutthe day to look after the children.However, by the mid-1980s, mostmothers had paid employment.Today most young children havetwo employed parents and mostsingle parents also have payingjobs.
Research:Although today more parents areemployed, on average, mothers ofyoung children report workingfewer hours of paid workcompared to their spouses or towomen with older children.11
Trends in dual earner and single earner families,1976-200110
1976 1978 1980 1982 1984 1986 1988 1990 1992 1994 1996 1998 2001
Year
Perc
enta
ge o
f fam
ilies
with
child
ren
unde
r 6 y
ears
0
10
20
30
40
50
60
70
Two parent family, both parents work
Two parent family, one parent works Single parent family, parent works
No earners (two parents or single parent)

Source:Labor Force Surveys -
Statistics Canada
A New Generation of Canadian Families Raising Young Children 6
Today, a higher proportion ofemployed mothers are staying at
home with their infants.
Data:Today, fewer mothers withchildren under one year are at paid work than were motherswith infants in the 1980s and the1990s. Today, more employedmothers with children under oneare staying at home with theirchildren than were mothers withinfants in the 1970s and the1980s. The most recent data isalso beginning to reflect the effect of extended maternity andparental leave, with a sharpincrease in the percentage ofmothers employed but absent from work.
Research:Many more mothers of youngchildren have been moving into orstaying in the workforce than inprevious generations of mothers.For employed mothers, the qualityof the time that they spend withtheir children is also veryimportant. Secure attachmentbetween mothers and infants isassociated with successfulcognitive, social and emotionaldevelopment throughoutchildhood.13
12 Due to data collection problems, data for 2000 has been omitted.13 Butkatko, D., and Daehler, M.W. (2001), Child development: A thematic approach. Houghton Mifflin Company, Boston.
Trends in labour market participation rates and employmentstatus of women with children under 6 years, 1976-200112
1976 1978 1980 1982 1984 1986 1988 1990 1992 1994 1996 1998 2001
Year
Perc
enta
ge o
f mot
hers
0
10
20
30
40
50
60
70
Mother with child <1, employed, at workMother with child <1, employed, absent from work Mother with child 1-3, employed, at work
Mother with child 4-5, employed, at work

Source:Eurostat, Canadian Census(1996)
7A New Generation of Canadian Families Raising Young Children
Compared to European countries,Canada has a relatively high
proportion of mothers employed.
14 The three highest and three lowest European countries for which data was available are shown for comparison. Eurostat data only represents women who were a reference person or a spouse of a reference person. The CanadianCensus data is slightly more inclusive than the Eurostat data, but the Canadian employment rate is not greatly affected.
15 Statistics Canada. (1999). Characteristics of dual-earner families: 1997. Ottawa: Statistics Canada. 13-215-X1B16 Statistics Canada. (2001). Income in Canada: 1999. Ottawa: Statistics Canada. 75-202-XPE
Data:Compared to the countries in theEuropean Union, Canada has oneof the highest proportions ofemployed mothers with youngchildren, with only Poland,Austria and Belgium havinghigher percentages. Theemployment rates of mothers with young children in Spain,Luxembourg and Italy, each at less than 50 per cent, are amongthe lowest.
Research:Current research has shown thatfamilies with both parentsemployed are more commontoday. The income generated bymothers entering the paidworkforce accounts for a growingproportion of family income.15
Over the last two decades, it hasbecome increasingly apparent thattwo earners are often necessary tomaintain the standard of living inthe family. The median income of two-parent families increasedonly slightly over the past decade,despite the increase in the numberof families with both parentsworking.16
Employment rate of women with at least one child under 6 years in Canada and selected European countries, 199614
Canada Poland Austria Belgium Italy Luxemborg
Country
Perc
enta
ge o
f em
ploy
ed m
othe
rs
with
you
ng ch
ildre
n
Spain0
10
20
30
40
50
60
70
80
60
68.863.8 62.6
41.9 4035.5

Source:Labour Force Survey -
Statistics Canada
A New Generation of Canadian Families Raising Young Children 8
Today, most young children live with two parents.
Data:While the number of marriedfamilies with young childrendeclined slightly over the past 25 years, almost 90 per cent ofchildren aged 0-5 years live withtwo parents. These marriedfamilies include both blendedfamilies and intact families.18
The percentage of single parentfamilies has increased over the last decade and, according to the2001 Census, is now 15.7 per centof all families with children.
Research:Since the majority of couples bothhave paid employment, childrenwith two parents are likely to beraised in families with higherincomes. On the other hand, inorder to more clearly capture theimpact of having both parentsinvolved in paid employment, it is important to look at how thisinfluences the way parents arrangechild care for their children, andwhether they are able to spend theamount of quality time they wantwith their children. Single parentfamilies have lower incomes, onaverage, than two parent families(see page 14).
17 Due to data collection problems, data for 2000 has been omitted.18 Blended families refer to married or common-law couples with 2 or more children, where one child does not have the
same natural and/or adoptive parents as the other child or married or common-law couples where at least one child isin a step-relationship with at least one of the parents. Intact families refer to married or common-law couples where allof the children are the natural and/or adopted offspring of both members of the couple. This does not include fosterchildren.
Trends in the percentage of married women withchildren under 6 years, 1976-200117
1976 1978 1980 1982 1984 1986 1988 1990 1992 1994 1996 1998 2001
Year
Perc
enta
ge o
f wom
en w
ith ch
ild 0
-5
5055
60657075
80859095
100

Source:General Social Survey (Time Use) 1986, 1992 and1998 - Statistics Canada
9A New Generation of Canadian Families Raising Young Children
Today’s generation of employedparents spend more time with their
young children.
19 Time spent with children refers to the amount of time spent with the child by one or both parents and includes caringfor the child.
20 Zuzanek, J. (2001, Summer). Parenting time: Enough or too little? Isuma. Les presses de l’université de Montréal.
Data:The amount of time employedmarried parents spend directlywith their young children hasbeen steadily increasing over thelast decade.19
Research:Most parents recognize theimportance of the early years.Current research suggests that thelargest increase in time spent withchildren was seen among parentswith at least one child less than 6 years of age. Despite theincrease in time pressure arisingfrom balancing work and familywhen both parents are employed,parents are finding even moretime for their young children.20
Trends in time spent with children aged 0-5 years by an employed, married parent, 1986-1998
Total direct child carePhysical child care
Socializing, playingChild-related travel
1986
Min
utes
per
day
020406080
100120140160180
Part-timejob
Full-timejob
Total
1992
Part-timejob
Full-timejob
Total
1998
Part-timejob
Full-timejob
Total

Source:National Longitudinal
Survey of Children andYouth, (NLSCY) 1998-99
A New Generation of Canadian Families Raising Young Children 10
Of children currently in child care, childrenin the highest 10% of family income are most
likely to be cared for by a non-relative.
Data:In Canada, about half of childrenaged 0-5 years are in child care.Of these children, 55 per cent ofthose in families with the highestincomes are cared for by a non-relative, whereas only 26 per centof the lowest-income children arecared for by a non-relative. Mostlow-income children are cared forby a relative or are in subsidizedcentre-based care such as daycarecentres or nursery schools.
Research:Sustained, quality child care mayprovide the most benefit tochildren in the lowest familyincome group. Recent researchsuggests that low-income childrenreceiving child care hadvocabulary scores similar to thoseof children from higher-incomefamilies and higher than those of low-income children not inchild care.21 The number ofchildren cared for by a singleprovider, the level of training, and the types of stimulation andactivities provided can all impactchild development.22
21 Seifert, T., Canning, P, & Lindermann, B. (2001). A study of family, child care and well-being in young Canadianfamilies. Applied Research Branch, Human Resources Development Canada.
22 Doherty, G., Lero, D.S., Goelman, H., Tougas, J., & LaGrange, A. (2000). You bet I care! Caring and learningenvironments: Quality in regulated family child care across Canada. Centre for Families, Work and Well-Being,University of Guelph.
Family income level and type of child care arrangementsfor children aged 0-5 years, 1998/99
1 2 3 4 5 6 7 8 9 10
Income Level Groups (Deciles)
Perc
enta
ge o
f chi
ldre
n
0
10
20
30
40
50
60
Care by a non-relative (both in and outside home)
Care by a relative (both in and outside home)
Daycare, Nursery School,and other arrangements
Lowest 10% Highest 10%

Source:Adapted from Marcil-Gratton(1998)
11A New Generation of Canadian Families Raising Young Children
Today, about 1 in 4 children experienceparental separation before age 6.
23 Marcil-Gratton, N. (1998). Growing up with Mom and Dad? Children and family instability. Applied Research Branch,Human Resources Development Canada.
24 Labour Force Survey Data File.25 Haddad, T. (1998). Custody arrangements and the development of emotional or behavioural problems in children.
Applied Research Branch, Human Resources Development Canada. W-98-9E.26 Ross, D.P., Roberts, P.A., & Scott, K. (1998). Mediating factors in child development outcomes: Children in lone-parent
families. Applied Research Branch, Human Resources Development Canada. W-98-8E.27 O’Connor, T.G., & Jenkins, J.M. (2001). Marital transitions and children’s adjustment: Understanding why families
differ from one another and why children in the same family show different patterns of adjustment. Applied ResearchBranch, Human Resources Development Canada. W-01-1-3E.
Data:Over the last three decades, thepercentage of young children whoseparents separated increased threefold.About 23 per cent of childrengrowing up in the 1990s experiencedparental separation before their 6thbirthday, compared to about 8 percent of children growing up in the1960s.23 However, most childrencontinue to live in two parentfamilies, either blended or intact.24
Research:Significant changes in the child’sfamily are occurring earlier in life.Children may also experience
family disruption at older ages.Children benefit from havingrelationships with both biologicalparents.25 Whenever there is achange in family structure, theremay be short-term and long-termimpacts on children’s outcomes.Parental separation can haveeffects on the behaviour of thechild, sometimes resulting inemotional problems. Parentalseparation can also have effects onfamily income.26 However, otherfactors in the child’s environmentmay mitigate the effects of earlyparental separation.27
Trends in child’s age at their parents’ separation, 1960s-1990s
0 1 2 3 4 5 6 7 8 9 10 11 12 13 14 15 16 17 18 19 20
Child’s Age (Years)
Perc
enta
ge o
f chi
ldre
n bo
rn to
a lo
ne p
aren
t or
exp
erie
ncin
g pa
rent
al se
para
tion
0
5
10
15
20
25
30
Children born in 1987-88Children born in 1983-84
Children born in 1971-73Children born in 1961-63

Source:National Longitudinal
Survey of Children andYouth, (NLSCY) Cycle 3,
1998-99
A New Generation of Canadian Families Raising Young Children 12
Family structure has little impact onvocabulary development for
children aged 4-5 years.
Data:Children living in single-parentfamilies are no more likely to havedelayed vocabulary scores thanchildren living in two-parentfamilies. In the chart above, thereare no statistically significantdifferences between children fromtwo-parent and single-parentfamilies.
Research:Children appear to be most at risk for experiencing difficultiesimmediately after parentalseparation.29 However, whenprotective factors such as positiveparenting practices are present,parental separation may have onlyminimal effects on children’sdevelopment, includingvocabulary skills.30
28 The Peabody Picture Vocabulary Test-Revised (PPVT-R) is a measure of receptive vocabulary skills for children.29 Haddad, T. (1998). Custody arrangements and the development of emotional or behavioural problems in children.
Applied Research Branch, Human Resources Development Canada. W-98-9E.30 O’Connor, T.G., & Jenkins, J.M. (2001). Marital transitions and children’s adjustment: Understanding why families
differ from one another and why children in the same family show different patterns of adjustment. Applied ResearchBranch, Human Resources Development Canada. W-01-1-3E.
Family structure and children’s vocabulary scores (age 4-5 years), 1998/99
Two-parent family Single-parent family
Delayed AveragePPVT28 score categories
Perc
enta
ge o
f chi
ldre
n ag
ed 4
-5 y
ears
Advanced0
10
20
30
40
50
60
70
80
15.4 17.0
71.2 70.6
13.4 12.4

Source:National LongitudinalSurvey of Children andYouth, (NLSCY) Cycle 3,1998-99
13A New Generation of Canadian Families Raising Young Children
Boys in single-parent families are more likely to have high levels
of aggression.
31 Ross, D.P., Roberts, P.A., & Scott, K. (1998). Variations in child development outcomes among children living in lone-parent families. Applied Research Branch, Human Resources Development Canada. W-98-7E
32 Baillargeon, R., Tremblay, R.E., & Willms, J.D. (1999). The prevalence of physical aggression in Canadian children: A multi-group latent class analysis of data from the first collection cycle (1994-1995) of the NLSCY. Applied ResearchBranch, Human Resources Development Canada. T-00-2E.
33 Kerr, D., & Beaujot, R. (2001). Family relations, low income and child outcomes: A comparison of Canadian children inintact, step and lone-parent families. University of Western Ontario, Population Studies Centre.
Data:The majority of 4-5 year-oldchildren do not have high levels of physical aggression. However,almost one in four boys in single-parent families is highly aggressiveas reported by their parents.Aggressive behaviour is morecommon among girls living insingle-parent families than girlsliving in two-parent families.However, when compared withboys in either two-parent or single-parent families, girls living insingle-parent families appear lesslikely to be physically aggressive.
Research:In recent surveys, many singleparents report that their childrenhave more developmentaldifficulties, including higher levelsof aggression among children aged 4-5 years.31 Furthermore, highlevels of aggression are morecommon among boys than girls32,and boys appear to be morevulnerable than girls in single-parent families.33 However, familystructure is only one of many factors related to a child’saggressive behaviour.
Family structure and aggressive behaviour of boys and girls (age 4-5 years), 1998/99
Girls in two-parent familiesGirls in single-parent families
Boys in two-parent familiesBoys in single-parent families
Scores Below Threshold For High Aggression
* - marginal data quality
Perc
enta
ge o
f chi
ldre
n
High Aggression Scores0
102030405060708090
10089.2 85.7
81.075.3
10.8*14.3
19.024.7

Source:National Longitudinal
Survey of Children andYouth, (NLSCY) Cycle 3,
1998-99
A New Generation of Canadian Families Raising Young Children 14
Single-parent families with youngchildren are more likely to have
low incomes.
Data:Most children aged 4-5 years areliving in intact families. There are more intact families amonghigher-income groups. About 7 per cent of children from allincome groups live in blendedfamilies.34
Research:Changes in marital status, eitherby divorce or by remarriage, areassociated with vulnerability inchildren.35 By virtue of the factthat single parents only have one income they are more likelyto have low family incomes.36
Low-income families face morechallenges and stresses in raisingtheir children.
34 Blended families refer to married or common-law couples with 2 or more children, where one child does not have thesame natural and/or adoptive parents as the other child or married or common-law couples where at least one child is in a step-relationship with at least one of the parents. Intact families refer to married or common-law couples whereall of the children are the natural and/or adopted offspring of both members of the couple. This does not include fosterchildren.
35 Applied Research Bulletin, a Special Edition on Child Development. Applied Research Branch, Human ResourcesDevelopment Canada. Fall 1999.
36 Statistics Canada. (2001). Income in Canada: 1999. Ottawa: Statistics Canada. 75-202-XPE
Single-parent Family Intact Family Blended Family
1Lowest 20% Highest 20%
2
Income Level Groups (Quintiles)
Perc
enta
ge o
f chi
ldre
n ag
ed 4
-5
3 4 50102030405060708090
100
6.7 9.4
78.8
44.4
11.9
8.0
85.2
6.8
6.8
89.3
3.9
4.8
94.1
1.1
48.9
Family structure and family income for children (age 4-5 years), 1998/99

Source:Survey of Consumer Finances(1984-1995)Survey of Labour and IncomeDynamics (1996-2000)
15A New Generation of Canadian Families Raising Young Children
After a period of decline in the early 1980s,the ratesof young children living in low income families have
fluctuated but remained above the 1989 level.
37 Due to the content of the Survey of Consumer Finances, the chart refers to children under 7 years and LICO for 1992 was used.38 National Council of Welfare. (1998). Child Poverty 1998.39 Ross, D.P., & Roberts, P. (1999). Income and Child Well-being: A new perspective on the poverty debate. Ottawa:
Canadian Council on Social Development.
Data:In 1989, the percentage ofchildren under 7 living in low-income families — families withincome below the 1992 after-taxLow-Income Cut-Off (LICO) — wasat its lowest point, at 13 per cent.Rates of children living below theLICO have fluctuated with thebusiness cycle, but have remainedabove the 1989 level.
Research:The likelihood of poor outcomes is higher for children living inpoverty. However, most poorchildren do not have pooroutcomes. Low-income can affectchild outcome in two ways, eitherdirectly through lower resourcesor indirectly through relatedfamily factors. Aboriginal children are at higher risk, withapproximately 60 per cent ofAboriginal children living inpoverty.38 Children from low-income families are much morelikely to be living with a parentwith frequent signs of depression.39
1984 1986 1988 1990 1992 1994 1996 1998 2000
Year
Perc
enta
ge o
f fam
ilies
with
child
ren
aged
0-6
yea
rs
0
5
10
15
20
25
30
LICO before tax LICO after tax
Trends in the percentage of children (under age 7 years)living below the Low-Income Cut-Off (LICO), 1984-200037

Source:National Longitudinal
Survey of Children andYouth, (NLSCY) Cycle 3,
1998-99
A New Generation of Canadian Families Raising Young Children 16
Young children from low-income families are more likely to have
vocabulary problems.
Data:Most children are developingvocabulary skills appropriate fortheir age. Children withvocabulary difficulties come fromall income groups. Nonetheless,there is a relationship betweenincome and low PPVT scores40,and the gradient shows adeclining percentage of low scoresas income increases. In Canada, alarger percentage of children fromlow-income families have lowvocabulary scores than childrenfrom high-income families.
Research:Research has shown that thevocabulary skills at ages 4-5 yearsare good predictors of early literacywhen children reach 8-9 years.Young children who have lowvocabulary scores are more likely tohave low reading scores when theyget older, whereas young childrenwith high vocabulary scores aremore likely to have higher readingscores at age 8-9. However, it isimportant to note that research alsoindicates that income is not theonly factor that influenceschildren’s vocabulary development.Other factors, such as parentaleducation and good parenting, havepositive impacts on vocabularyscores and school success.41
40 The Peabody Picture Vocabulary Test-Revised (PPVT-R) is a measure of receptive vocabulary skills for children.41 Hoddinott, J., Lethbridge, L., & Phipps, S. (in press). Is history destiny? Resources, transitions and child education
attainments in Canada. Applied Research Branch, Human Resources Development Canada.
Low vocabulary scores
Lowest 10%
* - marginal data quality
Income Level Groups (Deciles)
Perc
enta
ge o
f chi
ldre
n ag
ed 4
-5 y
ears
Highest 10%
0
5
10
15
20
25
30
1
25.8 27.024.8
16.218.0 17.4*
11.0*
8.6* 9.4*
5.2*
2 3 4 5 6 7 8 9 10
Family income and low vocabulary scores in children(age 4-5 years), 1998/99

Source:National LongitudinalSurvey of Children andYouth, (NLSCY) Cycle 3,1998-99
17A New Generation of Canadian Families Raising Young Children
Young children from higher-incomefamilies are more likely to participate
in more recreational activities.
42 Activities include sports with a coach; unorganized sports without a coach; dance, gymnastics, martial arts with acoach; community programs with leader; music/art lessons.
43 Offord, D.R, Lipman, E.L, & Duku, E.K. (1998). Sports, the arts and community programs: Rates and correlates ofparticipation. Applied Research Branch, Human Resources Development Canada. W-98-18E.
Data:Approximately 80 per cent ofchildren aged 4-5 years participatein at least one recreational activitysuch as sports, music, or the arts.Children in families with higherincomes are more likely toparticipate in more recreationalactivities.
Research:Early childhood activities build the foundation for core skills andsuccess in school. Children learnto socialize with other childrenduring activities, including sportsand arts activities. Research shows that children’s participationin early childhood activities,particularly supervised sports, is strongly associated with theincome level of their parents.43
Family income and participation of children (age 4-5 years) in recreational activities,42 1998/99
1 2 3 4 5 6 7 8 9 10
Income Level Groups (Deciles)
Perc
enta
ge o
f chi
ldre
n ag
ed 4
-5
0
10
20
30
40
50
60
70
80
0-1 types of activities 2 or more types of activities
Lowest 10% Highest 10%

A New Generation of Canadian Families Raising Young Children 18
Source:OECD Health Data 2002
Canada’s rate of improvement inreducing infant mortality rates has beenslower than other developed countries.
44 Group of Seven: Major industrial countries in the world, consisting of Canada, France, Germany, Italy, Japan, the United Kingdom and the United States.
45 International comparisons should be interpreted with caution. The World Health Organization recommends thatinternational comparisons of infant mortality rates include only live births greater than 1000g. Canada reports birthsless than 500 g more often than some OECD countries, which may account for a higher infant mortality rate.
46 Federal/Provincial/Territorial Advisory Committee on Population Health (1999). Toward a healthy future: Second reporton the health of Canadians. Health Canada. H39-468/1999E.
Data:Canada’s infant mortality rate (thenumber of infant deaths per 1000live births) has improved from1985 to 1999. However, among G7countries44, Canada’s rate ofimprovement has been slower thanall other countries except theUnited States45. In terms of infantmortality rate, Canada ranked 6thamong G7 countries in 1985, butranked 3rd highest in 1999.
Research:Infant mortality rates are acommonly used and well-established measure of social andeconomic development as well aschild health and well-being.Research has shown that infantmortality rates are influenced by a number of factors, includingcongenital anomalies, suddeninfant death syndrome andadvances in medical science,nutrition and prenatal care.46
Infant mortality rates in Canada and other G7 countries44, 1985-1999
1985
8.0
5.3
8.3
4.3
8.9
4.5
10.59.4
5.1 5.5
3.4
5.8
10.6
7.1
1999
Canada France Germany Italy Japan UnitedKingdom
UnitedStates
Infa
nt m
orta
lity
per 1
000
live
birt
hs
0
2
4
6
8
10
12

19A New Generation of Canadian Families Raising Young Children
Source:Statistics Canada: Birthsand Deaths Database;Canada Yearbook 1985
Since 1960, the Canadian infant mortalityrate has dropped sharply and the gap
between boys and girls has narrowed.
Data:Since 1960, the overall infantmortality rate (the number ofinfant deaths per 1000 live births)for Canada has dropped sharply.During the same period, the infantmortality rate for boys hasdropped more than for girls.
Research:Male infants are at higher risk forlow birth weight, respiratoryproblems and hospitalization, whichmay account for their consistentlyhigher infant mortality rates.48
Recently, there has been an increasein the number of low birth weightbabies surviving birth, which slowsthe reduction of the infant mortalityrate.49 Children with low birth weightare at higher risk for early death andfor physical and developmentaldelays.50 It is therefore important tolook at parents’, in particularmothers’, health practices that haveproven to have a direct impact onchild health.
47 Infant mortality is defined as the number of deaths of children < 1 year of age per 1000 live births.48 Gender: Fact Sheet. (2002). Health Canada, Strategic Policy and Research.49 Canadian perinatal health report 2000. (2000). Health Canada. H49-142/2000E.50 Federal/Provincial/Territorial Advisory Committee on Population Health. (1999). Toward a healthy future: Second report
on the health of Canadians. Health Canada. H39-468/1999E.
Canadian infant mortality47 trends by gender,1960-1999
Year
Infa
nt m
orta
lity
per 1
000
live
birt
hs
0
5
10
15
20
25
30
35
Boys Girls
1960 1965 1970 1975 1980 1985 1990 1995

A New Generation of Canadian Families Raising Young Children 20
Mothers who smoke during pregnancyare more likely to give birth to a child
with low birth weight.
51 12 cigarettes per day represents approximately 1/2 pack of cigarettes per day. 52 Moner, S.E. (1994). Smoking and pregnancy. In Canadian Task Force on the Periodic Health Examination.
The Canadian guide to clinical preventative health care. H21-117/1994E.53 Connor, S.K. & McIntyre, L. (2002) The effects of smoking and drinking during pregnancy. In J.D. Willms (ed.)
Vulnerable Children. University of Alberta Press & Applied Research Branch, Human Resources Development Canada.
Data:Almost 20 per cent of mothers of 0-1 year-old children smokedduring pregnancy. These childrenare up to twice as likely to havelow birth weight. Furthermore,among mothers who smoke duringpregnancy, children of heavysmokers are more likely to havelow birth weight than children oflight smokers (less than half adozen cigarettes a day).
Research:Recent research has demonstratedthat maternal smoking duringpregnancy is a leading cause oflow birth weight in developedcountries.52 Low birth weight is associated with increasedmortality, as well as with higherrisk for physical and mentaldisabilities through childhood and adolescence.53
Maternal smoking during pregnancy and low birth weight in children (age 0-1 years), 1998/99
Percentage of mothers with low birth weight children
Did not smoke duringpregnancy
Light smoker(<12 cigarettes per day)51 Heavy smoker
(>=12 cigarettes per day)
Mothers of Young Children (ages 0-1 years)
0%10%20%30%40%50%60%70%80%90%
100%
6.2 10.9 14.3
Source:National Longitudinal
Survey of Children andYouth, (NLSCY) Cycle 3,
1998-99

21A New Generation of Canadian Families Raising Young Children
Breastfeeding is associated with alower likelihood of ear infections in
the first 2 years of life.
Data:Approximately 80 per cent ofmothers either currently breastfeedtheir children or breastfed at somepoint in their child’s life. Ofmothers who breastfed, one thirddid so for a period of three to sixmonths whereas another thirdcontinued for more than sixmonths. The majority of childrendo not suffer from ear infectionsin the first 2 years of life. Theproportion of children who hadear infections before age 2 waslower in children who werebreastfed. This was true for singleand multiple ear infections.
Research:Repeated ear infections are acommon cause of hearing loss in children.54 Breastfeeding isassociated with fewer earinfections and is known topromote child health.55
54 Canadian Association of Speech-Language Pathologists and Audiologists. (2002). Hearing health for children.55 Canadian Perinatal Surveillance System. (1998). Breastfeeding. Health Canada, Population and Public Health Branch.
Child was/is currently breastfed Child was not breastfed
0
65.3
53.7
16.3 18.5
7.511.1
4.3 6.0 6.610.7
1 2 3 4 or more
Number of Ear Infections
Perc
enta
ge o
f chi
ldre
n
0
10
20
30
40
50
60
70
Breastfeeding and ear infections in children (age 0-1 years), 1998/99
Source:National LongitudinalSurvey of Children andYouth, (NLSCY) Cycle 3,1998-99

Source:Starting Strong(OECD. 2001)
A New Generation of Canadian Families Raising Young Children 22
As a percentage of Gross Domestic Product,56
Canada spends less on pre-school educationcompared to other developed countries.
Data:Among G7 countries, Canada has the second lowest publicexpenditure on education-orientedprograms for children aged 3 toschool-age. France spends almost3 times, and the United States 1.5 times, as much as Canada as apercentage of their Gross DomesticProduct (GDP).
Research:The benefits of public investmentin early childhood educationprograms can include social,economic and educational gainsfor children, parents and families.Quality early childhood educationprograms foster development inchildren and support workingparents, leading to economicbenefits.59
56 Gross Domestic Product (GDP) refers to the total market value of all the goods and services produced within the bordersof a nation during a specified period.
57 “Pre-primary education refers to organised centre-based programs designed to foster learning, emotional and socialdevelopment from 3 years of age to compulsory school-age. Day care, play groups and home-based structured anddevelopmental activities may not be included.” (OECD, 2001)
58 Group of Seven: Major industrial countries in the world, consisting of Canada, France, Germany, Italy, Japan, theUnited Kingdom and the United States.
59 Organization for Economic Cooperation and Development (OECD). (2001). Starting strong: Early childhood educationand care.
Public expenditure for pre-school education57
(age 3-6 years) in the G7 countries58, 1998
Public Expenditure
Canada
0.23
0.66
0.360.42
0.09
0.420.36
France GermanyItaly JapanUnitedKingdom
UnitedStates
Members of Group Seven
Perc
enta
ge o
f Gro
ss D
omes
tic P
rodu
ct (G
DP)
0
0.1
0.2
0.3
0.4
0.5
0.6
0.7
Source:Census - Population ProjectionBureau, Statistics Canada
23A New Generation of Canadian Families Raising Young Children
Every Child Counts
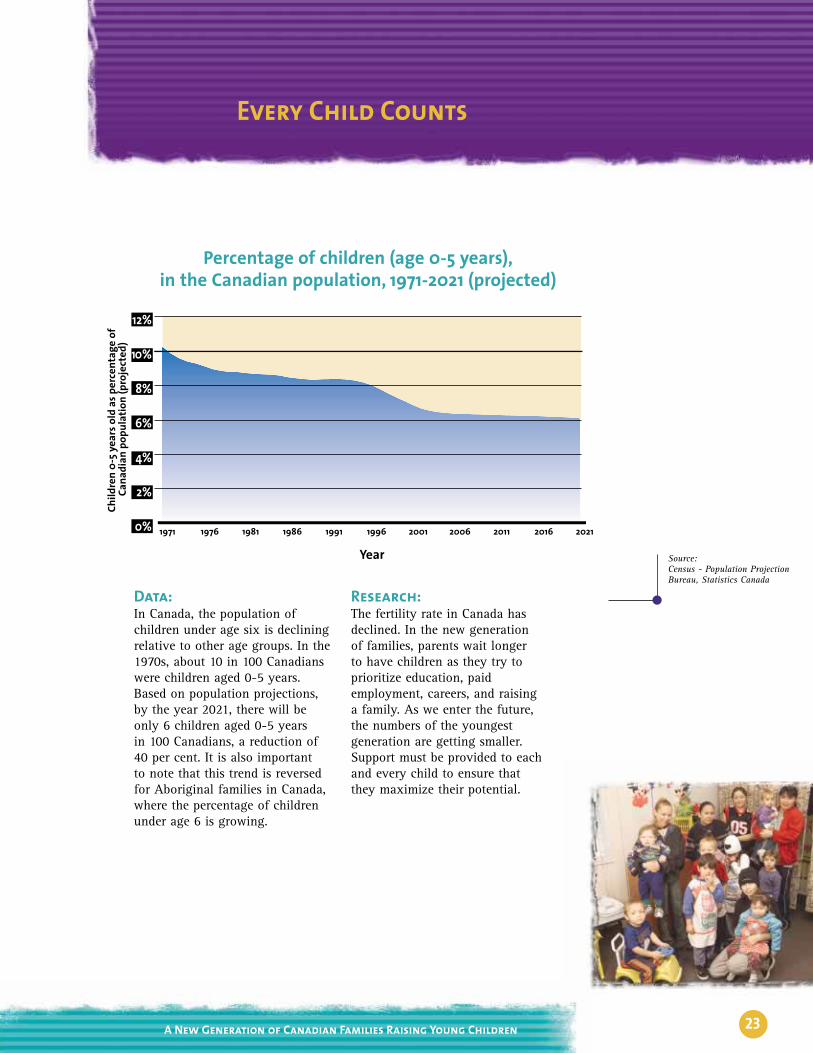
Data:In Canada, the population ofchildren under age six is decliningrelative to other age groups. In the1970s, about 10 in 100 Canadianswere children aged 0-5 years.Based on population projections,by the year 2021, there will beonly 6 children aged 0-5 years in 100 Canadians, a reduction of40 per cent. It is also important to note that this trend is reversedfor Aboriginal families in Canada,where the percentage of childrenunder age 6 is growing.
Research:The fertility rate in Canada hasdeclined. In the new generation of families, parents wait longer to have children as they try toprioritize education, paidemployment, careers, and raising a family. As we enter the future,the numbers of the youngestgeneration are getting smaller.Support must be provided to eachand every child to ensure thatthey maximize their potential.
Percentage of children (age 0-5 years),in the Canadian population, 1971-2021 (projected)
1971 1976 1981 1986 1991 1996 2001 2006 2011 2016 2021
Year
Child
ren
0-5 y
ears
old
as p
erce
ntag
e of
Ca
nadi
an p
opul
atio
n (p
roje
cted
)
0%
2%
4%
6%
8%
10%
12%

A New Generation of Canadian Families Raising Young Children 24
Every Child Counts – Wherever They Are
Data:According to the 2001 census,Canada has a total of 2,074,075children under the age of six, andthe majority of them live in thesouthern and major urban areas of the country.
Research:Delivering support and programsto the families with youngchildren living in the rural andremote regions continues topresent a challenge to socialpolicies that aim at leaving nochildren behind.
Distribution of children aged 0-5 years in Canada, 2001
1 dot represents 10 children

25A New Generation of Canadian Families Raising Young Children
Working Together: A Glimpse ofPolicies That Support a New Generation
of Families Raising Young Children
Despite major changes in familylife, research confirms that parentscontinue to have the largestimpact on the outcomes of theirchildren through parenting andchild rearing decisions. Supportingparents with young children istherefore a pivotal part of publicpolicies aimed at building a bettersociety – a society where no childgets left behind.
In Canada, all governments arecommitted to investing in youngchildren and their parents in orderto help build a strong foundationfor the future well-being ofchildren.
Many of the programs and policiesare designed to support this newgeneration of Canadian parents tohelp them meet the challenges ofraising their young children.
Healthy Pregnancy, Birth and Infancy:
• Prenatal Nutrition Programs
• Perinatal Programs• Promotion of Breastfeeding• Addiction Prevention• Maternity and Parental
Benefits
Parenting and FamilySupports:
• Parent Education Programs• Parent Counseling• Family Literacy Projects • Child Support and Custody• English as Second Language
(ESL)• Immigrant Services
Government initiatives include several key areas:
Supports for First Nations and other AboriginalChildren and Families:
• Aboriginal Head Start inUrban and NorthernCommunities
• First Nations Head Start• First Nations and Inuit Child
Care Initiative• Child/Day Care Programs• First Nations National Child
Benefit Reinvestment
Early ChildhoodDevelopment, Learning and Care Support:
• National Child Benefit (NCB) and the Canada Child Tax Benefit (CCTB)
• Social Allowance • Preschool Education• Child Day Care

A New Generation of Canadian Families Raising Young Children 26
Provincial and Territorial PriorityInvestments under the Early ChildhoodDevelopment (ECD) Agreement 2001-2002
* While the Government of of Québec supports the general principles of the ECD and ELCC agreements, it did not participate in developing theseagreements because it intends to preserve its sole responsibility on social matters. However, Québec receives its share of federal funding and thegovernment of Québec is making major investments toward programs and services for children and families. All references to viewpoints shared bythe federal, provincial and territorial government in this document do not include the Government of Québec.
** Initiatives to address Fetal Alcohol Syndrome and Fetal Alcohol Effects
Yukon• Child care• Healthyfamilyinitiative
• Creation ofministerialECDcommittee
• Consultationsongoing todetermineadditionalpriorities forinvestment
Nunavut• Healthypregnancy,birth &infancy
• Parenting &familysupports
Québec*As Québecdoes notparticipate inthe agreement,its prioritiesfor ECD arenot reflected inthis picture
BritishColumbia• AboriginalECD
• Child care• Communitycapacitybuilding
• FAS/FAE**prevention
• Familyresourcecentres
• Infantdevelopmentprogram
• Supportedchild care
Source: EarlyChildhoodDevelopmentActivities andExpenditures:Government ofCanada Report2001-2002,Human ResourcesDevelopmentCanada, HealthCanada and Indianand NorthernAffairs Canada,2002.
Alberta• Earlyintervention& ECDprograms(including:homevisitation,mentoringprogram, &parentresourcecentres)
• FAS/FAE**• Child care• Prevention offamilyviolence
Saskatchewan• Universalscreening ofnewborns &their families
• Earlychildhoodintervention
• Infantmortality
• Child care in targetedcommunities
• FAS/FAE**• Home visiting• Enhancedchild care
• Earlylearningprograms
• Parentingsupports
Ontario• Early YearsCentres
• Early literacy• Nutrition• Infantdevelopment
• Mental health• Autism• Teen parents• Healthprograms
• Parentresources
• Informationservices
NewBrunswick• Earlylanguagedevelopment
• Prenatalbenefit
• Communitycapacitybuilding
• Child day care• Earlyintervention/integrateddaycare forspecial needschildren
• Parenting• Childwitnesses offamilyviolenceprogram
Nova Scotia• Home visiting• Child carewagesupplement
• Special needschild care
• ECD traininginitiatives
• Expandedchild careoptions
• Parent supportand education
Newfoundland& Labrador• Pre/postnatalbenefit
• Early literacy& pre-kindergartenorientation
• Familyresourceprograms &healthy babyclubs
• Child careservices &supports
• Earlyintervention/autism
NorthwestTerritories• Universalscreening
• Homevisitationprogram
• Health &wellnessawareness
• Languagedevelopment/retention
• Child &familyresourcecentres
• Parent andfamily literacyprograms
Prince EdwardIsland• Healthy childdevelopmentstrategy
• Kindergarten/earlychildhoodeducation
• Children withautism
Manitoba• Prenatalbenefit/communitysupportprograms
• Universalinfantscreening;targetedhome visiting
• FAS/FAE**• Parent-childactivities
• Child daycare
• Readinessto learn
• Children withdisabilities
• NationalChild Benefitrestoration

27A New Generation of Canadian Families Raising Young Children
Governments Working Together: Agreementson Early Childhood Development (ECD) and
Early Learning and Child Care (ELCC)
60 For more information on the ECD and ELCC Agreements, visit www.socialunion.gc.ca.
In September 2000, governmentsacross Canada announced aunique federal/provincial/territorial agreement (Quebec doesnot participate) for the support of early childhood development(ECD).60 Under this agreement, theGovernment of Canada provides$500 million annually toprovincial and territorialgovernments to improve andexpand their investments in youngchildren and their families. Theinitiatives supporting youngchildren and their families in eachof the provinces/territories arefocused on specific provincial/territorial needs, within fouragreed upon areas: promotinghealthy pregnancy, birth andinfancy; improving parenting andfamily supports; strengtheningearly childhood development,learning and care; andstrengthening communitysupports.
The map on page 26 provides anillustration of some of the priorityareas for investment of provincialand territorial governments duringthe first year of the agreement,2001-2002.
In March 2003, building on theECD agreement federal, provincialand territorial governmentsannounced a framework forimproving access to affordable,quality, provincially andterritorially regulated earlylearning and child care (ELCC)programs and services.60
Under this framework, theGovernment of Canada isproviding $900 million over fiveyears to support provincial andterritorial governments’investments in ELCC.

A New Generation of Canadian Families Raising Young Children 28
Under the ECD Agreement,governments report annually tothe public on their activities andexpenditures. In addition,governments have committed tomonitor and report to Canadianson the well-being of Canada’syoung children using an agreedupon common set of indicators.This common set of indicatorsreflects the five domains of childwell-being: physical health andmotor development; emotionalhealth; social knowledge andcompetence; cognitive learning;and language communication.
Under the ELCC Agreement,governments also committed toreport annually to Canadians on
their progress in improving accessto affordable, quality earlylearning and child care (ELCC)programs and services, beginningin November 2003.
The purpose of ECD and ELCCpublic reporting is to enhanceaccountability and allow thepublic to track progress in theseareas of investment. Governmentswill strive to continue to improvethe quality of reporting over time.
By working together, allCanadians can help the nextgeneration of young childrenreach their potential as they growup in the 21st century.
Reporting to the Public on our Progress


Human Resources Development CanadaStrategic PolicyApplied Research BranchPlace du Portage, Phase II, 7th Floor165 Hôtel de Ville Street Gatineau, Quebec K1A 0J2Fax (819) 953.7260E-mail: [email protected]://www.hrdc-drhc.gc.ca/sp-ps/arb-dgra/arb-home.shtml
Ces renseignements sont également offerts en Français
Healthy Child ManitobaRoom 219-114 Garry StreetWinnipeg, Manitoba R3C 4V6Tel: (204) 945.2266Toll-free: 1 888 848.0140Fax: (204) 948.2585E-mail: [email protected]/hcm