Embed Size (px)
Citation preview
Selected Statistics on Canadian Families and
Family Law: Second Edition
Prepared by: Research Unit
Child Support Team Department of Justice Canada
Aussi disponible en français
This report may be reproduced, in part or in whole, and by any means, without charge or further permission from the Department of Justice, provided that due diligence is exercised in ensuring the accuracy of the materials reproduced; that the Department of Justice is identified as the source department; and that the reproduction is not represented as an official version of the original report. © Her Majesty the Queen in Right of Canada, (2000) (Minister of Justice and Attorney General of Canada)
- i -
TABLE OF CONTENTS
INTRODUCTION........................................................................................................................... 1
FAMILY DEMOGRAPHICS ......................................................................................................... 2
Family Type ............................................................................................................................. 2 Families with Children............................................................................................................. 2 Family Context at Birth............................................................................................................ 3 Lone-Parent Families ............................................................................................................... 4 Family Income.......................................................................................................................... 5 Family Poverty ......................................................................................................................... 6
MARRIAGE, DIVORCE AND SEPARATION............................................................................. 8
Marriage ................................................................................................................................... 8 Divorce..................................................................................................................................... 8 Trends in Marriage and Divorce .............................................................................................. 9 Duration of Marriage and Age at Time of Divorce................................................................ 10
CHILDREN AND SEPARATION AND DIVORCE ................................................................... 11
The Complex Family Lives of Canadian Children ................................................................ 11 Children from Broken Families Come Disproportionately from Common-Law Unions ................................................................................................... 12 Patterns of Separation and Divorce........................................................................................ 13
CHILD CUSTODY....................................................................................................................... 15
Custody Arrangements ........................................................................................................... 15 Existence of Court Orders for Custody and Variations by Time Since Separation and Type of Separation ................................................................ 15 Custody .................................................................................................................................. 15 Living Arrangements.............................................................................................................. 17 Contact with Non-custodial Parent ........................................................................................ 17 Contact with Non-custodial Parent over Time....................................................................... 19
CHILD AND SPOUSAL SUPPORT PAYMENTS ..................................................................... 21
Number of People Paying and Receiving Support between 1986 and 1996.......................... 21 Income Levels of Payers and Recipients of Child Support .................................................... 22 Sources of Income.................................................................................................................. 23 Child Support Arrangements.................................................................................................. 25 Regularity of Payments .......................................................................................................... 26 Visiting Patterns and Payment of Child Support ................................................................... 26
- ii -
APPENDIX ................................................................................................................................... 28
STATISTICS CANADA SURVEYS............................................................................................ 28
National Longitudinal Survey of Children and Youth (NLSCY) .......................................... 28 Central Registry of Divorce Proceedings (CRDP)................................................................. 28 Survey of Labour Income Dynamics (SLID) ......................................................................... 28
REVENUE CANADA DATA ...................................................................................................... 28
Tax Statistics .......................................................................................................................... 28
BIBLIOGRAPHY ......................................................................................................................... 29
- iii -
LIST OF TABLES
Table 1: Average Annual Income by Family Type, 1993-1997 .................................................... 6
Table 2: Families and Poverty (1996) ........................................................................................... 7
Table 3: Number and Rate of Marriages and Divorces, Canada and Provinces/Territories, 1997 ......................................................................... 8
Table 4: Distribution of Children According to Whether a Court Order for Custody Exists, by Type of Broken Union and Time Elapsed Since Separation—NLSCY, Cycle 1, 1994-1995 .................................. 15
Table 5: Court-Ordered Custody Arrangement, According to the Age of the Child at Separation and the Type of Broken Union—NLSCY, Cycle 1, 1994-1995 .......................................... 16
Table 6: Living Arrangements at Time of Separation for Children of Broken Families—NLSCY, Cycle 1, 1994-1995...................................... 17
Table 7: Type of Contact Maintained With Either Parent at Time of Separation by Type of Union—NLSCY, Cycle 1, 1994-1995 ........................................................ 19
Table 8: Type of Support Agreement According to Type of Broken Union—NLSCY, Cycle 1, 1994-1995 ................................................ 25
Table 9: Type of Support Agreement and Regularity of Payments, According to Type of Broken Union—NLSCY, Cycle 1, 1994-1995 .......................... 26
- iv -
LIST OF FIGURES
Figure 1: Family Type as a Proportion of all Families (1996).................................................... 2
Figure 2: Families with Children by Family Type (1986-1996) ................................................. 3
Figure 3: Family Type at Birth for Various Cohorts of Children ............................................... 3
Figure 4: Marital Status of Male and Female Lone Parents (1991)............................................ 4
Figure 5: Proportion of Children in Private Households by Family Type (1996) ...................... 5
Figure 6: Poverty Rates by Family Type, 1996........................................................................... 7
Figure 7: Marriage and Divorce Rates in Canada, 1967-1997.................................................... 9
Figure 8: Median Age at Time of Divorce, 1993-1997 ............................................................ 10
Figure 9: Canadian Children Born to a Lone-Parent or Who Have Experienced the Separation of Their Parents, Various Birth Cohorts ........................................................................ 11
Figure 10: Canadian Children Born in a Two-Parent Family Who Have Experienced Their Parents’ Separation, According to Type of Parents’ Union, 1983-1984 Cohorts—NLSCY 1994-1995................................................................. 12
Figure 11: Distribution of Children Aged 0-11 and of Children From Broken Families, According to Type of Parents’ Union— Canada—NLSCY 1994-1995.................................................................................... 13
Figure 12: Percentage of Children From Broken Marriages Who Have Not Yet Witnessed Their Parents’ Divorce, According to Time Elapsed Since Separation—NLSCY 1994-1995 (Life Table Estimates)................................ 14
Figure 13: Type of Custody Arrangements................................................................................. 17
Figure 14: Type of Contact Maintained with Either Parent at Time of Separation NLSCY 1994-1995.................................................................... 18
Figure 15: Type of Contact Maintained with Father at the Time of Survey, According to Time Elapsed Since Separation—NLSCY 1994-1995........................ 20
Figure 16: Number of People Who Reported Paying or Receiving Support, 1986-1996.................................................................................. 21
Figure 17: Total Amount of Alimony by Number of Payers and Recipients, Canada 1995......................................................................... 22
- v -
Figure 18: Income Ranges of Payers and Recipients, 1995........................................................ 23
Figure 19: Sources of Income, 1995 ........................................................................................... 23
Figure 20: Government Transfers as a Source of Income, for Payers and Recipients, Canada, 1995 .................................................................. 24
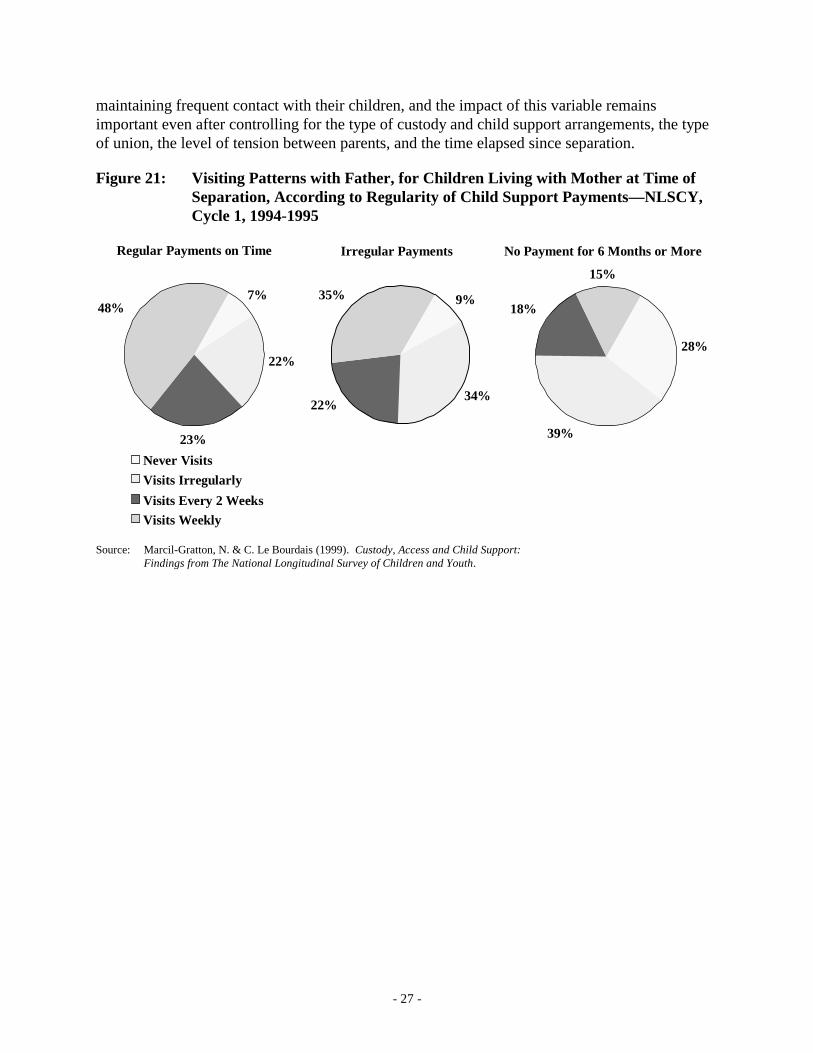
Figure 21: Visiting Patterns with Father, for Children Living with Mother at Time of Separation, According to Regularity of Child Support Payments—NLSCY, Cycle 1, 1994-1995 ......................................... 27


- 1 -
INTRODUCTION
The following pages contain information on families in Canada, characteristics of those families and information on family law topics such as marriage, divorce, support awards, payment of child support, and custody and access. To produce the most accurate picture possible of the circumstances of families in Canada, information and statistics from a number of different sources have been compiled. At the heart of these sources are many Statistics Canada surveys collecting data on various facets of Canadian life. Reports produced by other organizations, generally using Statistics Canada data, have also been used. Therefore, when the term “family” appears in the document it refers to the Statistics Canada definition of a census family: a currently married or common-law couple with or without never-married children, or a single parent with never-married children, living in the same dwelling.
Every attempt has been made to include the most recent information available. As relevant information has been made public, this document has been updated. Certain information contained in the previous publication of Selected Statistics has been repeated as it is based on surveys, such as the census, that have not been repeated since the original publication appeared. The other Statistics Canada surveys used in this report are the annual Survey of Labour and Income Dynamics (SLID), and the divorce and marriage statistics.
There is an additional Statistics Canada survey that is of particular interest—the National Longitudinal Survey of Children and Youth (NLSCY), which began in 1994. This survey collects, among other things, information on family law issues such as divorce, separation, support payments, custody and access and a great deal of information from this survey has been included in this report. A more detailed analysis of the family and custody history section of the NLSCY (Cycle 1) can be found in the Department of Justice Canada publication entitled, Custody, Access and Child Support: Findings from the National Longitudinal Survey of Children and Youth (1999).
The appendix to this document briefly describes the various surveys used as sources in the document. The bibliography provides details on the other sources from which information was obtained.
- 2 -
FAMILY DEMOGRAPHICS
Family Type
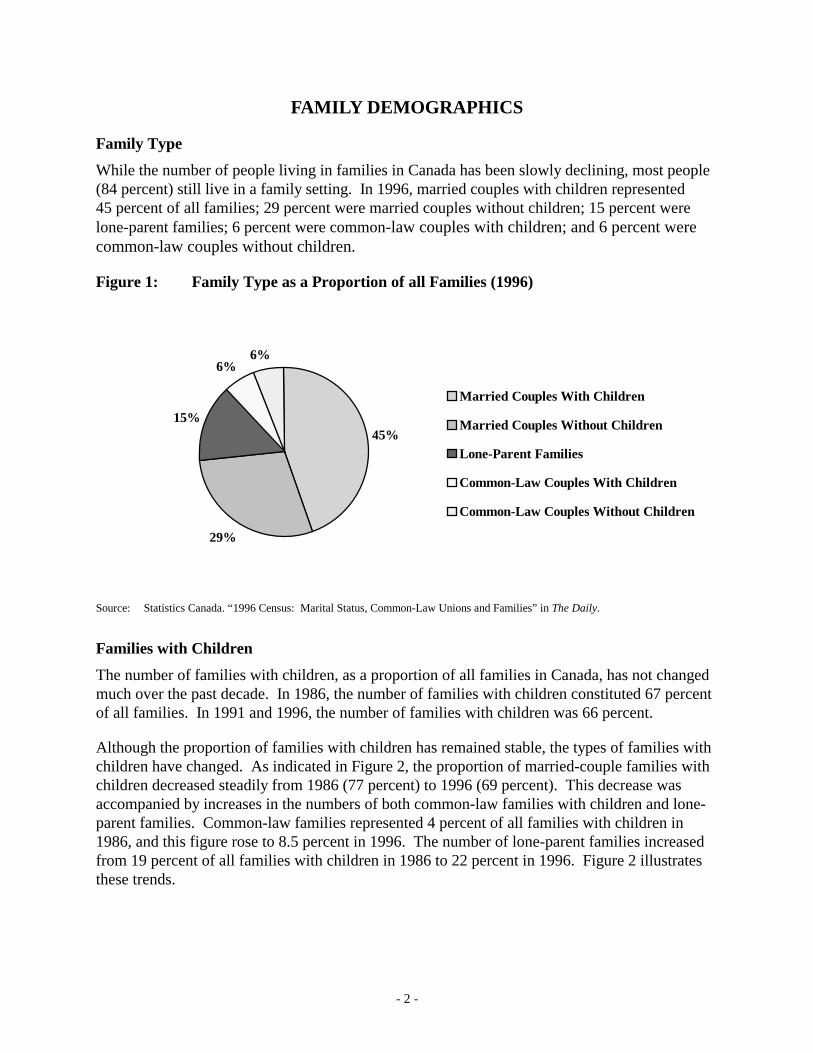
While the number of people living in families in Canada has been slowly declining, most people (84 percent) still live in a family setting. In 1996, married couples with children represented 45 percent of all families; 29 percent were married couples without children; 15 percent were lone-parent families; 6 percent were common-law couples with children; and 6 percent were common-law couples without children.
Figure 1: Family Type as a Proportion of all Families (1996)
Source: Statistics Canada. “1996 Census: Marital Status, Common-Law Unions and Families” in The Daily.
Families with Children
The number of families with children, as a proportion of all families in Canada, has not changed much over the past decade. In 1986, the number of families with children constituted 67 percent of all families. In 1991 and 1996, the number of families with children was 66 percent.
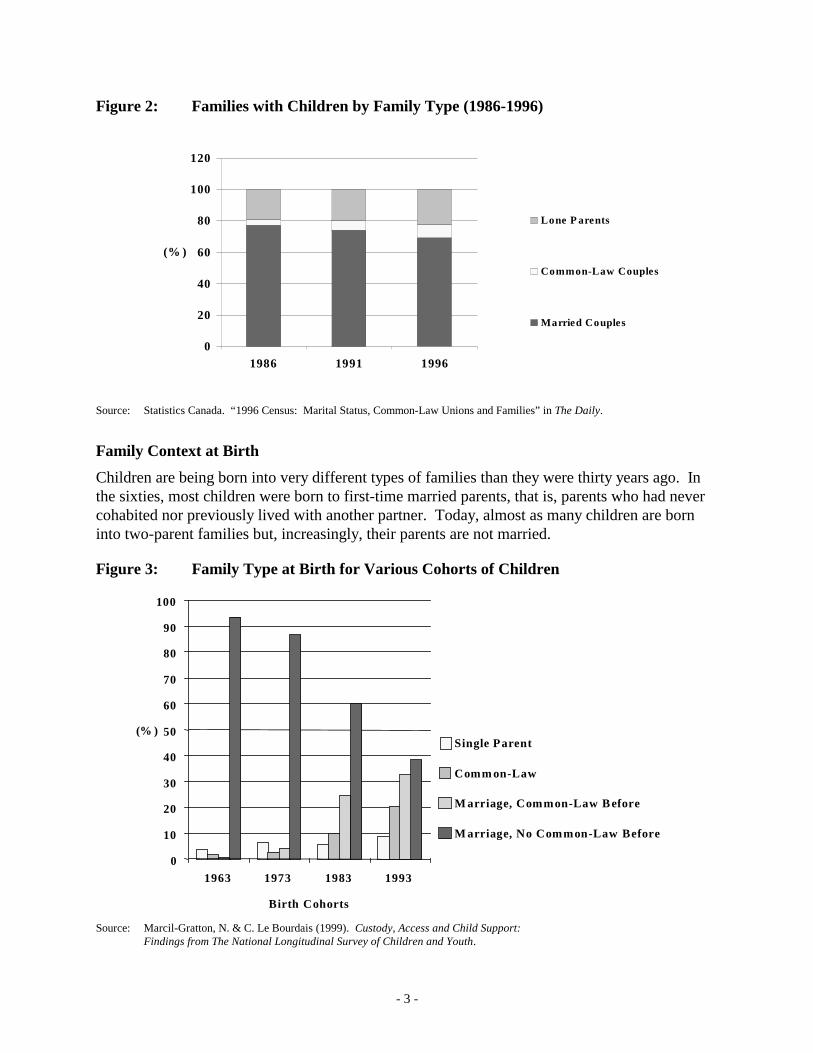
Although the proportion of families with children has remained stable, the types of families with children have changed. As indicated in Figure 2, the proportion of married-couple families with children decreased steadily from 1986 (77 percent) to 1996 (69 percent). This decrease was accompanied by increases in the numbers of both common-law families with children and lone-parent families. Common-law families represented 4 percent of all families with children in 1986, and this figure rose to 8.5 percent in 1996. The number of lone-parent families increased from 19 percent of all families with children in 1986 to 22 percent in 1996. Figure 2 illustrates these trends.
29%
15%
6%6%
45%
Married Couples With Children
Married Couples Without Children
Lone-Parent Families
Common-Law Couples With Children
Common-Law Couples Without Children
- 3 -
Figure 2: Families with Children by Family Type (1986-1996)
0
20
40
60
80
100
120
1986 1991 1996
(% )
Lone P arents
Common-Law Couples
Married Couples
Source: Statistics Canada. “1996 Census: Marital Status, Common-Law Unions and Families” in The Daily.
Family Context at Birth
Children are being born into very different types of families than they were thirty years ago. In the sixties, most children were born to first-time married parents, that is, parents who had never cohabited nor previously lived with another partner. Today, almost as many children are born into two-parent families but, increasingly, their parents are not married.
Figure 3: Family Type at Birth for Various Cohorts of Children
0
10
20
30
40
50
60
70
80
90
100
1963 1973 1983 1993
Birth Cohorts
(% )Single Parent
Comm on-Law
M arriage, Common-Law B efore
M arriage, No Common-Law Before
Source: Marcil-Gratton, N. & C. Le Bourdais (1999). Custody, Access and Child Support: Findings from The National Longitudinal Survey of Children and Youth.
- 4 -
Figure 3 shows that nearly all children born in the early 1960s were born to parents who married without living together before (over 90 percent). The situation has since changed radically. In the National Longitudinal Survey of Children and Youth (NLSCY) 1993-1994 cohorts, children born to parents who married without living together beforehand represented less than 40 percent of all births. The biggest changes were in the proportion of children born to married parents who first lived together (nearly 33 percent), and the proportion of children born to cohabiting parents (20 percent). The changes were most marked in Quebec, where only 23 percent of the children in the 1993-1994 cohorts were born to parents who married without prior cohabitation. Barely one-half of all births were to married parents and 43 percent were to common-law couples. The proportion of out-of-wedlock births reached 50 percent if one takes into consideration children born to lone mothers.
Lone-Parent Families
Lone-parent families are much more likely to be headed by women than men. For example, in 1996 women headed 83 percent of all lone-parent families, while men headed only 17 percent of lone-parent families. Although the number of lone-parent families has been increasing, the proportion of female to male lone parents has remained relatively stable over the past decade.
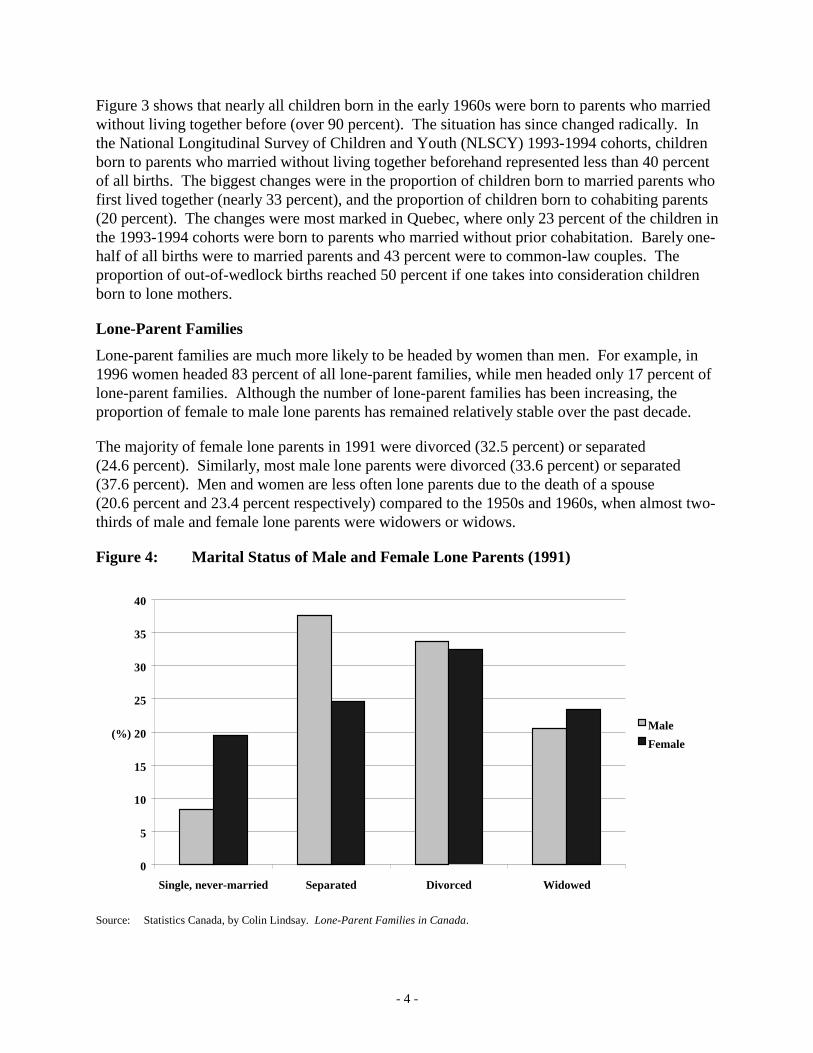
The majority of female lone parents in 1991 were divorced (32.5 percent) or separated (24.6 percent). Similarly, most male lone parents were divorced (33.6 percent) or separated (37.6 percent). Men and women are less often lone parents due to the death of a spouse (20.6 percent and 23.4 percent respectively) compared to the 1950s and 1960s, when almost two-thirds of male and female lone parents were widowers or widows.
Figure 4: Marital Status of Male and Female Lone Parents (1991)
0
5
10
15
20
25
30
35
40
Single, never-married Separated Divorced Widowed
(%)Male
Female
Source: Statistics Canada, by Colin Lindsay. Lone-Parent Families in Canada.
- 5 -
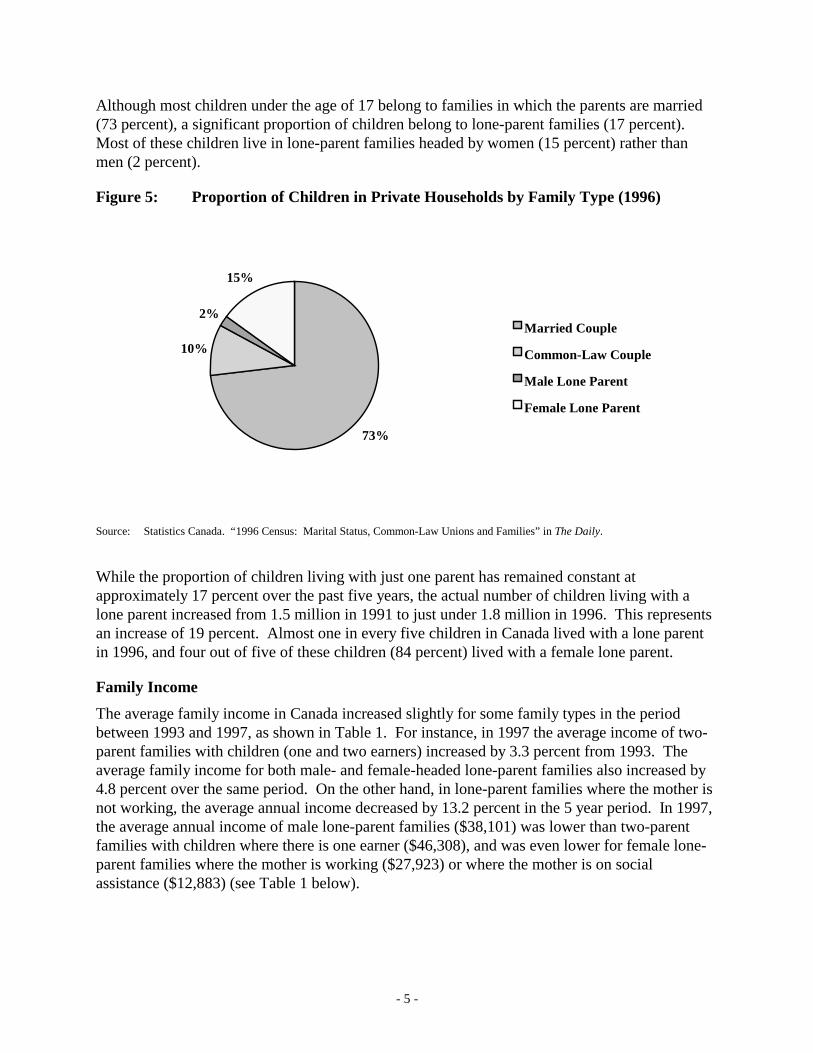
Although most children under the age of 17 belong to families in which the parents are married (73 percent), a significant proportion of children belong to lone-parent families (17 percent). Most of these children live in lone-parent families headed by women (15 percent) rather than men (2 percent).
Figure 5: Proportion of Children in Private Households by Family Type (1996)
Source: Statistics Canada. “1996 Census: Marital Status, Common-Law Unions and Families” in The Daily.
While the proportion of children living with just one parent has remained constant at approximately 17 percent over the past five years, the actual number of children living with a lone parent increased from 1.5 million in 1991 to just under 1.8 million in 1996. This represents an increase of 19 percent. Almost one in every five children in Canada lived with a lone parent in 1996, and four out of five of these children (84 percent) lived with a female lone parent.
Family Income
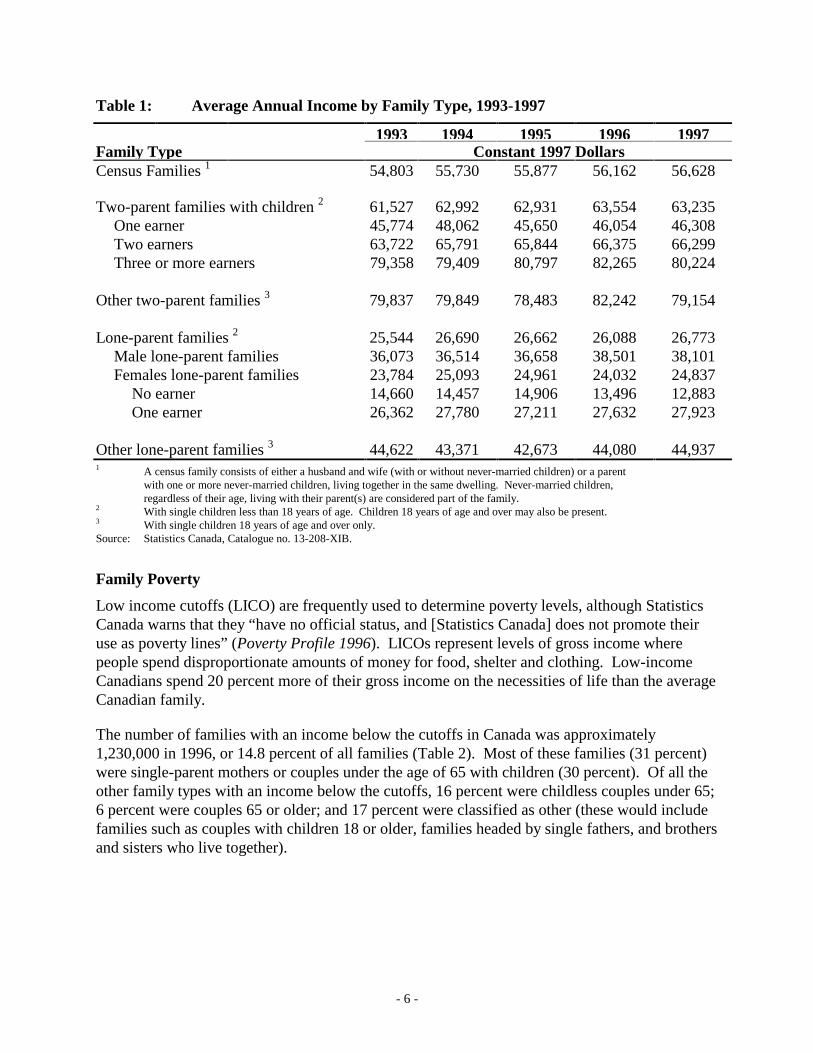
The average family income in Canada increased slightly for some family types in the period between 1993 and 1997, as shown in Table 1. For instance, in 1997 the average income of two-parent families with children (one and two earners) increased by 3.3 percent from 1993. The average family income for both male- and female-headed lone-parent families also increased by 4.8 percent over the same period. On the other hand, in lone-parent families where the mother is not working, the average annual income decreased by 13.2 percent in the 5 year period. In 1997, the average annual income of male lone-parent families ($38,101) was lower than two-parent families with children where there is one earner ($46,308), and was even lower for female lone-parent families where the mother is working ($27,923) or where the mother is on social assistance ($12,883) (see Table 1 below).
73%
10%
2%
15%
Married Couple
Common-Law Couple
Male Lone Parent
Female Lone Parent
- 6 -
Table 1: Average Annual Income by Family Type, 1993-1997
1993 1994 1995 1996 1997Family Type Constant 1997 Dollars Census Families 1 54,803 55,730 55,877 56,162 56,628 Two-parent families with children 2 61,527 62,992 62,931 63,554 63,235 One earner 45,774 48,062 45,650 46,054 46,308 Two earners 63,722 65,791 65,844 66,375 66,299 Three or more earners 79,358 79,409 80,797 82,265 80,224 Other two-parent families 3 79,837 79,849 78,483 82,242 79,154 Lone-parent families 2 25,544 26,690 26,662 26,088 26,773 Male lone-parent families 36,073 36,514 36,658 38,501 38,101 Females lone-parent families 23,784 25,093 24,961 24,032 24,837 No earner 14,660 14,457 14,906 13,496 12,883 One earner 26,362 27,780 27,211 27,632 27,923 Other lone-parent families 3 44,622 43,371 42,673 44,080 44,937 1 A census family consists of either a husband and wife (with or without never-married children) or a parent with one or more never-married children, living together in the same dwelling. Never-married children, regardless of their age, living with their parent(s) are considered part of the family. 2 With single children less than 18 years of age. Children 18 years of age and over may also be present. 3 With single children 18 years of age and over only. Source: Statistics Canada, Catalogue no. 13-208-XIB.
Family Poverty
Low income cutoffs (LICO) are frequently used to determine poverty levels, although Statistics Canada warns that they “have no official status, and [Statistics Canada] does not promote their use as poverty lines” (Poverty Profile 1996). LICOs represent levels of gross income where people spend disproportionate amounts of money for food, shelter and clothing. Low-income Canadians spend 20 percent more of their gross income on the necessities of life than the average Canadian family.
The number of families with an income below the cutoffs in Canada was approximately 1,230,000 in 1996, or 14.8 percent of all families (Table 2). Most of these families (31 percent) were single-parent mothers or couples under the age of 65 with children (30 percent). Of all the other family types with an income below the cutoffs, 16 percent were childless couples under 65; 6 percent were couples 65 or older; and 17 percent were classified as other (these would include families such as couples with children 18 or older, families headed by single fathers, and brothers and sisters who live together).
- 7 -
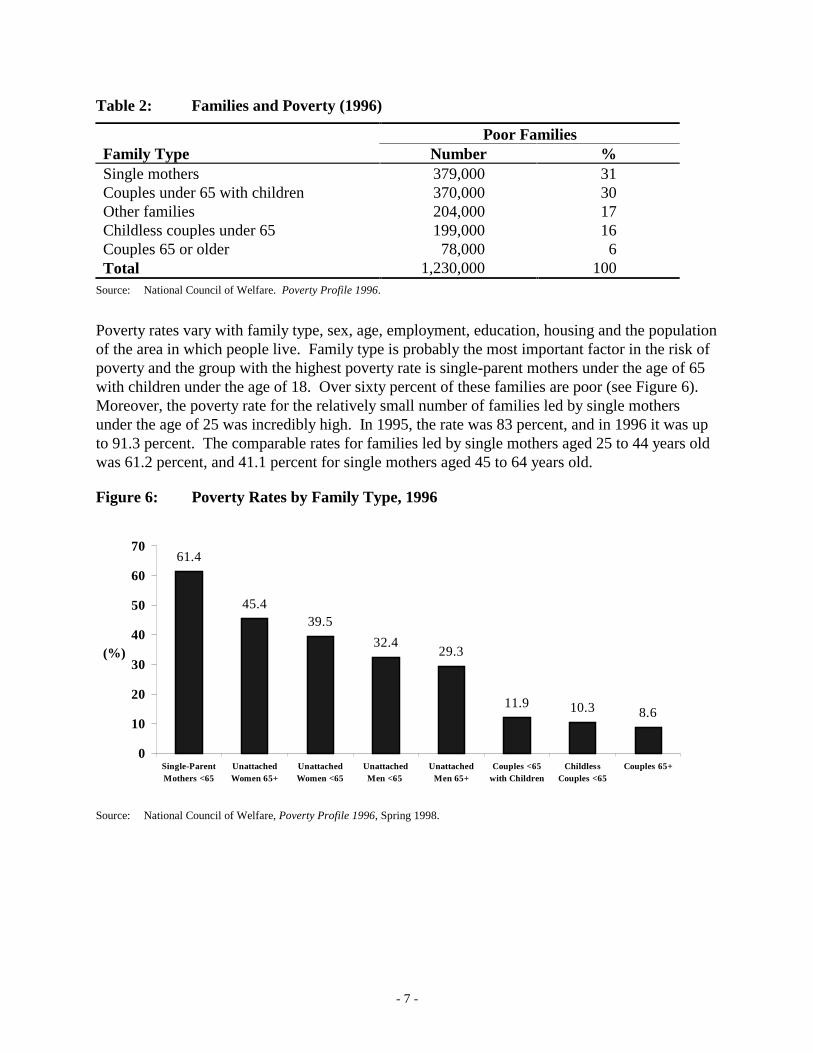
Table 2: Families and Poverty (1996)
Poor Families Family Type Number % Single mothers 379,000 31 Couples under 65 with children 370,000 30 Other families 204,000 17 Childless couples under 65 199,000 16 Couples 65 or older 78,000 6 Total 1,230,000 100
Source: National Council of Welfare. Poverty Profile 1996.
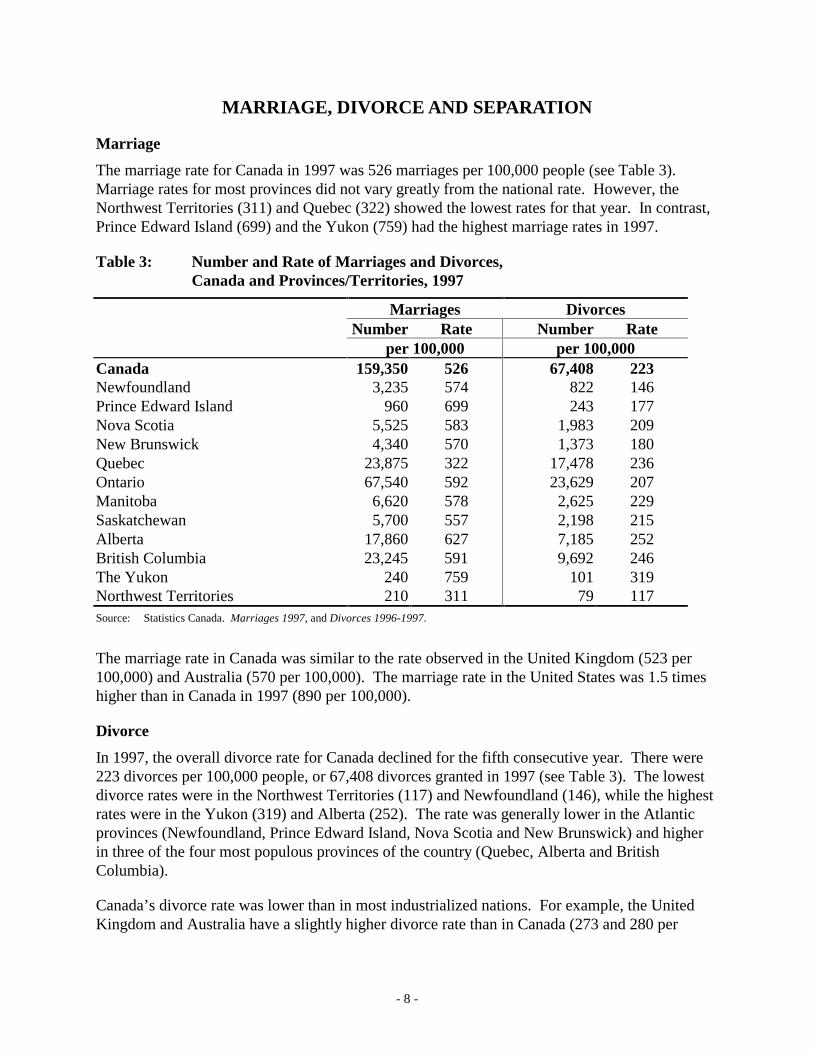
Poverty rates vary with family type, sex, age, employment, education, housing and the population of the area in which people live. Family type is probably the most important factor in the risk of poverty and the group with the highest poverty rate is single-parent mothers under the age of 65 with children under the age of 18. Over sixty percent of these families are poor (see Figure 6). Moreover, the poverty rate for the relatively small number of families led by single mothers under the age of 25 was incredibly high. In 1995, the rate was 83 percent, and in 1996 it was up to 91.3 percent. The comparable rates for families led by single mothers aged 25 to 44 years old was 61.2 percent, and 41.1 percent for single mothers aged 45 to 64 years old.
Figure 6: Poverty Rates by Family Type, 1996
Source: National Council of Welfare, Poverty Profile 1996, Spring 1998.
61.4
45.439.5
32.429.3
11.9 10.3 8.6
0
10
20
30
40
50
60
70
Single-ParentMothers <65
UnattachedWomen 65+
UnattachedWomen <65
UnattachedMen <65
UnattachedMen 65+
Couples <65with Children
ChildlessCouples <65
Couples 65+
(%)
- 8 -
MARRIAGE, DIVORCE AND SEPARATION
Marriage
The marriage rate for Canada in 1997 was 526 marriages per 100,000 people (see Table 3). Marriage rates for most provinces did not vary greatly from the national rate. However, the Northwest Territories (311) and Quebec (322) showed the lowest rates for that year. In contrast, Prince Edward Island (699) and the Yukon (759) had the highest marriage rates in 1997.
Table 3: Number and Rate of Marriages and Divorces, Canada and Provinces/Territories, 1997
Marriages Divorces Number Rate Number Rate
per 100,000 per 100,000 Canada 159,350 526 67,408 223 Newfoundland 3,235 574 822 146 Prince Edward Island 960 699 243 177 Nova Scotia 5,525 583 1,983 209 New Brunswick 4,340 570 1,373 180 Quebec 23,875 322 17,478 236 Ontario 67,540 592 23,629 207 Manitoba 6,620 578 2,625 229 Saskatchewan 5,700 557 2,198 215 Alberta 17,860 627 7,185 252 British Columbia 23,245 591 9,692 246 The Yukon 240 759 101 319 Northwest Territories 210 311 79 117 Source: Statistics Canada. Marriages 1997, and Divorces 1996-1997.
The marriage rate in Canada was similar to the rate observed in the United Kingdom (523 per 100,000) and Australia (570 per 100,000). The marriage rate in the United States was 1.5 times higher than in Canada in 1997 (890 per 100,000).
Divorce
In 1997, the overall divorce rate for Canada declined for the fifth consecutive year. There were 223 divorces per 100,000 people, or 67,408 divorces granted in 1997 (see Table 3). The lowest divorce rates were in the Northwest Territories (117) and Newfoundland (146), while the highest rates were in the Yukon (319) and Alberta (252). The rate was generally lower in the Atlantic provinces (Newfoundland, Prince Edward Island, Nova Scotia and New Brunswick) and higher in three of the four most populous provinces of the country (Quebec, Alberta and British Columbia).
Canada’s divorce rate was lower than in most industrialized nations. For example, the United Kingdom and Australia have a slightly higher divorce rate than in Canada (273 and 280 per
- 9 -
100,000 respectively) and the American divorce rate was almost double the Canadian rate (430 divorces per 100,000) in 1997.
Trends in Marriage and Divorce
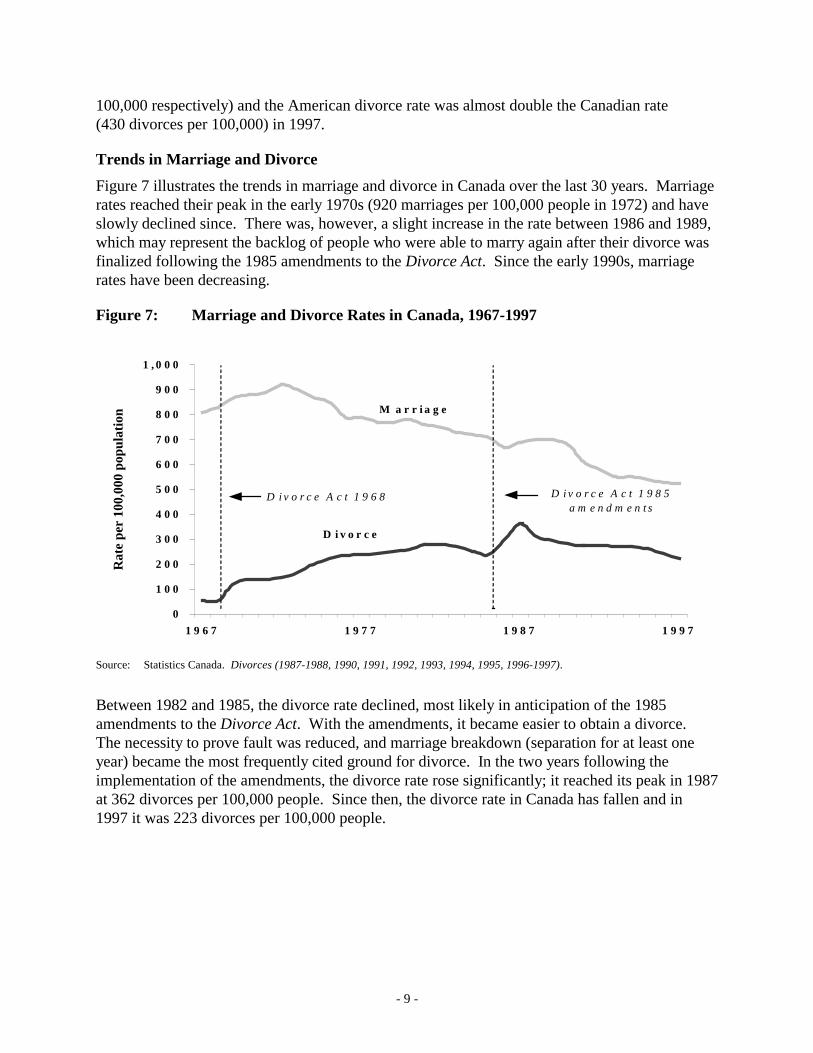
Figure 7 illustrates the trends in marriage and divorce in Canada over the last 30 years. Marriage rates reached their peak in the early 1970s (920 marriages per 100,000 people in 1972) and have slowly declined since. There was, however, a slight increase in the rate between 1986 and 1989, which may represent the backlog of people who were able to marry again after their divorce was finalized following the 1985 amendments to the Divorce Act. Since the early 1990s, marriage rates have been decreasing.
Figure 7: Marriage and Divorce Rates in Canada, 1967-1997
Source: Statistics Canada. Divorces (1987-1988, 1990, 1991, 1992, 1993, 1994, 1995, 1996-1997).
Between 1982 and 1985, the divorce rate declined, most likely in anticipation of the 1985 amendments to the Divorce Act. With the amendments, it became easier to obtain a divorce. The necessity to prove fault was reduced, and marriage breakdown (separation for at least one year) became the most frequently cited ground for divorce. In the two years following the implementation of the amendments, the divorce rate rose significantly; it reached its peak in 1987 at 362 divorces per 100,000 people. Since then, the divorce rate in Canada has fallen and in 1997 it was 223 divorces per 100,000 people.
0
1 0 0
2 0 0
3 0 0
4 0 0
5 0 0
6 0 0
7 0 0
8 0 0
9 0 0
1 , 0 0 0
1 9 6 7 1 9 7 7 1 9 8 7 1 9 9 7
Rat
e pe
r 10
0,00
0 po
pula
tion
M a r r i a g e
D i v o r c e
D i v o r c e A c t 1 9 6 8 D i v o r c e A c t 1 9 8 5 a m e n d m e n t s
- 10 -
Duration of Marriage and Age at Time of Divorce
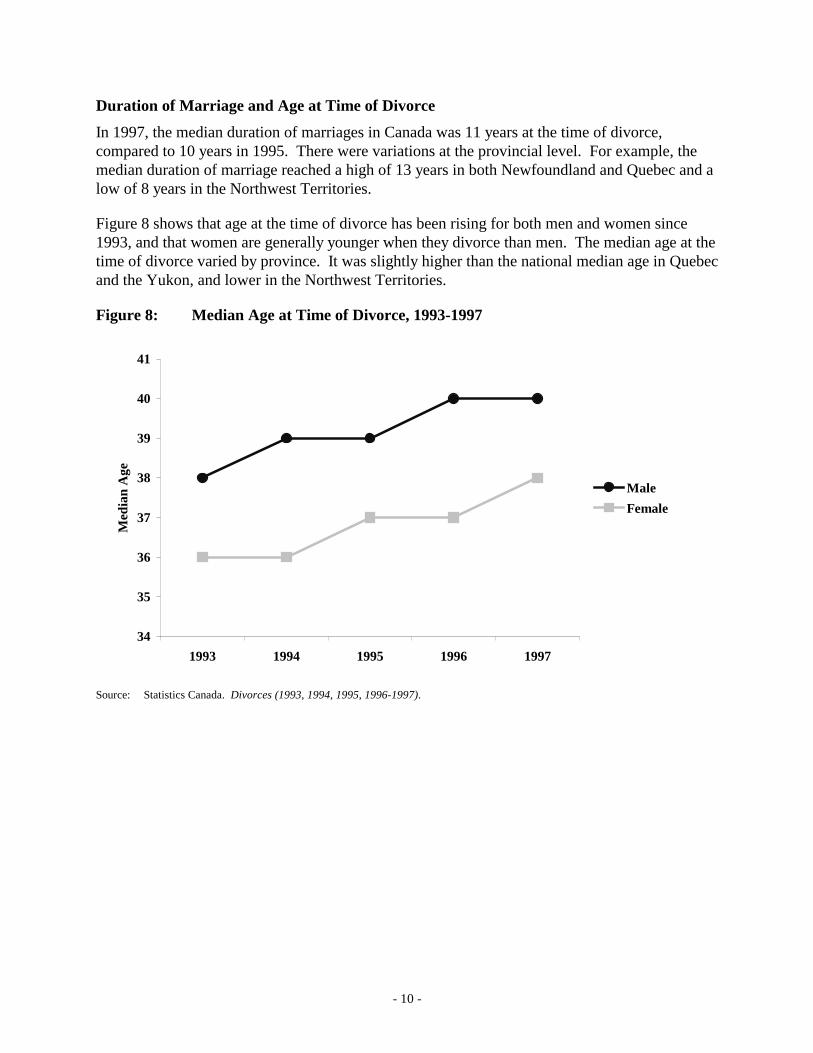
In 1997, the median duration of marriages in Canada was 11 years at the time of divorce, compared to 10 years in 1995. There were variations at the provincial level. For example, the median duration of marriage reached a high of 13 years in both Newfoundland and Quebec and a low of 8 years in the Northwest Territories.
Figure 8 shows that age at the time of divorce has been rising for both men and women since 1993, and that women are generally younger when they divorce than men. The median age at the time of divorce varied by province. It was slightly higher than the national median age in Quebec and the Yukon, and lower in the Northwest Territories.
Figure 8: Median Age at Time of Divorce, 1993-1997
34
35
36
37
38
39
40
41
1993 1994 1995 1996 1997
Med
ian
Age
Male
Female
Source: Statistics Canada. Divorces (1993, 1994, 1995, 1996-1997).
- 11 -
CHILDREN AND SEPARATION AND DIVORCE1
The Complex Family Lives of Canadian Children
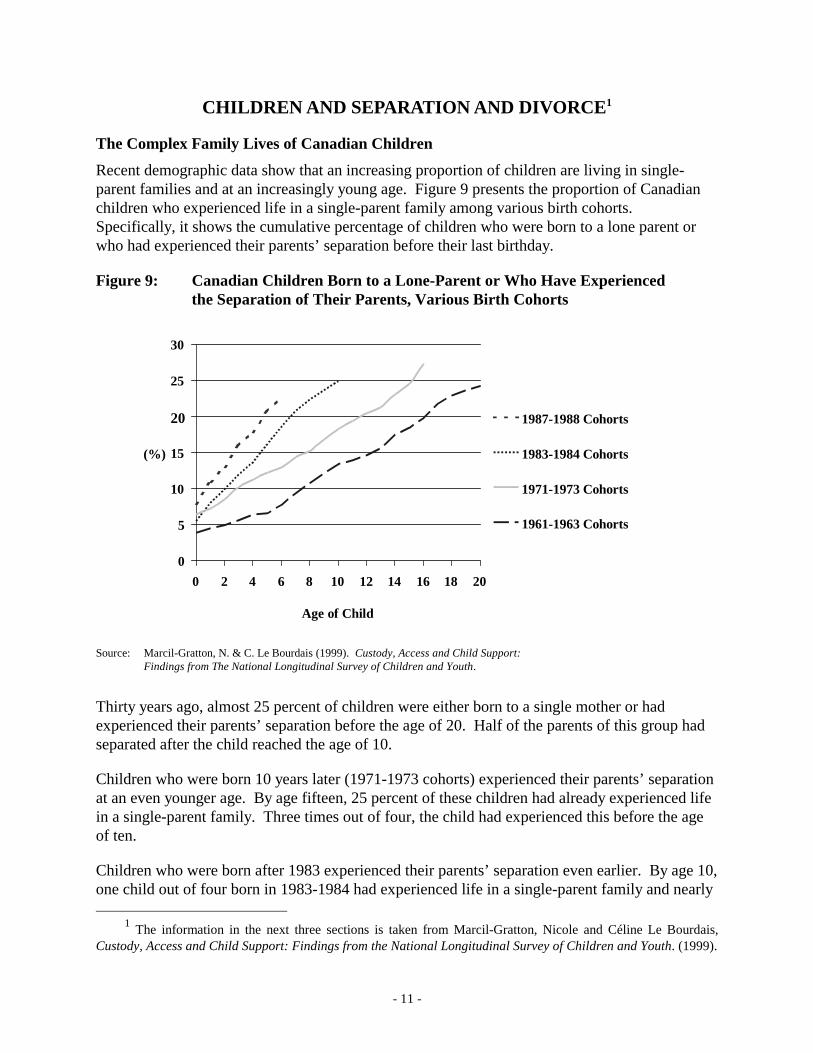
Recent demographic data show that an increasing proportion of children are living in single-parent families and at an increasingly young age. Figure 9 presents the proportion of Canadian children who experienced life in a single-parent family among various birth cohorts. Specifically, it shows the cumulative percentage of children who were born to a lone parent or who had experienced their parents’ separation before their last birthday.
Figure 9: Canadian Children Born to a Lone-Parent or Who Have Experienced the Separation of Their Parents, Various Birth Cohorts
0
5
10
15
20
25
30
0 2 4 6 8 10 12 14 16 18 20
Age of Child
(%)
1987-1988 Cohorts
1983-1984 Cohorts
1971-1973 Cohorts
1961-1963 Cohorts
Source: Marcil-Gratton, N. & C. Le Bourdais (1999). Custody, Access and Child Support: Findings from The National Longitudinal Survey of Children and Youth.
Thirty years ago, almost 25 percent of children were either born to a single mother or had experienced their parents’ separation before the age of 20. Half of the parents of this group had separated after the child reached the age of 10.
Children who were born 10 years later (1971-1973 cohorts) experienced their parents’ separation at an even younger age. By age fifteen, 25 percent of these children had already experienced life in a single-parent family. Three times out of four, the child had experienced this before the age of ten.
Children who were born after 1983 experienced their parents’ separation even earlier. By age 10, one child out of four born in 1983-1984 had experienced life in a single-parent family and nearly
1 The information in the next three sections is taken from Marcil-Gratton, Nicole and Céline Le Bourdais, Custody, Access and Child Support: Findings from the National Longitudinal Survey of Children and Youth. (1999).
- 12 -
23 percent of children in the younger cohorts (those born in 1987-1988) experienced the same by the age of 6.
There is little reason to suggest that these trends will slow down in the near future, since the rising proportion of children born in common-law unions face a higher risk of experiencing their parents’ separation.
Children from Broken Families Come Disproportionately from Common-Law Unions
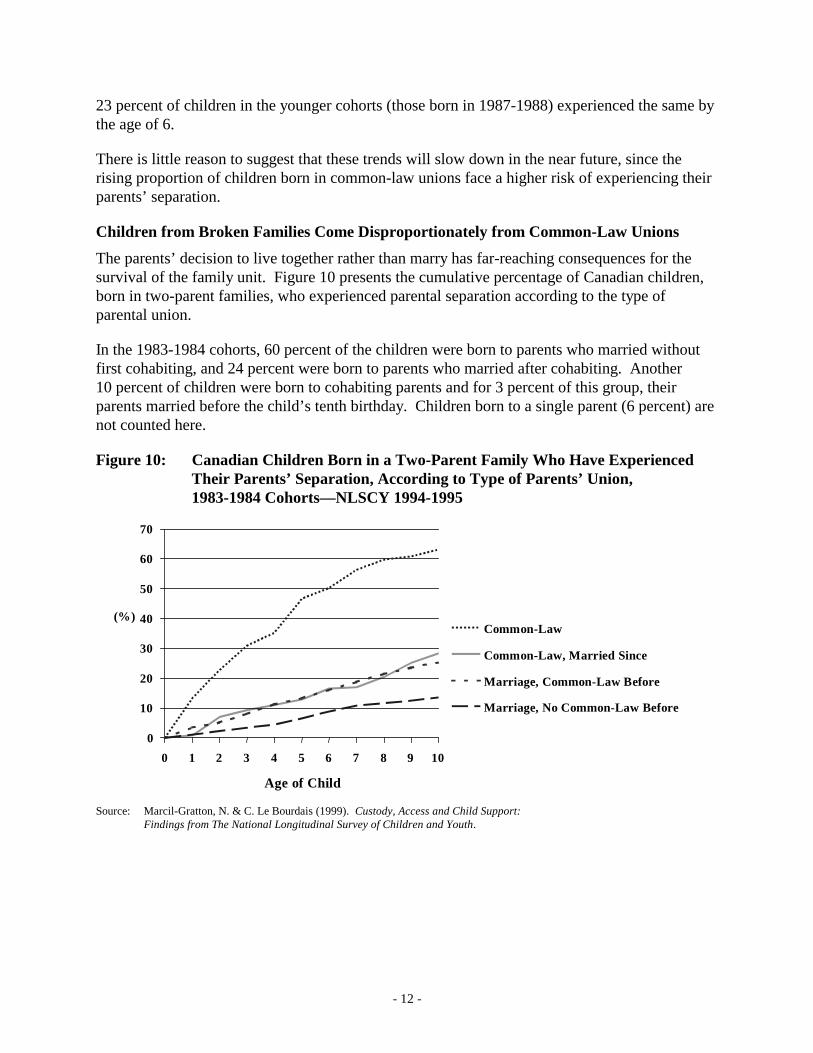
The parents’ decision to live together rather than marry has far-reaching consequences for the survival of the family unit. Figure 10 presents the cumulative percentage of Canadian children, born in two-parent families, who experienced parental separation according to the type of parental union.
In the 1983-1984 cohorts, 60 percent of the children were born to parents who married without first cohabiting, and 24 percent were born to parents who married after cohabiting. Another 10 percent of children were born to cohabiting parents and for 3 percent of this group, their parents married before the child’s tenth birthday. Children born to a single parent (6 percent) are not counted here.
Figure 10: Canadian Children Born in a Two-Parent Family Who Have Experienced Their Parents’ Separation, According to Type of Parents’ Union, 1983-1984 Cohorts—NLSCY 1994-1995
0
10
20
30
40
50
60
70
0 1 2 3 4 5 6 7 8 9 10
Age of Child
(%)Common-Law
Common-Law, Married Since
Marriage, Common-Law Before
Marriage, No Common-Law Before
Source: Marcil-Gratton, N. & C. Le Bourdais (1999). Custody, Access and Child Support:
Findings from The National Longitudinal Survey of Children and Youth.
- 13 -
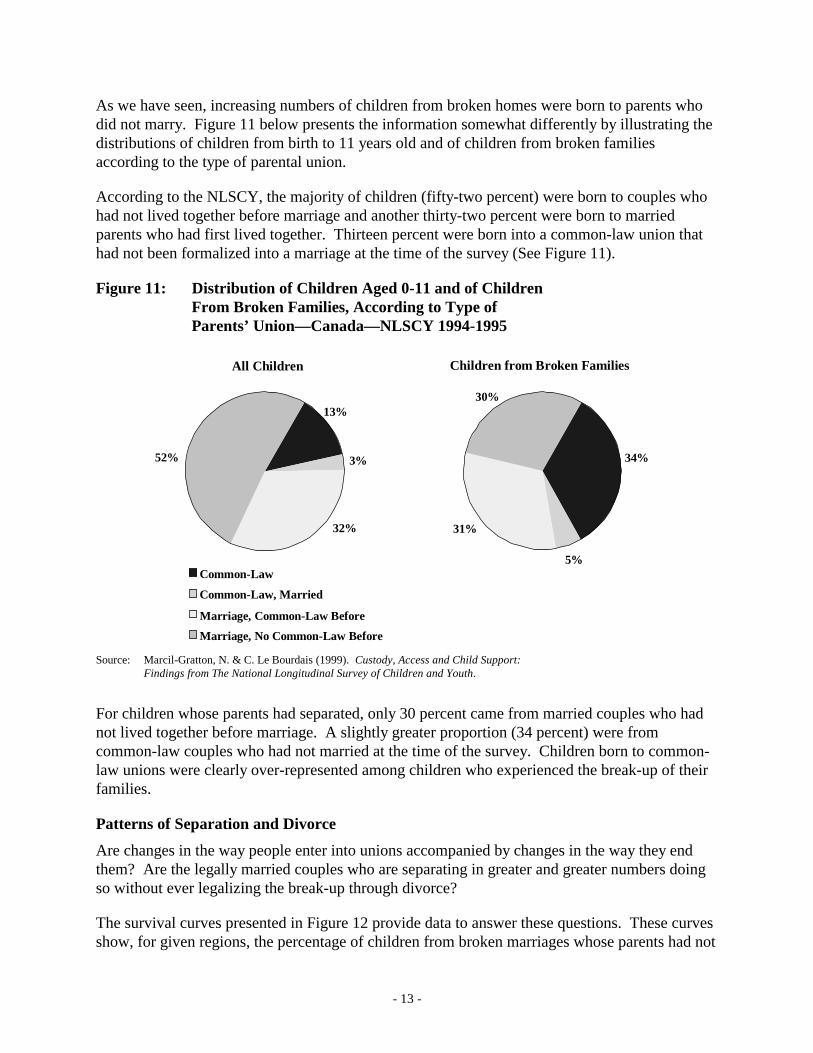
As we have seen, increasing numbers of children from broken homes were born to parents who did not marry. Figure 11 below presents the information somewhat differently by illustrating the distributions of children from birth to 11 years old and of children from broken families according to the type of parental union.
According to the NLSCY, the majority of children (fifty-two percent) were born to couples who had not lived together before marriage and another thirty-two percent were born to married parents who had first lived together. Thirteen percent were born into a common-law union that had not been formalized into a marriage at the time of the survey (See Figure 11).
Figure 11: Distribution of Children Aged 0-11 and of Children From Broken Families, According to Type of Parents’ Union—Canada—NLSCY 1994-1995
13%
3%52%
32%
Common-Law
Common-Law, MarriedSMarriage, Common-Law Before
Marriage, No Common-Law Before
30%
31%
5%
34%
Children from Broken FamiliesAll Children
Source: Marcil-Gratton, N. & C. Le Bourdais (1999). Custody, Access and Child Support:
Findings from The National Longitudinal Survey of Children and Youth.
For children whose parents had separated, only 30 percent came from married couples who had not lived together before marriage. A slightly greater proportion (34 percent) were from common-law couples who had not married at the time of the survey. Children born to common-law unions were clearly over-represented among children who experienced the break-up of their families.
Patterns of Separation and Divorce
Are changes in the way people enter into unions accompanied by changes in the way they end them? Are the legally married couples who are separating in greater and greater numbers doing so without ever legalizing the break-up through divorce?
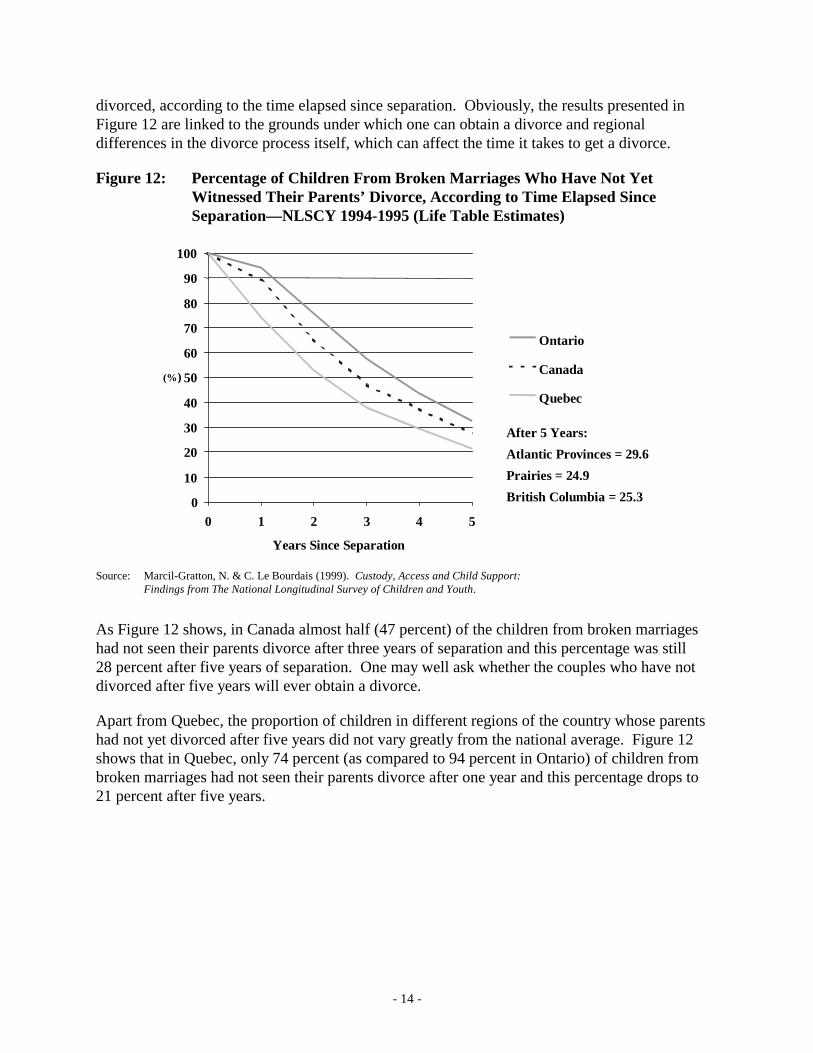
The survival curves presented in Figure 12 provide data to answer these questions. These curves show, for given regions, the percentage of children from broken marriages whose parents had not
- 14 -
divorced, according to the time elapsed since separation. Obviously, the results presented in Figure 12 are linked to the grounds under which one can obtain a divorce and regional differences in the divorce process itself, which can affect the time it takes to get a divorce.
Figure 12: Percentage of Children From Broken Marriages Who Have Not Yet Witnessed Their Parents’ Divorce, According to Time Elapsed Since Separation—NLSCY 1994-1995 (Life Table Estimates)
0
10
20
30
40
50
60
70
80
90
100
0 1 2 3 4 5
Years Since Separation
(%)
Ontario
Canada
Quebec
After 5 Years:
Atlantic Provinces = 29.6
Prairies = 24.9
British Columbia = 25.3
Source: Marcil-Gratton, N. & C. Le Bourdais (1999). Custody, Access and Child Support:
Findings from The National Longitudinal Survey of Children and Youth.
As Figure 12 shows, in Canada almost half (47 percent) of the children from broken marriages had not seen their parents divorce after three years of separation and this percentage was still 28 percent after five years of separation. One may well ask whether the couples who have not divorced after five years will ever obtain a divorce.
Apart from Quebec, the proportion of children in different regions of the country whose parents had not yet divorced after five years did not vary greatly from the national average. Figure 12 shows that in Quebec, only 74 percent (as compared to 94 percent in Ontario) of children from broken marriages had not seen their parents divorce after one year and this percentage drops to 21 percent after five years.
- 15 -
CHILD CUSTODY
Custody Arrangements
More and more couples are living together and having children without marrying. Often, family break-ups occur without any recourse to the legal system. Does this affect the likelihood of separated parents obtaining a court order for custody? Is the issue of custody increasingly settled out of court? The NLSCY provides a wealth of information on the arrangements parents make for the care of their children when they separate.
Existence of Court Orders for Custody and Variations by Time Since Separation and Type of Separation
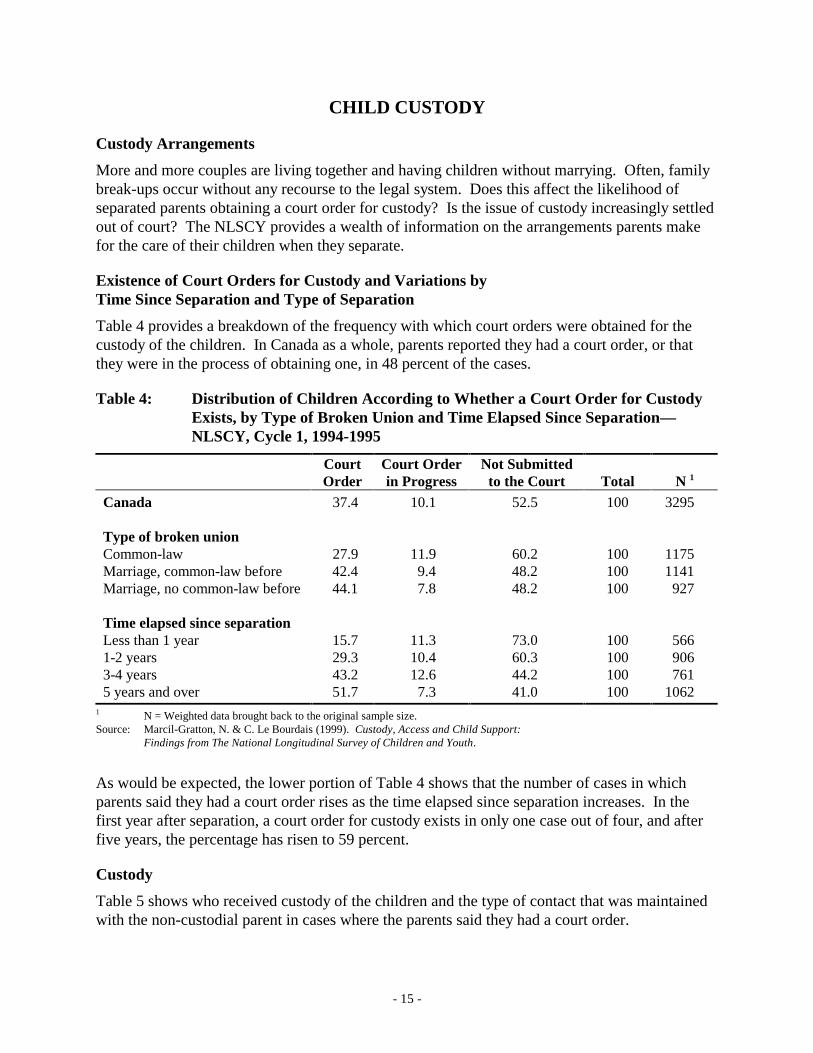
Table 4 provides a breakdown of the frequency with which court orders were obtained for the custody of the children. In Canada as a whole, parents reported they had a court order, or that they were in the process of obtaining one, in 48 percent of the cases.
Table 4: Distribution of Children According to Whether a Court Order for Custody Exists, by Type of Broken Union and Time Elapsed Since Separation—NLSCY, Cycle 1, 1994-1995
Court Order
Court Order in Progress
Not Submitted to the Court Total N 1
Canada 37.4 10.1 52.5 100 3295 Type of broken union Common-law 27.9 11.9 60.2 100 1175 Marriage, common-law before 42.4 9.4 48.2 100 1141 Marriage, no common-law before 44.1 7.8 48.2 100 927 Time elapsed since separation Less than 1 year 15.7 11.3 73.0 100 566 1-2 years 29.3 10.4 60.3 100 906 3-4 years 43.2 12.6 44.2 100 761 5 years and over 51.7 7.3 41.0 100 1062
1 N = Weighted data brought back to the original sample size. Source: Marcil-Gratton, N. & C. Le Bourdais (1999). Custody, Access and Child Support: Findings from The National Longitudinal Survey of Children and Youth.
As would be expected, the lower portion of Table 4 shows that the number of cases in which parents said they had a court order rises as the time elapsed since separation increases. In the first year after separation, a court order for custody exists in only one case out of four, and after five years, the percentage has risen to 59 percent.
Custody
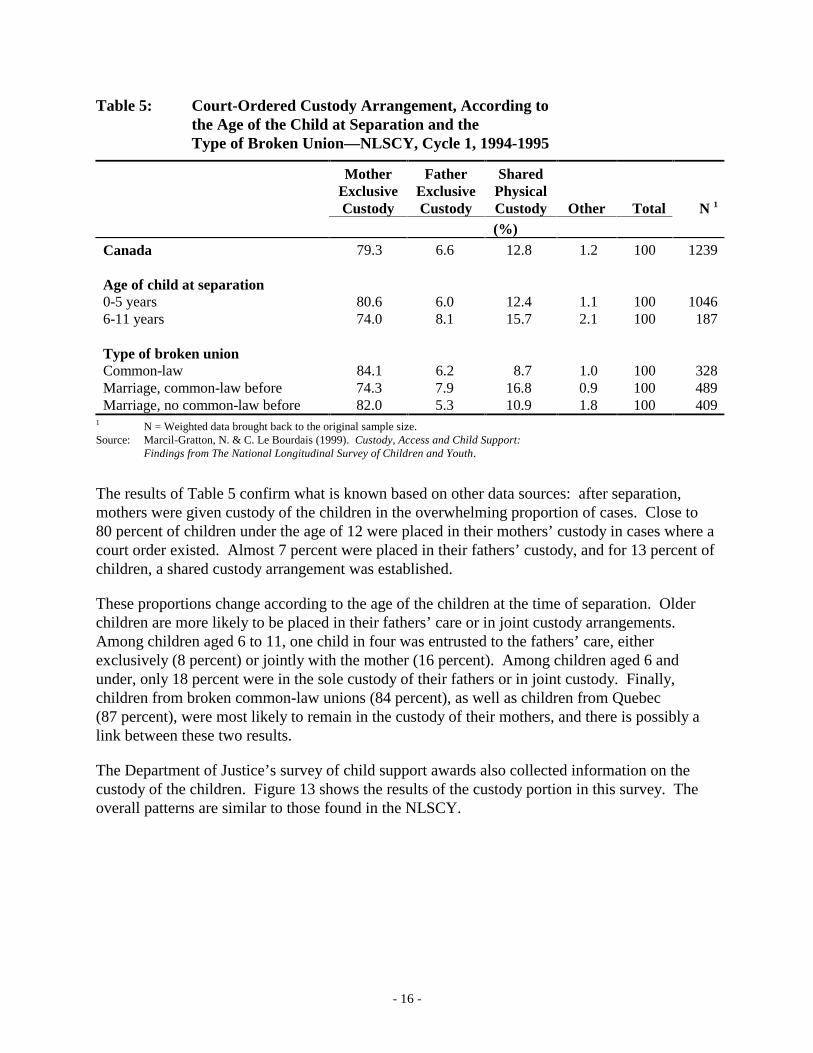
Table 5 shows who received custody of the children and the type of contact that was maintained with the non-custodial parent in cases where the parents said they had a court order.
- 16 -
Table 5: Court-Ordered Custody Arrangement, According to the Age of the Child at Separation and the Type of Broken Union—NLSCY, Cycle 1, 1994-1995
Mother Exclusive Custody
Father Exclusive Custody
Shared Physical Custody Other Total N 1
(%)
Canada 79.3 6.6 12.8 1.2 100 1239 Age of child at separation 0-5 years 80.6 6.0 12.4 1.1 100 1046 6-11 years 74.0 8.1 15.7 2.1 100 187 Type of broken union Common-law 84.1 6.2 8.7 1.0 100 328 Marriage, common-law before 74.3 7.9 16.8 0.9 100 489 Marriage, no common-law before 82.0 5.3 10.9 1.8 100 409
1 N = Weighted data brought back to the original sample size. Source: Marcil-Gratton, N. & C. Le Bourdais (1999). Custody, Access and Child Support: Findings from The National Longitudinal Survey of Children and Youth.
The results of Table 5 confirm what is known based on other data sources: after separation, mothers were given custody of the children in the overwhelming proportion of cases. Close to 80 percent of children under the age of 12 were placed in their mothers’ custody in cases where a court order existed. Almost 7 percent were placed in their fathers’ custody, and for 13 percent of children, a shared custody arrangement was established.
These proportions change according to the age of the children at the time of separation. Older children are more likely to be placed in their fathers’ care or in joint custody arrangements. Among children aged 6 to 11, one child in four was entrusted to the fathers’ care, either exclusively (8 percent) or jointly with the mother (16 percent). Among children aged 6 and under, only 18 percent were in the sole custody of their fathers or in joint custody. Finally, children from broken common-law unions (84 percent), as well as children from Quebec (87 percent), were most likely to remain in the custody of their mothers, and there is possibly a link between these two results.
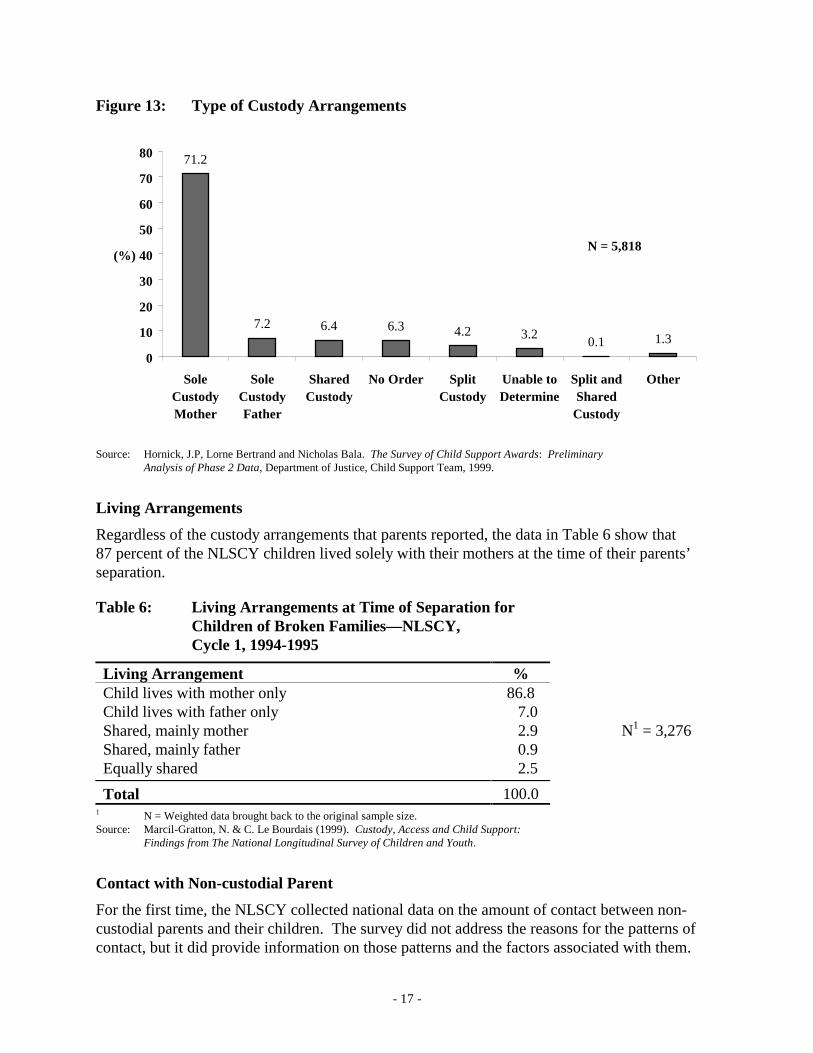
The Department of Justice’s survey of child support awards also collected information on the custody of the children. Figure 13 shows the results of the custody portion in this survey. The overall patterns are similar to those found in the NLSCY.
- 17 -
Figure 13: Type of Custody Arrangements
71.2
7.2 6.4 6.3 4.2 3.20.1 1.3
0
10
20
30
40
50
60
70
80
SoleCustodyMother
SoleCustodyFather
SharedCustody
No Order SplitCustody
Unable toDetermine
Split andShared
Custody
Other
(%)N = 5,818
Source: Hornick, J.P, Lorne Bertrand and Nicholas Bala. The Survey of Child Support Awards: Preliminary Analysis of Phase 2 Data, Department of Justice, Child Support Team, 1999.
Living Arrangements
Regardless of the custody arrangements that parents reported, the data in Table 6 show that 87 percent of the NLSCY children lived solely with their mothers at the time of their parents’ separation.
Table 6: Living Arrangements at Time of Separation for Children of Broken Families—NLSCY, Cycle 1, 1994-1995
Living Arrangement % Child lives with mother only 86.8 Child lives with father only 7.0 Shared, mainly mother 2.9 N1 = 3,276 Shared, mainly father 0.9 Equally shared 2.5
Total 100.0 1 N = Weighted data brought back to the original sample size. Source: Marcil-Gratton, N. & C. Le Bourdais (1999). Custody, Access and Child Support: Findings from The National Longitudinal Survey of Children and Youth.
Contact with Non-custodial Parent
For the first time, the NLSCY collected national data on the amount of contact between non-custodial parents and their children. The survey did not address the reasons for the patterns of contact, but it did provide information on those patterns and the factors associated with them.
- 18 -
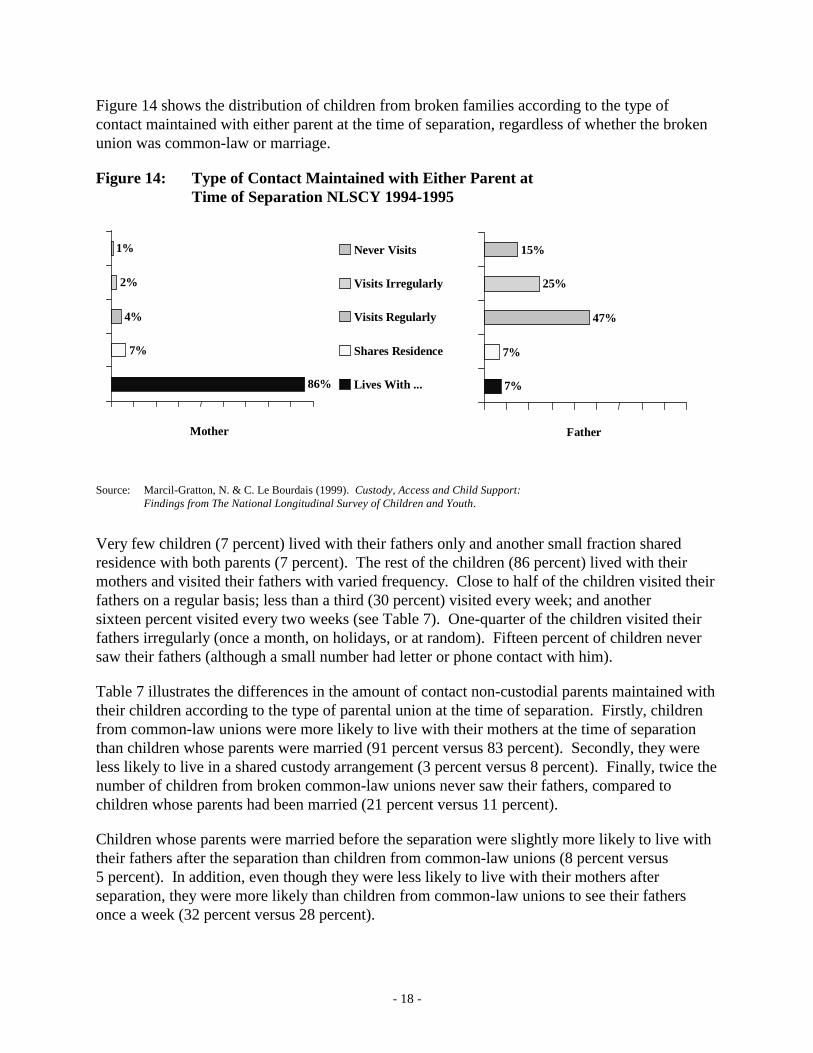
Figure 14 shows the distribution of children from broken families according to the type of contact maintained with either parent at the time of separation, regardless of whether the broken union was common-law or marriage.
Figure 14: Type of Contact Maintained with Either Parent at Time of Separation NLSCY 1994-1995
7%
7%
47%
25%
15%
0%
10%
20%
30%
40%
50%
60%
70%
80%
90%
100%
200%
300%
400%
500%
7%
86%
4%
1%
2%
0%
10%
20%
30%
40%
50%
60%
70%
80%
90%
Never Visits
Visits Irregularly
Visits Regularly
Shares Residence
Lives With ...
FatherMother
Source: Marcil-Gratton, N. & C. Le Bourdais (1999). Custody, Access and Child Support:
Findings from The National Longitudinal Survey of Children and Youth.
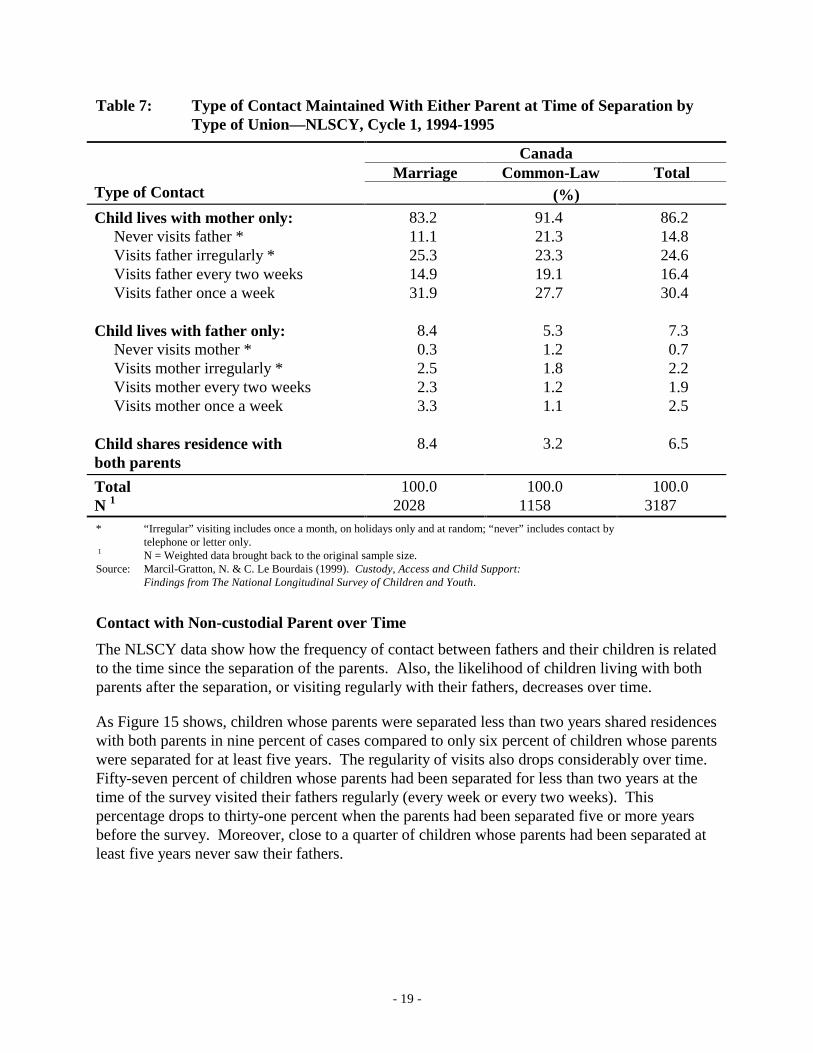
Very few children (7 percent) lived with their fathers only and another small fraction shared residence with both parents (7 percent). The rest of the children (86 percent) lived with their mothers and visited their fathers with varied frequency. Close to half of the children visited their fathers on a regular basis; less than a third (30 percent) visited every week; and another sixteen percent visited every two weeks (see Table 7). One-quarter of the children visited their fathers irregularly (once a month, on holidays, or at random). Fifteen percent of children never saw their fathers (although a small number had letter or phone contact with him).
Table 7 illustrates the differences in the amount of contact non-custodial parents maintained with their children according to the type of parental union at the time of separation. Firstly, children from common-law unions were more likely to live with their mothers at the time of separation than children whose parents were married (91 percent versus 83 percent). Secondly, they were less likely to live in a shared custody arrangement (3 percent versus 8 percent). Finally, twice the number of children from broken common-law unions never saw their fathers, compared to children whose parents had been married (21 percent versus 11 percent).
Children whose parents were married before the separation were slightly more likely to live with their fathers after the separation than children from common-law unions (8 percent versus 5 percent). In addition, even though they were less likely to live with their mothers after separation, they were more likely than children from common-law unions to see their fathers once a week (32 percent versus 28 percent).
- 19 -
Table 7: Type of Contact Maintained With Either Parent at Time of Separation by Type of Union—NLSCY, Cycle 1, 1994-1995
Canada Marriage Common-Law Total Type of Contact (%) Child lives with mother only: 83.2 91.4 86.2 Never visits father * 11.1 21.3 14.8 Visits father irregularly * 25.3 23.3 24.6 Visits father every two weeks 14.9 19.1 16.4 Visits father once a week 31.9 27.7 30.4 Child lives with father only: 8.4 5.3 7.3 Never visits mother * 0.3 1.2 0.7 Visits mother irregularly * 2.5 1.8 2.2 Visits mother every two weeks 2.3 1.2 1.9 Visits mother once a week 3.3 1.1 2.5 Child shares residence with both parents
8.4 3.2 6.5
Total 100.0 100.0 100.0 N 1 2028 1158 3187 * “Irregular” visiting includes once a month, on holidays only and at random; “never” includes contact by telephone or letter only. 1 N = Weighted data brought back to the original sample size. Source: Marcil-Gratton, N. & C. Le Bourdais (1999). Custody, Access and Child Support: Findings from The National Longitudinal Survey of Children and Youth.
Contact with Non-custodial Parent over Time
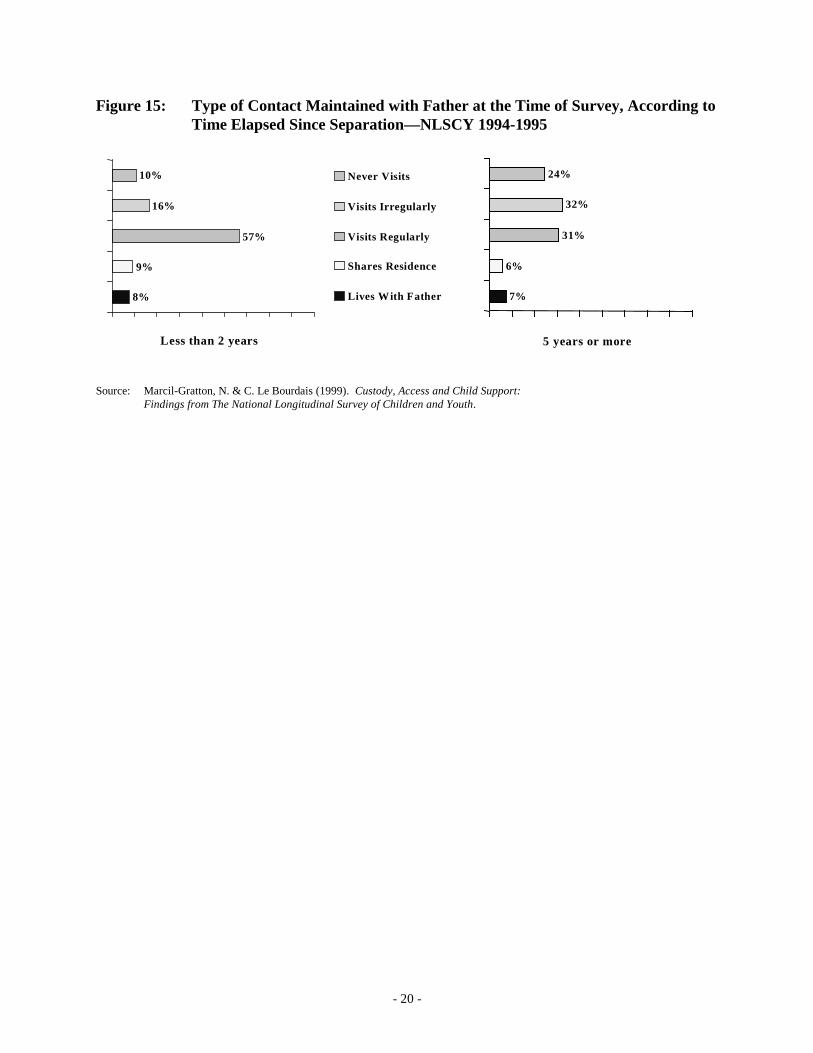
The NLSCY data show how the frequency of contact between fathers and their children is related to the time since the separation of the parents. Also, the likelihood of children living with both parents after the separation, or visiting regularly with their fathers, decreases over time.
As Figure 15 shows, children whose parents were separated less than two years shared residences with both parents in nine percent of cases compared to only six percent of children whose parents were separated for at least five years. The regularity of visits also drops considerably over time. Fifty-seven percent of children whose parents had been separated for less than two years at the time of the survey visited their fathers regularly (every week or every two weeks). This percentage drops to thirty-one percent when the parents had been separated five or more years before the survey. Moreover, close to a quarter of children whose parents had been separated at least five years never saw their fathers.
- 20 -
Figure 15: Type of Contact Maintained with Father at the Time of Survey, According to Time Elapsed Since Separation—NLSCY 1994-1995
7%
6%
31%
32%
24%
0%
10%
20%
30%
40%
50%
60%
70%
80%
90%
100%
200%
300%
400%
500%
9%
8%
57%
10%
16%
0%
10%
20%
30%
40%
50%
60%
70%
80%
90%
Never Visits
Visits Irregularly
Visits Regularly
Shares Residence
Lives With Father
5 years or moreLess than 2 years
Source: Marcil-Gratton, N. & C. Le Bourdais (1999). Custody, Access and Child Support: Findings from The National Longitudinal Survey of Children and Youth.
- 21 -
CHILD AND SPOUSAL SUPPORT PAYMENTS
Information on child and spousal support payments is available from a variety of sources. Six sources are considered here. Revenue Canada publishes yearly tax statistics which provide the number of persons paying and receiving alimony, 2 the amounts paid, the amounts claimed as income, and the sources of income of payers and recipients. Statistics Canada’s Survey of Labour and Income Dynamics is a longitudinal survey of households in which respondents provide details on their sources of income, and support payments appears as a separate data element here. There were also several questions on child support in the NLSCY. Finally, the Department of Justice’s survey of child support awards collects data on child support orders in 11 courts across the country to monitor the implementation of the Federal Child Support Guidelines.
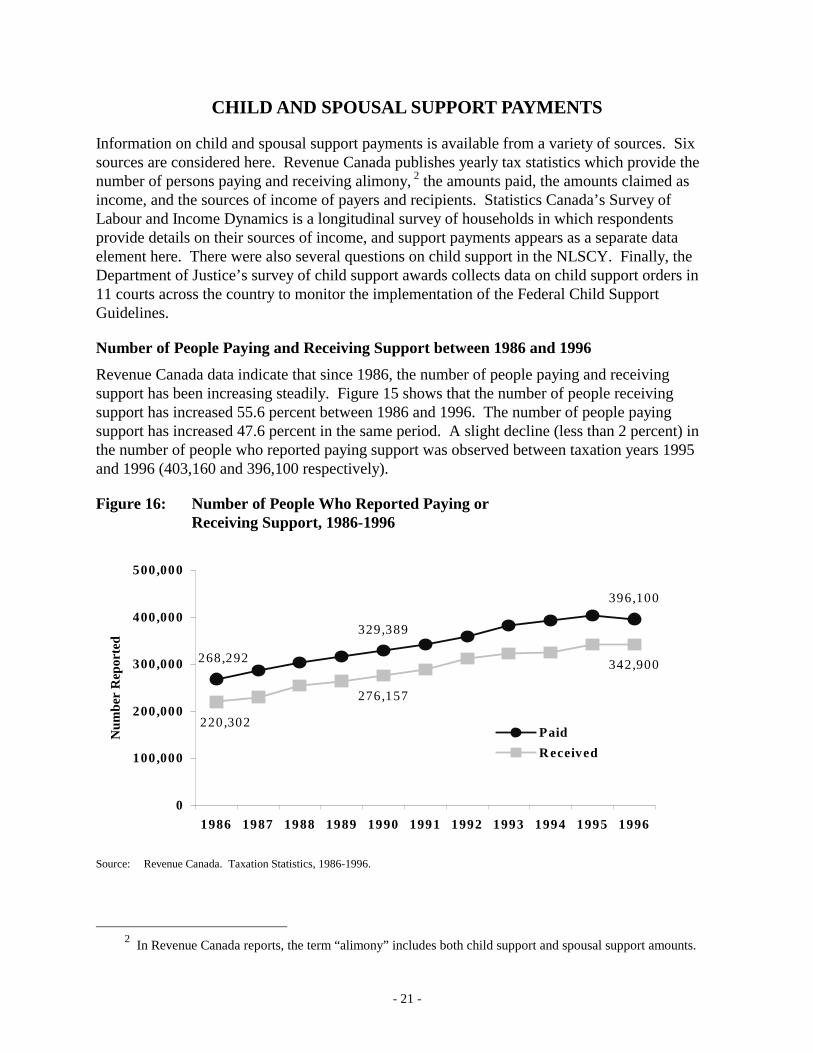
Number of People Paying and Receiving Support between 1986 and 1996
Revenue Canada data indicate that since 1986, the number of people paying and receiving support has been increasing steadily. Figure 15 shows that the number of people receiving support has increased 55.6 percent between 1986 and 1996. The number of people paying support has increased 47.6 percent in the same period. A slight decline (less than 2 percent) in the number of people who reported paying support was observed between taxation years 1995 and 1996 (403,160 and 396,100 respectively).
Figure 16: Number of People Who Reported Paying or Receiving Support, 1986-1996
Source: Revenue Canada. Taxation Statistics, 1986-1996.
2 In Revenue Canada reports, the term “alimony” includes both child support and spousal support amounts.
396,100
329,389
268,292 342,900
220,302
276,157
0
100,000
200,000
300,000
400,000
500,000
1986 1987 1988 1989 1990 1991 1992 1993 1994 1995 1996
Num
ber
Rep
orte
d
Paid
Received
- 22 -
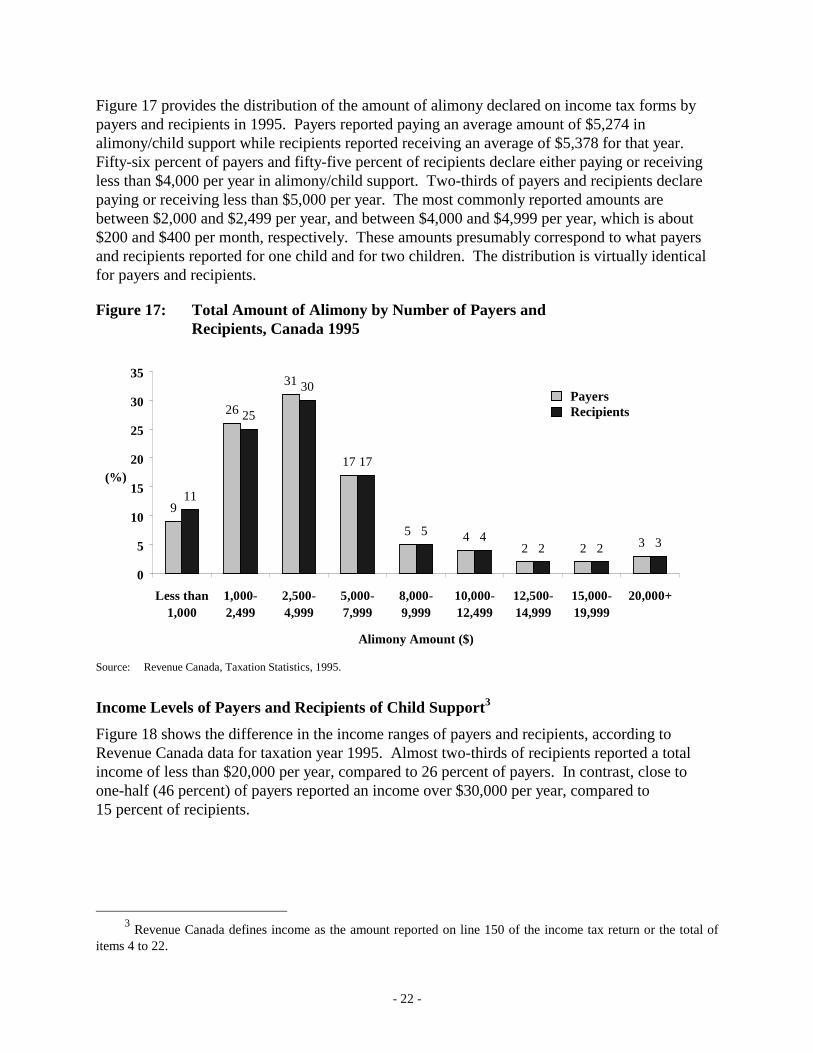
Figure 17 provides the distribution of the amount of alimony declared on income tax forms by payers and recipients in 1995. Payers reported paying an average amount of $5,274 in alimony/child support while recipients reported receiving an average of $5,378 for that year. Fifty-six percent of payers and fifty-five percent of recipients declare either paying or receiving less than $4,000 per year in alimony/child support. Two-thirds of payers and recipients declare paying or receiving less than $5,000 per year. The most commonly reported amounts are between $2,000 and $2,499 per year, and between $4,000 and $4,999 per year, which is about $200 and $400 per month, respectively. These amounts presumably correspond to what payers and recipients reported for one child and for two children. The distribution is virtually identical for payers and recipients.
Figure 17: Total Amount of Alimony by Number of Payers and Recipients, Canada 1995
Source: Revenue Canada, Taxation Statistics, 1995.
Income Levels of Payers and Recipients of Child Support3
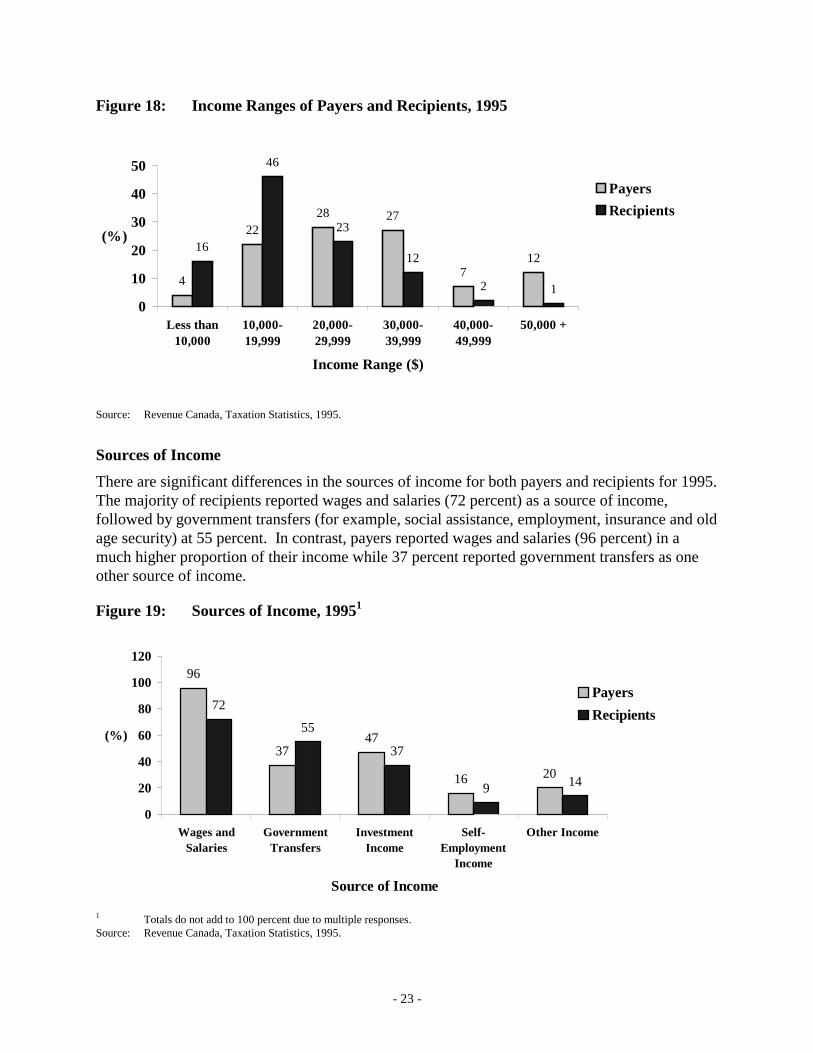
Figure 18 shows the difference in the income ranges of payers and recipients, according to Revenue Canada data for taxation year 1995. Almost two-thirds of recipients reported a total income of less than $20,000 per year, compared to 26 percent of payers. In contrast, close to one-half (46 percent) of payers reported an income over $30,000 per year, compared to 15 percent of recipients.
3 Revenue Canada defines income as the amount reported on line 150 of the income tax return or the total of
items 4 to 22.
9
26
31
17
5 42 2 3
11
25
30
17
5 42 2 3
0
5
10
15
20
25
30
35
Less than1,000
1,000-2,499
2,500-4,999
5,000-7,999
8,000-9,999
10,000-12,499
12,500-14,999
15,000-19,999
20,000+
Alimony Amount ($)
(%)
Payers Recipients
- 23 -
Figure 18: Income Ranges of Payers and Recipients, 1995
Source: Revenue Canada, Taxation Statistics, 1995.
Sources of Income
There are significant differences in the sources of income for both payers and recipients for 1995. The majority of recipients reported wages and salaries (72 percent) as a source of income, followed by government transfers (for example, social assistance, employment, insurance and old age security) at 55 percent. In contrast, payers reported wages and salaries (96 percent) in a much higher proportion of their income while 37 percent reported government transfers as one other source of income.
Figure 19: Sources of Income, 19951
1 Totals do not add to 100 percent due to multiple responses. Source: Revenue Canada, Taxation Statistics, 1995.
4
2228 27
712
16
46
23
12
2 1
0
10
20
30
40
50
Less than10,000
10,000-19,999
20,000-29,999
30,000-39,999
40,000-49,999
50,000 +
Income Range ($)
(%)
Payers
Recipients
96
3747
16 20
72
55
37
9 14
0
20
40
60
80
100
120
Wages andSalaries
GovernmentTransfers
InvestmentIncome
Self-Employment
Income
Other Income
Source of Income
(%)
Payers
Recipients
- 24 -
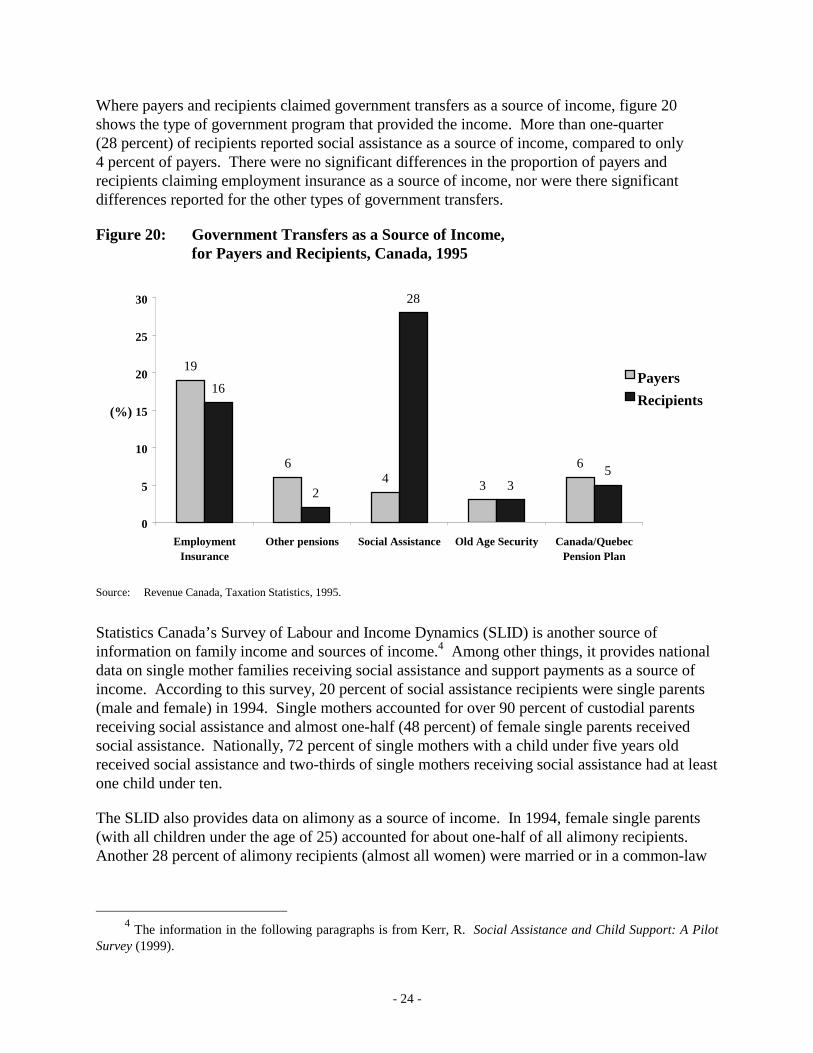
Where payers and recipients claimed government transfers as a source of income, figure 20 shows the type of government program that provided the income. More than one-quarter (28 percent) of recipients reported social assistance as a source of income, compared to only 4 percent of payers. There were no significant differences in the proportion of payers and recipients claiming employment insurance as a source of income, nor were there significant differences reported for the other types of government transfers.
Figure 20: Government Transfers as a Source of Income, for Payers and Recipients, Canada, 1995
Source: Revenue Canada, Taxation Statistics, 1995.
Statistics Canada’s Survey of Labour and Income Dynamics (SLID) is another source of information on family income and sources of income.4 Among other things, it provides national data on single mother families receiving social assistance and support payments as a source of income. According to this survey, 20 percent of social assistance recipients were single parents (male and female) in 1994. Single mothers accounted for over 90 percent of custodial parents receiving social assistance and almost one-half (48 percent) of female single parents received social assistance. Nationally, 72 percent of single mothers with a child under five years old received social assistance and two-thirds of single mothers receiving social assistance had at least one child under ten.
The SLID also provides data on alimony as a source of income. In 1994, female single parents (with all children under the age of 25) accounted for about one-half of all alimony recipients. Another 28 percent of alimony recipients (almost all women) were married or in a common-law
4 The information in the following paragraphs is from Kerr, R. Social Assistance and Child Support: A Pilot
Survey (1999).
19
64 3
6
16
2
28
35
0
5
10
15
20
25
30
EmploymentInsurance
Other pensions Social Assistance Old Age Security Canada/QuebecPension Plan
(%)
Payers
Recipients
- 25 -
relationship and had children under the age of 25. Approximately one-third of alimony recipients also received social assistance. Of these, at least 75 percent were single mothers.
Almost half (47 percent) of single mothers who received alimony also received social assistance for at least part of the year. Only one-quarter of all single mothers received alimony and this proportion does not appear to be much different for single mothers who received social assistance. The proportion of single mothers who received alimony increases to about 31 percent if only “separated and divorced” single mothers are considered (that is, excluding the “single never-married” and “widowed” mothers).
Interestingly, single mothers with two or more children are somewhat more likely to receive alimony and in larger amounts than mothers with only one child. The likelihood of single mothers receiving alimony does not appear to vary significantly by the mothers’ levels of education, except that mothers with a post-secondary degree or certificate receive higher amounts.
Child Support Arrangements
The NLSCY provides information on the child support arrangements parents made when they separated.
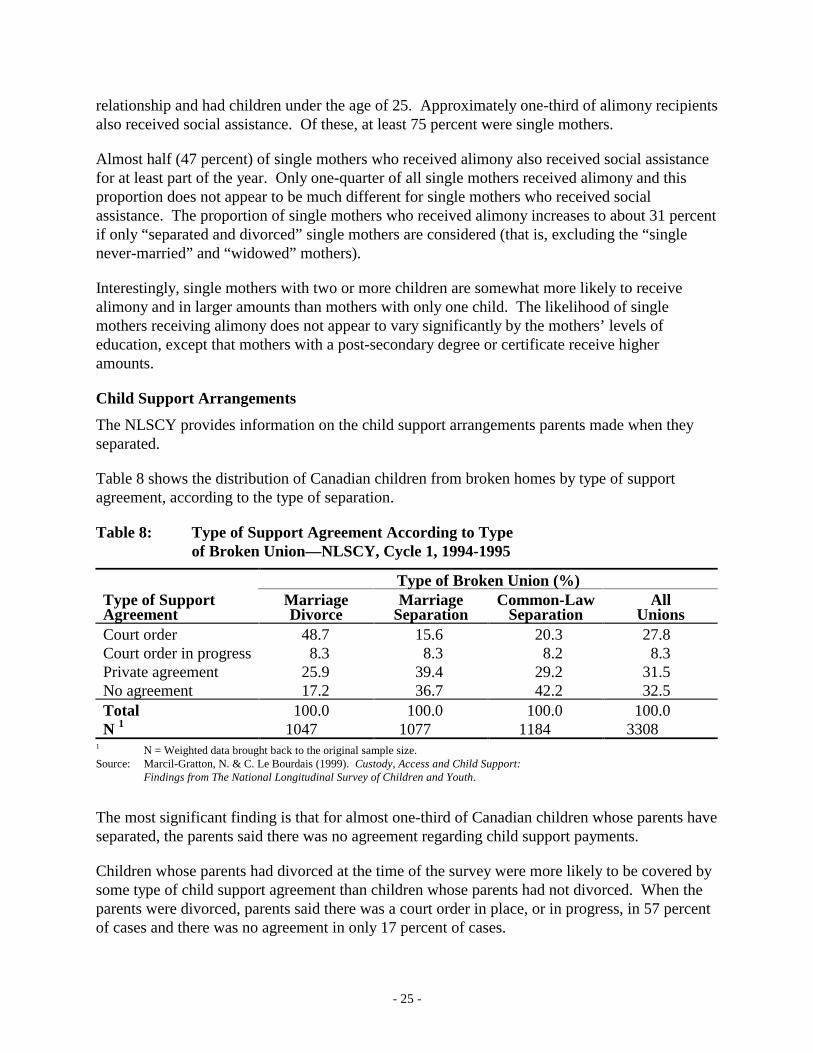
Table 8 shows the distribution of Canadian children from broken homes by type of support agreement, according to the type of separation.
Table 8: Type of Support Agreement According to Type of Broken Union—NLSCY, Cycle 1, 1994-1995
Type of Broken Union (%) Type of Support Agreement
Marriage Divorce
Marriage Separation
Common-Law Separation
All Unions
Court order 48.7 15.6 20.3 27.8 Court order in progress 8.3 8.3 8.2 8.3 Private agreement 25.9 39.4 29.2 31.5 No agreement 17.2 36.7 42.2 32.5 Total 100.0 100.0 100.0 100.0 N 1 1047 1077 1184 3308
1 N = Weighted data brought back to the original sample size. Source: Marcil-Gratton, N. & C. Le Bourdais (1999). Custody, Access and Child Support: Findings from The National Longitudinal Survey of Children and Youth.
The most significant finding is that for almost one-third of Canadian children whose parents have separated, the parents said there was no agreement regarding child support payments.
Children whose parents had divorced at the time of the survey were more likely to be covered by some type of child support agreement than children whose parents had not divorced. When the parents were divorced, parents said there was a court order in place, or in progress, in 57 percent of cases and there was no agreement in only 17 percent of cases.
- 26 -
Forty-two percent of children from broken common-law unions were not covered by any form of child support agreement. They were followed closely by children whose parents had not yet divorced at the time of the survey (thirty-seven percent).
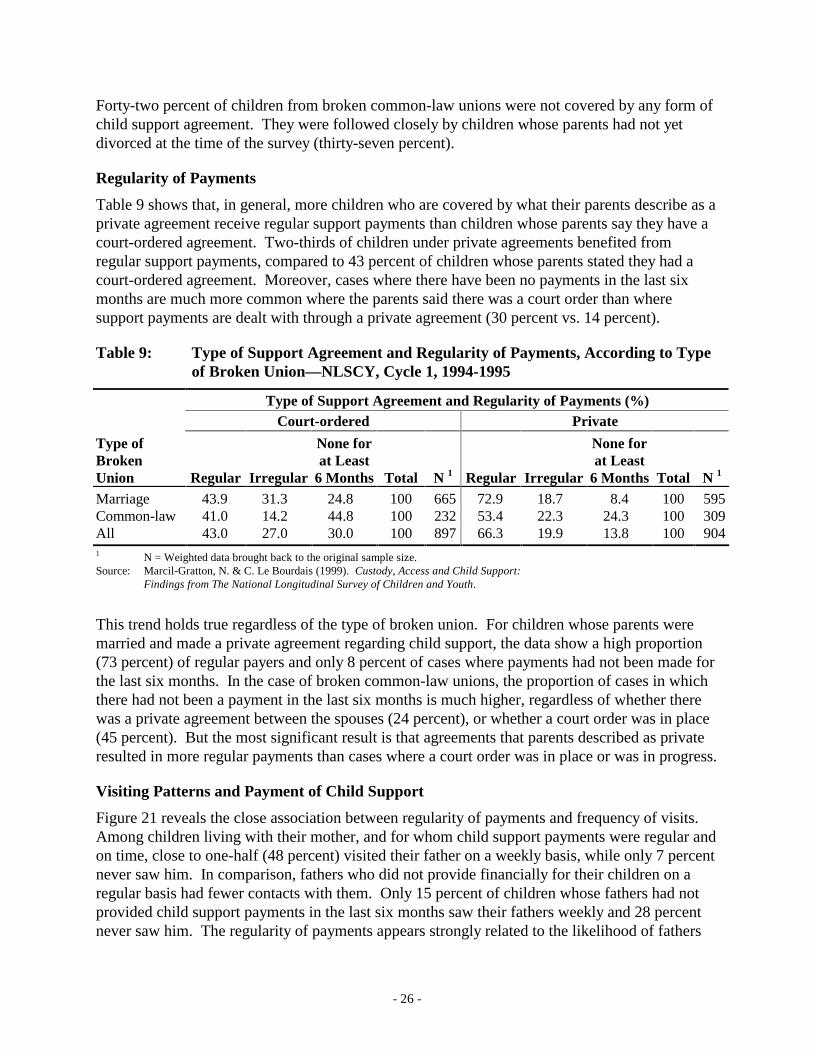
Regularity of Payments
Table 9 shows that, in general, more children who are covered by what their parents describe as a private agreement receive regular support payments than children whose parents say they have a court-ordered agreement. Two-thirds of children under private agreements benefited from regular support payments, compared to 43 percent of children whose parents stated they had a court-ordered agreement. Moreover, cases where there have been no payments in the last six months are much more common where the parents said there was a court order than where support payments are dealt with through a private agreement (30 percent vs. 14 percent).
Table 9: Type of Support Agreement and Regularity of Payments, According to Type of Broken Union—NLSCY, Cycle 1, 1994-1995
Type of Support Agreement and Regularity of Payments (%) Court-ordered Private
Type of Broken Union Regular Irregular
None for at Least
6 Months Total N 1 Regular Irregular
None for at Least
6 Months Total N 1 Marriage 43.9 31.3 24.8 100 665 72.9 18.7 8.4 100 595 Common-law 41.0 14.2 44.8 100 232 53.4 22.3 24.3 100 309 All 43.0 27.0 30.0 100 897 66.3 19.9 13.8 100 904 1 N = Weighted data brought back to the original sample size. Source: Marcil-Gratton, N. & C. Le Bourdais (1999). Custody, Access and Child Support: Findings from The National Longitudinal Survey of Children and Youth.
This trend holds true regardless of the type of broken union. For children whose parents were married and made a private agreement regarding child support, the data show a high proportion (73 percent) of regular payers and only 8 percent of cases where payments had not been made for the last six months. In the case of broken common-law unions, the proportion of cases in which there had not been a payment in the last six months is much higher, regardless of whether there was a private agreement between the spouses (24 percent), or whether a court order was in place (45 percent). But the most significant result is that agreements that parents described as private resulted in more regular payments than cases where a court order was in place or was in progress.
Visiting Patterns and Payment of Child Support
Figure 21 reveals the close association between regularity of payments and frequency of visits. Among children living with their mother, and for whom child support payments were regular and on time, close to one-half (48 percent) visited their father on a weekly basis, while only 7 percent never saw him. In comparison, fathers who did not provide financially for their children on a regular basis had fewer contacts with them. Only 15 percent of children whose fathers had not provided child support payments in the last six months saw their fathers weekly and 28 percent never saw him. The regularity of payments appears strongly related to the likelihood of fathers
- 27 -
maintaining frequent contact with their children, and the impact of this variable remains important even after controlling for the type of custody and child support arrangements, the type of union, the level of tension between parents, and the time elapsed since separation.
Figure 21: Visiting Patterns with Father, for Children Living with Mother at Time of Separation, According to Regularity of Child Support Payments—NLSCY, Cycle 1, 1994-1995
Never Visits
Visits Irregularly
Visits Every 2 Weeks
Visits Weekly
Regular Payments on Time Irregular Payments No Payment for 6 Months or More
48%7%
22%
23%
35%
22%
9%
34%
18%
39%
15%
28%
Source: Marcil-Gratton, N. & C. Le Bourdais (1999). Custody, Access and Child Support: Findings from The National Longitudinal Survey of Children and Youth.
- 28 -
APPENDIX
STATISTICS CANADA SURVEYS
National Longitudinal Survey of Children and Youth (NLSCY) This is a biennial survey of 25,000 children who were 11 and under when the survey began. The first cycle was collected in late 1994. The same families will be surveyed every two years for eight years (four cycles), with additional children (birth to one year old) added each cycle. The survey has a section entitled “Family History and Custody,” which contains information on support payments, custody and access to children by non-custodial parents. All sections of the first and second cycles of the survey have been released. The third cycle of data has been collected and is presently being released. This survey will provide detailed information on the changes in custody and access arrangements over time.
Central Registry of Divorce Proceedings (CRDP) The registry contains data on every divorce application and judgment filed in Canada since 1970. The Department of Justice Canada enters the information into a database which is edited by the Health Division of Statistics Canada and published in its annual report on divorces in Canada. The unit of count is the number of finalized divorces in a calendar year. This report includes dates of marriage and divorce numbers of children, birth dates of children and custody arrangements. Some data quality problems have been identified with the information collected on the type of custody due to varying definitions of “joint custody.”
Survey of Labour Income Dynamics (SLID) This is a longitudinal survey of households similar in content to the Survey of Consumer Finances except that the same households are surveyed every two years. Started in 1994, it collects data on support payments as an element in sources of income. The first cycle results are now being published. The results will show changes in the levels of support received by respondents as well as other changes, like those in the population receiving support.
REVENUE CANADA DATA
Tax Statistics Information is taken from Revenue Canada income tax returns including the number of payers and recipients of support, as well as the dollar amounts. Through its Statistics Division, Revenue Canada publishes basic statistical tax data on various characteristics of the returns, such as the number of returns, the number of persons reporting the different income items and deductions, and the total amounts reported in those categories. Revenue Canada may also provide the total incomes of individuals.
- 29 -
BIBLIOGRAPHY
Galarneau, Diane and Jim Sturrock 1997 Family Income After Separation. (Catalogue No. 13-588-MPB, No. 5) Ottawa: Statistics
Canada; Labour and Household Surveys Analysis Division. Hornick, J.P, Lorne Bertrand and Nicholas Bala 1999 The Survey of Child Support Awards: Preliminary Analysis of Phase 2 Data.
Ottawa: Department of Justice Canada. J&J Research Associates 1990 Evaluation of the Divorce Act 1985—Phase II: Monitoring and Evaluation.
Ottawa: Department of Justice Canada. Kerr, Richard & Associates 1999 Social Assistance and Child Support—A Pilot Study.
Ottawa: Department of Justice Canada. Lindsay, Colin 1992 Lone-parent Families in Canada. (Catalogue No. 89-522E)
Ottawa: Statistics Canada. Marcil-Gratton, Nicole and Céline Le Bourdais 1999 Custody, Access, and Child Support—Findings from the National Longitudinal Survey of
Children and Youth. Ottawa: Department of Justice Canada.
National Council of Welfare 1997 Poverty Profile 1996. (Catalogue No. H67-1/4-1995E)
Ottawa: Minister of Public Works and Government Service Canada. Revenue Canada 1994 Taxation Statistics—Analyzing the Returns of Individuals for the 1992 Taxation year and
Miscellaneous Statistics. (Catalogue No. Rv 44-1994) Ottawa. Revenue Canada 1996 Tax Statistics on Individuals, 1995. Ottawa. Statistics Canada 1997 “1996 Census: Marital Status, Common-Law Unions and Families”. The Daily.
October 14. <http://www.statcan.ca/Daily/English/971014/d971014.htm> Statistics Canada 1997 “Divorce in the 1990s.” Health Reports. Vol. 9, (2) (Catalogue No. 82-003-XPB) p. 55.
- 30 -
Statistics Canada 1990 Divorces 1987-1988. (Catalogue No. 82-003S) Ottawa. Statistics Canada 1991 Divorces 1990. (Catalogue No. 82-003S17) Ottawa. Statistics Canada
Divorces (1991, 1992, 1993, 1994, 1995). (Catalogue No. 84-213-XPB, 1991, 1992, 1993, 1994, 1995).
Statistics Canada 1996 Marriages 1995. (Catalogue No. 84-212-XPB) Ottawa. Statistics Canada 1992 Marriages and Conjugal Life in Canada. (Catalogue No. 91-534E) Ottawa. Statistics Canada 1983 Marriages and Divorces—Vital Statistics. Vol. II (Catalogue No. 84-205). Statistics Canada
“Shelf Tables: Marriages and Divorces—Vital Statistics 1986.” Unpublished data. Statistics Canada
Household Surveys Division. “Survey of Consumer Finances.” Unpublished data. The Vanier Institute of the Family 1996 Canada’s Families—They Count. Ottawa.