Embed Size (px)
Citation preview
METEOROLOGICAL APPLICATIONSMeteorol. Appl. 19: 17–25 (2012)Published online 21 February 2011 in Wiley Online Library(wileyonlinelibrary.com) DOI: 10.1002/met.249
A new radar-based storm identification and warningtechnique
Nan Li,a,b* Ming Wei,b Ben Niuc and Xiyu Mud
a Department of Atmospheric Sounding, School of Atmospheric Physics, Nanjing University of Information Science and Technology, Nanjing,China
b Key Laboratory of Meteorological Disaster of Ministry of Education, Nanjing University of Information Science and Technology, Nanjing,China
c Wuhan Central Meteorological Observatory, Wuhan, Chinad Jiangsu Institute of Meteorological Sciences, Nanjing, China
ABSTRACT: A new storm identification and warning technique is proposed which exclusively uses radar data as input.The new identification method assembles contiguous storm points to constitute 2D storm components and improve thevertical association of storm components to construct 3D storms, which can overcome the deficiencies existing in traditionalidentification methods. Based on the evolution properties and characteristic distributions, strong storms and general stormsare specified to train support vector machines (SVMs) which then can be used to discriminate storms. The performance ofthe SVM shows that it can indicate the intensity and development of a storm, providing an important aid in severe weatherwarning. Copyright 2011 Royal Meteorological Society
KEY WORDS storm characteristics; hypothesis testing; support vector machine
Received 27 July 2010; Revised 19 November 2010; Accepted 21 December 2010
1. Introduction
Convective weather systems such as hailstorms, rain-storms and tornadoes may bring serious damage to dailyproduction and life. Therefore, it is meaningful to pro-mote the prediction level of convective weather and givea practical warning alarm to reduce casualties and prop-erty losses. With high temporal and spatial resolution,Doppler weather radar can provide information such asreflectivity, radial velocity and spectral width, of impor-tance in nowcasting compared to other traditional proce-dures. Storm identification and monitoring through radarsystems and computer technology become an importanttechnique for severe weather warning.
Storm identification can be roughly divided into twocategories: cross-correlation methods and centroid meth-ods. The cross-correlation method takes the 2D reflectiv-ity data to calculate the motion vectors of subregions thatcan be used to forecast the storm movement (Rinehartand Garvey, 1978; Li et al., 1995). This method can-not identify and track individual storms, which constrainsobtaining detailed storm parameters. In contrast, the cen-troid method (Crane, 1979; Browning et al., 1982; Rosen-feld, 1987) identifies storm entities within single radarvolume scan data and tracks storms across consecutivescans followed by forecasting storm positions based onthe movement of the identified storm centroids. Becausethe centroid method can provide characteristic parameters
* Correspondence to: Nan Li, School of Atmospheric Physics, NanjingUniversity of Information Science and Technology, Nanjing, China.E-mail: [email protected]
of storms it draws more attention in severe weather warn-ing. Typical centroid methods include TITAN (Thunder-storm Identification, Tracking, Analysis and Nowcasting)(Dixon and Wiener, 1993) and SCIT (Storm Cell Iden-tification and Tracking) (Johnson et al., 1998), whichare widely used throughout the world. They generallytake three steps to perform storm identification using areflectivity threshold (e.g. 35 dBZ in TITAN) or sev-eral thresholds (e.g. 30, 35, 40, 45, 50, 55 and 60 dBZin SCIT). The procedure is: (1) contiguous sequences ofpoints are searched and recorded along radials to create1D storm segments if the reflectivity exceeds the thresh-old; (2) storm segments are combined to constitute 2Dstorm components if a continuity requirement is satisfiedby neighbouring storm segments on the same PPI scan,and, (3) storm components are associated with each otherto construct 3D storms on different PPI scans. The defectof this procedure lies in the fact that it needs firstly tosearch storm segments in radials and secondly composestorm components in azimuths, possibly causing iden-tification errors and track failures especially for stormswith irregular shapes or variable wind speeds (Han et al.,2009). Occasionally, several storm components may actu-ally be detected as one when they are clustered closely,or a single storm component may be detected as several(Johnson et al., 1998).
Nowcasting has become an increasingly important andspecialized subject when forecasters need to make criti-cal operational decisions in the face of rapidly develop-ing weather situations in weather services (Liljas, 1998).Radar-based nowcasting techniques are superior to NWP
Copyright 2011 Royal Meteorological Society
18 N. Li et al.
models for periods less than a few hours when the modelperformance has not yet stabilized (Li and Lai, 2004).Traditional schemes are mainly for location forecast-ing which has been based primarily on the extrapola-tion of radar reflectivity echoes (Wilson et al., 1998),or longevity forecasting which has been based on stormcharacteristics and clear-air signatures (Henry, 1993; Wil-son and Megenhardt, 1997; MacKeen et al., 1999). Fewerstudies have focused on storm properties indicating theconvective stage or intensity which can provide real-timewarning information. Hand and Conway (1995) used asimple conceptual model to depict and forecast the lifecycle of a convective storm as a sequence of six stages.However, the initial stage is only determined by the cor-responding reflectivities whose values were suggested byexperience and by the beam height which varies withthe distance from the radar. Besides, little use was madeof conventional surface observations while assumptionsand approximations were often applied in ascertainingthe storm stage that many of these would require inves-tigation and refinement. Furthermore, the geostationarysatellite data and mesoscale NWP model were involved inthe scheme, which constrains the temporal and spatial res-olution. Hu et al. (2007) computed the convection indexfor storm intensity which can serve as a warning toolaccording to the statistical distribution of storm charac-teristics. However, the contributions of different charac-teristics are considered to be the same (equal weights areadopted in the convection index). Additionally, choicesof strong storms and membership functions lack uniformand precise standards.
In this paper, a new storm identification and warn-ing scheme is proposed. Taking account of defects ofcommonly used identification methods, the new stormidentification algorithm is designed to improve the iden-tification pattern. Storms appearing in Jiangsu Province ofChina during convective weather processes from 2007 to2009 are identified with the new algorithm from the dataof a new generation of Doppler weather radar in Nanjing.According to the evolution properties and characteristicdistributions of storms, strong storms and general stormsare specified to train the support vector machine (SVM)which then can be used to discriminate storms. In thisway, effective warning alarms can be provided when astrong storm emerges.
2. The new storm identification method
2.1. The method of assembling contiguous points for2D storm component
Avoiding defects of traditional storm identification algo-rithms used in TITAN and SCIT, a new algorithm isdesigned to identify 2D storm components simultane-ously in both directions. The basic idea of the algorithm isvery simple. Points with reflectivity exceeding the thresh-old (one threshold as in TITAN or several thresholds asin SCIT) determined in advance are searched to serveas storm points. Contiguous storm points constituting a
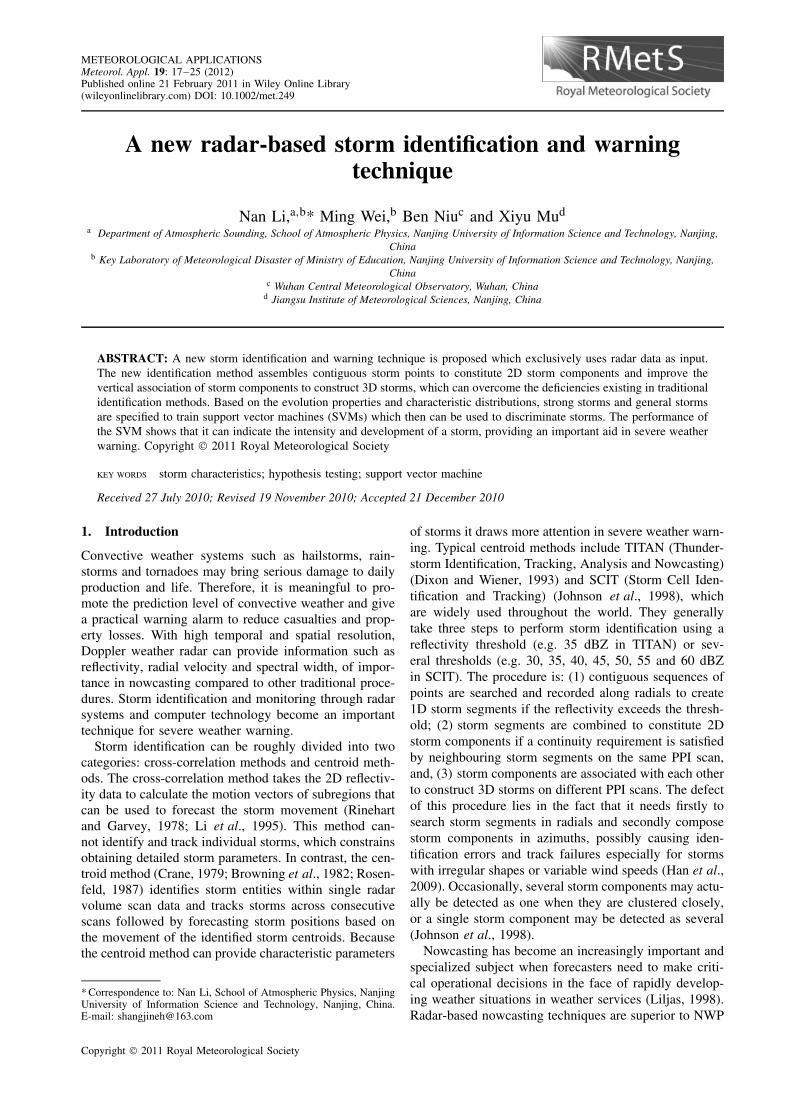
Figure 1. A schematic diagram of the algorithm for assemblingcontiguous points. R represents a storm point whose reflectivity exceedsthe threshold. The number at the top left corner represents the serialnumber of the storm component to which the storm point belongs,while the number at the top right corner represents the serial number
of the step in which the storm point is assembled.
2D storm component are then assembled group by groupuntil all storm components have been identified. Con-tiguous points are defined as the eight points around areference point on a 2D plane.
In the first step of assembling, a storm point serves asthe original reference to assemble its contiguous pointswhich serve as the references in the second step. Theinitial reference point is excluded from the second step toavoid repeated assembling. The storm points contiguousto the reference points assembled in the second step serveas the references in the third step and each referencepoint and its contiguous points which have been alreadyassembled are excluded from the assembling for thenext reference point to avoid repeated assembling. Thisprocedure is repeated one after another until no stormpoints contiguous to the reference points can be foundin a step. Consequently, the storm points that have beenassembled constitute a 2D storm component. Other stormcomponents are identified in the same way until all stormpoints have been assembled. Figure 1 is a schematicdiagram of the algorithm for assembling contiguouspoints. After all storm components are identified, thosewhose areas are less than a threshold are eliminated forthe sake of noise filtering (e.g. storm component 1 inFigure 1).
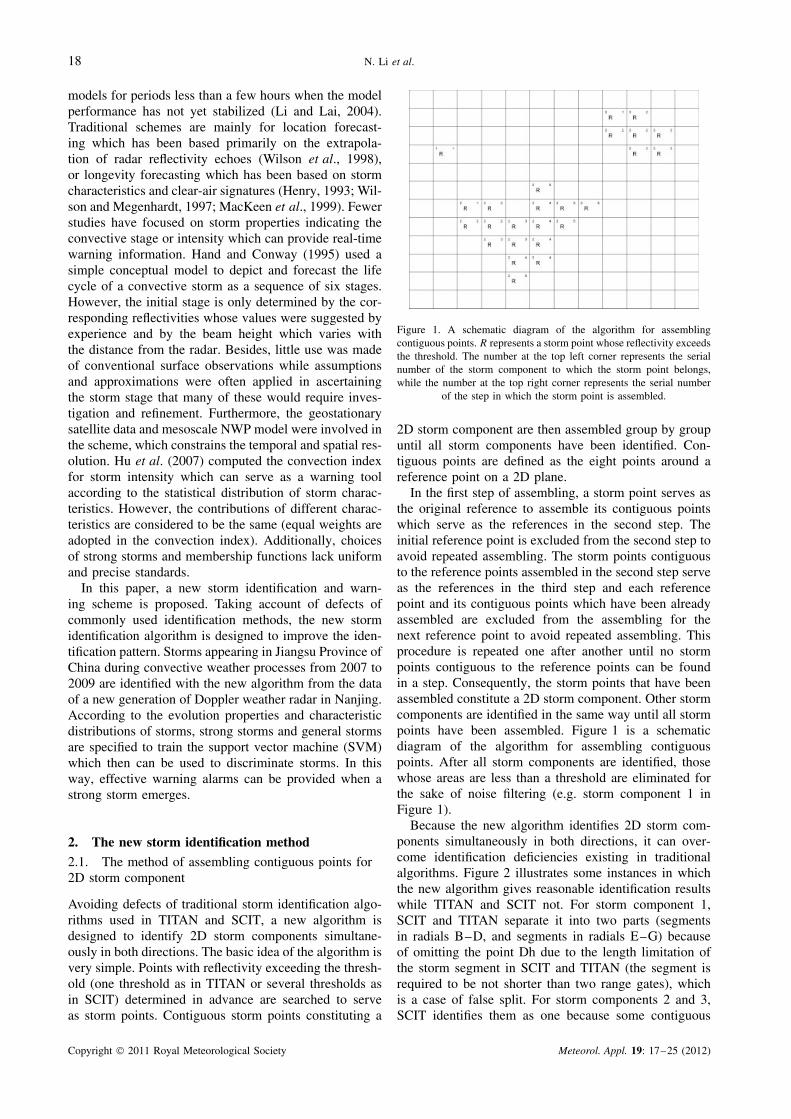
Because the new algorithm identifies 2D storm com-ponents simultaneously in both directions, it can over-come identification deficiencies existing in traditionalalgorithms. Figure 2 illustrates some instances in whichthe new algorithm gives reasonable identification resultswhile TITAN and SCIT not. For storm component 1,SCIT and TITAN separate it into two parts (segmentsin radials B–D, and segments in radials E–G) becauseof omitting the point Dh due to the length limitation ofthe storm segment in SCIT and TITAN (the segment isrequired to be not shorter than two range gates), whichis a case of false split. For storm components 2 and 3,SCIT identifies them as one because some contiguous
Copyright 2011 Royal Meteorological Society Meteorol. Appl. 19: 17–25 (2012)
A new storm identification and warning technique 19
Figure 2. A schematic diagram of identification results of 2D stormcomponents. Radials and range circles are represented by uppercaseletters from A to R and lowercase letters from a to m, respectively.An Arabic numeral (1, 2, 3 or 4) represents a point whose reflectivityexceeds the threshold. A letter ‘r’ represents a point whose reflectivityis not more than DROPOUT REF DIFF below the reflectivity thresholdas in SCIT. A group of points marked with the same Arabic numeral
represents a 2D storm component identified by the new algorithm.
points whose reflectivity values are not more than theDROPOUT REF DIFF below the reflectivity thresholdare included (DROPOUT REF DIFF is the difference ineffective reflectivity of points below the threshold thatmay still be included in a radial segment identified withthe reflectivity threshold (the default value is 5 dBZ)(Johnson et al., 1998)), which is a case of false merger.This kind of false split or merger may usually occur whenSCIT implements higher reflectivity thresholds. As forstorm component 4, TITAN and SCIT give no identifica-tion since they need firstly to identify 1D storm segmentsin radials satisfying the length requirement.
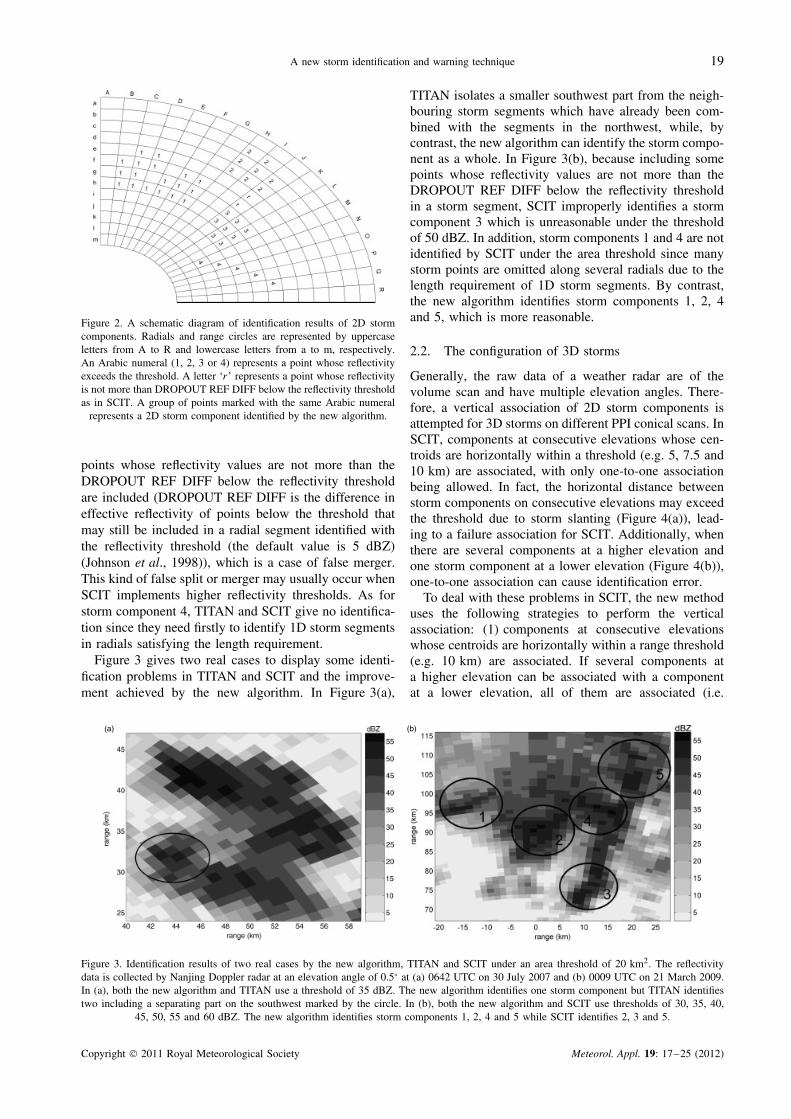
Figure 3 gives two real cases to display some identi-fication problems in TITAN and SCIT and the improve-ment achieved by the new algorithm. In Figure 3(a),
TITAN isolates a smaller southwest part from the neigh-bouring storm segments which have already been com-bined with the segments in the northwest, while, bycontrast, the new algorithm can identify the storm compo-nent as a whole. In Figure 3(b), because including somepoints whose reflectivity values are not more than theDROPOUT REF DIFF below the reflectivity thresholdin a storm segment, SCIT improperly identifies a stormcomponent 3 which is unreasonable under the thresholdof 50 dBZ. In addition, storm components 1 and 4 are notidentified by SCIT under the area threshold since manystorm points are omitted along several radials due to thelength requirement of 1D storm segments. By contrast,the new algorithm identifies storm components 1, 2, 4and 5, which is more reasonable.
2.2. The configuration of 3D storms
Generally, the raw data of a weather radar are of thevolume scan and have multiple elevation angles. There-fore, a vertical association of 2D storm components isattempted for 3D storms on different PPI conical scans. InSCIT, components at consecutive elevations whose cen-troids are horizontally within a threshold (e.g. 5, 7.5 and10 km) are associated, with only one-to-one associationbeing allowed. In fact, the horizontal distance betweenstorm components on consecutive elevations may exceedthe threshold due to storm slanting (Figure 4(a)), lead-ing to a failure association for SCIT. Additionally, whenthere are several components at a higher elevation andone storm component at a lower elevation (Figure 4(b)),one-to-one association can cause identification error.
To deal with these problems in SCIT, the new methoduses the following strategies to perform the verticalassociation: (1) components at consecutive elevationswhose centroids are horizontally within a range threshold(e.g. 10 km) are associated. If several components ata higher elevation can be associated with a componentat a lower elevation, all of them are associated (i.e.
(a) (b)
Figure 3. Identification results of two real cases by the new algorithm, TITAN and SCIT under an area threshold of 20 km2. The reflectivitydata is collected by Nanjing Doppler radar at an elevation angle of 0.5° at (a) 0642 UTC on 30 July 2007 and (b) 0009 UTC on 21 March 2009.In (a), both the new algorithm and TITAN use a threshold of 35 dBZ. The new algorithm identifies one storm component but TITAN identifiestwo including a separating part on the southwest marked by the circle. In (b), both the new algorithm and SCIT use thresholds of 30, 35, 40,
45, 50, 55 and 60 dBZ. The new algorithm identifies storm components 1, 2, 4 and 5 while SCIT identifies 2, 3 and 5.
Copyright 2011 Royal Meteorological Society Meteorol. Appl. 19: 17–25 (2012)
20 N. Li et al.
(a) (b)
Figure 4. Examples that 2D storm components at consecutive layers cannot be properly associated for 3D storms by SCIT because of (a) aslanting storm and (b) several components at a higher layer. In (a), C1 and C are centroids of storm components at the higher layer and at thelower layer respectively, and C1
′ is the projection of C1 at the lower layer. The horizontal distance CC1′ is larger than the given threshold, and
thus they can not be associated by SCIT. In (b), C1 and C2 are centroids of the two storm components at the higher layer, C is the centroid ofthe storm component at the lower layer, and C1
′ and C2′ are projections of C1 and C2 at the lower layer. Either of the components at the higher
layer may be associated with the one at the lower layer, but not both, since SCIT uses one-to-one association.
many-to-one association is introduced) (Figure 4(b));(2) when non-associated components remain after (1),the component at an elevation is associated with thecomponent at the consecutive elevation whose horizontalboundary involves the horizontal position of the centroidof the former component (Figure 4(a)).
For each identified 3D storm, parameters such asthe centroid position, top height, base height, volume,mean reflectivity, maximum reflectivity and storm-basedvertically integrated liquid water can be calculated foranalysis.
3. Storm discrimination and the warning technique
3.1. Data and the identified storms
A threshold of 35 dBZ is commonly considered as anindicator of a convective echo in many studies (Dixonand Wiener, 1993; Henry, 1993; Roberts and Rutledge,2003; Mecikalski and Bedka, 2006). Therefore, it isadopted in this research as the reflectivity threshold forstorm identification. Given that noise and clutter appeargenerally near the ground, the area threshold for stormcomponents is set to 20 km2 at the lowest elevation and10 km2 at other elevations.
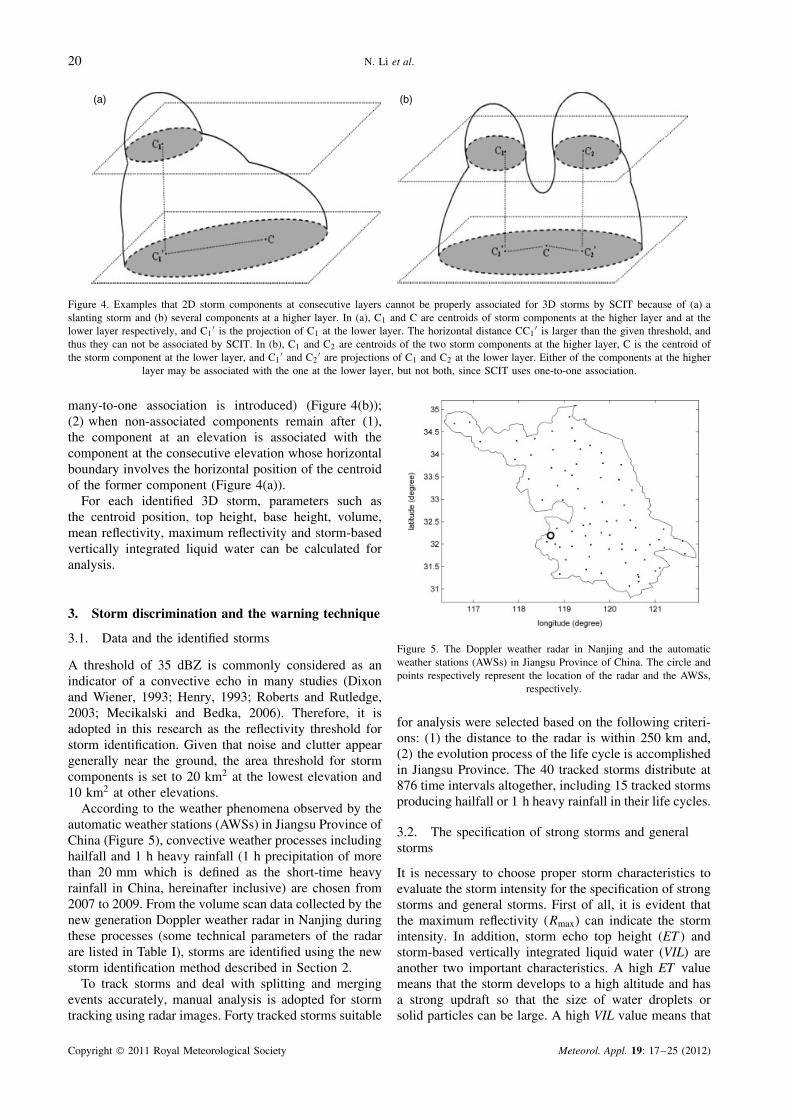
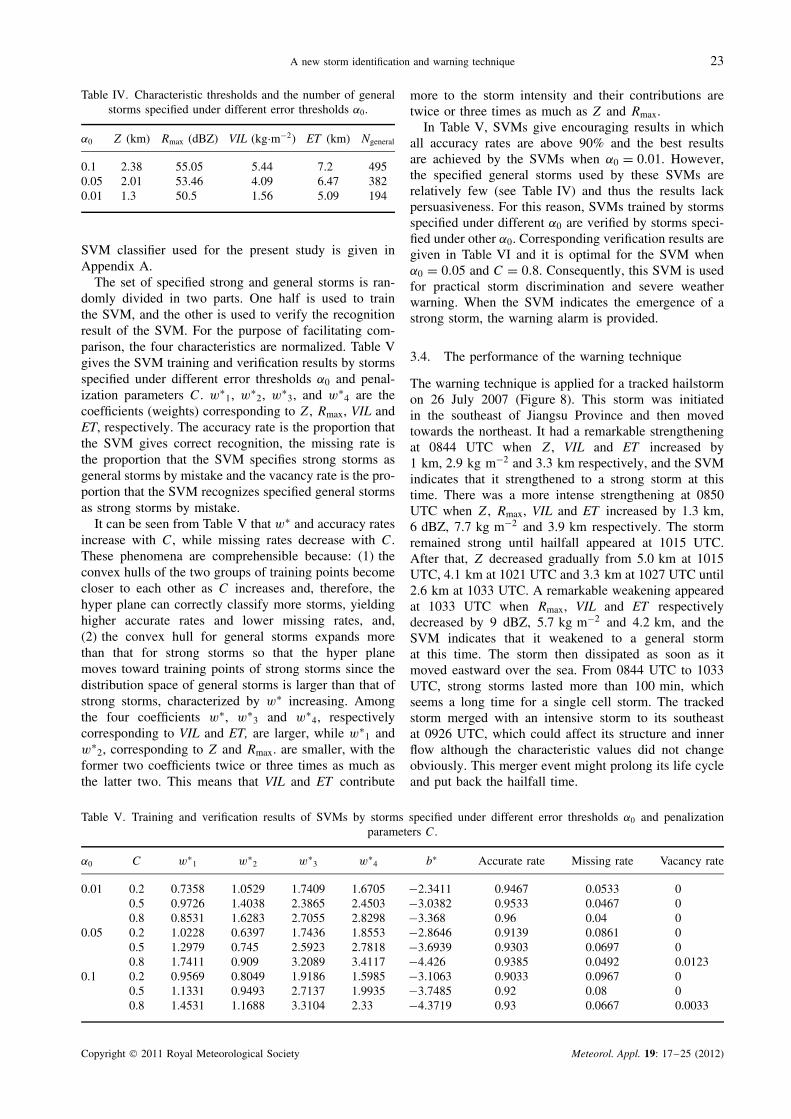
According to the weather phenomena observed by theautomatic weather stations (AWSs) in Jiangsu Province ofChina (Figure 5), convective weather processes includinghailfall and 1 h heavy rainfall (1 h precipitation of morethan 20 mm which is defined as the short-time heavyrainfall in China, hereinafter inclusive) are chosen from2007 to 2009. From the volume scan data collected by thenew generation Doppler weather radar in Nanjing duringthese processes (some technical parameters of the radarare listed in Table I), storms are identified using the newstorm identification method described in Section 2.
To track storms and deal with splitting and mergingevents accurately, manual analysis is adopted for stormtracking using radar images. Forty tracked storms suitable
Figure 5. The Doppler weather radar in Nanjing and the automaticweather stations (AWSs) in Jiangsu Province of China. The circle andpoints respectively represent the location of the radar and the AWSs,
respectively.
for analysis were selected based on the following criteri-ons: (1) the distance to the radar is within 250 km and,(2) the evolution process of the life cycle is accomplishedin Jiangsu Province. The 40 tracked storms distribute at876 time intervals altogether, including 15 tracked stormsproducing hailfall or 1 h heavy rainfall in their life cycles.
3.2. The specification of strong storms and generalstorms
It is necessary to choose proper storm characteristics toevaluate the storm intensity for the specification of strongstorms and general storms. First of all, it is evident thatthe maximum reflectivity (Rmax) can indicate the stormintensity. In addition, storm echo top height (ET ) andstorm-based vertically integrated liquid water (VIL) areanother two important characteristics. A high ET valuemeans that the storm develops to a high altitude and hasa strong updraft so that the size of water droplets orsolid particles can be large. A high VIL value means that
Copyright 2011 Royal Meteorological Society Meteorol. Appl. 19: 17–25 (2012)
A new storm identification and warning technique 21
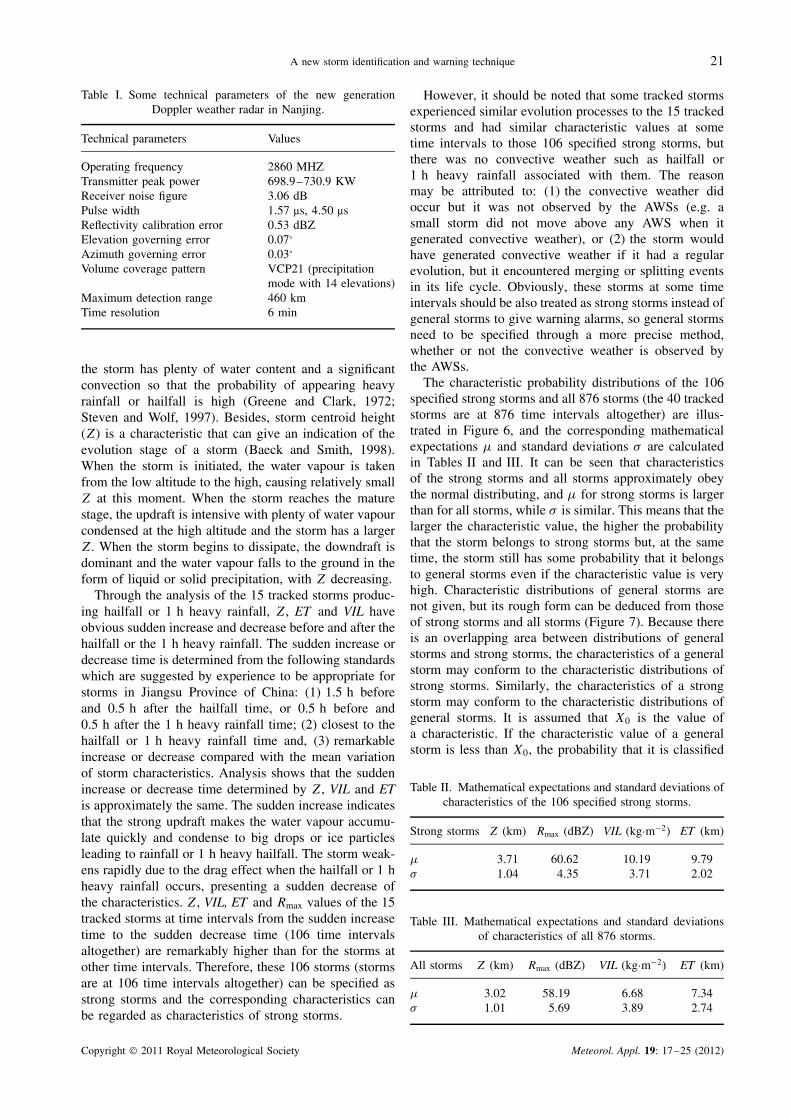
Table I. Some technical parameters of the new generationDoppler weather radar in Nanjing.
Technical parameters Values
Operating frequency 2860 MHZTransmitter peak power 698.9–730.9 KWReceiver noise figure 3.06 dBPulse width 1.57 µs, 4.50 µsReflectivity calibration error 0.53 dBZElevation governing error 0.07°
Azimuth governing error 0.03°
Volume coverage pattern VCP21 (precipitationmode with 14 elevations)
Maximum detection range 460 kmTime resolution 6 min
the storm has plenty of water content and a significantconvection so that the probability of appearing heavyrainfall or hailfall is high (Greene and Clark, 1972;Steven and Wolf, 1997). Besides, storm centroid height(Z) is a characteristic that can give an indication of theevolution stage of a storm (Baeck and Smith, 1998).When the storm is initiated, the water vapour is takenfrom the low altitude to the high, causing relatively smallZ at this moment. When the storm reaches the maturestage, the updraft is intensive with plenty of water vapourcondensed at the high altitude and the storm has a largerZ. When the storm begins to dissipate, the downdraft isdominant and the water vapour falls to the ground in theform of liquid or solid precipitation, with Z decreasing.
Through the analysis of the 15 tracked storms produc-ing hailfall or 1 h heavy rainfall, Z, ET and VIL haveobvious sudden increase and decrease before and after thehailfall or the 1 h heavy rainfall. The sudden increase ordecrease time is determined from the following standardswhich are suggested by experience to be appropriate forstorms in Jiangsu Province of China: (1) 1.5 h beforeand 0.5 h after the hailfall time, or 0.5 h before and0.5 h after the 1 h heavy rainfall time; (2) closest to thehailfall or 1 h heavy rainfall time and, (3) remarkableincrease or decrease compared with the mean variationof storm characteristics. Analysis shows that the suddenincrease or decrease time determined by Z, VIL and ETis approximately the same. The sudden increase indicatesthat the strong updraft makes the water vapour accumu-late quickly and condense to big drops or ice particlesleading to rainfall or 1 h heavy hailfall. The storm weak-ens rapidly due to the drag effect when the hailfall or 1 hheavy rainfall occurs, presenting a sudden decrease ofthe characteristics. Z, VIL, ET and Rmax values of the 15tracked storms at time intervals from the sudden increasetime to the sudden decrease time (106 time intervalsaltogether) are remarkably higher than for the storms atother time intervals. Therefore, these 106 storms (stormsare at 106 time intervals altogether) can be specified asstrong storms and the corresponding characteristics canbe regarded as characteristics of strong storms.
However, it should be noted that some tracked stormsexperienced similar evolution processes to the 15 trackedstorms and had similar characteristic values at sometime intervals to those 106 specified strong storms, butthere was no convective weather such as hailfall or1 h heavy rainfall associated with them. The reasonmay be attributed to: (1) the convective weather didoccur but it was not observed by the AWSs (e.g. asmall storm did not move above any AWS when itgenerated convective weather), or (2) the storm wouldhave generated convective weather if it had a regularevolution, but it encountered merging or splitting eventsin its life cycle. Obviously, these storms at some timeintervals should be also treated as strong storms instead ofgeneral storms to give warning alarms, so general stormsneed to be specified through a more precise method,whether or not the convective weather is observed bythe AWSs.
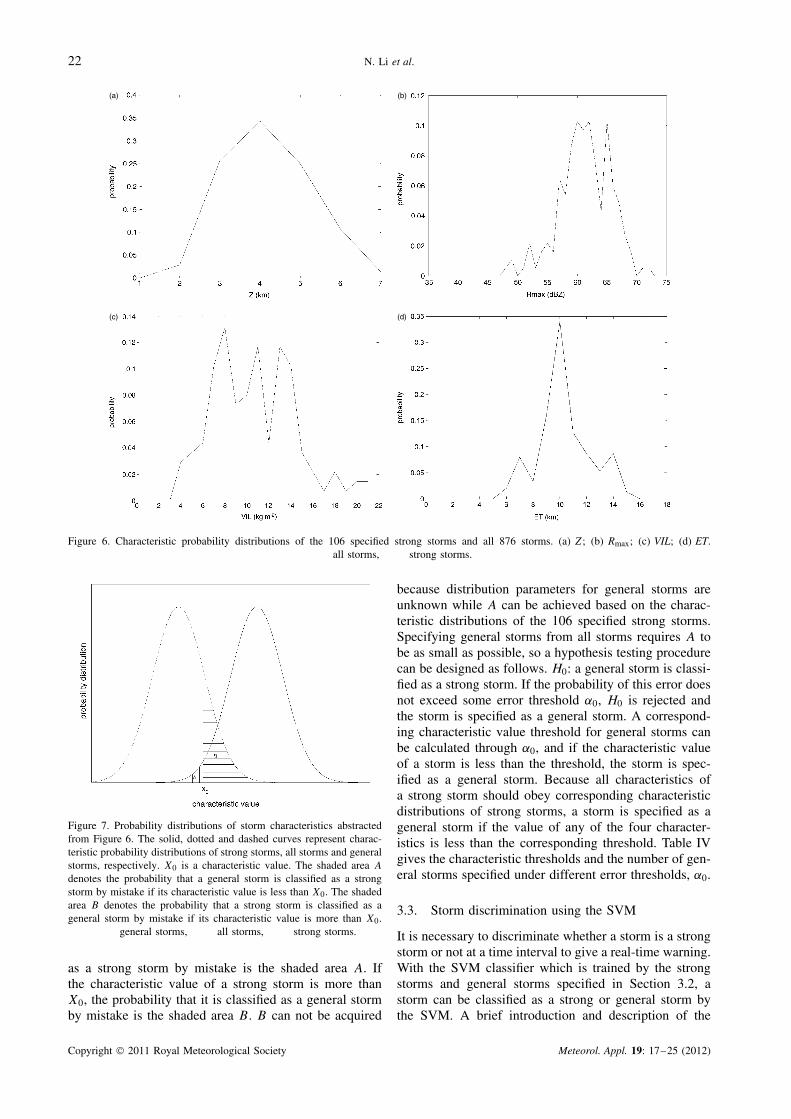
The characteristic probability distributions of the 106specified strong storms and all 876 storms (the 40 trackedstorms are at 876 time intervals altogether) are illus-trated in Figure 6, and the corresponding mathematicalexpectations µ and standard deviations σ are calculatedin Tables II and III. It can be seen that characteristicsof the strong storms and all storms approximately obeythe normal distributing, and µ for strong storms is largerthan for all storms, while σ is similar. This means that thelarger the characteristic value, the higher the probabilitythat the storm belongs to strong storms but, at the sametime, the storm still has some probability that it belongsto general storms even if the characteristic value is veryhigh. Characteristic distributions of general storms arenot given, but its rough form can be deduced from thoseof strong storms and all storms (Figure 7). Because thereis an overlapping area between distributions of generalstorms and strong storms, the characteristics of a generalstorm may conform to the characteristic distributions ofstrong storms. Similarly, the characteristics of a strongstorm may conform to the characteristic distributions ofgeneral storms. It is assumed that X0 is the value ofa characteristic. If the characteristic value of a generalstorm is less than X0, the probability that it is classified
Table II. Mathematical expectations and standard deviations ofcharacteristics of the 106 specified strong storms.
Strong storms Z (km) Rmax (dBZ) VIL (kg·m−2) ET (km)
µ 3.71 60.62 10.19 9.79σ 1.04 4.35 3.71 2.02
Table III. Mathematical expectations and standard deviationsof characteristics of all 876 storms.
All storms Z (km) Rmax (dBZ) VIL (kg·m−2) ET (km)
µ 3.02 58.19 6.68 7.34σ 1.01 5.69 3.89 2.74
Copyright 2011 Royal Meteorological Society Meteorol. Appl. 19: 17–25 (2012)
22 N. Li et al.
(a)
(c) (d)
(b)
Figure 6. Characteristic probability distributions of the 106 specified strong storms and all 876 storms. (a) Z; (b) Rmax; (c) VIL; (d) ET.all storms, strong storms.
Figure 7. Probability distributions of storm characteristics abstractedfrom Figure 6. The solid, dotted and dashed curves represent charac-teristic probability distributions of strong storms, all storms and generalstorms, respectively. X0 is a characteristic value. The shaded area A
denotes the probability that a general storm is classified as a strongstorm by mistake if its characteristic value is less than X0. The shadedarea B denotes the probability that a strong storm is classified as ageneral storm by mistake if its characteristic value is more than X0.
general storms, all storms, strong storms.
as a strong storm by mistake is the shaded area A. Ifthe characteristic value of a strong storm is more thanX0, the probability that it is classified as a general stormby mistake is the shaded area B. B can not be acquired
because distribution parameters for general storms areunknown while A can be achieved based on the charac-teristic distributions of the 106 specified strong storms.Specifying general storms from all storms requires A tobe as small as possible, so a hypothesis testing procedurecan be designed as follows. H0: a general storm is classi-fied as a strong storm. If the probability of this error doesnot exceed some error threshold α0, H0 is rejected andthe storm is specified as a general storm. A correspond-ing characteristic value threshold for general storms canbe calculated through α0, and if the characteristic valueof a storm is less than the threshold, the storm is spec-ified as a general storm. Because all characteristics ofa strong storm should obey corresponding characteristicdistributions of strong storms, a storm is specified as ageneral storm if the value of any of the four character-istics is less than the corresponding threshold. Table IVgives the characteristic thresholds and the number of gen-eral storms specified under different error thresholds, α0.
3.3. Storm discrimination using the SVM
It is necessary to discriminate whether a storm is a strongstorm or not at a time interval to give a real-time warning.With the SVM classifier which is trained by the strongstorms and general storms specified in Section 3.2, astorm can be classified as a strong or general storm bythe SVM. A brief introduction and description of the
Copyright 2011 Royal Meteorological Society Meteorol. Appl. 19: 17–25 (2012)
A new storm identification and warning technique 23
Table IV. Characteristic thresholds and the number of generalstorms specified under different error thresholds α0.
α0 Z (km) Rmax (dBZ) VIL (kg·m−2) ET (km) Ngeneral
0.1 2.38 55.05 5.44 7.2 4950.05 2.01 53.46 4.09 6.47 3820.01 1.3 50.5 1.56 5.09 194
SVM classifier used for the present study is given inAppendix A.
The set of specified strong and general storms is ran-domly divided in two parts. One half is used to trainthe SVM, and the other is used to verify the recognitionresult of the SVM. For the purpose of facilitating com-parison, the four characteristics are normalized. Table Vgives the SVM training and verification results by stormsspecified under different error thresholds α0 and penal-ization parameters C. w∗
1, w∗2, w∗
3, and w∗4 are the
coefficients (weights) corresponding to Z, Rmax, VIL andET, respectively. The accuracy rate is the proportion thatthe SVM gives correct recognition, the missing rate isthe proportion that the SVM specifies strong storms asgeneral storms by mistake and the vacancy rate is the pro-portion that the SVM recognizes specified general stormsas strong storms by mistake.
It can be seen from Table V that w∗ and accuracy ratesincrease with C, while missing rates decrease with C.These phenomena are comprehensible because: (1) theconvex hulls of the two groups of training points becomecloser to each other as C increases and, therefore, thehyper plane can correctly classify more storms, yieldinghigher accurate rates and lower missing rates, and,(2) the convex hull for general storms expands morethan that for strong storms so that the hyper planemoves toward training points of strong storms since thedistribution space of general storms is larger than that ofstrong storms, characterized by w∗ increasing. Amongthe four coefficients w∗, w∗
3 and w∗4, respectively
corresponding to VIL and ET, are larger, while w∗1 and
w∗2, corresponding to Z and Rmax. are smaller, with the
former two coefficients twice or three times as much asthe latter two. This means that VIL and ET contribute
more to the storm intensity and their contributions aretwice or three times as much as Z and Rmax.
In Table V, SVMs give encouraging results in whichall accuracy rates are above 90% and the best resultsare achieved by the SVMs when α0 = 0.01. However,the specified general storms used by these SVMs arerelatively few (see Table IV) and thus the results lackpersuasiveness. For this reason, SVMs trained by stormsspecified under different α0 are verified by storms speci-fied under other α0. Corresponding verification results aregiven in Table VI and it is optimal for the SVM whenα0 = 0.05 and C = 0.8. Consequently, this SVM is usedfor practical storm discrimination and severe weatherwarning. When the SVM indicates the emergence of astrong storm, the warning alarm is provided.
3.4. The performance of the warning technique
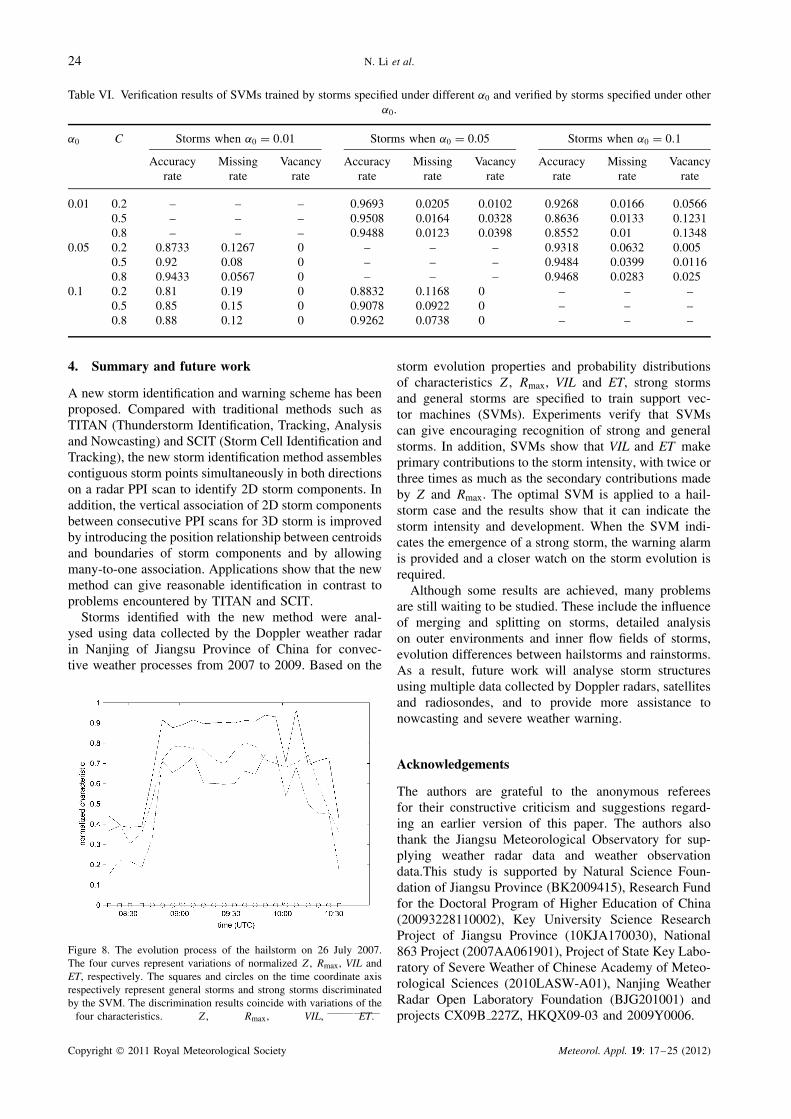
The warning technique is applied for a tracked hailstormon 26 July 2007 (Figure 8). This storm was initiatedin the southeast of Jiangsu Province and then movedtowards the northeast. It had a remarkable strengtheningat 0844 UTC when Z, VIL and ET increased by1 km, 2.9 kg m−2 and 3.3 km respectively, and the SVMindicates that it strengthened to a strong storm at thistime. There was a more intense strengthening at 0850UTC when Z, Rmax, VIL and ET increased by 1.3 km,6 dBZ, 7.7 kg m−2 and 3.9 km respectively. The stormremained strong until hailfall appeared at 1015 UTC.After that, Z decreased gradually from 5.0 km at 1015UTC, 4.1 km at 1021 UTC and 3.3 km at 1027 UTC until2.6 km at 1033 UTC. A remarkable weakening appearedat 1033 UTC when Rmax, VIL and ET respectivelydecreased by 9 dBZ, 5.7 kg m−2 and 4.2 km, and theSVM indicates that it weakened to a general stormat this time. The storm then dissipated as soon as itmoved eastward over the sea. From 0844 UTC to 1033UTC, strong storms lasted more than 100 min, whichseems a long time for a single cell storm. The trackedstorm merged with an intensive storm to its southeastat 0926 UTC, which could affect its structure and innerflow although the characteristic values did not changeobviously. This merger event might prolong its life cycleand put back the hailfall time.
Table V. Training and verification results of SVMs by storms specified under different error thresholds α0 and penalizationparameters C.
α0 C w∗1 w∗
2 w∗3 w∗
4 b∗ Accurate rate Missing rate Vacancy rate
0.01 0.2 0.7358 1.0529 1.7409 1.6705 −2.3411 0.9467 0.0533 00.5 0.9726 1.4038 2.3865 2.4503 −3.0382 0.9533 0.0467 00.8 0.8531 1.6283 2.7055 2.8298 −3.368 0.96 0.04 0
0.05 0.2 1.0228 0.6397 1.7436 1.8553 −2.8646 0.9139 0.0861 00.5 1.2979 0.745 2.5923 2.7818 −3.6939 0.9303 0.0697 00.8 1.7411 0.909 3.2089 3.4117 −4.426 0.9385 0.0492 0.0123
0.1 0.2 0.9569 0.8049 1.9186 1.5985 −3.1063 0.9033 0.0967 00.5 1.1331 0.9493 2.7137 1.9935 −3.7485 0.92 0.08 00.8 1.4531 1.1688 3.3104 2.33 −4.3719 0.93 0.0667 0.0033
Copyright 2011 Royal Meteorological Society Meteorol. Appl. 19: 17–25 (2012)
24 N. Li et al.
Table VI. Verification results of SVMs trained by storms specified under different α0 and verified by storms specified under otherα0.
α0 C Storms when α0 = 0.01 Storms when α0 = 0.05 Storms when α0 = 0.1
Accuracyrate
Missingrate
Vacancyrate
Accuracyrate
Missingrate
Vacancyrate
Accuracyrate
Missingrate
Vacancyrate
0.01 0.2 – – – 0.9693 0.0205 0.0102 0.9268 0.0166 0.05660.5 – – – 0.9508 0.0164 0.0328 0.8636 0.0133 0.12310.8 – – – 0.9488 0.0123 0.0398 0.8552 0.01 0.1348
0.05 0.2 0.8733 0.1267 0 – – – 0.9318 0.0632 0.0050.5 0.92 0.08 0 – – – 0.9484 0.0399 0.01160.8 0.9433 0.0567 0 – – – 0.9468 0.0283 0.025
0.1 0.2 0.81 0.19 0 0.8832 0.1168 0 – – –0.5 0.85 0.15 0 0.9078 0.0922 0 – – –0.8 0.88 0.12 0 0.9262 0.0738 0 – – –
4. Summary and future work
A new storm identification and warning scheme has beenproposed. Compared with traditional methods such asTITAN (Thunderstorm Identification, Tracking, Analysisand Nowcasting) and SCIT (Storm Cell Identification andTracking), the new storm identification method assemblescontiguous storm points simultaneously in both directionson a radar PPI scan to identify 2D storm components. Inaddition, the vertical association of 2D storm componentsbetween consecutive PPI scans for 3D storm is improvedby introducing the position relationship between centroidsand boundaries of storm components and by allowingmany-to-one association. Applications show that the newmethod can give reasonable identification in contrast toproblems encountered by TITAN and SCIT.
Storms identified with the new method were anal-ysed using data collected by the Doppler weather radarin Nanjing of Jiangsu Province of China for convec-tive weather processes from 2007 to 2009. Based on the
Figure 8. The evolution process of the hailstorm on 26 July 2007.The four curves represent variations of normalized Z, Rmax, VIL andET, respectively. The squares and circles on the time coordinate axisrespectively represent general storms and strong storms discriminatedby the SVM. The discrimination results coincide with variations of the
four characteristics. Z, Rmax, VIL, ET.
storm evolution properties and probability distributionsof characteristics Z, Rmax, VIL and ET, strong stormsand general storms are specified to train support vec-tor machines (SVMs). Experiments verify that SVMscan give encouraging recognition of strong and generalstorms. In addition, SVMs show that VIL and ET makeprimary contributions to the storm intensity, with twice orthree times as much as the secondary contributions madeby Z and Rmax. The optimal SVM is applied to a hail-storm case and the results show that it can indicate thestorm intensity and development. When the SVM indi-cates the emergence of a strong storm, the warning alarmis provided and a closer watch on the storm evolution isrequired.
Although some results are achieved, many problemsare still waiting to be studied. These include the influenceof merging and splitting on storms, detailed analysison outer environments and inner flow fields of storms,evolution differences between hailstorms and rainstorms.As a result, future work will analyse storm structuresusing multiple data collected by Doppler radars, satellitesand radiosondes, and to provide more assistance tonowcasting and severe weather warning.
Acknowledgements
The authors are grateful to the anonymous refereesfor their constructive criticism and suggestions regard-ing an earlier version of this paper. The authors alsothank the Jiangsu Meteorological Observatory for sup-plying weather radar data and weather observationdata.This study is supported by Natural Science Foun-dation of Jiangsu Province (BK2009415), Research Fundfor the Doctoral Program of Higher Education of China(20093228110002), Key University Science ResearchProject of Jiangsu Province (10KJA170030), National863 Project (2007AA061901), Project of State Key Labo-ratory of Severe Weather of Chinese Academy of Meteo-rological Sciences (2010LASW-A01), Nanjing WeatherRadar Open Laboratory Foundation (BJG201001) andprojects CX09B 227Z, HKQX09-03 and 2009Y0006.
Copyright 2011 Royal Meteorological Society Meteorol. Appl. 19: 17–25 (2012)
A new storm identification and warning technique 25
Appendix A. The SVM Classifier
The Support Vector Machine (SVM) is a new popularmachine learning technique (Vapnik, 1998). Generally, itis an algorithm that predicts a data classification givenrelevant features. In the SVM approach, the optimizationcriterion is the maximization of the margin that isthe minimum distance from any training point to theseparating hyper plane. The SVM produces a model thatpredicts the class label by setting parameter values ofan optimization problem based on its input data. Withthe breakthrough progress achieved in both theoreticalstudies and practical implementation in recent years,SVMs are widely used in various fields (Shawe-Taylorand Cristianini, 2000).
For the present study of storm classification, the fourcharacteristics are taken as the input index vector, i.e. x =[Z, Rmax, VIL, ET ], and two-class categories are taken asthe output index given that y is set to 1 for strong stormsand −1 for general storms. As illustrated in Figure 6, thelarger the characteristic value is, the higher probabilitythat the storm belongs to strong storms. Therefore, quasi-linear SVMs can be employed, which is referred to Dengand Tian (2004):
1. The training set T = {(x1, y1), . . . , (xl, yl)} ∈ (X ×Y)l is established, where l is the number of storms,xi ∈ X = [Zi, Rmaxi, V ILi, ETi], yi ∈ Y = {1, −1}and i = 1, . . . , l;
2. Penalization parameters C (C > 0) are chosen forquasi-linear separable problems. C can be consideredas the reduction factor of convex hulls of the twopoint groups in 4D space according to the geometricalbisection method. The following optimization problemis designed and solved:
minα
1
2
l∑
i=1
l∑
j=1
yiyjαiαj (xi × xj ) −l∑
j=1
αj ,
s.t.l∑
i=1yiαi = 0,
0 ≤ αi ≤ C, i = 1, · · · , l, (A.1)
and then the optimization solution α∗ = (α∗1 , · · · , α∗
l )T is
obtained;
3. w∗ =l∑
i=1yiα
∗i xi is calculated. A positive component
α∗j less than C is selected from α∗
i , based on which
b∗ = yj −l∑
i=1yiα
∗i (xi × xj ) is calculated, and,
4 the hyper plane (w∗ × x) + b∗ = 0 is constructed, andthe decision function f (x) = sgn((w∗ × x) + b∗) isachieved.
References
Baeck ML, Smith JA. 1998. Rainfall estimation by the WSR-88D forheavy rainfall events. Weather and Forecasting 13: 416–436.
Browning KA, Collier CG, Larke PR, Menmuir P, Monk GA, OwensRG. 1982. On the forecasting of frontal rain using a weather radarnetwork. Monthly Weather Review 110: 34–552.
Crane RK. 1979. Automatic cell detection and tracking. IEEETransactions on Geoscience Electronics 17: 250–262.
Deng N, Tian Y. 2004. A New Method in Data Mining: Support VectorMachine. Science Press: Beijing, China.
Dixon M, Wiener G. 1993. TITAN: thunderstorm identification,tracking, analysis, and nowcasting – a radar-based methodology.Journal of Atmospheric and Oceanic Technology 10: 785–797.
Greene DR, Clark RA. 1972. Vertically integrated liquid water – a newanalysis tool. Monthly Weather Review 100: 548–552.
Han L, Yu X, Zheng Y, Chen M, Wang H, Lin Y. 2009. Statisticcharacteristics of severe convective storm during Warm-Season inthe Beijing-Tianjin region and its vicinity. Chinese Science Bulletin54: 2493–2498.
Hand WH, Conway BJ. 1995. An object-oriented approach tonowcasting shower. Weather and Forecasting 10: 327–341.
Henry SG. 1993. Analysis of thunderstorm lifetime as a function ofsize and intensity. Proceedings of 26th International Conferenceon Radar Meteorology, Norman, OK, 24-28 May 1993, AmericanMeteorological Society: Boston, MA; pp 138–140.
Hu S, Gu S, Zhuang X, Luo H. 2007. Automatic identification ofStorm cells using Doppler radars. Acta Meteorological Sinica 21:353–365.
Johnson JT, MacKeen PL, Witt A, Mitchell ED, Stumpf GJ, Eilts MD,Thomas KW. 1998. The storm cell identification and trackingalgorithm: an enhanced WSR-88d algorithm. Weather andForecasting 13: 263–276.
Li PW, Lai EST. 2004. Applications of radar-based nowcastingtechniques for mesoscale weather forecasting in HongKong.Meteorological Applications 11: 253–264.
Li L, Schmid W, Joss J. 1995. Nowcasting of motion and growthof precipitation with radar over a complex orography. Journal ofApplied Meteorology 34: 1286–1300.
Liljas E. 1998. COST-78 co-operations on SAFs. Proceedings of SAFTraining Workshop – Nowcasting and Very Short Range Forecasting,Madrid, Spain, 9–11 December 1998, European Organisation forthe Exploitation of Meteorological Satellites: Darmstadt, Germany;pp 23–33.
MacKeen PL, Brooks HE, Elmore KL. 1999. Radar reflectivity-derived thunderstorm parameters applied to storm longevityforecasting. Weather and Forecasting 14: 289–295.
Mecikalski JR, Bedka KM. 2006. Forecasting convective initiation bymonitoring the evolution of moving cumulus in daytime GOESimagery. Monthly Weather Review 134: 49–78.
Rinehart RE, Garvey ET. 1978. Three-dimensional storm motiondetected by convective weather radar. Nature 273: 287–289.
Roberts RD, Rutledge S. 2003. Nowcasting storm initiation and growthusing GOES-8 and WSR-88D data. Weather and Forecasting 18:562–584.
Rosenfeld D. 1987. Objective method for analysis and tracking ofconvective cells as seen by radar. Journal of Atmospheric andOceanic Technology 4: 422–434.
Shawe-Taylor J, Cristianini N. 2000. Support Vector Machines andother Kernel-based Learning Methods. Cambridge University Press:London, United Kingdom.
Steven AA, Wolf PL. 1997. VIL density as a hail indicator. Weatherand Forecasting 12: 473–478.
Vapnik V. 1998. Statistical Learning Theory. John Wiley & Sons: NewYork, NY.
Wilson JW, Crook NA, Mueller CK, Sun J, Dixon M. 1998. Nowcast-ing thunderstorms: a status report. Bulletin of the American Meteo-rological Society 79: 2079–2099.
Wilson JW, Megenhardt DL. 1997. Thunderstorm initiation, organiza-tion, and lifetime associated with Florida boundary layer conver-gence lines. Monthly Weather Review 125: 1507–1525.
Copyright 2011 Royal Meteorological Society Meteorol. Appl. 19: 17–25 (2012)