Embed Size (px)
Citation preview
Atlantic Review of Economics – 2st Volume - 2012
Revista Atlántica de Economía – Volumen 2 - 2012
A new theoretical analysis of the debt
financing decision. European evidence
from industry data
Álvarez García, Begoña
BoedoVilabella, Lucía
Lagoa Varela, Dolores
Universidad de A Coruña
Atlantic Review of Economics – 2st Volume - 2012
Revista Atlántica de Economía – Volumen 2 - 2012
Abstract
The objective of this paper is to investigate the process of company´s debt
accumulation in different European countries throughout the last decade. As a
preliminary step to the empirical study, a new theoretical framework is proposed
relative to capital structure, where the decision of going to debt does not only depend
on the firm´s characteristics, but also on cultural, institutional and psychological factors.
In the analysis of the debt evolution over time, we take special notice of the difference
between rich and poor countries and, among the latter, we focussed our attention on
the behaviour of Spain in contrast to the rest. Given that the period analysed includes
the eruption of the crisis, the paper permits the observation of each country´s reaction.
Some interesting conclusions have been obtained, such as the most significant
increase in debt in poor countries has occurred in the second half of the decade, and
that Spain and Portugal show a different performance from many others in terms of the
variables analysed. Altogether, the results indicate, in our opinion, the importance of
institutional and cultural characteristics as factors which explain company behaviour
relative to debt.
Resumen
El objetivo de este trabajo es investigar cómo ha sido el proceso de acumulación de
deuda de las empresas de diferentes países europeos a lo largo de la década 2000-
2009. Como paso previo al estudio empírico, se propone un nuevo marco teórico
relativo a la estructura de capital en el que la decisión de endeudamiento no solo
depende de las características de la empresa, sino también de factores
macroeconómicos, institucionales y culturales de su entorno. En el análisis de esta
evolución temporal de la deuda se incide especialmente en la diferencia entre los
países ricos y los pobres y, dentro de éstos últimos, fijamos nuestra atención en el
comportamiento de España frente al resto. Dado que el período analizado incluye el
estallido de la crisis, el estudio permite observar la reacción de cada uno de los países.
Se obtienen algunas conclusiones muy interesantes, como que la acumulación más
importante de deuda en los países pobres se produce en la segunda mitad de la
década y que España y Portugal presentan un comportamiento diferente del resto en
muchas de las variables analizadas. Los resultados en su conjunto indican, en nuestra

Atlantic Review of Economics – 2st Volume - 2012
Revista Atlántica de Economía – Volumen 2 - 2012
opinión, la importancia de las características institucionales y culturales como factores
que explican el comportamiento empresarial relativo al endeudamiento.
Keywords: Enterprise debt finance, capital structure determinants, financial crisis, European
indebtedness.
Palabras clave: endeudamiento empresarial, factores determinantes de la estructura de capital,
crisis financiera, endeudamiento europeo.
JEL Classification code: G32
Atlantic Review of Economics – 2st Volume - 2012
Revista Atlántica de Economía – Volumen 2 - 2012
1. Introduction
One of the differential aspects which triggered the present crisis is the excessive debt
acquired by different agents of the economy (firms, governments and households), debt which
gradually increased during the expansive cycle.
The imprudent accumulation of borrowed funds is now evident and its detrimental effects
are now object of study in a multitude of papers and reports. However, it is surprising that during
this period of increasing indebtedness nobody raised the alarm or warned of its possible future
consequences. This makes us conclude that one of the lessons that the crisis has left us is that
the treatment of the study of the debt decision has not been adequate. Now it is obvious that the
theoretical analysis was carried out in a fragmented manner where aspects of indebtedness,
which today are considered very important, were taken for granted. Moreover, the empirical
studies limited themselves to showing only the recent evolution of leverage without any critical
analysis of the observed trajectory or to carrying out a static analysis of the factors associated
with a higher or lower company debt.
The work presented here intends to be a first step towards the overcoming of this
viewpoint. To this end the work is organized as follows: section 2 describes the different
perspectives from which the study of the decision for indebtedness has been covered, and
justifies the need to advance in a new line which encompasses all elements. Section 3 presents
an empirical study which examines the growth of company debt in our country and compares its
evolution with that of other European countries. In Part 4 the final conclusions are stated and
future lines of investigation are described.
2. Different perspectives from which the decision of
indebtedness can be viewed
The study of the decision to assume debt as a way of company finance has been made
from the three following perspectives.
Atlantic Review of Economics – 2st Volume - 2012
Revista Atlántica de Economía – Volumen 2 - 2012
2.1. The first focus: business factors as determinants for capital structure
The famous paper by Modigliani and Miller published in 1958 began an important line of
investigation in the field of Finance centred on the decision for company debt structure.
Modigliani and Miller demonstrated that financial decisions are in reality irrelevant. It is not
possible to increase the value of a company by way of financial decisions but only by way of the
right investment decisions.
Irrelevance Theory was based on a series of suppositions quite distant from the reality in
which companies operate. It was the consecutive relaxation of this hypothesis which brought
about the denominated Optimal Capital Structure Theory. This theory established that each
company, based on its characteristics, has a determined financial structure which allows it to
maximise its value. The company should reach and maintain this level of optimum debt.
The first explanation was the “tax–bankruptcy trade off” perspective [Miller (1977);
DeAngelo and Masulis (1980)] or play-off between tax advantages and the costs of bankruptcy
debt. This first approximation resulted in a series of factors which allowed a firm to have a
higher or lower optimal debt (non-debt tax shields, greater economic risk,…). Later, the problem
of information asymmetry allowed for the development of important explicative theories on
capital structure: the Agency Theory, the Stakeholder Theory, the Pecking Order Hypothesis
and the Managerial Theory, which provided new hypotheses on the factors which determine
optimal debt level (free cash flow generation, ownership concentration, growth opportunities,
among others). Some of the classic publications on these approaches are: Jensen and
Meckling (1976), Warner (1977), Jensen (1986), Smith and Warner (1979), Altman (1984), Ross
(1977), Leland and Pyle (1977), Myers and Majluf (1984).
Nowadays it is wholly accepted that for each company there exists an objective capital
structure in function of its own characteristics (profitability, economic risk, nature of assets, size,
etc…). The effect of these variables has been contrasted in a multitude of empirical studies
whose structure has been very homogeneous: transversal analysis in which the debt ratio
depended on diverse business variables. Wijst, Van Der and Thurik (1993) and Limmarck, R.J.
(1998) are classical studies of this kind. In the case of Spain one can mention: Menéndez
Requejo (2001), Boedo and Iglesias (2004, 2005), De Andrés Alonso and others (2005), Acedo
and others (2005), Jiménez and Palacín (2007).
Atlantic Review of Economics – 2st Volume - 2012
Revista Atlántica de Economía – Volumen 2 - 2012
2.2. The inclusion of institutional and macroeconomic variables
Firms operate in very different institutional and cultural environments and these
characteristics also affect their level of debt. One of the main problems for the inclusion of
these variables is the difficulty of measurement: How do we measure legal enforcement or the
degree of banking regulation in a particular country? The studies carried out by La Porta and
others (1997, 1998) were pioneering in the proposal of units of measurement for factors of an
institutional nature in the form of aggregative indexes. Many subsequent investigations used
these same indexes or even, using the same procedure, created other new indexes. One of
these studies is that carried out by Utrero-González (2007) in which determining factors of debt
include, apart from the classic business variables, others of an institutional nature, such as:
creditor rights protection (+), shareholder rights protection (-), quantity of public information
requisites (-), banking regulation (+). All the coefficients of these variables were significant with
the indicated signs. Data was collected from the BACH database and included 11 European
countries, USA and Japan for the period 1990-1999 and for the industrial sector.
Another interesting study along these lines is that of Abe De Jong and others (2008). In
the first part it proves that the effect of firm variables is not the same in every country, and in the
second part it examines the influence of institutional variables, both directly upon the financial
structure as well as indirectly by way of its effect on firm variables. It includes the following
institutional and macro-economic factors: efficiency and level of development of country legal
enforcement, shareholder/creditor rights protection, market/bank-based financial system, capital
formation and GDP growth. The sample covers 42 countries for the period 1997-2001, with data
collected from the COMPUSAT global database. Some of the interesting results are the positive
influence of economic growth measured by way of GPD and the negative influence of the level
of creditor rights protection. This result, which is contrary to the hypothesis that the same
authors present (as well as to the results previously obtained by Utrero-González, 2007) is
justified because this greater protection grants banks more power to pressure companies, which
provokes a greater reticence on the part of companies to borrow.
A study which highlights the importance of environmental conditions on corporate debt is
that of Gungoraydinoglu and Öztekin (2011). It includes a wide range of variables relative to the
countries, among them tax enforcement, the efficiency of bankruptcy processes (resources,
time necessary for its resolution,..), shareholder/creditor rights protection, as well as variables
which measure the quality of the governments and institutions (corruption, regulatory risk, legal
enforcement, etc.) It also includes the effect of inflation and the growth of GDP. Its main result
is the greater explanatory relevance of firm specific factors (63% of the variation of the level of
debt) compared to institutional factors. With respect to these factors it was observed that
Atlantic Review of Economics – 2st Volume - 2012
Revista Atlántica de Economía – Volumen 2 - 2012
corporate debt is greater in countries with regulations which involve less bankruptcy costs,
greater creditor protection, greater company transparency and stronger tax enforcement. The
empirical study was carried out over 16 years (1991-2006) and in 27 countries. In spite of using
such a dilated time period, the study is of a transversal-type and does not undergo an appraisal
of how corporate leverage has evolved over time. An excellent investigation which does include
an examination of the time span of the debt and other variables is that of Frank and Goyal
(2009). It is one of the most complete studies within the field of Capital Structure Theory
published in recent years. The time period analysed was from 1950 to 2003, separated into five
decades plus the last period from 2000-2003. This allows us to study how the different
components of the balance sheet and the income statement have varied, and also to check if
the determinant factors of corporate debt are stable or vary over time. It includes firm specific
factors, as well as institutional and macro-economic factors. Again it observes the greater
relative importance of firm specific factors (and how the effect of each one of them has varied
over time), and the great influence of the industry to which the firm belongs. Among the
environmental factors the most important is the level of inflation. The study only included North
American companies listed in the stock exchange.
Finally, a Bank of Spain report stands out (Marqués, Nieto and Del Rio (2007)) centred
on the effect of macro-economic variables on the growth of bank credit to companies during the
period 1990-2004. It includes the contribution of the following four variables: GDP (+), Interest
rate (-), the General Index of the Madrid Stock Exchange(-) and Gross Operating surplus (-).
The results are those which figure in parenthesis, the effect of the interest rate being the most
important, while the evolution of the Stock Exchange and the Gross Operating surplus have a
reduced contribution.
2.3. A final group of studies which include sociological factors and propose
models to alert against future crisis
Finally we have highlighted a group of studies which include aspects that can be classed
as sociological. Effectually, the decision to take on debt is not only a product of the economic
situation, firm specific characteristics, and institutional type variables of a country or specific
zone, but it is also fruit of a series of psycho-social changes which have transformed the way
we perceive indebtedness. This change in standard conduct is motivated by various interacting
factors.
Atlantic Review of Economics – 2st Volume - 2012
Revista Atlántica de Economía – Volumen 2 - 2012
A very interesting angle on the problem was that presented by Palley (2009) which
centres the origin of excess debt in what is referred to as the macro-economics of
“financialization”, understood as the increase in the importance of finance in the economy which
has ended by transforming the economic process. It is a gradual process whose beginnings
can be traced to the leveraged buyouts in the 1980s. The growth of financial transactions was
produced alongside a great technological advance which enabled the reduction of the mass of
middle and lower-end salaries, at the same time that a policy of increasing managers’ salaries
was implemented. A new distribution of income is thus produced moving from salaries to profits
and managers, which created a threat to aggregate demand which “financialization” dealt with
by increasing consumer debt. Financial innovation and deregulation allowed for the phase of
debt accumulation to last a long time. Finally it emphasises the importance of knowing the
multiple thorny problems associated with the origin of the debt process to be able to predict the
direction of advance and act in consequence.
In recent years many other studies have pointed out these themes, although in a less
systematic manner than Palley. In diverse reports, both academic and for the general public,
what some authors refer to as “the debt trap” has been highlighted, into which all agents of
society have fallen and which is fruit of a gradual transformation of the way in which
indebtedness is perceived. Its origin is due to many factors acting simultaneously: the
suppression of the restrictions on financial activity, a new paradigm in technological
development (information technology), the appearance of new financial theories which enable
the creation and valuation of constantly more sophisticated financial products (financial
engineering), macro-economic stability (low inflation, high employment). The sum of these inter-
related factors provoked a “feel-good” sensation (“the world is a safe place”) which led people to
lose their fear and borrow (families, firms, Governments) and to lend (financial system) without
limits. This is the conclusion that Cecchetti, Mohanty and Zampolli (2011) reached. Theirs was
an interesting study by the Bank of International Settlements (BIS) which attempted to ascertain
at which point debt went from being “beneficial” to being “detrimental”. For this it first showed
how the level of debt had been rising (as a percentage of GNP) in different countries between
1980 and 2010, a year when many countries easily surpassed 300% of GDp, and secondly it
constructed a regression model which attempts to analyse the impact of debt on economic
growth. The results support the view that, beyond certain levels, debt is bad for growth. With
respect to corporate debt (it also examines family and Government debt), the threshold is closer
to 90% of GPD.
In this same line of debt analysis as a complex dynamic with many related factors can be
framed the work of Stein (2011), whose main contribution is to propose a theoretical model of
early warning signals for a debt crisis. This approach is based on an aspect which has received
little attention in other studies on triggering points for the crisis: the productive models of each
Atlantic Review of Economics – 2st Volume - 2012
Revista Atlántica de Economía – Volumen 2 - 2012
country. It looks at to what degree the profitability of its productive processes is sustainable
over time (if they proceed from the productivity of investment or from the profits of capital). The
underlying economy in each country is a factor of major importance for analysing the
accumulation of debt and for predicting its evolution and future consequences. Stein points out
a crucial aspect: if in fact there is a global crisis, there is also a Spanish crisis, a Greek crisis, a
North American crisis, etc.
3. Empirical study
With respect to the empirical literature, the studies have basically consisted in the
observation of a temporal evolution (without any critical explanation) or in a transversal analysis
of firm factors which determine a greater or lesser volume of debt. Studies which established
comparatives to detect possible excesses of debt in a company, sector or country were scarce,
as were those which analysed the reasons for a trend. The empirical study which we present is
intended to be a first contribution in this direction.
We compare the process of debt accumulation between a group of European countries
through the analyse of various ratios. Additionally, we examine the relationship between bank
debt and some macroeconomic variables. All this allows us to verify the different reaction of
each country facing the crisis and to anticipate the importance of the country factors as
explaining the debt ratio of its companies.
3.1. Data and methodology
In this first empirical approximation to the analysis of the debt process which occurred in
the years of growth, we have set out to discover what this temporal evolution really was like in
Spain, and if there were differences with respect to neighbouring countries. For this we have
used the BACH database. This database contains aggregate data and harmonized information
on the financial statements of non-financial companies from 11 European countries, Japan and
the United States.
Initially the study set out to include various sectors and sizes of companies, but given that
it covered diverse variables and countries, the number of graphs and tables to comment on was
excessive, and clarifying could have confused the reader. For this reason it was decided to only
consider the average debt for the total number of companies in each country, and in the
manufacturing sector, as it is the sector which best represents the business activity of a country.
However, in some ratios the study also refers to the construction industry which, in Spain, has

Atlantic Review of Economics – 2st Volume - 2012
Revista Atlántica de Economía – Volumen 2 - 2012
been the key sector in the growth and posterior crisis of the economy. For this reason it
appears interesting to us to observe its differences with respect to other countries.
The years 2000-2009 were taken as the time period. In the year 2000 the BACH
database underwent a modification (new countries and variables were added) and hence we
considered it advisable to begin in this year. The countries which have finally been included,
apart from Spain, are Italy, Portugal, France and Germany.
3.2. The evolution of bank debt in the 2000 decade in manofacturing sector
We begin with the analysis of the classic debt ratio: what percentage of total investment
in the company is financed by debt. We limit ourselves to debt supplied by financial entities
(graph 1) .
Graph 1: Evolution 2000-2009 of the ratio: bank debt / total assets.
Source: Authors´ calculations using BACH database
At first sight it can be observed that there is a very different behaviour between two main
groups of countries: Germany and France have maintained moderate and stable positions over
time (Germany moves between 5% and 6% while France is between 6% and 8%), while the
debt ratios of Spain and Portugal double these values. Spain remains above 13% for almost
the whole period, with a rise to 15% in 2007-2008, and with no debt reduction until 2009.
Atlantic Review of Economics – 2st Volume - 2012
Revista Atlántica de Economía – Volumen 2 - 2012
The Italian companies boast the highest volume of debt over total investment (with levels
around 20%). However, the Italian case is very peculiar, as when we differentiate between
long-term and short-term debt, we find that this figure is mainly due to the latter.
In the neighbouring countries the debt did not only not ease off, but it also increased in
the final phase of the growth cycle (2004-2007), reaching its maximum level in 2008 when, only
then, does it begin to decrease. However, looking at the macro-economic factors, it can be
seen that the growth rates were already lower. This supports the psychological effect of a
collective sensation of continuity of a growth situation. We also have to bear in mind the low
interest rates in play during 2004-2005. Moreover, from the beginning of 2006 the Euribor
begins a continued increase which reaches its maximum at the end of 2008, before falling
sharply at the beginning of 2009, without being accompanied by a reduction, or at least a
stabilisation, in the level of debt (the relation between the evolution of the company´s bank debt
of each country and the euribor will be studied in section 4.1).
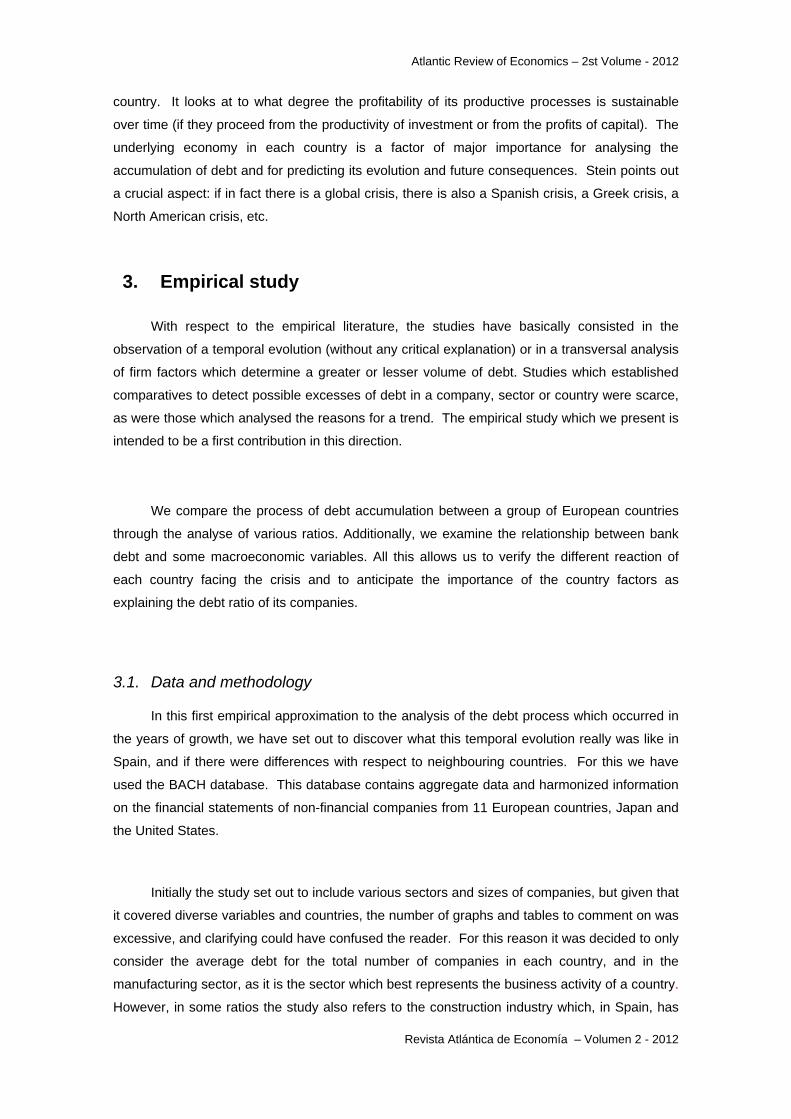
One of the most illustrative indicators of the suitability of a company’s level of debt is its
capacity to face the financial costs that such a level of debt generates. The BACH database
presents this indicator by relating the interest from the debt to the Gross Operating Profits
(EBITDA), which is the opposite of the classic hedge ratio. Its value indicates the importance of
the financial costs in relation to the profits of the business.
Graph 2. Evolution 2000-2009 of the ratio:Interest and similar charges/ EBITDA
Source: Authors´ calculations using BACH database
Atlantic Review of Economics – 2st Volume - 2012
Revista Atlántica de Economía – Volumen 2 - 2012
In Graph 2 it can be seen that the evolution is similar in all the analysed countries: from a
rising path at the outset, it dips through a period of decline from 2001 to 2004, which is without
doubt motivated by a period of positive business results and low interest rates in 2003 and
2004. From 2004 there begins a period of deterioration of this ratio, although uneven between
countries. Spain and Portugal are the worst affected. Spain goes from 18% in 2005 to 34% in
2009. The rising graph line of Portugal is almost parallel with Spain but more than three points
above it.
This behaviour coincides with the period of increase in interest rates, although it is also a
consequence of decreased business profits as compared with the first half of the decade.
France, Italy and Germany maintain this ratio at moderate levels until 2007, increasing in 2008
and 2009 (years in which the Euribor is at its highest levels). In spite of this, they finish the
decade with a much more favourable ratio than Spain and Portugal.
3.3. The effect of bank debt maturity
Since data is aggregated, it is possible that there exists some differences in function of
the debt maturity, the type of debt, the size of the companies and the specific characteristics of
the sector of economic activity.
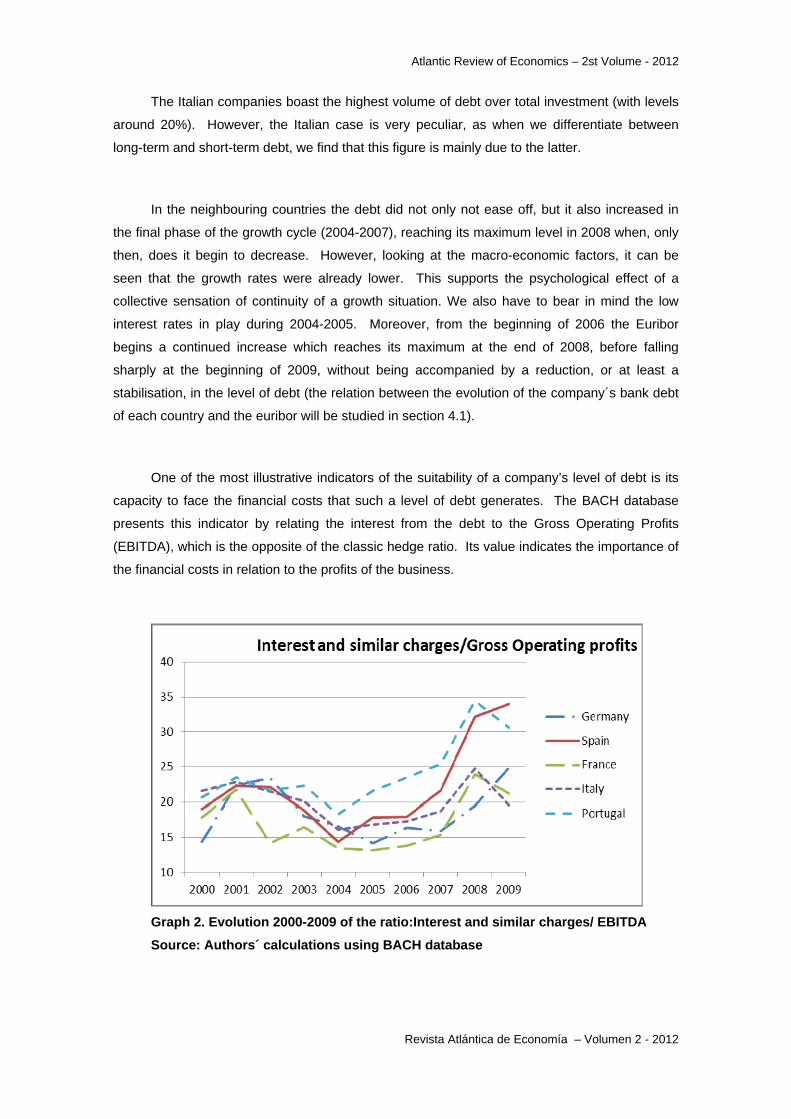
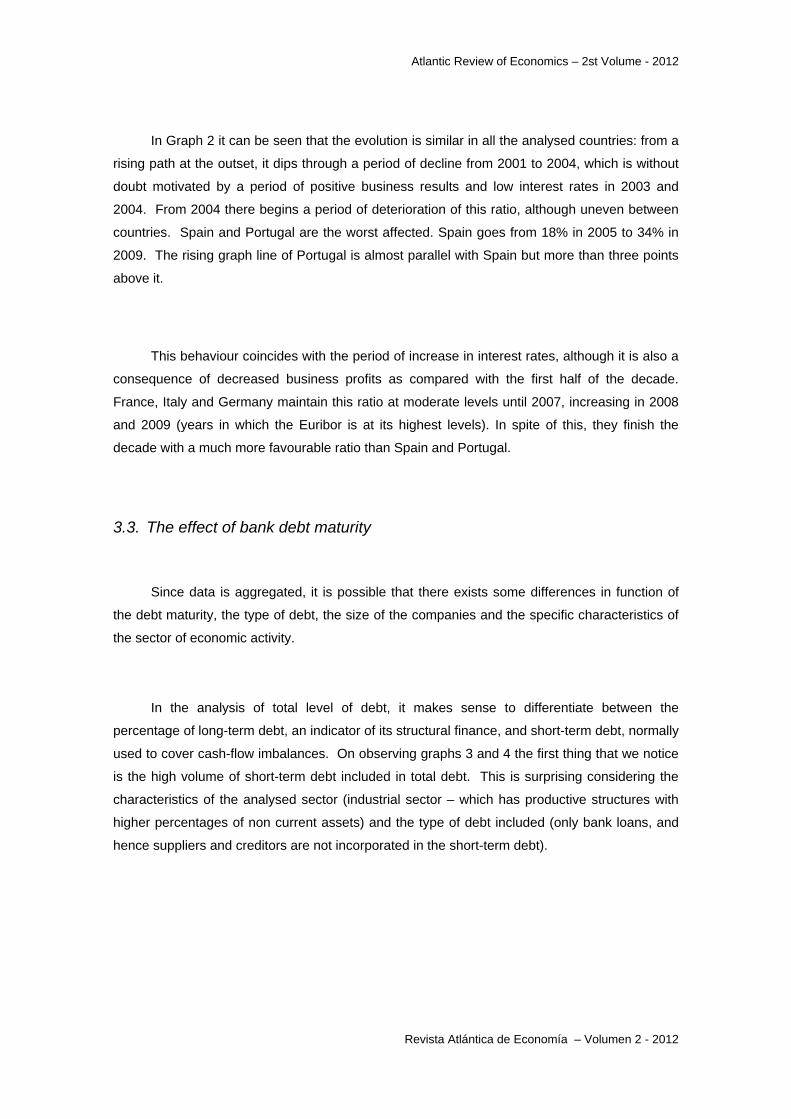
In the analysis of total level of debt, it makes sense to differentiate between the
percentage of long-term debt, an indicator of its structural finance, and short-term debt, normally
used to cover cash-flow imbalances. On observing graphs 3 and 4 the first thing that we notice
is the high volume of short-term debt included in total debt. This is surprising considering the
characteristics of the analysed sector (industrial sector – which has productive structures with
higher percentages of non current assets) and the type of debt included (only bank loans, and
hence suppliers and creditors are not incorporated in the short-term debt).
Atlantic Review of Economics – 2st Volume - 2012
Revista Atlántica de Economía – Volumen 2 - 2012
Graph 3. Evolution 2000-2009 of the ratio: long and medium-term bank debt / total
assets..
Source: Authors´ calculations using BACH database
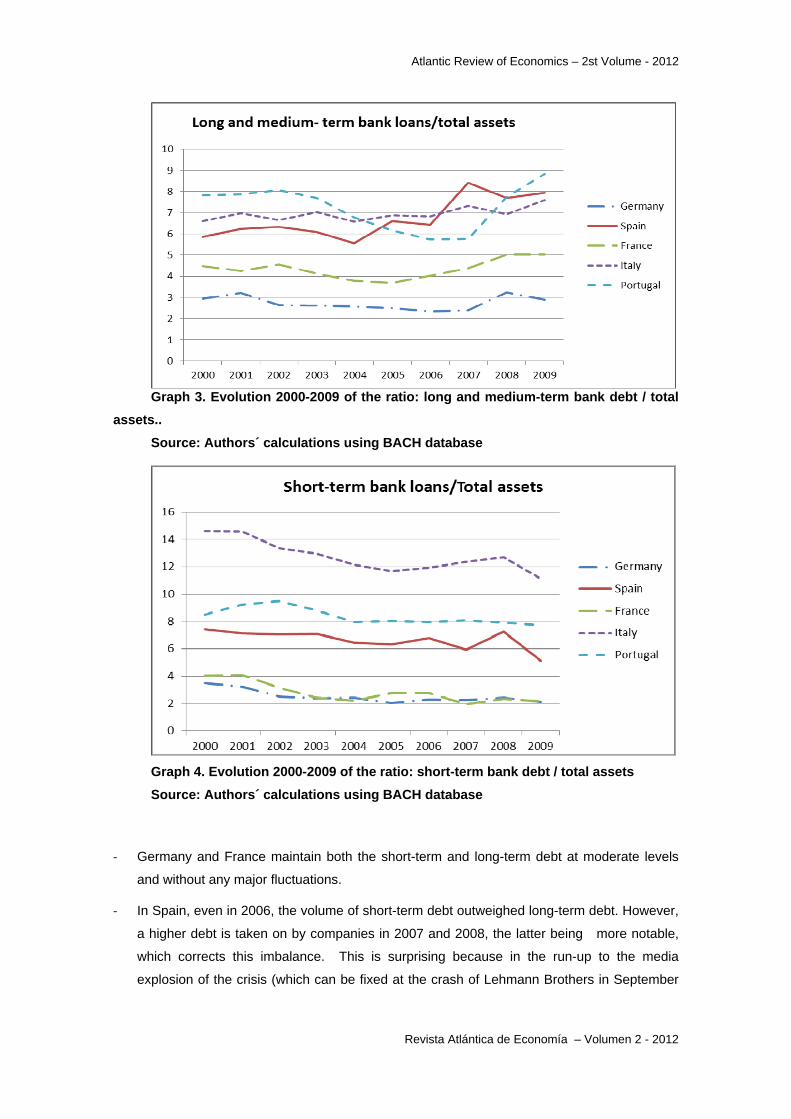
Graph 4. Evolution 2000-2009 of the ratio: short-term bank debt / total assets
Source: Authors´ calculations using BACH database
‐ Germany and France maintain both the short-term and long-term debt at moderate levels
and without any major fluctuations.
‐ In Spain, even in 2006, the volume of short-term debt outweighed long-term debt. However,
a higher debt is taken on by companies in 2007 and 2008, the latter being more notable,
which corrects this imbalance. This is surprising because in the run-up to the media
explosion of the crisis (which can be fixed at the crash of Lehmann Brothers in September
Atlantic Review of Economics – 2st Volume - 2012
Revista Atlántica de Economía – Volumen 2 - 2012
2008), and when the indicators already showed an exhaustion of the cycle, an increase in
long-term debt is produced.
‐ In Portugal the shape of the curve showing total debt is mainly due to variations in long-term
debt, with a decrease in the years 2002-2007 and an increase between 2008 and 2009.
With the exception of these last two years, the level of short-term bank debt has always
been higher than long-term debt.
‐ Finally commenting on the case of Italy, it has the highest level of total debt of the countries
analyzed, at around 20%, but for most of the time period around two thirds of the total debt
was short-term.
3.4. The effect of size
Due to the fact that not all the countries analyzed have the same business structure, it is
important to think about the effect of company size on the level of indebtedness. In this case a
new country, Belgium, is included1.
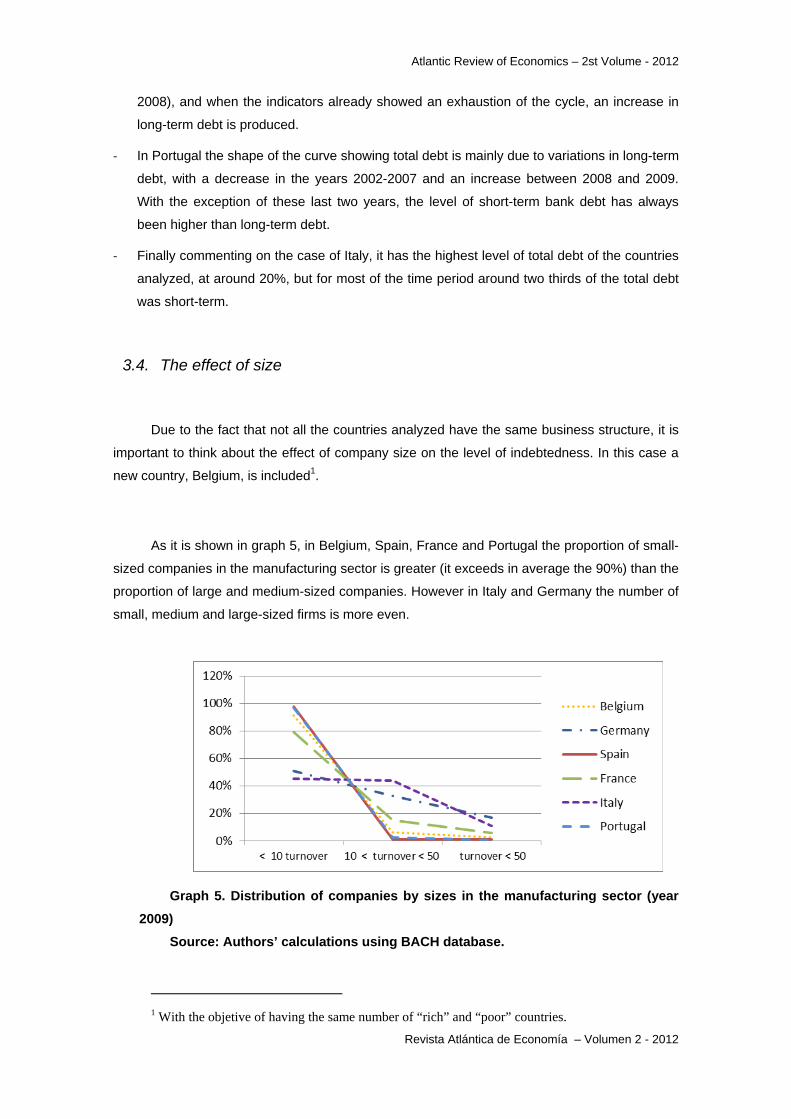
As it is shown in graph 5, in Belgium, Spain, France and Portugal the proportion of small-
sized companies in the manufacturing sector is greater (it exceeds in average the 90%) than the
proportion of large and medium-sized companies. However in Italy and Germany the number of
small, medium and large-sized firms is more even.
Graph 5. Distribution of companies by sizes in the manufacturing sector (year
2009)
Source: Authors’ calculations using BACH database.
1 With the objetive of having the same number of “rich” and “poor” countries.
Atlantic Review of Economics – 2st Volume - 2012
Revista Atlántica de Economía – Volumen 2 - 2012
Nevertheless, it should be noted that the ratios of database BACH are weighted in
function of the company size and, therefore, the effect of the size has already been incorporated
in figures. For example in Germany, even though the business debt is higher in small
companies than in large-sized companies, the high percentage of large-size companies helps to
bring total average closer to the large companies than to the small ones.
We will take a closer look at the effect of the size on debt ratio, showing some interesting
graphs.
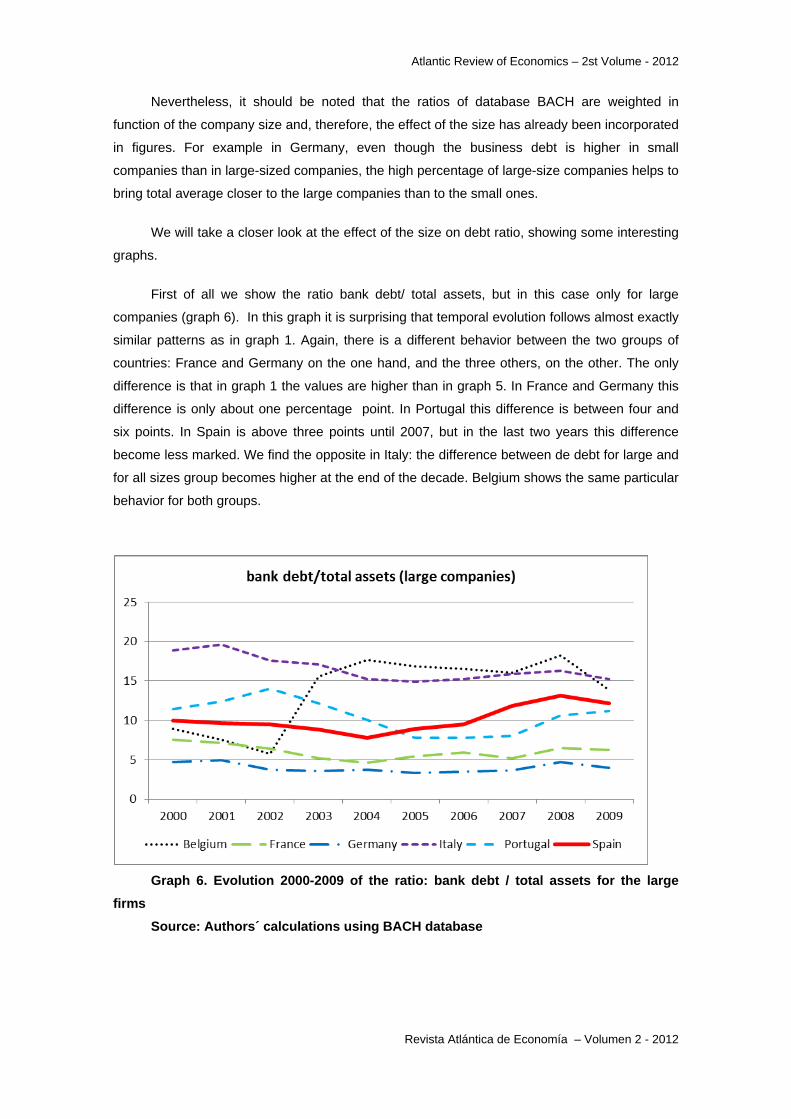
First of all we show the ratio bank debt/ total assets, but in this case only for large
companies (graph 6). In this graph it is surprising that temporal evolution follows almost exactly
similar patterns as in graph 1. Again, there is a different behavior between the two groups of
countries: France and Germany on the one hand, and the three others, on the other. The only
difference is that in graph 1 the values are higher than in graph 5. In France and Germany this
difference is only about one percentage point. In Portugal this difference is between four and
six points. In Spain is above three points until 2007, but in the last two years this difference
become less marked. We find the opposite in Italy: the difference between de debt for large and
for all sizes group becomes higher at the end of the decade. Belgium shows the same particular
behavior for both groups.
Graph 6. Evolution 2000-2009 of the ratio: bank debt / total assets for the large
firms
Source: Authors´ calculations using BACH database

Atlantic Review of Economics – 2st Volume - 2012
Revista Atlántica de Economía – Volumen 2 - 2012
In the second place, we examine the evolution of the ratio bankdebt/total assets for each
of the sizes and for each of the countries considered. We show as examples the cases of
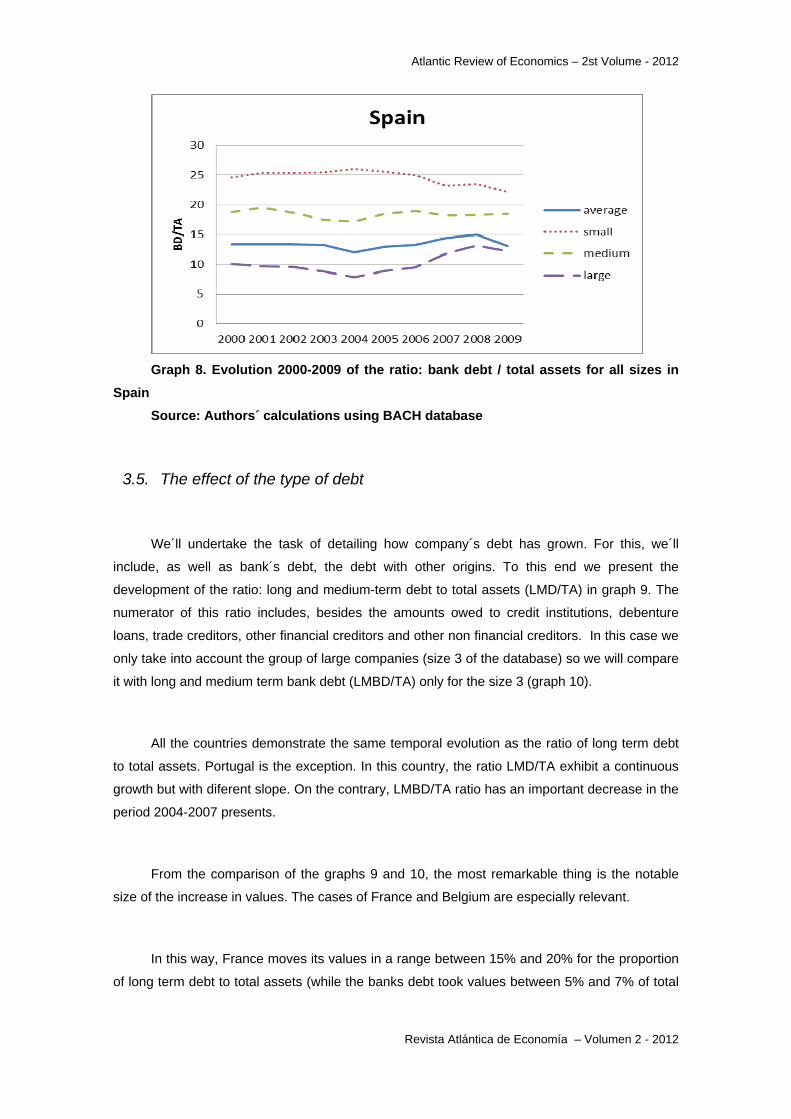
Germany (graph 7) and Spain (Graph 8). It should be noted that small and medium-size
companies have higher ratios than large-size companies. This is no new, since in the majority of
the studies about the debt level the business size is a significant factor. As we noted in the
graph 6, large company´s bank debt is approximately one point below the average in Germany
and three points in Spain (with a shorter difference at the end of the period). Nevertheless,
regarding the temporary evolution, that is the main aim of this research, we also find some
differences between groups of sizes. For example, the small companies in Spain begin to
decrease their level of debt before (already from the year 2004), although this decrease is very
gradual. However, small companies in Germany have higher levels of debt and with a clear
decrease during the period under review. At the end of the period covered by this research the
ratios of the three groups of size are moving closer than there were at the beginning.
Graph 7. Evolution 2000-2009 of the ratio: bank debt / total assets for all sizes in
Germany
Source: Authors´ calculations using BACH database
Atlantic Review of Economics – 2st Volume - 2012
Revista Atlántica de Economía – Volumen 2 - 2012
Graph 8. Evolution 2000-2009 of the ratio: bank debt / total assets for all sizes in
Spain
Source: Authors´ calculations using BACH database
3.5. The effect of the type of debt
We´ll undertake the task of detailing how company´s debt has grown. For this, we´ll
include, as well as bank´s debt, the debt with other origins. To this end we present the
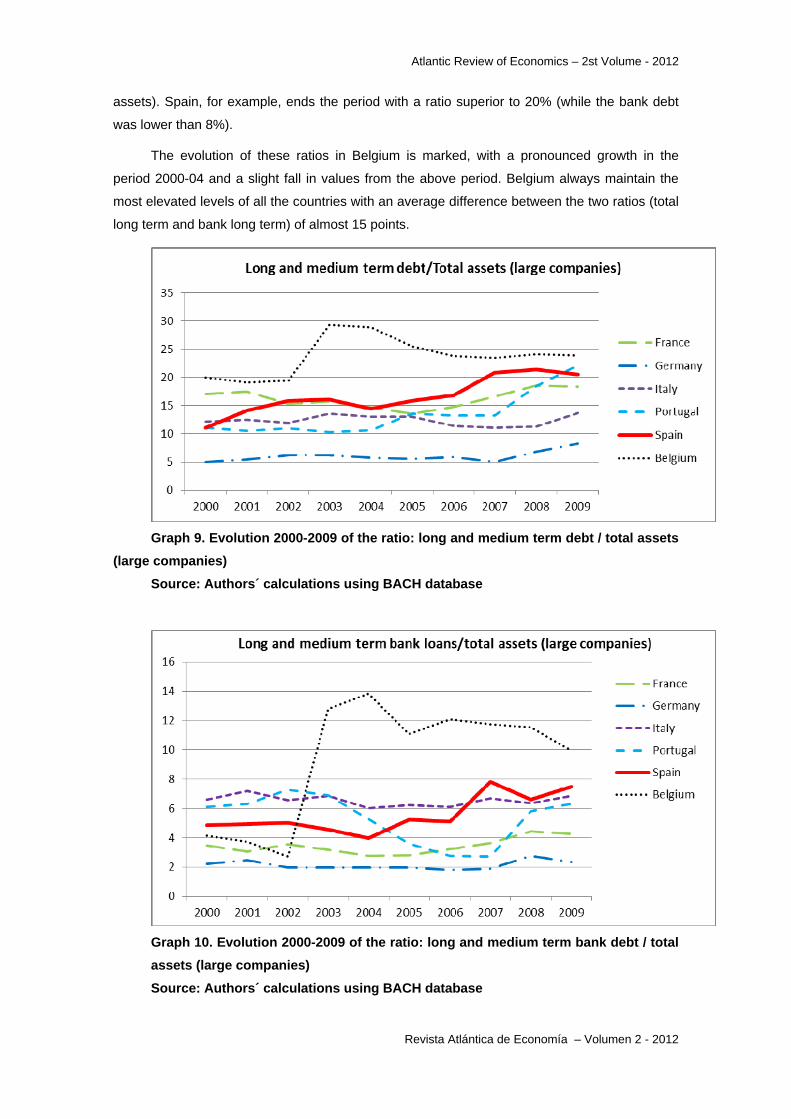
development of the ratio: long and medium-term debt to total assets (LMD/TA) in graph 9. The
numerator of this ratio includes, besides the amounts owed to credit institutions, debenture
loans, trade creditors, other financial creditors and other non financial creditors. In this case we
only take into account the group of large companies (size 3 of the database) so we will compare
it with long and medium term bank debt (LMBD/TA) only for the size 3 (graph 10).
All the countries demonstrate the same temporal evolution as the ratio of long term debt
to total assets. Portugal is the exception. In this country, the ratio LMD/TA exhibit a continuous
growth but with diferent slope. On the contrary, LMBD/TA ratio has an important decrease in the
period 2004-2007 presents.
From the comparison of the graphs 9 and 10, the most remarkable thing is the notable
size of the increase in values. The cases of France and Belgium are especially relevant.
In this way, France moves its values in a range between 15% and 20% for the proportion
of long term debt to total assets (while the banks debt took values between 5% and 7% of total
Atlantic Review of Economics – 2st Volume - 2012
Revista Atlántica de Economía – Volumen 2 - 2012
assets). Spain, for example, ends the period with a ratio superior to 20% (while the bank debt
was lower than 8%).
The evolution of these ratios in Belgium is marked, with a pronounced growth in the
period 2000-04 and a slight fall in values from the above period. Belgium always maintain the
most elevated levels of all the countries with an average difference between the two ratios (total
long term and bank long term) of almost 15 points.
Graph 9. Evolution 2000-2009 of the ratio: long and medium term debt / total assets
(large companies)
Source: Authors´ calculations using BACH database
Graph 10. Evolution 2000-2009 of the ratio: long and medium term bank debt / total
assets (large companies)
Source: Authors´ calculations using BACH database
Atlantic Review of Economics – 2st Volume - 2012
Revista Atlántica de Economía – Volumen 2 - 2012
These results seem to indicate that the emission of debt has been significant in all these
countries. However, all of them are bank oriented, in contrast to USA and England with market
orientated finance. It would be interesting to examine the specific values of all the concepts
included in this ratio.
3.6. He effect of the activity
In the database BACH the manufacturing sector embraces a big part of the industrial
sectors of each one of the countries considered: sectors like textile, food, industrial equipment,
chemist or automotive are in this group. The database does not give data for each one of these
subsectors, whose characteristics are, certainly, different. Nevertheless, the sector as a whole
shapes the basic industrial fabric of a country. Furthermore, the sector as a whole allows us to
illustrate if the business debt has rhythms of growth or different evolutions in the period
2000/09.
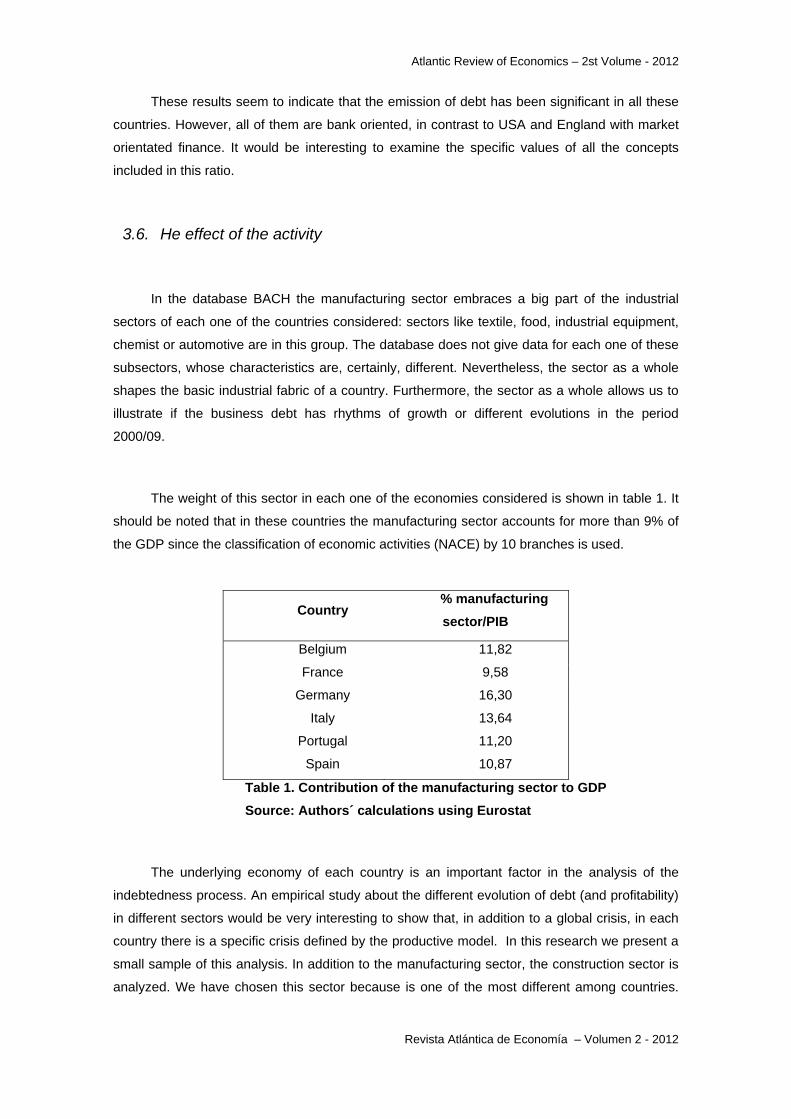
The weight of this sector in each one of the economies considered is shown in table 1. It
should be noted that in these countries the manufacturing sector accounts for more than 9% of
the GDP since the classification of economic activities (NACE) by 10 branches is used.
Country % manufacturing
sector/PIB
Belgium 11,82
France 9,58
Germany 16,30
Italy 13,64
Portugal 11,20
Spain 10,87
Table 1. Contribution of the manufacturing sector to GDP
Source: Authors´ calculations using Eurostat
The underlying economy of each country is an important factor in the analysis of the
indebtedness process. An empirical study about the different evolution of debt (and profitability)
in different sectors would be very interesting to show that, in addition to a global crisis, in each
country there is a specific crisis defined by the productive model. In this research we present a
small sample of this analysis. In addition to the manufacturing sector, the construction sector is
analyzed. We have chosen this sector because is one of the most different among countries.
Atlantic Review of Economics – 2st Volume - 2012
Revista Atlántica de Economía – Volumen 2 - 2012
Thus, whereas in Spain and Portugal the construction has been one of the major drivers of the
economic growth, his importance has been much lower in the rest of the countries considered.
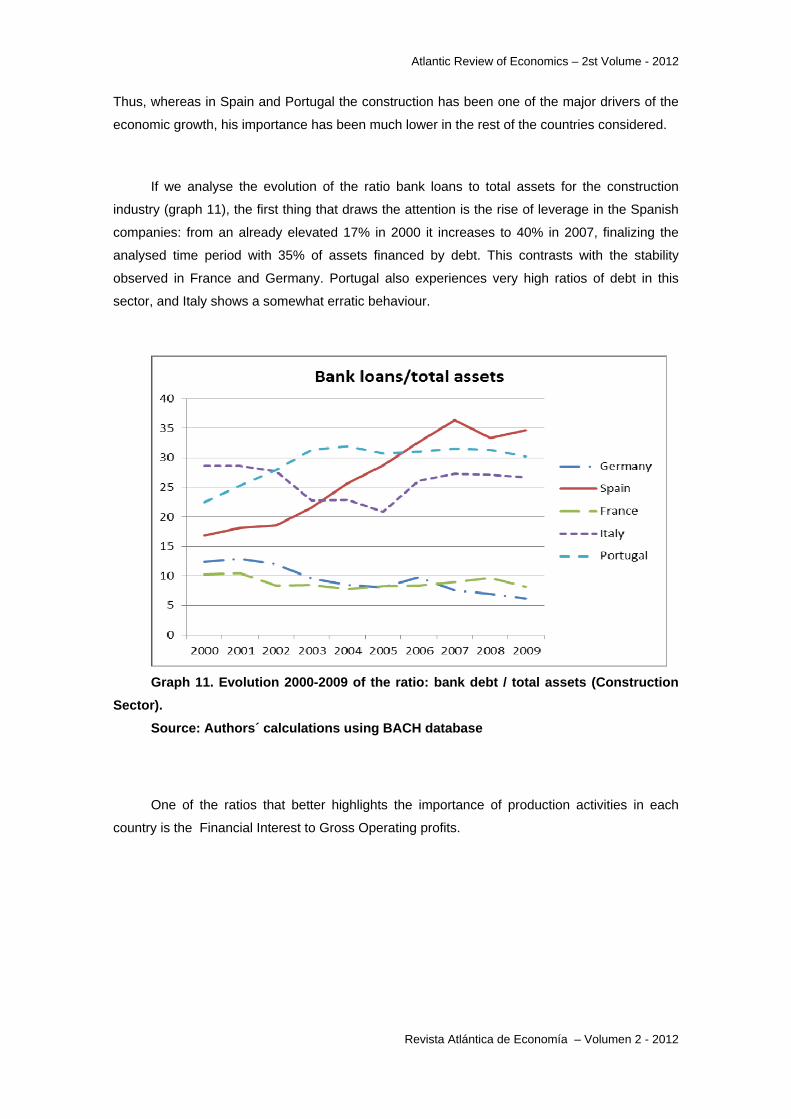
If we analyse the evolution of the ratio bank loans to total assets for the construction
industry (graph 11), the first thing that draws the attention is the rise of leverage in the Spanish
companies: from an already elevated 17% in 2000 it increases to 40% in 2007, finalizing the
analysed time period with 35% of assets financed by debt. This contrasts with the stability
observed in France and Germany. Portugal also experiences very high ratios of debt in this
sector, and Italy shows a somewhat erratic behaviour.
Graph 11. Evolution 2000-2009 of the ratio: bank debt / total assets (Construction
Sector).
Source: Authors´ calculations using BACH database
One of the ratios that better highlights the importance of production activities in each
country is the Financial Interest to Gross Operating profits.

Atlantic Review of Economics – 2st Volume - 2012
Revista Atlántica de Economía – Volumen 2 - 2012
Graph 12: Evolution 2000-2009 of the ratio: Interest and similar charges / EBITDA
(construction sector). Source: Authors´ calculations using BACH database
Observe that Graph 12 has to include Y-axis values of up to 70% in order to demonstrate
the important increase in this ratio in Spain and Portugal.
In Spain, although there is a slight decrease in this ratio from 23% in 2000 to 18% in 2004
(the same as for the figures in the industrial sector), from this year onwards a climb begins
which at first is fairly moderate (until 2006) but then becomes quite pronounced, with interest
payments reaching 62% of operating profits in 2008. Such an elevated level should not
surprise us, knowing that the construction sector bubble had burst, but what is surprising is that,
even though the rates were lower in 2004 and 2005, there was already an increase in this ratio.
This development appears to be quite significant, and leads us to the conclusion that a very
interesting extension of this study would be to discern to what degree the increase of this ratio is
a result of the increase in debt, of an increase in the cost of the debt, or a deterioration of the
results in the sector.
In relation to this indicator it is surprising that the situation of the Portuguese companies
is even more worrying. They maintain ratios superior to 40% in the whole of the analysed
period and reach 70% in 2008. This contrasts with the evolution of Germany and France which
end the period with ratios around 14%. France maintains a stable ratio for the whole period,
and Germany demonstrates a continued decrease during the decade going from 35% to less
than 15%.
Atlantic Review of Economics – 2st Volume - 2012
Revista Atlántica de Economía – Volumen 2 - 2012
4. Complementary analyses
In this section we present some statistical analysis providing information about the
different European countries behavior in regard to their process of accumulation of debt.
4.1. The relation between the evolution of bank debt ratio and some
macroeconomic variables
The publications centered on explaining which factors permit a company to get into debt,
have evolved from those which only include the firm´s characteristics to those which also
include macroeconomic, institutional and cultural variables. The first academic aim is
considered to be achieved. Now, the decision of assuming debt is taken as a complex and
dynamic process.
Some of the institutional and cultural variables are: banking regulation, shareholder
protection, creditor protection, disclosure (information available), political stability, corruption,
variables related to the bankruptcy code, the labour legislation, etc. Currently the investigation
on the effect of these factors is in its first stage, because it seems difficult not only to decide
what characteristics affect the debt decision, but also to articulate the right variables of
measure.
Among the macroeconomic variables, the most frequently included are: rates of growth
of real GDP, consumer price inflation, unemployment rates, debt market and stock market
indicators and interest rates (Euribor for the Eurozone).
In this paper some macroeconomic variables are shown and commented on, in particular
the rate of growth of GDP and the Euribor. We relate these variables with the evolution of debt
in each country.
Table 2 relates the average value of each country´s bank debt to the average annual
Euribor (measured as the average of the monthly one-year Euribor). Shown in grey are the
years when the Euribor has been lower and in bold the most elevated values of each country´s
bank debt ratio. Also we have calculated the correlation coefficients between the debt ratio and

Atlantic Review of Economics – 2st Volume - 2012
Revista Atlántica de Economía – Volumen 2 - 2012
the Euribor for the period considered. A high negative coefficient would indicate that in the years
of lower interest rates, the debt is higher. The opposite would show that the companies maintain
their debt levels higher even in the years when the interest rates are higher as well.
BD/TA France Germany Italy Portugal Spain Belgium euribor
Coef corr 53% 56% 63% 1% 71% -24%
2000 8,56 6,44 21,23 16,33 13,3 11,1 4,78
2001 8,33 6,47 21,57 17,1 13,36 9,85 4,08
2002 7,69 5,13 20,02 17,57 13,37 8,09 3,49
2003 6,54 4,97 20 16,48 13,19 15,38 2,28
2004 6 4,98 18,73 14,73 12 16,93 2,27
2005 6,48 4,54 18,57 14,2 12,92 16,17 2,33
2006 6,8 4,64 18,75 13,67 13,24 15,92 3,45
2007 6,31 4,64 19,67 13,88 14,35 14,95 4,45
2008 7,33 5,67 19,66 15,66 14,96 16,8 4,81
2009 7,18 5,02 18,74 16,57 13,04 13,16 1,62
Table 2: Evolution 2000-2009 of the ratio: bank debt / total assets and of the
euribor.
Source: Authors´ calculations using BACH database and calculating the average
mensual euribor rate for each year
At first glance we see that Spain has the higher positive correlation coefficient. This
indicates that, in Spain, the company´s debt is more conditioned by the productive model
(construction sector and all the activities around it) than by the cost of that debt. We think that
this supports the idea of the existence of a collective psychological sentiment that the situation
will be perpetual. Spain is also the only country with a maximum level of bank debt located in
the second half of the decade (when the European Central Bank has already applied an
increase of the interest rate).
France and Germany have positive correlation coefficients as well, but with lower values.
The reason may be the presence of the higher level of debt at the beginning of the decade (with
higher interest rates).
The firms of Portugal and Italy maintain high debt ratios throughout the decade and, even
though their maximum levels are at the beginning, they also finished the period with high levels
of debt. The positive correlation coefficient of Italy, although not as strong as the Spanish one,
also indicates lower sensibility of its debt decision to the interest rate.
Atlantic Review of Economics – 2st Volume - 2012
Revista Atlántica de Economía – Volumen 2 - 2012
The only country with a negative correlation coefficient is Belgium: the evolution of its
company´s debt is more dependent on the cost of that debt (although the value is not as high as
to allow us to draw meaningful conclusions).
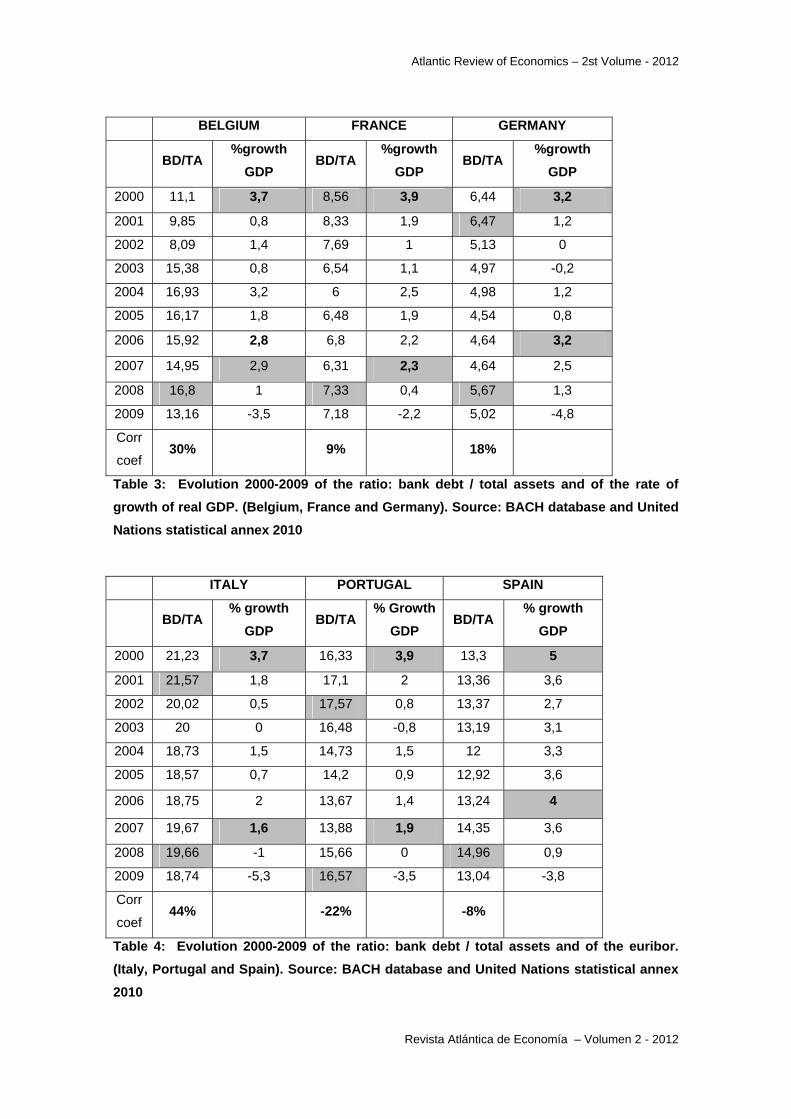
The relation between the rate of growth of real GDP and the growth of debt is shown in
table 3 for Belgium, France and Germany and in table 4 for Italy, Portugal and Spain.
The analysis of the data enables us to obtain an important conclusion: the divergent
behavior of Portugal and Spain (Especially our country) from all other countries. Spain is the
one with highest rates of growth and with the most abrupt fall at the end of the cycle. The
negative correlation coefficient between the debt ratio and the rate of growth of real GDP,
although with a low value, would indicate that the debt accumulation does not decrease with
lowers rates of growth of the economy.
An important value of GDP rate of growth is observed in 2006 for Germany and Spain
and in 2007 for the remaining countries. The end of the cycle of growth was very abrupt, fueled
by an artificial growth in the last years which was motivated, in our opinion, to a large degree by
psychological and cultural factors.
The knowledge of the importance of this factors is one of the most important challenges
of ongoing investigation in capital structure decision.
Atlantic Review of Economics – 2st Volume - 2012
Revista Atlántica de Economía – Volumen 2 - 2012
BELGIUM FRANCE GERMANY
BD/TA %growth
GDP BD/TA
%growth
GDP BD/TA
%growth
GDP
2000 11,1 3,7 8,56 3,9 6,44 3,2
2001 9,85 0,8 8,33 1,9 6,47 1,2
2002 8,09 1,4 7,69 1 5,13 0
2003 15,38 0,8 6,54 1,1 4,97 -0,2
2004 16,93 3,2 6 2,5 4,98 1,2
2005 16,17 1,8 6,48 1,9 4,54 0,8
2006 15,92 2,8 6,8 2,2 4,64 3,2
2007 14,95 2,9 6,31 2,3 4,64 2,5
2008 16,8 1 7,33 0,4 5,67 1,3
2009 13,16 -3,5 7,18 -2,2 5,02 -4,8
Corr
coef 30% 9% 18%
Table 3: Evolution 2000-2009 of the ratio: bank debt / total assets and of the rate of
growth of real GDP. (Belgium, France and Germany). Source: BACH database and United
Nations statistical annex 2010
ITALY PORTUGAL SPAIN
BD/TA % growth
GDP BD/TA
% Growth
GDP BD/TA
% growth
GDP
2000 21,23 3,7 16,33 3,9 13,3 5
2001 21,57 1,8 17,1 2 13,36 3,6
2002 20,02 0,5 17,57 0,8 13,37 2,7
2003 20 0 16,48 -0,8 13,19 3,1
2004 18,73 1,5 14,73 1,5 12 3,3
2005 18,57 0,7 14,2 0,9 12,92 3,6
2006 18,75 2 13,67 1,4 13,24 4
2007 19,67 1,6 13,88 1,9 14,35 3,6
2008 19,66 -1 15,66 0 14,96 0,9
2009 18,74 -5,3 16,57 -3,5 13,04 -3,8
Corr
coef 44% -22% -8%
Table 4: Evolution 2000-2009 of the ratio: bank debt / total assets and of the euribor.
(Italy, Portugal and Spain). Source: BACH database and United Nations statistical annex
2010

Atlantic Review of Economics – 2st Volume - 2012
Revista Atlántica de Economía – Volumen 2 - 2012
4.2. Anova test between groups of countries
As we can observe in graph 1 and in graph 2 we find different average values for ratios
describing the financial debt during the period 2000-2010 for this sample of European countries.
But to test the statistical significance of these relationships, we examine the means equality for
the six countries. The main objective is to analyze the influence of the dependent variable
(country) on the value of two variables (ratios) with very interesting information. The first one is
the ratio Bank loan to Total Assets and the second one is Financial Interest in relation to Gross
Operating profits.
For this, we divide the six countries into two groups: the group of countries with a more
repercussion of the financial and economic crisis (poor countries: Italy, Portugal and Spain) and
the group of countries that have performed relatively better (rich countries: Belgium, France and
Germany).
Before we compare means, we calculate the Levene’s test, which is used to test if the
two groups have equal variances. Table 5 shows the estimation results and the corresponding
p-values. With these results, we can reject the null hypothesis of homogeneity of variances in
the case of the first ratio (Interests and similar charges/Gross operating), but not in the second
case (Bank loans/Total assets).
Statistic P-value Statistic P-value
Test for the equality of group variancesLevene test 5,423 0,023 3,781 0,057Test for the equality of group means
Welch t test 9,991 0,003 65,447 0,000
Brown Forsythe test 9,991 0,003 65,447 0,000
Anova test 9,991 0,003 65,447 0,000
Interests and similar charges/Gross operating profits
Bank loans/Total assets
Table 5. European countries tests: by groups.
Atlantic Review of Economics – 2st Volume - 2012
Revista Atlántica de Economía – Volumen 2 - 2012
In the two cases, we cannot accept means equality for the two groups of countries,
indicating that there is not statistical independence between these ratios and the group which
includes each of the countries. In the previous table, we can also see the results for Welch’s
and Brown-Forsythe test. The results allow us to reject the null hypothesis of means equality in
both cases. Welch’s and Brown Forsythe test are an adaptation of Student’s t test intended for
use with two samples having possibly unequal variances.
We conclude that we can clearly reject in every cases the null hypothesis of homogeneity
of means equality. So, we also confirm statistically that the two different groups of countries do
not have the same value for the following ratios: Interests and similar charges to Gross
operating and Bank loans to Total assets. Therefore, these two groups show a different
behavior in regard to their process of accumulation of financial debt.
5. Conclusions and future research
In this study we propose a new approach in the analysis of the debt process. For this a
review of the main angles of study of company debt was carried out, grouping them into three
types: company factors, institutional factors, and macro-economic and sociological factors. This
allows us to have an overall view of the problem in order to propose a new overview in the study
of the debt decision.
This new theoretical vision is accompanied by a new empirical approach. In this respect
it is necessary to advance towards broader, more involved studies: why have these different
debt trajectories been produced, in which sectors and types of company, what factors explain
this evolution, what might future trends be, etc. It is a very ambitious approach which requires
constant elaboration and display of different phases. Our first approach to this study was to
investigate the evolution of company debt in Spain and compare it with neighbouring countries.
Due to the characteristics of the database used (BACH database) the period 2000-2009 was
chosen. In this way the following countries were selected: Spain, Italy, Portugal, France,
Germany and Belgium. Some of the most interesting conclusions are:
‐ In the manufacturing sector, and with respect to the total percentage of assets financed by
bank debt, two clear groups of countries were observed: France and Germany have
maintained moderate and stable levels, while the rest have assumed much higher ratios
and with major fluctuations.
Atlantic Review of Economics – 2st Volume - 2012
Revista Atlántica de Economía – Volumen 2 - 2012
‐ In all the expanded cycle (which taken as a whole, with a variation between countries,
covers 1995-2008), the years which show the greatest increase in debt were from 2004 to
2008 (in which it reaches its maximum). It was noted that it was in the final phase of the
expansive cycle, when the indicators were already marking lower economic growth, when
the greatest accumulation of debt was produced. In the case of Spain, moreover, it was
long-term debt that accounted for the greatest leverage growth, especially marked in the
construction industry (reaching 40% in 2007). This highlights a question which many
authors are now pointing out: market reaction presents non-linear behaviour, in such a way
that in growth periods it tends to undervalue risk and in periods of uncertainty it can often
over-react. In fact creditors both out-with and within the Eurozone (also including financial
institutions as the main lenders to companies) assumed that there was no risk of non-
payment and hence did not impose a risk premium on Spain, Portugal or even Greece until
2009. Summing up, the markets did not correct the situation related to firm leverage but, on
the contrary, it was in the final phase of the cycle, when there were clear signals of its end,
that the most marked increase was produced.
‐ A variable with a very illustrative evolution is that expressed by the total interest paid to the
gross operating profits. After a decrease in the years 2001-2004 there begins a period of
deterioration of this ratio, especially pronounced in Spain and above all in Portugal. It would
seem very interesting to distinguish in what measure the increase in this ratio is due to the
increase in debt, the increase in the cost of this debt (from 2006 the Euribor has been
continually rising) or to the reduction in profits gained from business operation.
‐ In relation to the previous point, if we limit ourselves to the construction sector, in Spain the
deterioration of this ratio can be clearly observed from 2004 and is very evident and marked
from 2006. The evolution of this ratio in Portugal is even worse. On the contrary this
trajectory is not observed in France and Germany.
‐ From the comparison of the evolution of the total debt and the bank debt, the most
remarkable thing is the notable size of the increase in values. The bank debt is not as
important as we thought, and probably for the large companies the market debt was
relevant too. It will be quite revealing to investigate the importance of the trade credit.
‐ Additionally we examine the relations between bank debt and some macroeconomic
variables. The most important conclusion is the low sensibility of the debt ratio of the
Spanish companies with respect to the euribor rate. With respect to the relation of real GDP
growth and debt accumulation, we observe once again, divergent behavior in Portugal and
Spain (especially our country) from all other countries.
‐ The Anova test confirms that the two different groups of countries (rich countries and poor
countries) do not have the same value for the following ratios: Interests and similar charges
to Gross operating and Bank loans to Total assets. Therefore, these two groups show a
different behavior in regard to their process of accumulation of financial debt.

Atlantic Review of Economics – 2st Volume - 2012
Revista Atlántica de Economía – Volumen 2 - 2012
The empirical study which begins with this contribution is currently progressing along the
following lines:
‐ The inclusion of more sectors in order to better know the relationship between the
underlying economy in each country and the evolution of firm leverage.
‐ It is very interesting to study in depth the evolution of macro-economic variables (growth of
GDP, interest rate, and others) in relation to leverage and know the level of elasticity that
each country presents with respect to the changes in these variables.
‐ Advances in the knowledge of the psychological and sociological aspects of the problem, a
question which is now seen to be important but which has not progressed much in empirical
terms, present us with an extremely interesting challenge.
Atlantic Review of Economics – 2st Volume - 2012
Revista Atlántica de Economía – Volumen 2 - 2012
Bibliography
Abe de Jong, A.; Rezaul Kabir and Thuy Thu Nguyen (2008); “Capital Structure around
the World: the Roles of Firm-and Country-specific Determinants”, Journal of Banking & Finance,
nº 32, pp. 1954-1969.
Acedo Ramírez, M.A.; Ayala Calvo, J.C.; Rodríguez Oses, J.E. (2005): “Rentabilidades,
endeudamiento y coste de la deuda de las pymes. Análisis empírico de las empresas por
tamaños”, Revista Europea de Dirección y Economía de la Empresa, vol. 14, nº 4, pp. 185-200.
Altman, E.I. (1984): “A further empirical investigation of the bankruptcy cost question”,
The Journal of Finance, September, pp. 1.068.-1089.
Boedo Vilabella, L.; Iglesias Antelo, S. (2004): “Factores que determinan la estructura de
capital de las grandes empresas. Aplicación empírica al caso español”, Address presented at
the XVIII Annual Congress of the AEDEM. Minutes of the congress, pages 391-402.
Boedo Vilabella, L.; Iglesias Antelo, S. (2005): “Factores que determinan la estructura de
capital de las empresas. Diferencias entre los resultados obtenidos para las empresas que
cotizan en bolsa, empresas grandes que no cotizan en bolsa y pymes”, Address presented at
the XIX Annual Congreso of the AEDEM, Minutes of the congress.
Cecchetti, S.G.; Mohanty, M.S.; Zampolli, F. (2011): The real effects of debt (working
paper nº 352), Bank of International Settlements (BIS).
De Andrés Alonso, P.; López Iturriaba, F. J. ; Rodríguez Sanz, J.A.; Vallelado González,
E. (2005): “Determinants of Bank Debt in a Continental Financial System: Evidence from
Spanish Companies”, The Financial Review, nº 40, pages 305-333.
Atlantic Review of Economics – 2st Volume - 2012
Revista Atlántica de Economía – Volumen 2 - 2012
De Angelo, H. and Masulis, R.W. (1980): “Optimal Capital Structure under Corporate and
Personal Taxation”, Journal of Financial Economics, March, pages 3-29.
Frank, M.Z; Goyal, V.K. (2009): “Capital Structure Decisions: Which factors are really
important?”, Financial Management, Spring 2009, pages 1-37.
Gungoraydinoglu, A; Öztekin, Ö. (2011): “Firm- and country- level determinants of
corporate leverage: some new international evidence”, Journal of Corporate Finance 17, pages
1457-1474.
Jensen, M.C. (1986): “Agency costs of free cash flow, corporate finance and takeovers”,
American Economic Review, vol. 76 (2), pages 323-329.
Jensen, M.C.; Meckling, W.H. (1976): “Theory of the firm: Managerial Behaviour, Agency
Costs and Ownership Structure”, Journal of Financial Economics, Volume 3, October, pages
305-360.
Jiménez Naharro, F.; Paladín Sánchez, M.J. (2007): “Determinantes de la estructura
financiera de la empresa”, Revista Europea de Dirección y Economía de la Empresa, vol. 16, nº
4, pages 9-24.
John, T.A. (1993): “Accounting Measures of Corporate Liquidity, Leverage and Costs of
Financial Distress” Financial Management, Autumn, pages 91-100.
Miller, M.H. (1977): “Debt and Taxes”, Journal of Finance, vol. 32, nº 2, May, pages 261-
275.
La Porta, R.; López de Silanes, F.; Shleifer, A. and Vishny, R. (1997): “Legal
Determinants of External Finance”, The Journal of Finance 52, pages 1311-1150.
La Porta, R.; López de Silanes, F.; Shleifer, A. and Vishny, R. (1998): “Law and Finance”,
Journal of Political Economy, 106 (6), pages 1113-1155.
Atlantic Review of Economics – 2st Volume - 2012
Revista Atlántica de Economía – Volumen 2 - 2012
Leland, H. E.; Pyle, D. (1977): “Information Asymmetries, Financial Structure and
Financial Intermediaries”, The Journal of Finance, 32, pages 371-387.
Marqués Sevillano, J.M.; Nieto, F.; del Río, A. (2007): “Una aproximación a los
determinantes de la financiación de las sociedades no financiera en España”, Moneda y
Crédito, nº 225, pages 43-73.
Modigliani, F.; Miller, M. (1958): “The Cost of Capital, Corporation Finance and the
Theory of Investment”, American Economic Review, vol. 68, nº 3, June, pages 261-297.
Translation in Spanish in Análisis Financiero, nº 26, 1981, pages 3-34.
Myers, S.; Majluf, N. (1984): “Corporate Financing and Investment Decisions when Firms
have Information that Investors do no have”, Journal of Financial Economics 13, pages 187-
221. Translation in Spanish in: Cuadernos Económicos del ICE, nº 42, 1989/2.
Palley, T. (2009): “La Macroeconomía de la Financiarización: un enfoque de etapas de
desarrollo”, Ekonomiaz, Revista de Economía vasca, nº 72, pages 34-53.
Ross, S. (1977): “The Determination of Financial Structure: the Incentive Signaling
Approach”, Bell Journal of Economics, Spring, vol. 8, pages 23-40.
Smith, C.W; Warner, J.B. (1979): “On financial Contracting. An analysis of Bond
Covenants” Journal of Financial Economics, vol. 14, pages 117-161.
Stein (2011): “The Diversity of Debt Crises in Europe”, Cato Journal, vol. 31, nº 2, pages
199-215
Utrero-González, N. (2007): “Banking Regulation, Institutional Framework and Capital
Structure: International Evidence from Industry Data”, The Quarterly Review of Economics and
Finance, nº 47, pages 481-506.
Atlantic Review of Economics – 2st Volume - 2012
Revista Atlántica de Economía – Volumen 2 - 2012
Varela, O. ; Limmarck, R.J. (1998): “Financial structure and industry classification in the
United Kingdom. Empirical research findings”, Journal of Financial Management and Analysis,
vol. 11, nº 1, enero-junio, pp. 1-9.
Warner, J.B. (1977): “Bankruptcy costs: some evidence”, The Journal of Finance, mayo,
pp. 337-347.
Wijst, Van Der.; Thurik, R. (1993): “Determinants of small business debt ratios: an
analysis of retail panel data”, Small Business Economics, vol 5, marzo 1993, nº 1, 55-65.