Embed Size (px)
Citation preview

A Novel Apparatus for Measuring the Interfacial Shear Rheology of Biofilms while
Measuring the Concentration of Redox Species in the Growth Media.
By
Curran G. Gahan
A THESIS
Submitted to
Oregon State University
University Honors College
in partial fulfillment of
the requirements for the
degree of
Honors Baccalaureate of Science in Chemical Engineering
(Honors Scholar)
Presented May 13, 2016
Commencement June 2016

2

3
An Abstract of the Thesis of
Curran G. Gahan for the degree of Honors Baccalaureate of Science in Chemical
Engineering presented on May 13, 2016. Title: A Novel Apparatus for Measuring the
Interfacial Shear Rheology of Biofilms while Measuring the Concentration of Redox
Species in the Growth Media.
Abstract approved:
________________________________________________________________________
Travis W. Walker
This project discuses the design of a novel apparatus for measuring the interfacial
rheological properties of a complex interface while measuring the concentration of redox
species within the sub-phase. Preliminary measurements made using the apparatus are also
presented. The objective of the preliminary experimentation was to simultaneously
measure the interfacial shear rheology of Pseudimonas aeruginosa biofilm, while
continuously measuring the concentration of pyocyanin (PYO) within the growth media
using scanning electrochemical microscopy (SECM).
The DWR-SECM apparatus described in this thesis allows for interfacial
rheological measurements to be taken simultaneously with electrochemical concentration
measurements in the sub-phase. In the case of P. aeruginosa, the interfacial rheological
properties remain constant at low concentrations of PYO in the growth media. During the
first 24 hours of growth, the PYO concentration rapidly increases. After 24 hours of biofilm
growth, the PYO concentration becomes constant. Over the following 72 hours, both the
interfacial storage and interfacial loss modulus increase two orders of magnitude or more.
The large increase in the interfacial moduli of the biofilm shows a general trend consistent

4
with other quorum-sensing, biofilm-growth patterns, as P. aeruginosa does not begin
production of biofilm until a high enough concentration of quorum sensing molecules are
detected within the growth media.
Corresponding email: [email protected]
Key Words: rheology, interfacial rheology, P. areguniosa, biofilm, pyocyanin, scanning
electrochemical microscopy, SECM.

5
©Copyright by Curran Gregory Gahan
May 13, 2016
All Rights Reserved

6
A Novel Apparatus for Measuring the Interfacial Shear Rheology of Biofilms while
Measuring the Concentration of Redox Species in the Growth Media.
By
Curran G. Gahan
A THESIS
Submitted to
Oregon State University
University Honors College
in partial fulfillment of
the requirements for the
degree of
Honors Baccalaureate of Science in Chemical Engineering
(Honors Scholar)
Presented May 13, 2016
Commencement June 2016

7
Honors Baccalaureate of Science in Chemical Engineering project of Curran G. Gahan
presented on May 13, 2016.
APPROVED:
Travis W. Walker, Mentor, representing Chemical Engineering
________________________________________________________________________
Willie E. Rochefort, Committee Member, representing Chemical Engineering
________________________________________________________________________
Uranbileg Daalkhaijav, Committee Member, representing Chemical Engneering
________________________________________________________________________
Toni Doolen, Dean, University Honors College
I understand that my project will become part of the permanent collection of Oregon
State University, University Honors College. My signature below authorizes release of
my project to any reader upon request.
________________________________________________________________________
Curran G. Gahan

8
ACKNOWLEDGMENTS
I would like to give thanks to TA Instruments for the initial design of the DWR
system as well as providing the “Smart Swap” base that allows for the device to be easily
attached the rheometer base.
I would like to express my gratitude towards Owen, Liam, Will, and Collin for their
support and friendship. Without you four, the last four years would have not nearly been
as fun and enjoyable as they have been.
I would not have been able to complete this thesis without the support and guidance
of my mentor Dr. Travis Walker. Through his mentorship I have progressed as a writer, a
student, and an independent researcher.
I would like to thank Dr. Skip Rochefort for acting as a counselor and mentor
through my entire undergraduate experience. I would not have made many of the great
decisions I have during my undergraduate without his sage advice.
Special thanks would like to be given to Ugi for all her support and enthusiasm
during experimentation and the thesis writing process. She has helped keep me excited
about the research and motivated to do my best in all that I publish.
Finally, I would like to thank my family for their constant support and love
throughout the thesis process. Special thanks would like to be given to my Mom for always
being able to cheer me up when I’m down, and my Dad for his constant willingness to
listen and give sound advice. I could not have finished this thesis without the support and
love the two of you constantly show me.
I would also like to give thanks to the Oregon State University Honors College for
their funding of this project.

9
Table of Contents
An Abstract of the Thesis of ............................................................................................................ 3
Table of Contents ............................................................................................................................. 9
I. Introduction ................................................................................................................................ 10
a. Pseudomonas aeruginosa ....................................................................................................... 10
b. Interfacial Rheology............................................................................................................... 12
c. Scanning Electrochemical Microscopy .................................................................................. 17
d. Project Motivation ................................................................................................................. 19
II. Design of Experimental Apparatus ........................................................................................... 20
a. DWR-SECM Trough ............................................................................................................. 20
b. SECM Integration .................................................................................................................. 25
c. Temperature Control Apparatus ............................................................................................. 27
III. Materials and Methods ............................................................................................................. 30
a. Preparation of P. aeruginosa Culture ..................................................................................... 30
b. System Setup .......................................................................................................................... 30
c. Rheological Testing ............................................................................................................... 31
d. Pyocyanin Concentration Analysis ........................................................................................ 32
i. Spectrophotometer Analysis .......................................................................................... 32
ii. Electrochemical Analysis ............................................................................................... 32
IV. Results and Analysis ................................................................................................................ 34
a. Room Temperature Rheological Testing ............................................................................... 34
b. Rheological Testing with Spectrophotometer Concentration Analysis at 40ºC ..................... 35
c. Rheological Testing with SECM and Spectrophotometer Concentration Analysis at 40ºC .. 38
V. Conclusions and Future Work ................................................................................................... 43
Works Cited ................................................................................................................................... 44
Appendix ........................................................................................................................................ 46

10
I. Introduction
This study investigates the design of a novel apparatus for measuring the interfacial
rheological properties of a complex interface while measuring the concentration of redox
species within the sub-phase. Preliminary measurements made using the apparatus are also
presented. The objective of the preliminary experimentation was to simultaneously
measure the interfacial shear rheology of Pseudimonas aeruginosa biofilm, while
continuously measuring the concentration of pyocyanin (PYO) within the growth media
using scanning electrochemical microscopy (SECM).
a. Pseudomonas aeruginosa
Pseudimonas aeruginosa is a pathogenic gram-negative environmental bacteria
that lives primarily within the lungs. P. aeruginosa can exist in many different phenotypes,
including a quorum sensing planktonic state and a biofilm producing state. At low cell
concentrations, P. aeruginosa exists in a planktonic state, in which P. aeruginosa releases
virulence factors - for protection from surrounding organisms - and quorum sensing
molecules. Among the virulence factors released by P. aeruginosa in its planktonic state is
pyocyanin (PYO). PYO is a poisonous redox molecule that is green in its oxidized state
and colorless in its reduced state [1]. Quorum sensing molecules are signaling molecules
that bacteria use to determine the relative cell concentration of P. aeruginosa in solution
[2]. When P. aeruginosa senses a high enough concentration of quorum sensing molecules
in solution, it begins to switch from its planktonic state to a biofilm producing state.
Biofilm is composed of extracellular polymeric substances (EPS) that hold
microbial cells together and to a surface. The EPS is released by the bacteria for protection,

11
as the biofilm deters the contact of antibiotics [3] and provides protection from shear forces
applied around the bacteria [4]. The EPS is composed mainly of a combination of
crosslinked biomolecules, exopolysaccharides, extracellular DNA, and polypeptides [5].
Because the EPS is composed of crosslinked polymers, it has complex rheological
phenomenon similar to the rheological phenomenon observed in gels [6,7].
The cyclic growth cycle of biofilms is displayed in Figure 1. Biofilm production
begins by bacteria affixing themselves to a wall or interface. Once enough bacteria affix
themselves or reproduce upon the same surface, they begin to produce EPS, and biofilm
begins to grow. Within the sessile structure that the EPS forms, the bacteria continue to
multiply, and the concentration of bacteria within the sessile structure rises. Finally,
bacteria in their planktonic state are released from the sessile structure of the biofilm into
the surrounding media to colonize other surfaces, and the growth process repeats [2]. The
further colonization of bacteria and the cyclical growth pattern of biofilm leads to an
increase in the concentration of EPS in the growth media over time, which should lead to
an increase in the modulus of the biofilm over the growth of the biofilm.

12
Figure 1. A cartoon by Ramsivika et al. [2], of the biofilm growth process
accompanied by the fluorescent microscope images of the biofilm in the various stages of
growth.
b. Interfacial Rheology
While classic rheology is the study of the mechanical properties of the bulk of
fluids, unique phenomenon can occur at chemical interfaces because of unlike chemical
interactions that occur at interfaces. Two modes of interfacial rheology that can be easily
measured are dilatational and shear interfacial rheology [8]. Interfacial shear rheology is
the characterization of a fluids mechanical properties in a shear flow field [9].

13
A shear flow field is a differing of velocity of adjacent layers of fluid. Shear can be
achieved at interfaces, probing phenomenon that occur exclusively at the interface, such as
the rheology of soluble surfactant monolayers and biological surface films. A cartoon of
shear flow can be found in Figure 2.
Velocity gradient
Moving Wall
Static Wall
Velocity
Figure 2. A cartoon depicting a shear flow field between two parallel plates. Because of
the no slip boundary of the fluid in contact with the plate, a shear flow field is created
when the top plate is moves as adjacent layers of fluid have differing velocities.
In Newtonian systems, the shear stress of the fluid is linearly related to the
shear strain rate applied at the interface. The slope of the linear relationship is known
as the viscosity of the fluid ; therefore the equation is used to describe the
mechanical properties of Newtonian fluids. A non-Newtonian fluid is a fluid with
mechanical properties which cannot be described by a linear stress strain rate
relationship. One subset of non-Newtonian fluids are viscoelastic fluids. Viscoelastic
fluids are unique in the fact that they have both viscous, liquid-like properties as well as

14
elastic, solid-like properties; therefore, the stress-strain relationship of the fluid needs to
be described by multiple terms. The terms used to describe the stress-strain relationship
of viscoelastic fluids in a shear flow field are the shear storage modulus (G’) and the
shear loss modulus (G’’). In interfacial rheology, the storage and loss moduli are known
as the interfacial storage modulus (G’s) and the interfacial loss modulus (G’’s). If a
viscoelastic fluid has strong intramolecular interactions, it behaves as more of a solid than
a liquid, and the storage modulus will be larger than the loss modulus.
Various devices have been developed to measure the interfacial rheological
properties of a complex fluids. These devices include the deep channel surface viscometer,
bi-cone rheometers, magnetic rod rheometers, and the pendant drop method [6-8].
Recently, bi-cone and du Noüy rings have been developed that interface with standard
rotational rheometers [10]. Both the du Noüy ring and the bi-cone are limited in their
measurement capabilities. The bi-cone apparatus has limited measurement capabilities
because it has a large global Boussinesq number. The global Boussinesq number is a design
parameter for interfacial rheological geometries and is proportional to the wetted perimeter
of a geometry divided by the wetted area of the geometry. A geometry with a large
Boussinesq number gives a higher signal to noise ratio in interfacial rheological
measurements. For an in-depth discussion of the global Boussinesq number, see Fitzgibbon
et al. [11]. The bi-cone geometry has a relatively low Boussinesq number as the bi-cone
geometry has a large wetted surface area and only a wetted perimeter on the outside of the
geometry. The bi-cone geometry is therefore not ideal for interfacial rheological
measurements. The du Noüy ring has a larger wetted perimeter to wetted area ratio than
the bi-cone geometry giving du Noüy ring a higher Boussinesq number than the bi-cone

15
geometry. The flaw in using a du Noüy ring for shear measurements is that shear flow only
occurs on the outside edge of the ring as the center of the ring experiences bulk, rotational
flow. The du Noüy ring also does not pin to the interface well because of the rounded edges
of the ring. The double wall ring (DWR) geometry by TA Instruments [12] improves upon
both the bi-cone and the du Noüy ring geometries . The DWR squares off the edges of the
ring to easily pin interfaces and enlarges the ring, reducing the curvature of the ring. The
DWR ring shape keeps a high Boussinesq number which gives good signal to noise ratio.
Finally the addition of the center ring trough allows for shear flow to occur at both edges
of the ring, which gives twice the wetter perimeter of the ring and therefore doubles the
Boussinesq number, leading to more sensitive measurement of interfacial mechanical
properties [13]. The DWR is an effective and convent geometry for measuring interfacial
phenomenon as the DWR can easily be attached to a rotational rheometer.
Figure 3: A picture of the entire DWR system set up on the Discovery Hybrid 3
(DHR3) rotational rheometer.

16
Two main types of shear rheology that exist are steady shear rheology and
oscillatory rheology. Steady shear rheology rotates the geometry in a single direction at
differing shear rates to determine the viscosity of a fluid over a range shear rates. Steady
shear works well for fluid samples that do not contain internal structures, as steady shear
can disrupt the structure of a sample that has complex internal crosslinking matrices and
thus change the rheology of the sample. Oscillatory rheology oscillates the geometry at
differing frequencies and amplitudes to probe the internal mechanical properties such as
the storage and loss moduli of the fluid. If the amplitude is small, the internal structure of
the sample can be probed without degradation. Two main tests are used within oscillatory
rheology, strain amplitude sweeps and frequency sweeps. In an amplitude sweep, the
geometry is oscillated at a constant frequency over a range of oscillation amplitudes. A
strain amplitude sweep probes the storage and loss moduli of the sample over many
magnitudes of applied strains. An amplitude sweeps assures that oscillatory tests are run
within the linear viscoelastic regime of a sample. In a frequency sweep, the geometry is
oscillated at a constant amplitude over a range of oscillation frequencies, probing the
storage and loss moduli of a sample over a range of deformation times. A third type of
oscillatory rheology can be used for samples that are expected to change rheology over
time such as reacting or living systems. These transient or time-based experiments are
completed at a constant oscillation frequency and amplitude over time to see how the
storage and loss moduli respond to the changing system.
Previous work has been conducted on the interfacial properties of biological
systems. Wang et al. used a du Noüy ring to measure the interfacial shear properties of
natural silk fibrin at the air/water interface [14]. Wu et al. [15] and Rühs et al. [16]

17
measured the interfacial rheological properties of E. coli bacterial biofilms. Wu et al. [15]
used a du Noüy ring to measure the interfacial rheological properties of the biofilms as
function of time. Over the course of the 72 hour measurement the interfacial moduli of the
biofilm rose three orders of magnitude. The rheology of the biofilms were also tested over
time using bacterial growth inhibitors that changed the strength of the biofilm. Rühs et al.
measured the interfacial moduli of E. coli biofilms as a function of time utilizing various
growth inhibitors and varying the pH of the growth media. A bi-cone geometry affixed to
a rotational rheometer with modifications for inlet and outlet ports for feed of new growth
media was used in the studies by Rühs et al.
c. Scanning Electrochemical Microscopy
Oxidation-reduction reactions or redox reactions are reactions that concern the
transfer of electrons to or from a species. A redox species is any molecule that can
participate in a redox reaction. In a redox reaction the oxidized species is one that loses an
electron in a redox reaction, while a reduced molecule is the molecule that gains an
electron. The concentration of a redox molecule in solution can be determined using an
electrochemical probe. In electrochemistry, a probe applies a bias to a solution, and the
resulting current from the reduction or oxidation of the redox species in solution is
measured. The magnitude of the current is compared to a standard curve to determine the
concentration of species in solution.

18
PYO+ PYO
e
Figure 4. A cartoon of a redox reaction at the probe tip.
Scanning electrochemical microscopy (SECM) is an electrochemical technique that
allows for the measurement of the concentration of chemical species within a growth media
as a function of time and space. SECM works by bring a metallic tip close to an interface
and applying a voltage to the tip. The resulting current from the SECM tip can determine
the concentration of a species in solution over time or the distance from an interface. If
moved over the surface of an interface and compared to a standard curve, SECM can be
used image an interface. Several papers have been published on measuring the
concentration of various redox molecules within a biofilm growth media using SECM [17-
19]. Koley et al. used SECM to determine the concentration of PYO in a growth media as
a function of distance from the biofilm, as well as imaging the surface of the biofilm. The
study found that a high concentration of PYO existed closer to the biofilm interface, as the
PYO is used by the biofilm as an electron acceptor similar to the human respiratory system
uses oxygen [20].

19
d. Project Motivation
While the works by Wu et al. [15] and Koley et al. [18] have looked at the
mechanical properties of a biofilm as well as used electrochemistry to determine the
concentration of virulence factors and quorum sensing molecules in solution, no
simultaneous measurement of the two phenomenon has been conducted. This project aims
to create an apparatus that can effectively determine the interfacial rheological properties
of an interface while simultaneously measuring the concentration of redox species in the
sub-phase. The created DWR-SECM apparatus will allow for the testing of the mechanical
properties of biofilms, while SECM will help to further our knowledge of biofilms and how
they form as a response to chemicals in the sub phase.

20
II. Design of Experimental Apparatus
a. DWR-SECM Trough
The DWR-SECM trough designed in this thesis was based on the radial dimensions
of the DWR trough by TA Instruments [10]. The calculations that the TA Instruments
DHR-3 rheometer uses to determine the interfacial rheological properties of the biofilm
assume that the DWR trough is being used during testing. Therefore, the radial dimensions
of the DWR-SECM trough match those of the lower channel of the DWR system sold by
TA Instruments. The DWR-SECM trough was milled to a constant radius for the entire
height of the trough as opposed to the two tiers seen in the TA Instruments DWR trough.
The DWR system was designed for measurement of surfactant-latent interfaces and
therefore needs a step to pin interfaces, while this step is unnecessary in the DWR-SECM,
as biological interfaces can pin to the walls of the DWR-SECM trough. The omission of
the step in the trough prevents growth media from spilling over the step and unpinning the
biofilm from the trough walls.

21
Figure 5. (a) CAD image of DWR-SECM trough. (b) A cartoon of the DWR-SECM
trough. The dimensions in the drawing are: H1 = 7.5 mm, H2 = 20 mm, R1 = 31 mm, R2
= 39.5 mm, R3 = 45.5 mm, R4 = 55.7 mm.
(a)
(b)

22
Biofilm is a living, growing system that needs a constant supply of nutrients for it
to grow over long periods of time. The outer channels of the trough reactor denoted in
Figure 6 by the arrows allow for the growth media to be fed to the trough and drained from
feed from the center of the trough without disturbing the growth of the biofilm. The
biological interface within the DWR-SECM trough is self-leveling, as the vacuum in the
outlet channel of the trough regulates the level of growth media, which keeps the interface
in constant contact with the DWR ring.
Figure 6. A picture of the entire DWR trough with feed and vacuum canals. The
holes at the inlet and outlet of the trough are connected to feed and vacuum lines. The
covered hole denoted by a circle is an artifact of the machining process (Scale=1”).

23
The trough was constructed from Teflon (PTFE). PTFE has a melting point above
the operating temperature of an autoclave, and it is chemically inert to bleach. Autoclaveing
and bleaching are the dominant methods used in the sterilization of biological systems. The
selection of PTFE makes cleaning the trough after experimentation easy both chemically
and with the autoclave. PTFE is also a hydrophobic substance, which is important in
interfacial phenomenon, as it deters surface interaction between the interface and
surrounding material.
To account for the evaporation of water from the growth media and to replenish
nutrients within the growth media, fresh growth media was fed to the reactor at a flow rate
of 1.50 ml/hr from a syringe pump using a 60 ml syringe. The fresh feed is fed to the reactor
through a 1/16” ID rubber tubing. A drip system was used to ensure that biofilm would not
grow through the feed tubes and contaminate the fed syringe. To ensure that excess feed
did not submerge the DWR ring, a vacuum system was built into the outlet canal that
controls the level of the biofilm interface.

24
Figure 7. A picture of (a) the feed syringe and syringe pump (Scale=1”), (b) the
feed drip system (Scale =1”), (c) the vacuum flask and facilities vacuum line (Scale=5”).
(a)
(b)
)
(a)
(c)

25
b. SECM Integration
The SECM probe being used during experimentation is constructed of a platinum
electrode housed within a glass capillary. Because the SECM probe is fragile, and it can
foul when brought into contact with biological media for too long, a probe sheath was
constructed. The probe sheath is constructed of a 25-mm diameter by 45-mm long Teflon
rod, where the top 35 mm of the rod was machined to a 0.250”+0.005” so that a slip fit
could be achieved through a 0.250” hole that was reamed in the base of the Teflon trough.
Through the top 20 mm of the center of sheath, a No. 7 drill bit was used to create a press
fit between the probe capillary and the sheath. The bottom 25 mm of the sheath was milled
to 2 mm ID to allow for easy insertion and removal of a probe.
Figure 8. (a) SECM probe. (b) SECM probe and sheath. (c) SECM probe in sheath.
(d) Side view of SECM probe sheath. For scale the probe sheath is 1” wide.
A Newport MFA-PPD computerized linear stage controlled by a ESP301-3G 3-
axis controller is used so that the position of the SECM probe relative to the biofilm
interface can be accurately be measured, which allows for accurate mapping of the
concentration of PYO within the growth media over the depth of the trough. To
accommodate the linear stage assembly, the DWR-SECM trough was raised 120 mm
aboveof the rheometer base by a Delrin rod. The selection of a Delrin rod was a design
(a) (b) (c) (d)

26
oversight, as Delrin has a melting temperature below the operating temperature of the
autoclave. Because of the low melting point of Delrin, the trough cannot be sanitized using
an autoclave. If the post was to be remade, PETE would have been chosen, as PTFE can
be autoclaved. To connect the probe sheath to the linear stage, a custom L-bracket was 3D
printed.
Figure 9. A side view of the trough with the feed line attached and probe sheath
inserted into the trough (Scale= 1”).
To connect the computerized linear stage to the rheometer base, a custom plate was
fabricated. The plate uses M5 bolt standoffs to connect to the rheometer base. These
adaptors support the plate and also tie it into three M5 tapped holes arranged in a 60 mm
diameter circle separated by 120⁰ between holes that are built into the rheometer. Once
tightened, two Newport 423 linear translation stages with Newport SM-25 micrometers are
attached to the plate by ¼-20 bolts. The linear stages are in place to make fine adjustments

27
when aligning the SECM sheath into the hole cut in the base of the DWR-SECM trough.
The computerized linear stage is attached to the translational stages by a Newport 360-90
angle bracket and assorted hardware. A picture of the entire setup mounted to the rheometer
can be found in Figure 10.
Figure 10. A picture displaying the assembled stage apparatus. The scale
bar is 3”.
c. Temperature Control Apparatus
P. aeruginosa only produces noticeable amounts of PYO at or above body
temperature (37⁰C) [1]. The DWR-SECM trough is open to the environment; therefore, the
surroundings air needs to be kept at approximately 37⁰C for the P. aeruginosa to produce

28
PYO. To accommodate an elevated temperature of the growth media, a temperature
controlled chamber was constructed of Styrofoam insulation. The temperature control
chamber was heated using a radiative space heater unit. A radiative heat source had to be
used as opposed to a convective heat source because measurements made by the DWR ring
are sensitive to convective motion at the interface. The temperature of the box was
controlled using a homemade temperature control unit. The thermostat for the temperature
control unit was placed at the top of the temperature control chamber, while the space
heater was placed at the bottom of the temperature control chamber to ensure that the
trough would constantly be operating at or above 37⁰C.

29
Figure 11. Pictures of the temperature control chamber used during testing. (a) A
front view of the box (Scale= 1ft). (b) A side view of the temperature control chamber
showing the vacuum lines out of the chamber and the vacuum flask used. (Scale= 6”). (c)
Interior view of temperature control chamber with heating element. (d) Side view of box
with heating element. For scale, the heating element base is 10” wide.
(a) (b)
(c) (d)

30
III. Materials and Methods
a. Preparation of P. aeruginosa Culture
P. aeruginosa cells were inoculated into Lysogen Broth (LB) growth media. The
inoculated culture is then placed on a shaker in an incubator at 42⁰C overnight. The culture
is spun down in a centrifuge for 10 minutes at 10,000 RPM. The cells are then separated
from the bulk of the growth media using a micropipette.
b. System Setup
All syringes, tubing, connectors, and the vacuum flask were autoclaved and then
wrapped in aluminum foil to prevent contamination. The DWR trough and SECM probe
and probe holder were chemically sterilized by soaking in a 20% bleach solution for 30
minutes and subsequently rinsed. The probe was inserted into the probe sheath. The probe
sheath is inserted into the DWR-SECM trough, and the trough was filled with 30 mL of
sterile growth media. The DWR-SECM trough was then placed in an incubator for 24 hours
to allow the apparatus to heat to 37 ⁰C. The sterile 60 ml syringe was filled with sterile
growth media and held at a constant 37 ⁰C in the incubator. The DWR ring was dipped in
ethanol and flamed to remove all contaminants then wiped.
The linear stage attachment plate was then attached to the rheometer through M5
tapped holes in the base of the rheometer. Two manually adjusted linear stages were
attached to the plate through ¼-20 bolts in the plate. An angle bracket was then affixed on
top of the manual linear stages with ¼-20 bolts. The motorized linear stage was attached
to the angle bracket and the 3D printed angle bracket which holds the probe sheath.

31
The temperature control chamber was then lowered over the apparatus and the
heating element is allowed to run until the temperature control chamber reached 37 ⁰C. The
trough was then connected to the DHR3 through the “Smart Swap” footing at the base of
the trough post. DHR3 calibration and zeroing programs are run to ensure standardization
of each test. The 60 ml syringe was attached to the syringe pump and connected to a drip
feed system. The drip feeder and vacuum lines were then attached to the trough. The inner
ring of the trough was then loaded with the concentrated inoculate. The DWR ring was
then lowered into contact with the interface. Growth media from the syringe was fed at 50
ml/hr until the vacuum pulls excess growth media from the outlet channel. The feed was
then reduced to 1.50 ml/hr for the remainder of the experiment.
c. Rheological Testing
Five individual rheological tests are performed the on the P. aeruginosa culture.
Oscillatory and amplitude sweeps were run before and after biofilm growth, while a
constant oscillation time sweep was run during biofilm growth. Oscillatory amplitude
sweeps were run between 0.1 and 100% strain and the frequency sweeps were run between
0.05 rad/s and 10 rad/s. During the time-based experiments, the ring was oscillated at an
angular frequency of 0.1 rad/s at an oscillatory strain of 2%. During the preliminary
experiments discussed in this thesis, 1 ml samples of growth media from the outlet
overflow basin were taken every 2 hours for the first 12 hours of experimentation and
intermittently over the remainder of experimentation. Growth media samples were frozen
to be preserved for spectrophotometry testing. When SECM results are similar to those
recorded on the spectrophotometer system, spectrophotometer samples will not need to be

32
taken, as the concentration of PYO will be reliably be measured by the integrated SECM
system.
d. Pyocyanin Concentration Analysis
i. Spectrophotometer Analysis
Samples of growth media taken during biofilm growth were analyzed using an ultra
violet spectrophotometer. The frozen samples were thawed in tap water and then spun in a
centrifuge for 10 minutes at 10,000 RPM. The growth media was separated from the cells
using a pipette and transferred to new centrifuge tubes, and the cells were disposed. Growth
media was then transferred to 0.5-cm-wide polystyrene cuvettes, and the absorbance of the
sample was measured at a wavelength of 320 nm. The spectrophotometer was zeroed to
the absorbance of the sterile LB growth media. When an absorbance greater than 0.7 was
recorded, the samples were diluted in half.
A standard curve for the absorbance of PYO within LB media at a wavelength of
320 nm was created to find the concentration of PYO in the growth media as a function of
time. PYO purchased from Sigma Aldrich was used in the creation of the standard curve.
Dilutions of 1.0 to 7.0 mg/l in LB media were created that all had an absorbance between
0 and 0.7. The spectrometer standard curve can be found in Appendix A1.
ii. Electrochemical Analysis
Potential sweeps from -0.6V to 1V were collected every 20 minutes from the
working electrode in the center DWR-SECM ring at a position 3 mm above the floor of the
trough. The PYO electrochemical peak around -0.25V was recorded.

33
A standard curve for the peak current of PYO within LB growth media was
constructed using PYO purchased from Sigma Aldrich. Dilutions were created in
concentrations from 4.8 uM to 95.2 uM. The SECM standard curve can be found in
Appendix A2.

34
IV. Results and Analysis
a. Room Temperature Rheological Testing
Figure 12. Rheological measurements of biofilm over the time of growth at room
temperature.
Figure 13 shows the rheology of P. aeruginosa growth media over time at room
temperature. The noise seen at the beginning of testing is because the force transducer on
the rheometer is not sensitive enough to measure low interfacial moduli. The periodic drops
in the interfacial moduli are artifacts of the vacuum system used during testing. The sudden
pull of the vacuum and the lowering level of the interface in the trough causing the
measured interfacial moduli to lower. A lag period exists for the first 24 hours after
inoculation, when the P. aeruginosa are in their planktonic state. Once enough quorum
sensing molecules are detected in solution, the interfacial moduli begins to rise as biofilm
begins to form. The formation of biofilm causes the interfacial moduli of the growth media

35
to rise 24 hours after inoculation. The interfacial moduli of the biofilm becomes constant
after 60 hours, as the growth media within the DWR-SECM trough ireach their stationary
phase. Over the course of growth, both the interfacial storage and loss moduli of the biofilm
rose three orders of magnitude above the sterile LB media. The results of the room
temperature trial are similar to the results by Wu et al. [15], in which both the interfacial
storage and loss moduli of the E. coli biofilm increase multiple orders of magnitude over
the course of testing, including a sharp increase in the interfacial moduli followed by
relatively flat plateaus. Rheological data from additional room temperature trials can be
found in Appendix B of this report.
b. Rheological Testing with Spectrophotometer Concentration Analysis at
40ºC
P. aeruginosa is an environmental bacteria; therefore, they thrive at body
temperature [1]. To allow for testing at optimal temperatures, rheological testing was
performed in a temperature control chamber set to 40ºC. At the same time, samples of the
growth media were taken periodically during testing and analyzed in a spectrophotometer
for concentration. Similarly to the room temperature sample, a lag period exists in the first
24 hours of testing before the P. aeruginosa begin to produce biofilm. Once production
begins, the interfacial moduli of the biofilm increases by two and a half orders of
magnitude. The increase seen in the interfacial modulus four hours into measurement are
caused by protein interactions within the LB growth media forming a weak matrix. These
interactions are interrupted once the P. aeruginosa increase in concentration within the
growth media. The elevated temperature of the growth media resulted in a larger final
interfacial modulus of the biofilm than seen at room temperature.
36
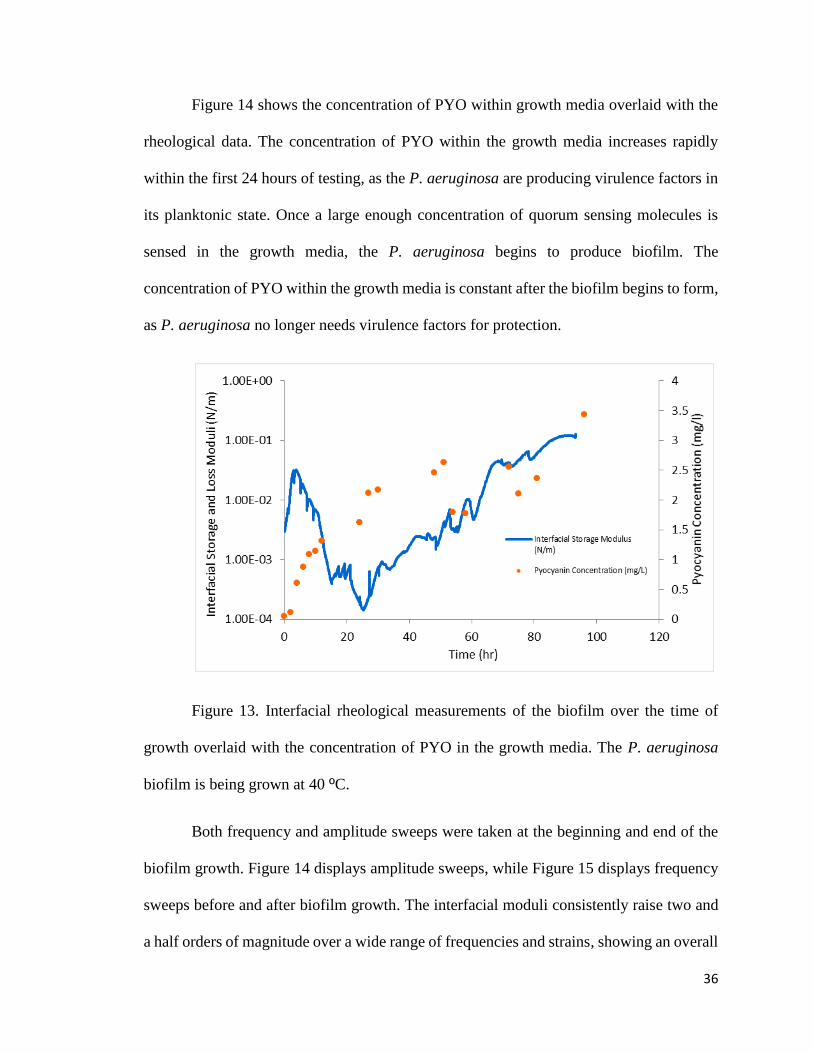
Figure 14 shows the concentration of PYO within growth media overlaid with the
rheological data. The concentration of PYO within the growth media increases rapidly
within the first 24 hours of testing, as the P. aeruginosa are producing virulence factors in
its planktonic state. Once a large enough concentration of quorum sensing molecules is
sensed in the growth media, the P. aeruginosa begins to produce biofilm. The
concentration of PYO within the growth media is constant after the biofilm begins to form,
as P. aeruginosa no longer needs virulence factors for protection.
Figure 13. Interfacial rheological measurements of the biofilm over the time of
growth overlaid with the concentration of PYO in the growth media. The P. aeruginosa
biofilm is being grown at 40 ºC.
Both frequency and amplitude sweeps were taken at the beginning and end of the
biofilm growth. Figure 14 displays amplitude sweeps, while Figure 15 displays frequency
sweeps before and after biofilm growth. The interfacial moduli consistently raise two and
a half orders of magnitude over a wide range of frequencies and strains, showing an overall

37
increase in the mechanical strength of the interface over the growth period. The interfacial
storage and loss moduli are parallel over a wide range of frequencies, showing the biofilm
has gel-like characteristics. This result makes sense because the biofilm is a polymer matrix
with weak polymer associations and therefore behaves more solid or gel-like at low strain.
The amplitude sweeps show that the oscillation strain of 2% keeps measurement in the
linear viscoelastic regime throughout measurement.
Figure 14. Amplitude sweep measurement before and after biofilm growth for P.
aeruginosa biofilm grown at 40ºC.

38
Figure 15. Frequency sweep measurement before and after biofilm growth for P.
aeruginosa biofilm grown at 40ºC.
c. Rheological Testing with SECM and Spectrophotometer Concentration
Analysis at 40ºC
Figure 16 displays the results of rheological measurement of P. aeruginosa biofilm
at 40 ºC. During testing the outlet channel of the DWR-SECM became clogged with
biofilm, and therefore, no pull from the vacuum existed to level the surface. During this
test, the interfacial moduli of the biofilm rose higher than had been previously seen with
heated biofilm, but the same gel-like behaviors of the biofilm were displayed.
Electrochemical measurements being run in the sub-phase does not significantly affect the
rheological measurements or properties of the biofilm as it is being grown.

39
Figure 16. Interfacial rheological measurements of the biofilm over the time of
growth. The P. aeruginosa biofilm is being grown at 40ºC while electrochemical
concentration tests in the sub phase were being performed.
Both the final PYO concentration in the growth media and the maximum interfacial
moduli were higher in this run than in the previous runs. The variance in the interfacial
moduli and the concentration of PYO in the growth media from test to test are due to a
variety of variances in testing parameters such as; the replacement of sterile growth media
to the trough after samples were taken in the trial shown in Figure 16, the clogging of the
trough channel in the trial seen in Figure 16, and general variance of the condition of P.
aeruginosa within the growth media. General biological variance is why many trials need
to be conducted with biological systems to confirm general trends seen within the data.
40
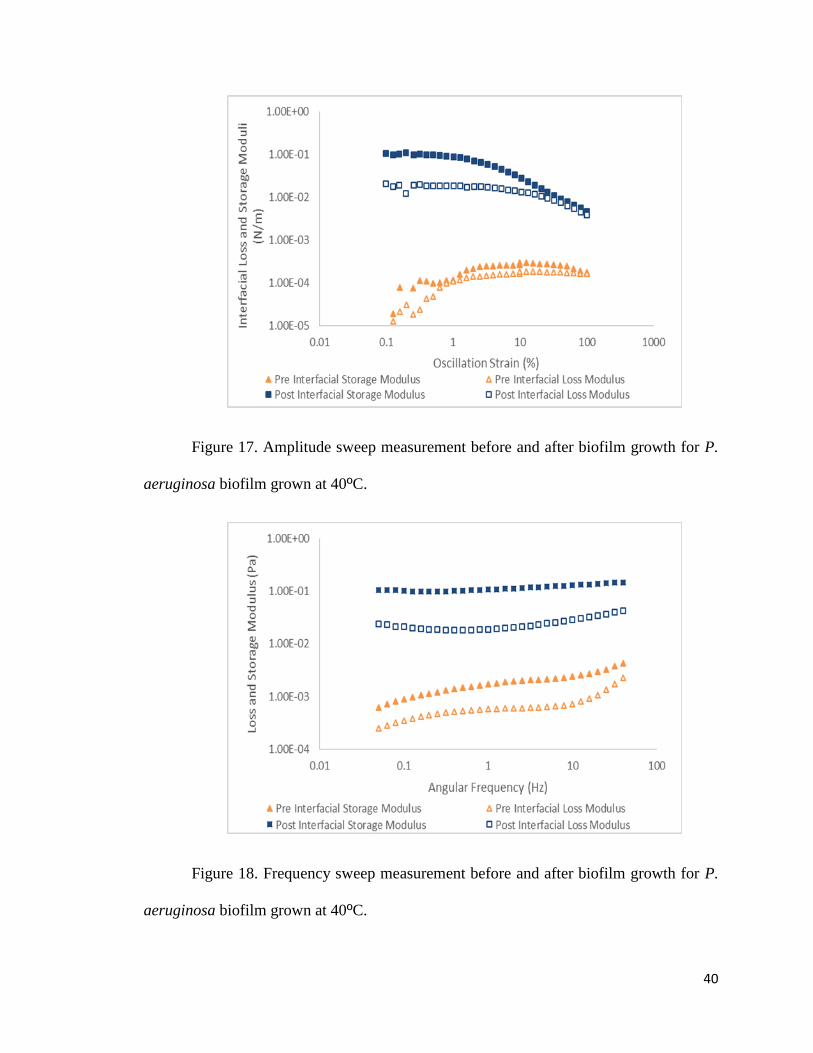
Figure 17. Amplitude sweep measurement before and after biofilm growth for P.
aeruginosa biofilm grown at 40ºC.
Figure 18. Frequency sweep measurement before and after biofilm growth for P.
aeruginosa biofilm grown at 40ºC.

41
Figure 19 displays the concentration of PYO recorded within the growth media by
electrochemical concentration analysis overlaid with the concentration of PYO recorded
within the growth media by spectroscopy analysis. The electrochemical measurements
were stopped after 24 hours of testing because the electrochemical probe fouled when
biofilm began to grow on the probe tip. In comparison to the spectrophotometer
concentration measurements, the electrochemical concentration measurements are
extreamly sporatic with a spike in the recorded concentration of PYO around 11 hours. The
trend seen in spectrophotometer measurements have been consisent over trials; therefore,
the electrochemical results should follow the same general pattern. The differences
between the spectrophotometer results and electrochemical results show error in
electrochemical measurements.
Figure 19. The concentration of PYO recorded within the growth media by
electrochemical concentration analysis overlaid with the concentration of PYO recorded
within the growth media by spectroscopy analysis. The electrochemical measurements are
only recorded to 20 hours because the working electrode fouled due to biofilm growth.

42
Errors in electrochemical measurements could stem from the interactions of the LB
growth media with the current recorded by the electrochemical probe. In the work by Koley
et al. [18] a diluted LB media was use to avoid the interference by the growth media. A
baseline shift in electrochemical measurements could also be occurring because of oxygen
trapped in the growth media at the time a measurement is taken compared to when the
standard curve was made. Oxygen can significantly alter electrochemical measurements;
therefore, a variable oxygen concentration in the growth media could alter the recorded
concentration of PYO in the growth media.

43
V. Conclusions and Future Work
From initial data collected, the newly developed apparatus allows for the
measurement of the interfacial rheological properties of biofilms while measuring the
concentration of redox molecules in the sub-phase. Preliminary experimentation using a
spectrophotometer showed that a correlation exists between the interfacial rheological
properties of P. aeruginosa biofilm and the concentration of PYO in the growth media. A
high-enough concentration of PYO in the growth media must be observed before the
interfacial moduli of the growth media begin to grow, indicating the formation of bacterial
biofilm.
Future work for this project will include additional trials including electrochemical
analysis of the PYO concentration in the growth media to determine the validity of the
trends already observed. If the biofilm produced by P. aeruginosa grows too thick in the
growth media for electrochemical concentration testing to be performed, similar
experiments can be run with biofilm producing bacterial strains such as E. coli, which only
grow biofilm on the interface of growth media. The use of an E. Coli strain could prevent
the fouling of the electrochemical probe during testing.
Other variations to this project include adding quorum-sensing interrupting
molecules or biofilm-formation inhibitors to the growth media to determine if these
additions reduce the mechanical strength of the biofilm or interrupt the production of PYO
in the growth media. Finally, this apparatus could also be used to measure the interfacial
shear properties of surfactants latent interfaces while changes are made to the sub-phase.

44
Works Cited
[1] G. W. Lau, D. J. Hassett, H. Ran, and F. Kong, “The role of pyocyanin in
Pseudomonas aeruginosa infection,” Trends in Molecular Medicine, vol. 10, no.
12, 2004.
[2] T. Rasamiravaka, Q. Labtani, P. Duez, and M. El Jaziri, “The Formation of
Biofilms by Pseudomonas aeruginosa : A Review of the Natural and Synthetic
Compounds Interfering with Control Mechanisms,” BioMed Research
International, vol. 2015, 2015.
[3] D. Davies, “Understanding biofilm resistance to antibacterial agents.,” Nat. Rev.
Drug Discovery, vol. 2, no. 2, pp. 114–22, 2003.
[4] B. W. Peterson, Y. He, Y. Ren, A. Zerdoum, M. R. Libera, P. K. Sharma, A. J. van
Winkelhoff, D. Neut, P. Stoodley, H. C. van der Mei, and H. J. Busscher,
“Viscoelasticity of biofilms and their recalcitrance to mechanical and chemical
challenges,” FEMS Microbiology Rev., vol. 39, no. 2, pp. 234–245, 2015.
[5] T. Romeo and M. D. Cooper, "Biofilm Development," in Bacterial Biofilms 2nd
ed. New York City, Springer, 2008, ch.1, pp. 4-7.
[6] A. S. Kimerling, W. E. Rochefort, and S. R. Bhatia, “Rheology of block
polyelectrolyte solutions and gels: A review,” Ind. Eng. Chem. Res., vol. 45, no.
21, pp. 6885–6889, 2006.
[7] M. Wang, H. H. Winter, and G. K. Auernhammer, “Time and frequency dependent
rheology of reactive silica gels,” J. Colloid Interface Sci., vol. 413, pp. 159–166,
2014.
[8] B. Warburton, “Interfacial rheology,” Curr. Opin. Colloid Interface Sci., vol. 1,
no. 4, pp. 481–486, 1996.
[9] T. Verwijlen, P. Moldenaers, and J. Vermant, “A fixture for interfacial dilatational
rheometry using a rotational rheometer,” European Physics Journals Special
Topics, vol. 97, pp. 83–97, 2013.
[10] S. Vandebril, A. Franck, G. G. Fuller, M. P, and J. Vermant, “DWR Interfacial
Rheology” Rheological Acta, vol. 49, no. 2, pp. 131–144, 2009.
[11] S. Fitzgibbon, E. S. G. Shaqfeh, G. G. Fuller, T. W. Walker, "Scaling analysis and
mathmatematical theory of the interfacial stress rheometer," Journal of
Rheology,vol. 58, no. 4, pp. 999-1038, 2014.
[12] A. Franck, T. A. Instruments, “Double Wall Ring Geometry to Measure Interfacial
Rheological Properties,” pp. 1–9.

45
[13] P. Erni, P. Fischer, E. J. Windhab, V. Kusnezov, H. Stettin, J. Läuger, P. Erni, P.
Fischer, and E. J. Windhab, “Stress- and strain-controlled measurements of
interfacial shear viscosity and viscoelasticity at liquid / liquid and gas / liquid
interfaces Stress- and strain-controlled measurements of interfacial shear viscosity
and viscoelasticity at liquid Õ liquid and gas Õ liquid interfaces,” API Review of
Scientific Instruments, vol. 74, no. 4916, 2013.
[14] L. Wang, H. Xie, X. Qiao, A. Go, T. Hodgkinson, X. Yuan, K. Sun, and G. G.
Fuller, “Interfacial Rheology of Natural Silk Fibroin at Air / Water and Oil / Water
Interfaces,” Langmuir, vol. 28, no. 1, pp. 459–467, 2012.
[15] C. Wu, J. Y. Lim, G. G. Fuller, and L. Cegelski, “Quantitative Analysis of
Amyloid-Integrated Biofilms Formed by Uropathogenic Escherichia coli at the
Air-Liquid Interface,” Biomedical and Pharmacological Journal, vol. 103, no. 3,
pp. 464–471, 2012.
[16] P. A. Rühs, L. Böcker, R. F. Inglis, and P. Fischer, “Colloids and Surfaces B :
Biointerfaces Studying bacterial hydrophobicity and biofilm formation at liquid –
liquid interfaces through interfacial rheology and pendant drop tensiometry,”
Colloids Surfaces B Biointerfaces, vol. 117, pp. 174–184, 2014.
[17] X. Liu, M. M. Ramsey, X. Chen, D. Koley, M. Whiteley, A. J. Bard, X. Liua, M.
M. Ramsey, X. Chena, D. Koleyar, M. Whiteley, and A. J. Bard, “Real-time of a
hydrogen mapping peroxide concentration across a polymicrobial bacterial profile
biofilm electrochemical using scanning microscopy,” Proceedings of the National
Academy of Sciences vol. 108, no.7 pp. 2668-2673 2010.
[18] D. Koley, M. M. Ramsey, A. J. Bard, M. Whiteley, and J. Bard, “All use subject to
JSTOR Terms and Conditions Discovery of a biofilm electrodine 3D metabolite
analysis using real-time,” Proceedings of the National Academy of Sciences, vol.
108, no. 50, pp. 19996–20001, 2011.
[19] J. L. Connell, J. Kim, J. B. Shear, A. J. Bard, and M. Whiteley, “Real-time
monitoring of quorum sensing in 3D-printed bacterial aggregates using scanning
electrochemical microscopy,” Proceedings of the National Academy of
Sciences,vol. 111, no. 51, pp. 18255–18260, 2014.
[20] K. J. Reszka, Y. O'Malley, M. L. McCormick “Oxidation of pyocyanin, a
cytotoxic product from Pseudomonas aeruginosa, by microperoxidase 11 and
hydrogen peroxide,” Free Radical Biology and Medicine, vol. 36, no. 11, pp.
1448–1459, 2004.

46
Appendix
Appendix A: Concentration Testing Standard Curves
Figure A1. A standard curve for the spectrophotometer absorbance of PYO in LB
media at 320 nm wavelength. The largest absorbance that can be accurately be measured
on the spectrophotometer used is 0.7; therefore, dilutions needed to be made at higher
concentrations.

47
Figure A2. A standard curve for electrochemical testing of PYO in LB growth
media for the probe used in this thesis. The peak current was determined from the peak at
-0.22 V. The non-zero y-intercept comes from baseline shifts on the high end of the
standard curve due to biological particulate in the growth media.

48