Embed Size (px)
Citation preview

iVNGINEERlNG LIBRARY, .VERSiTY OF ILLiNOiS
URBANA,1LLINOS
TECHNICAL REPORT S-78-15
GYRATORY SHEAR APPARATUSDESIGN, TESTING PROCEDURES, ANDTEST RESULTS ON UNDRAINED SAND
by
Arthur Casagrande and Franklin RendonPierce Hall
Harvard UniversityCambridge, Massachusetts 02138
Harvard Soil Mechanics Series No. 89
October 1978
Final Report
Approved For Public Release; Distribution Unlimited
n1
q q t,,«S (
7. ..- ,
6 1/
'ill' .. .zI 1*1 S~TI
Prepared for Office, Chief of Engineers, U. S. ArmyWashington, D. C. 20314
Under Contract No. DACW39-74-C-0026
Monitored by Geotechnical Laboratory
U. S. Army Engineer Waterways Experiment Station
P. O. Box 631, Vicksburg, Miss. 39180
rnetadc33957
l oo o 0
#,,>.. r r i .
.. . e;
' r' Yt.
r' ',
c %a
,
ns 3
,. .
/
.. . A. ._.
U
12 "'" ;
rL1 '.
ERWgy Go
' - ,3
3
Y
d n . Nordti
P.AO
c
vJ , r
V
a ,
' -

Destroy this report when no longer needed. Do not returnit to the originator.

UnclassifiedSECURITY CLASSIFICATION OF THIS PAGE (When Date Entered)
REPORT DOCUMENTATION PAGE READ INSTRUCTIONSBEFORE COMPLETING FORM
1. REPORT NUMBER 2. GOVT ACCESSION NO. 3. RECIPIENT'S CATALOG NUMBER
Technical. Report S-78-15
4. TITLE (and Subtitle) 5. TYPE OF REPORT & PERIOD COVERED
GYRATORY SHEAR APPARATUS; DESIGN, TESTING PROCE- Final reportDURES, AND TEST RESULTS ON UNDRAINED SAND
6. PERFORMING ORG. REPORT NUMBER
7. AUTHOR(s) B. CONTRACT OR GRANT NUMBER(s)
Arthur Casagrande Contract No. DACW39-714-C-0026Franklin Rendon
9. PERFORMING ORGANIZATION NAME AND ADDRESS 10. PROGRAM ELEMENT, PROJECT, TASKPierce Hall, Harvard University AREA& WORK UNIT NUMBERS
Cambridge, Mass. 02138 CWIS Work Unit 31145
11. CONTROLLING OFFICE NAME AND ADDRESS 12. REPORT DATE
Office, Chief of Engineers, U. S. Army October 1978Washington, D. C. 20314 13. NUMBEROF PAGES
99
14. MONITORING AGENCY NAME & ADDRESS(if different from Controlling Office) 15. SECURITY CLASS. (of this report)
U. S. Army Engineer Waterways Experiment StationGeotechnical Laboratory UnclassifiedP. 0. Box 631, Vicksburg, Miss. 39180 15a. DECLASSIFICATION/DOWNGRADING
SCHEDULE
16. DISTRIBUTION STATEMENT (of this Report)
Approved for public release; distribution unlimited.
17. DISTRIBUTION STATEMENT (of the abstract entered in Block 20, if different from Report)
18. SUPPLEMENTARY NOTES
This is No. 89 of the Harvard Soil Mechanics Series.
19. KEY WORDS (Continue on reverse side if necessary and identify by block number)Cyclic load testsGyratory testing machinesSandsUndrained shear tests
2C. ABSTRACT (Castius -e severs std Ft ne.ey amd identify by block number)
When a saturated mass of undrained sand in situ is subjected to cyclicloading, the stresses within any small element remain uniform, although chang-ing cyclically. However, in cyclic laboratory tests the stresses on rigidboundaries are nonuniform and their cumulative effect during cyclic loadingcauses progressive redistribution of water content and density within specimen.The purpose of this investigation was to measure such redistribution in sandsubjected to (1) cyclic simple shear (X) tests and (2) gyratory shear .
(Continued)
DD * 1473 EDITION OF 1 NOV 651S OBSOLETE Unclassified
SECURITY CLASStFICATION OF THIS PAGE (WPhen Data Entered)

Unclassified
SECURITY CLASSIFICATION OF THIS PAGE(When Data Entered)
20. ABSTRACT (Continued).
(Y) tests, using a gyratory apparatus designed to perform both types of tests.Negator springs mounted on a gyratory arm apply a constant horizontal forcewhich for X tests is transformed into a reciprocating shear force, and forY tests produces a constant, rotating shear force. The cylindrical test speci-men is enclosed in a rubber membrane, which is supported on the outside by aflat coil spring whose leaves are slightly separated at start of test. At endof test the specimen is frozen (permitting expanding water to discharge into aburette) and cut into 64 elements for determination of distribution of watercontent and relative density. The report includes (1) description of apparatusand appurtenant test equipment, with shop drawings, (2) description of testprocedures, (3) typical test results, and (4) discussion. Measured redistribu-tion of density shows clearly that loose and medium dense specimens are com-pacted in zones adjacent to the rigid top and bottom boundaries and are loosenedin zones along midplane and adjacent to membrane. With increasing number ofcycles, redistribution and softening in loose and medium-dense specimens con-tinue until steady-state deflections develop. In terms of relative density ofelements, redistribution can be expressed by standard deviation, which is from2.0 to 2.5 percent for specimens of all densities as placed, and which increasesto a maximum of about 10 percent for loose specimens when cycled to steady-statedisplacements. Significant cyclic softening also develops in dense specimens,although determination of redistribution by freezing and cutting is too crudefor measuring magnitude. When steady displacements are reached in X tests,each time the shear stress cycles through zero, the cyclic peak pore pressureincreases with a sharp peak almost equal to the effective vertical stress atstart of test. In Y tests, the pore pressure rises to a maximum that is abouttwo-thirds of effective vertical stress at start of test. When a specimensoftens during a cyclic test, the displacements change from a pattern which in-dicates that the sand responds with a constant shearing resistance to an en-tirely different pattern with an almost sudden and great drop in shearstrength followed by an equally sudden increase. This pattern reflects alter-nate development of liquefaction and dilation within one or more zones of speci-men. Urgently needed are more precise measurements of redistribution duringfirst stage of cyclic tests, while cyclic peak pore pressure rises to its maxi-mum. Necessary accuracy could probably be achieved with cyclic triaxial testsand by freezing and cutting specimens into horizontal slices.
Unclassified
SECURITY CLASSIFICATION OF THIS PAGE(When Data Entered)

THE CONTENTS OF THIS REPORT ARE NOT TO BE
USED FOR ADVERTISING, PUBLICATION, OR
PROMOTIONAL PURPOSES. CITATION OF TRADE
NAMES DOES NOT CONSTITUTE AN OFFICIAL EN-
DORSEMENT OR APPROVAL OF THE USE OF SUCH
COMMERCIAL PRODUCTS.
1

PREFACE
This investigation was conducted and this report was prepared by
Professor Arthur Casagrande and Mr. Franklin Rendon under Contract No.
DACW39-7)4-C-0026 as part of the ongoing work at the U. S. Army Engineer
Waterways Experiment Station (WES) under CWIS Work Unit 311+5, "Lique-
faction of Dams and Foundations During Earthquakes."
The study was initiated at the request of Mr. Ralph W. Beene, who
monitored the work for the Office, Chief of Engineers, U. S. Army. The
WES Contracting Officer's Representative was Dr. W. F. Marcuson, III,
Research Civil Engineer, Earthquake Engineering and Vibrations Division,
Geotechnical Laboratory (GL). General guidance and direction were pro-
vided by Mr. S. J. Johnson, Special Assistant (now retired), GL, and
Mr. J. P. Sale, Chief, GL.
Directors of the WES during this investigation were COL G. H. Hilt,
CE, and COL J. L. Cannon, CE. Technical Director was Mr. F. R. Brown.
ii

CONTENTS
Page
PREFACE. . . . . . . . . . . . . . . . . . . . . . . . . . . . . ii
LIST OF FIGURES . . . . . . . . . . . . . . . . . . . . . . . . . v
NOTATION . . . . . . . . . . . . . . . . . . . . . . . . . . . . vii
DEFINITIONS . . . . . . . . . . . . . . . . . . . . . . . . . . . xi
CHAPTER 1 INTRODUCTION . . . . . . . . . . . . . . . . . . . . . 1
1.1 Purpose and Scope . . . . . . . . . . . . . . . . . . . . 11.2 History of Gyratory Apparatus and of Investi-
gations Performed . . . . . . . . . . . . . . . . . . . . 11.3 Acknowledgments . . . . . . . . . . . . . . . . . . . . . 2
CHAPTER 2 MECHANICS AND PRINCIPAL FEATURES OF GYRATORYAPPARATUS FOR PERFORMING CYCLIC RECIPROCATING (X)TESTS AND GYRATORY (Y) TESTS . . . . . . . . . . . . .4
CHAPTER 3 ASSEMBLY OF APPARATUS, TEST PROCEDURES, AND USEOF APPURTENANT EQUIPMENT . . . . . . . . . . . . . . . 8
3.1 Apparatus Support Assembly and Gyratory Arm Assembly . . 83.2 Membrane and Slinky (Flat Coil Spring) . . . . . . . . . 83.3 Preparation of Test Specimen and Assembly of
Confining Elements . . . . . . . . . . . . . . . . . . . 83.4 Assembly of Apparatus . . . . . . . . . . . . . . . . . . 103.5 Saturation of Specimen . . . . . . . . . . . . . . . . . 113.6 Consolidation of Specimen Under Desired
Effective Stress . . . . . . . . . . . . . . . . . . . . 123.7 Application of Back Pressure . . . . . . . . . . . . . . 123.8 Application of Shear Force in X and Y Tests.... . . . 133.9 Recording Pore Pressures and Deflections. . ....... 143.10 Slippage in Transmission...... . . ....... 143.11 Freezing of Test Specimen . . . . . . . . . . . . . . . . 153.12 Disassembly of Equipment, Removal and Cutting of
Frozen Specimen, and Determination of Distributionof Water Content . . . . . . . . . . . . . . . . . . . . 16
CHAPTER 4 GENERAL INFORMATION ON TESTS PERFORMED ANDTYPICAL TEST RESULTS . . . . . . . . . . . . . . . . . 19
4.1 Description of Sand Used in Tests . . . . . . . . . . . . 194.2 Definitions of W, X, and Y Tests, and Number of
Tests Performed . . . . . . . . . . . . . . . . . . . . . 194.3 Distribution of Relative Density in W Tests . . . . . . . 204.4 Statistical Parameters for Analyzing Redistribution
of Relative Density in X and Y Tests . . . . . . . . . . 214.5 Review of Three Typical Reciprocating (X) Tests . . . . . 224.6 Review of Three Typical Gyratory (Y) Tests . . . . . . . 27
iii

Page
CHAPTER 5 THE MECHANICS OF PORE PRESSURE RESPONSE AND OFCYCLIC DISPLACEMENTS IN X AND Y TESTS.. ........ 30
5.1 General Comments on Liquefaction. ... . . ....... 305.2 Analysis of Typical Cycles Without and With
Liquefaction/Dilation Response inReciprocating (X) Tests........ . ... ..... 33
5.3 Analysis of Typical Cycles Without and WithLiquefaction/Dilation Response inGyratory (Y) Tests........ ... . .. ...... 39
5.4 Comparison of Response of Saturated Sand in
X and Y Tests. ........... . .. . . .. ... . 42
CHAPTER 6 DISCUSSION, CONCLUSIONS, AND RECOMMENDATIONS...... 44
6.1 Development, Capabilities, and Limitations of theGyratory Shear Apparatus....... . . ........ 44
6.2 Recommendation to Investigate Redistribution inCyclic Triaxial Tests....... ... . ........ 44
6.3 Discussion of Test Results. . .. . . . . ..... .45
REFERENCES ................. . ......... 50
APPENDIX A DETAILED DESCRIPTION OF GYRATORY APPARATUSAND SHOP DRAWINGS....... ... . ........ 83
A.1 Lateral Confinement of Specimen by Slinky (Flat CoilSpring) and Rubber Membrane . ........... 83
A.2 Slinky Guide Columns ........ .. ........ 84A.3 Base, Cap, and Valves....... ... . ........ 84A.4 Application of Vertical Load. .... . . ........ 85A.5 Equipment for Saturation and Application of
Back Pressure............. . . ....... 86A.6 Application of Horizontal Force . .......... 86A.7 Gyratory Sliding Plate and Gyratory Test
Starting Plate ........... . ......... 87A.8 Reciprocating Sliding Plate.... . ....... 88A.9 Measurement of Horizontal Displacements. . ........ 88A.10 Measurement of Vertical Displacements . ......... 90A.ll Pore Pressure Measurements...... . . ....... 90A.12 Auxiliary Devices for Placement and Compaction
of Specimens.............. . . ....... 91
iv

LIST OF FIGURES
No. Title
1 Mechanics of (a) reciprocating and (b) gyratory shear as applied toa perfectly elastic specimen
2 Operation of gyratory apparatus
3 Assembled gyratory shear apparatus with Negator springs attached togyratory arm and before removing centering screws
4 Front view and section of gyratory shear apparatus
5 Diagram of gyratory shear apparatus and appurtenant equipment, ex-cept items used for setting up a specimen and freezing it at end oftest
6 Specimen set up in apparatus, with slinky spreaders inserted andguide columns mounted
7 Standard deviation versus redistribution index for reciprocatingshear (X) tests
8 Standard deviation versus redistribution index for gyratory shear(Y) tests
9 Distribution of relative density in specimen as prepared (test W3)
10 Reciprocating test No. X13
11 Reciprocating test No. X22
12 Reciprocating test No. X12
13 Gyratory test No. Y21
14 Gyratory test No. Y25
15 Gyratory test No. Y18
16 Redistribution index versus relative density for reciprocating shear
(X) tests
17 X tests--shear strain versus relative density during steady state
18 Displacements and shear stresses during 12th cycle of reciprocatingtest X12
19 Pore pressures, shear stresses, and displacements during 21st cycleof reciprocating test X22
20 Mobilized shear stresses versus displacements during 21st cycle of
reciprocating text X22
21 Path of displacement vector d during 2nd to 6th cycles in gyra-
tory test Y25
22 Displacements during 10th cycle of gyratory test Y21
23 Path of displacement vector d during 10th cycle of gyratory testY21
V
No. Title
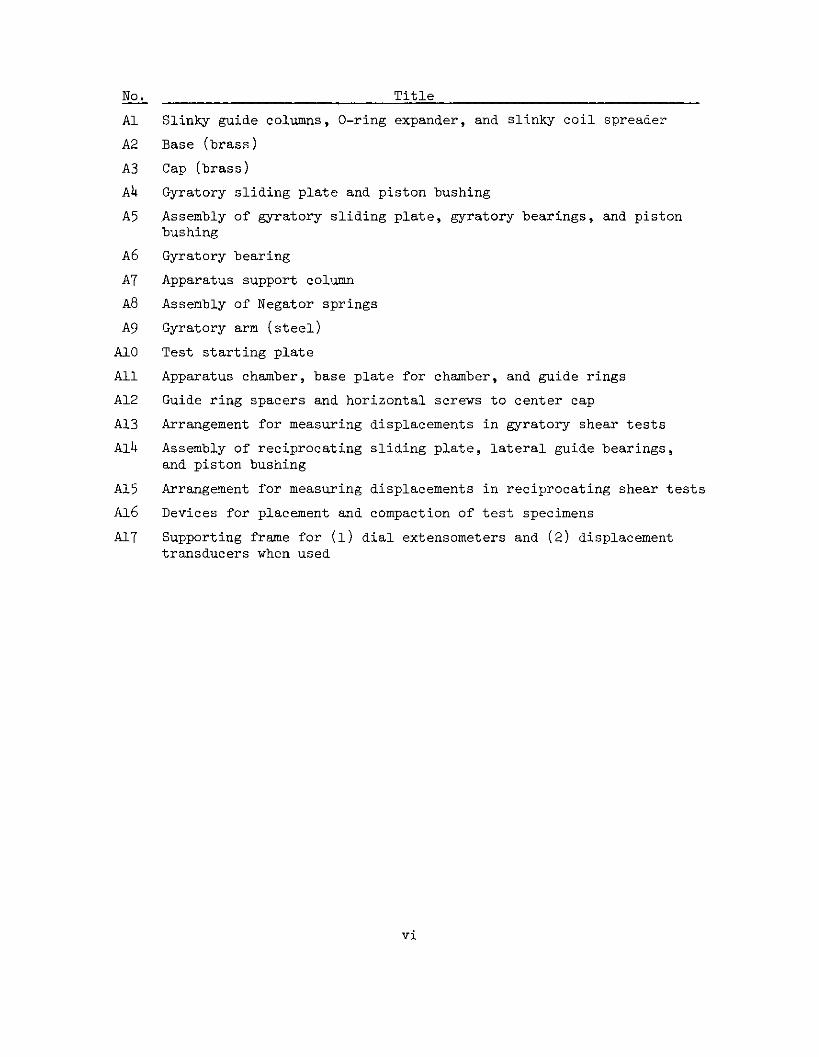
Al Slinky guide columns, 0-ring expander, and slinky coil spreader
A2 Base (brass)
A3 Cap (brass)
A4 Gyratory sliding plate and piston bushing
A5 Assembly of gyratory sliding plate, gyratory bearings, and pistonbushing
A6 Gyratory bearing
AT Apparatus support column
A8 Assembly of Negator springs
A9 Gyratory arm (steel)
A10 Test starting plate
All Apparatus chamber, base plate for chamber, and guide rings
A12 Guide ring spacers and horizontal screws to center cap
A13 Arrangement for measuring displacements in gyratory shear tests
A14 Assembly of reciprocating sliding plate, lateral guide bearings,and piston bushing
A15 Arrangement for measuring displacements in reciprocating shear tests
A16 Devices for placement and compaction of test specimens
All Supporting frame for (1) dial extensometers and (2) displacementtransducers when used
vi

NOTATION
a mm (For X tests) total amplitude of movement of top ofspecimen during one cycle = (d + d+)
d mm (For X tests) displacement of top of specimen
d+ mm (For X tests) extreme displacement of top of specimenin forward direction
dT mm (For X tests) extreme displacement of top of specimenin backward direction
d mm (For Y tests) displacement of top of specimen inplane of gyratory arm
d2 mm (For Y tests) displacement of top of specimen normalto gyratory arm
d mm (For Y tests) displacement vector of top of specimen =2 2d +d1 2
d mm (For Y tests) the greatest displacement vector in onemax cycle
dmin mm (For Y tests) the smallest displacement vector in onecycle
D percent Relative density = 100(e - e)/(e - e.)r max max min
D percent Relative density of entire specimen after consolida-rc tion under normal stress Q
c
Df percent Relative density of entire specimen at end of cycling,computed using wf
D'f percent Relative density of an element at end of cycling, com-puted using wf
e Void ratio
e Void ratio of specimen after consolidation under nor-c mal stress a
c
ef Void ratio of specimen at end of cycling, computed
using wf
e Void ratio in loosest statemax
vii

Void ratio in densest stateLn
f cps Frequency
e .ms
H
N
kg (For x tests) maximum shear force +P for
and a = 270 dega = 90 deg
u kg/cm2 Pore pressure induced in X and Y tests
2 2u kg/cm Back pressure = 1.0 kg/cm , applied afterc consolidation
w percent Water content
w percent Water content of entire specimen after consolidation
c under normal stress ac
w percent Water content of entire specimen at end of cycling,computed from w' of all elements
percent Computed water content of an element at end of
cycling = 1.09 w'Z
percent Measured water content of a frozen element (weighed
with accuracy of +0.001 g)
a deg (For X and Y tests) the angle which defines the direc-tion of the force P applied by the Negator springs,measured counterclockwise from the X-direction; see
Fig. 2(b) and 2(c). The fulcrum of rotation of thegyratory arm is fixed and its angle of rotation w
is recorded during a test. The fulcrum of rotation of
the direction of force P is the deflected center of
viii
mm Height of specimen after consolidation under normalstress a
c
n Number of frozen elements; normally n = 64
Number of cycles to end of test
Vs Number of cycles to start of steady pattern ofdisplacements
P kg Constant force applied by Negator springs
ss Specific gravity of sand
3 kg (For X tests) shear force P sin a , correspondingto angle of rotation a
T
C
Smax
w'Wf
w'z
C
.

deg
the top of the specimen and it is a function of wand the deflection. The deviation (a - w) ranges upto a maximum of 5 deg for the greatest deflections ob-served in this investigation, but for most tests itwas much smaller. For the purposes of investigation,it was found acceptable to use the known angle w inlieu of the unknown angle a which can be determinedonly by a cumbersome computation
(For Y tests) angle of displacement vector, measuredcounterclockwise, using w = 0 deg as reference
y percent (For X tests) shear strain computed with average of
extreme displacements during one cycle, i.e.,
100(d+ + dt)/2H = 100 a/2H
(For Y tests) shear strain during one cycle =100(d + d . )/2H
max mm c
y percent (For X and Y tests) shear strain during phase withsteady pattern of displacements
6 deg
A deg
(For X tests) lag angle, also called phase difference,defined as the angle which the arm has advanced after
passing through w = 0 deg or w = 180 deg , to themoment when the specimen deflects through the point
of zero displacement
(For Y tests) lag angle, defined as the difference(c - S) between the direction of the arm w and the
direction of the displacement vector S
p. percent (For X and Y tests) redistribution index = the differ-ence between the average relative density of the four
densest elements and the average relative density of
the four loosest elements, when the specimen is cut
into 64 elements
a percent Standard deviation of distribution of relative densitywhen the specimen is cut into 64 elements
6 kg/cm2
6 kg/cm2
af kg/cm2
T kg/cm2
Effective normal stress
Effective normal stress at end of consolidation
Effective normal stress at end of test
Average applied shear stress = shear force divided by
the area of specimen
ix

Tf kg/cm2
kg/cm2
kg/cm2
deg
deg
w deg
(For X tests) average shear stress at end of test
(For X tests) average shear stress mobilized inspecimen
(For X tests) the maximum average shear stress duringeach cycle
Effective friction angle of sand in a loose state
Friction angle mobilized in specimen
(For X and Y tests) the angle of rotation of the arm,measured counterclockwise from 0 to 360 deg, and usingfor each cycle w = 0 deg when the arm moves throughthe position at start of test, which is the X-direction, i.e., the direction to the left of theoperator as shown in Fig. 2(b) and (c)
x
Tm
Tmax

DEFINITIONS
Important discoveries or results of research almost inevitably pro-
duce a need for new terms and definitions. As further investigations
and experience lead to a clearer understanding of the phenomena in-
volved, one may find that some of the new terms and definitions are
deficient or misleading. Nevertheless, the new terminology may be so
well entrenched that there is a strong tendency to continue its use in
spite of the recognized shortcomings. To fill the need to convey more
correctly the new concepts and to protect readers from misunderstandings,
other terms are tried. Eventually, by compromise agreement, or by a
process of "survival of the fittest," more realistic definitions, terms,
and symbols evolve.
Such a sequence of developments has occurred since Seed and Lee
(Ref. 1) and Lee and Seed (Ref. 2) developed the cyclic triaxial test
for investigating the response of saturated sand to cyclic loading. In
these publications they began using the term "liquefaction" for the re-
sponse of the test specimen when the peak pore pressure rose momentarily
in each cycle to the confining pressure. To prevent confusion with the
prior use of the term liquefaction, the senior author initiated efforts
in 1969 that are briefly described by Gonzalo Castro in Refs. 3 and h;
and further efforts are discussed by H. B. Seed in Ref. 5 and by the
senior author in Ref. 6. Response to all these efforts convinced the
senior author that satisfactory clarity has not yet been achieved.
Therefore, he proposes to use in this report the following terms and
definitions:
Contractive response is the tendency of sand to decrease its volume and/or increase the pore pressure when subjected to an increase in shear
stress.
Dilative response is the tendency of sand to increase its volume and/ordecrease the pore pressure when subjected to an increase in shear
stress.
Note: The contractive and dilative responses are functions of the typeof sand, its relative density, its stress-strain history, and con-fining pressure, the stress ratio T/a , and the rate of straining.
Liquefaction is the transformation of the normal structure of loose
xi

sand into a "flow state" in which the grains are highly mobile andkeep turning in relation to their neighbors so as to maintain a mini-mum frictional resistance. In the flow state, the movement of a satu-
rated mass of sand resembles the flow of a liquid. Transformation
from the solid phase to the liquid phase is accompanied by a great in-crease in pore pressure and corresponding decrease in strength of thesand. Transformation into a flow state can be generated by a shock,by monotonic strain, or by cyclic loading and is maintained while themass is deforming or flowing. When deformation stops, the sand grainsrearrange themselves again into a normal structure of loose sand.
Note: In his paper presented at the 5th Panamerican Conference on SoilMechanics and Foundation Engineering in Buenos Aires, November 1975(Ref. 6), the senior author used the terms "flow structure," "actual
liquefaction," and "cyclic liquefaction," which led to misunderstand-ings by readers. Therefore, he decided to use instead in this paperthe terms "flow state," "liquefaction" (without an adjective, i.e., in
agreement with the meaning as originally used in literature), and
"cyclic straining," respectively.
Liquefaction-dilation (L/D) response is the alternate development ofliquefaction and dilation within one or more zones of a saturated sand
specimen subjected to an undrained cyclic test. When liquefaction
develops in zones of a reciprocating shear (X) test, two major L/D
responses are repeated in each cycle. However, when liquefaction de-
velops in a gyratory (Y) test, it usually consists of many L/D re-
sponses of small and varying magnitude within each cycle.
Cyclic straining is a general term to describe all types of responses ofa test specimen, or of an element of sand in situ, to cyclic loading.The L/D response is one type of cyclic straining.
Note: In laboratory tests, redistribution of water content and relativedensity causes an increase in pore pressure and cyclic straining as
compared with a homogeneous element in situ in which stress distribu-
tion during cyclic loading remains homogeneous. Currently, the magni-
tude of this increase is a highly controversial subject that urgentlyrequires major research efforts. The senior author believes that lab-
oratory tests as now used grossly overestimate the magnitude of in
situ straining of sands, except for very loose sands which have a po-
tential for liquefaction.
Steady pattern of displacements is that phase in a cyclic test during
which, for practical purposes, the pattern of displacements remainsreasonably steady. During that phase the pore pressure fluctuations
usually display also a reasonably steady pattern. (Note: In a fewcyclic shear tests a sufficient number of cycles were not applied to
develop a clearly defined steady pattern of displacements.)
W test is a test in which the distribution of water content and relative
density is determined on a test specimen as prepared for a cyclic
shear test, but not subjected to shear.
X test = reciprocating shear test is a type of simple shear test in
xii

which a reciprocating, sinusoidal shear force is applied by loadcontrol.
Y test = gyratory shear test is a type of simple shear test in which thetest specimen is subjected to a constant shear force which rotatesmonotonically.
xiii


GYRATORY SHEAR APPARATUS
DESIGN, TESTING PROCEDURES, AND
TEST RESULTS ON UNDRAINED SAND
CHAPTER 1
INTRODUCTION
1.1 Purpose and Scope
The purpose and scope of this report can be described by quoting
from Article 1 of Contract No. DACW39-74-C-0026 with the U. S. Army
Engineer Waterways Experiment Station (WES): "The Contractor shall
furnish....a report on an investigation of the utility of a gyratory
shear and reciprocating shear apparatus for liquefaction studies. The
report will include results and interpretation of tests and a sketch of
the apparatus sufficient such that the apparatus can be reproduced by
others."
1.2 History of Gyratory Apparatus and of Investigations Performed
In 1968, the senior author suggested to Gonzalo Castro to supple-
ment his doctoral research by a pilot investigation of the redistribu-
tion of the water content in sand specimens subjected to cyclic R
(consolidated-undrained) triaxial tests and then freezing the specimens.
These tests, which are included in Castro's dissertation (.Ref. 3),
demonstrated the importance of redistribution of the water content
within a test specimen subjected to cyclic loading. Later it occurred
to the senior author that redistribution might be studied better in
direct shear tests using wire-reinforced membranes of the type developed
by the Norwegian Geotechnical Institute. Then he realized that it
would not be practicable to cut such membranes after freezing the test
specimen in order to measure the redistribution of the water content.
Later it occurred to him to support a conventional rubber membrane
laterally by means of a flat coil spring of the type known as "slinky."
This feature was incorporated in the design of a "gyratory apparatus"
which permitted performance of "reciprocating direct shear" as well as
"gyratory shear" tests.
1

In the first model of the gyratory apparatus, which the senior
author designed with Castro's assistance, a polished steel sliding
plate moved between Teflon guide rings. A number of pilot tests, per-
formed by the junior author, showed that this sliding plate developed
excessive friction which is created chiefly by the overturning moment
of the shear force that is applied to the piston well above the eleva-
tion of the top of the specimen. To lower the plane of this force to
the level of the specimen cap would have required designing and building
a completely new and more complex apparatus. Harald D. Robinson, spe-
cialist in design and construction of scientific instruments, developed
a satisfactory solution by means of roller-supported sliding plates.
In this report are included the following topics:
(1) Brief description of gyratory apparatus for performing recip-rocating and gyratory shear tests.
(2) Test procedures.
(3) Typical test results.
(b) Discussion, conclusions, and recommendations.
(5) Shop drawings with detailed description of all parts of the
apparatus and of appurtenant equipment (in Appendix A).
The results of all tests performed with this apparatus will be in-
cluded in the junior author's doctoral thesis.
1.3 Acknowledgments
The early development of the gyratory apparatus was in part sup-
ported by the National Science Foundation Grant No. GK-2565 to Harvard
University titled "Research on Liquefaction of Sands." The senior
author's final report to the National Science Foundation, dated 9 June
1971, includes a summary of Gonzalo Castro's research by means of
triaxial tests and a description of the first design of the gyratory
apparatus.
Since 1971, contributions from the following sources have supported
the further developments of the gyratory apparatus and the performance
of tests:
The Harvard Soil Mechanics Research Fund
2

The U. S. Army Engineer Waterways Experiment Station,Contract No. DACW39-74-C-0026
The Institute of Engineering, National University of Mexico
In addition, the junior author was granted financial support from the
following sources:
Consejo Nacional de Ciencia y Tecnologia, MexicoOrganization of American StatesUniversidad Veracruzana, MexicoHarvard Soil Mechanics Research FundDireccion General de Asentamientos Humanos y Obras Publicas,
Gobierno del Estado de Veracruz, Mexico
Ingenious solutions of difficult problems we owe to Harald D.
Robinson. He designed and constructed the roller-supported sliding
plates and other improvements of the apparatus and also suggested
changes in the techniques of testing which increased the accuracy of
the results.
Charles C. Osgood assisted in the development of the technique for
determining the redistribution of water content by freezing specimens
and cutting them into elements.
The Institute of Engineering, National University of Mexico, tem-
porarily assigned Alberto Jaime-Paredes to assist the junior author in
the performance of tests. For a similar assignment, the WES temporarily
loaned Paul A. Gilbert to the Harvard Soil Mechanics Laboratory.
We are indebted to Stanley D. Wilson, Raul J. Marsal, and Gonzalo
Castro for valuable suggestions concerning the design of the gyratory
apparatus, the interpretation of the test results, and for comments on
the draft of this report.
3

CHAPTER 2
MECHANICS AND PRINCIPAL FEATURES OF GYRATORY APPARATUSFOR PERFORMING CYCLIC RECIPROCATING (X)
TESTS AND GYRATORY (Y) TESTS
To simplify explanation of the operation of the gyratory apparatus
for reciprocating (X) tests and for gyratory (Y) tests, the mechanism
of the motions is illustrated in Fig. 1 for tests performed on a per-
fectly elastic specimen for which the displacements are directly pro-
portional to the applied shear force. Negator springs which are
attached to a rotating arm, the gyratory arm, apply a constant radial
force P to a horizontal sliding plate. When the motion of this plate
is restricted by guide rollers to a forward and backward movement
(X test), the component of the rotating horizontal force of the Negator
springs in the direction of movement is a cyclic shear force applied to
the top of the specimen. This force varies sinusoidally between plus
and minus the rotating force P , as shown in Fig. 1(a). When the
sliding plate is free to move laterally in any direction (Y test), the
springs apply a constant shear force P , which rotates monotonically,
as shown in Fig. 1(b).
When testing a material that has internal friction, such as sand,
the deflection of the top of the specimen lags behind the applied shear
force. This lag is expressed for X tests by the lag angle 6 , also
designated the "phase difference," and for Y tests by the lag angle A .
These lag angles will be explained in Chapter 5.
A schematic drawing of the gyratory shear apparatus is shown in
Fig. 2. A photograph of the assembled apparatus is shown in Fig. 3,
and a drawing, to scale, in Fig. 4. Figures 2(a) and h show the
following:
(1) The test specimen is enclosed in a rubber membrane which issealed against cap and base with 0-rings and hose clamps.The membrane is retained by a flat-coil spring, the "slinky."Before the specimen is consolidated, the coils are separatedslightly by inserting "spreaders" (Fig. A-l, Appendix A),which are removed before a cyclic shear test is started toeliminate friction between the coils. A straight-sidedlateral deflection of the slinky is enforced by means of
4

three columns with universal joints at top and bottom, desig-nated the "slinky guide columns" (Fig. A-1).
(2) The base on which the specimen rests and the baseplate ofthe apparatus chamber are attached with screws to the appa-ratus support column (Fig. A-7).
(3) From the porous plate in the base, tubing leads to a valveblock which is attached to two burettes (Fig. 5). In thevalve block is mounted a pore pressure transducer.
(h) A second pore pressure transducer is installed in the cap,and a second tube leads from the porous plate in the cap tothe same valve block.
(5) The valve block and the two burettes (Fig. 5) are used beforethe test to saturate the specimen and after the test to per-mit drainage of water that is displaced while the specimenis being frozen from the bottom up.
(6) Two guide rings, mounted on top of the chamber, guide themovement of the sliding plate. Different sliding plates andbearings are used for gyratory and reciprocating shear tests.In Fig. h, only the gyratory sliding plate is shown.
(7) Through the piston, the vertical load is transmitted to thecap and the specimen. The piston moves through a ball bush-ing. To the piston bushing is attached the appropriate slid-ing plate.
(8) A constant horizontal force P is applied radially to thepiston bushing by means of a pair of Negator springs thatare attached to the gyratory arm and to a bearing that ro-tates around the piston bushing.
(9) The gyratory arm rotates around the apparatus support bymeans of a ball bearing. Rotation is effected by a variabletransmission and a belt which runs around a pulley below thebearing.
The motion of the gyratory sliding plate is illustrated in
Fig. 2(b). This plate moves between gyratory ball bearings. Hard
vinyl plastic balls are used in these bearings to prevent damage to the
sliding plate and the guide rings.
The motion of the reciprocating sliding plate is shown in Fig. 2(c).
This plate rolls between the upper and lower guide rings by means of
vertical guide bearings, and it is restrained laterally by lateral
guide bearings.
The vertical load is applied to the piston by means of a loading
yoke, a hanger, and dead weights, as shown in Fig. 5. A damping device
5

controls oscillations of the hanger.
Vertical displacements in X and Y tests are measured by a dial
extensometer between the upper beam of the loading yoke and the appa-
ratus support, as illustrated in Figs. 3 and 5.
For gyratory shear tests, two displacement transducers measure
horizontal displacements in two directions normal to each other
(Fig. 2(b)). Transducer No. 1 is mounted to the top of the gyratory
arm (Figs. 2(a) and 4), and transducer No. 2 is mounted on a bracket
that is attached to the top of the gyratory arm, advanced at a 90-deg
angle to the gyratory arm in direction of its rotation (Fig. A-13).
The probes of both transducers are screwed into a ball bearing that
rotates around the piston (Figs. 2(a), 3, and 4). The wires from both
transducers lead to spring contacts which in turn transfer the signals
to slip rings surrounding the support of the apparatus (Fig. 4), and
from there wires lead to the power supply and the recorder.
For reciprocating shear tests, the two displacement transducers
are removed from the gyratory arm and are mounted to measure horizontal
and vertical displacements, respectively, as follows: (1) between the
bearing on the piston and a fixed reference, to measure horizontal
displacements; (2) between the platform attached to the loading piston
(item No. 40 in Fig. 4; see also Fig. A-L) and the support of the
apparatus, to measure vertical displacements.
For calibration tests and for checking the performance of the
apparatus, silicone rubber specimens were prepared with the same dimen-
sions as the sand specimens. When such a rubber specimen is subjected
to a gyratory shear test, the direction of the deflection of the top of
the specimen coincides with the direction of the gyratory arm. However,
when sand specimens are tested, the direction of the deflection vector
lags behind the direction of the arm by the "lag angle A ," as shown
in Fig. 2(b).
This apparatus permits performance of tests within the following
ranges:
Dimensions of the Test Specimen: height = 2.7 to 3.2 cm;diameter = 6.8 cm
6

Allowable horizontal displacement: up to 1.3 cm for X tests; upto 1.5 cm for Y tests
Maximum applied normal stress: up to h.0 kg/sq cm
Back pressure: 1.0 kg/sq cm
Maximum developed pore pressure: up to 2.0 kg/sq cm
Maximum cyclic shear stress: up to 1.0 kg/sq cm
Frequency: 0.05 to 2.5 cycles/sec
A detailed description of the apparatus and all appurtenant equip-
ment, with shop drawings, is presented in Appendix A.
7

CHAPTER 3
ASSEMBLY OF APPARATUS, TEST PROCEDURES, AND USEOF APPURTENANT EQUIPMENT
The apparatus and appurtenant equipment required for performing
gyratory and reciprocating shear tests, excepting items used for set-
ting up a test specimen and freezing it at the end of the test, are
illustrated schematically in Fig. 5. They are briefly described in the
following account, in the order in which they are used in a test. (A
detailed description of the test procedures will be included in the
junior author's doctoral thesis.)
3.1 Apparatus Support Assembly and Gyratory Arm Assembly
Items 1 through 13, in Fig. 4, which form the apparatus support
assembly and the gyratory arm assembly, normally remain permanently
assembled and are carefully levelled on an appropriate supporting plat-
form. Items 1 through 4 form the apparatus support column (Fig. A-7).
3.2 Membrane and Slinky (Flat Coil Spring)
The membrane and slinky are assembled as follows:
(1) Slide the membrane over the base.
(2) With the help of an 0-ring expander, place two 0-rings overthe membrane around the base.
(3) Slide the slinky downward, to rest on the upper 0-ring ofthe base.
(4) Stretch the top of the membrane by gently pulling it with thefingers and fold it over the upper end of the slinky.
(5) Insert the three rigid columns (for the temporary support ofthe slinky) into the base column holders and then screw thesecolumn holders tightly to the base (Fig. A-1).
3.3 Preparation of Test Specimen and Assembly of Confining Elements
Dry sand for the test specimen is placed inside the membrane, in
layers with a thickness of about 3 mm, by means of a device called the
"sand placer." An essential part of this device is a rotating vane
which levels the surface and controls the thickness of each layer, as
described in Appendix A and illustrated in Fig. A-16. For relative
densities up to 75 percent, compaction is achieved by gentle tamping
8

with the sand placer; and for greater densities, a lightweight tamping
weight is dropped with controlled height of fall onto an anvil,
Fig. A-16, which is placed on the surface of each layer. To produce
uniform compaction throughout the specimen, the number of tamps.is
increased with each layer using an empirical relationship.
When it is desired to examine visually, and to photograph, the
distortions within a specimen, alternating layers of uncolored and
colored sand are used.
After the cap is placed on top of the test specimen, the membrane
is sealed to the cap by means of two 0-rings. Then the valve in the
cap is closed, and vacuum is applied through the base by opening valves
1, 4, 5, and 7 while valves 2, 3, and 6 remain closed, Fig. 5, to
effect connection through burette B-1 to the vacuum pump. The vacuum
imparts rigidity to the specimen and permits execution of the following
steps:
(1) Remove the three rigid columns. This requires loosening thescrews that attach the guide column holders to the base(which will be tightened again in step 6).
(2) Stretch the slinky slightly by raising its upper end, andthen measure with a vernier caliper (with jaws of sufficientlength) the diameter of the specimen at several levels be-tween the coils of the slinky.
(3) With the depth gage extension of a vernier caliper, measurecarefully the vertical distance from the edge of the cap tothe surface of the chamber baseplate (items 16 and 10 inFig. 4) at three locations approximately 120 deg apart. Theheight of the specimen is then computed by subtracting thethickness of the specimen base and cap (items 11 and 16 inFig. 4) from the average of the three measurements.
(4) Place the hose clamps over the 0-rings, tighten the hoseclamp over the 0-rings around the base, but only veryslightly around the cap. (Note: The hose clamp around thecap is not tightened, to allow vertical movement of the capduring the consolidation phase. Otherwise vertical loadwould be transmitted to the slinky during consolidation.)
(5) Insert the coil spreaders between the coils of the slinky,midway between the base column holders, to create the desiredseparation of the coils; see Fig. 6.
(6) Attach loosely to the cap an upper column holder, slip intothe holder a slinky guide column, and insert the column into
9

the base column holder. After all three slinky guide columnsare so placed, tighten the screws of the base column holdersto the base. (Note: At this stage do not tighten the topcolumn holders because it would cause a portion of the verti-
cal load to be transmitted to the slinky during consolidationof the specimen.) Figure 6 shows this stage of the assembly.
3.4 Assembly of Apparatus
To prevent disturbance to the specimen, the vacuum in the specimen
is maintained while the entire apparatus is assembled as follows:
(1) Screw the apparatus chamber, to which is attached the lowerguide ring, down onto its base plate (items 26 and 10 inFig. 4).
(2) Center the cap by means of the three horizontal centering
screws (Figs. 3 and A-12).
(3) Insert the loading piston into the cap (item 25 in Fig. 4).
(4) For a gyratory shear test, place the lower gyratory bearing
on the top flange of the chamber which serves as lower guidering (items 28 and 27 in Fig. 4). This step is eliminatedfor reciprocating shear tests.
(5) Gently lower the piston bushing, with the appropriate slid-ing plate attached, over the piston (items 31, 29, and 25in Fig. 4).
(6) For a gyratory shear test, place the upper gyratory bearingon top of the sliding plate (items 28 and 29a in Fig. 4).For a reciprocating shear test, attach the lateral guidebearings to the lower guide ring (Fig. A-14).
(7) Insert the appropriate spacer columns and then attach theupper guide ring (items 34 and 30 in Fig. 4).
(8) For a gyratory shear test, slide the "test starting plate"over the piston bushing in the Y-axis; then mount two lat-eral guide bearings to the left of the plate on the upperguide ring (Fig. A-10). (Note: These guide bearings areone pair of the four required for the reciprocating sliding
plates; Fig. A-14, Details A and B.)
(9) For a reciprocating shear test, place the spacer ring over
the bushing (items 33 and 31, Fig. 4).
(10) Attach the free ends of the Negator springs to the shearforce ball bearing and slide the ball bearing over thepiston bushing (items 36, 35, and 31 in Fig. 4).
(11) Slide the transducer ball bearing over the piston (items 39and 25 in Fig. 4).
(12) If vertical displacements are to be measured with a
10

displacement transducer, attach a small platform near thetop of the piston for the transducer probe to rest against(items 40 and 41 in Fig. 4). This transducer must bemounted after completion of the next step.
(13) Move the accurately counterweighted loading yoke over thepiston and center it. Then apply a 100-g seating load onthe yoke hanger. The bottom of the hanger is held sidewaysby springs which dampen lateral oscillations, as shown inFig. 5. (Comments: The large mass of this entire arrange-ment has the disadvantage that it requires the use of slowcycles to reduce the inertia forces to a tolerable magnitude.Tests have shown that for practical purposes, a period of10 sec per cycle reduces the inertia forces to a negligiblemagnitude. The magnitude of these inertia forces could besubstantially reduced by a rather complicated redesign ofthe loading arrangement.)
(14) Mount the instrument support frame, which is shown inFig. A-17, in the Y-axis direction to a fixed overhead beam.Center the stem of the vertical dial extensometer to restagainst the top of the upper loading yoke beam. If used,mount the vertical displacement transducer and adjust theprobe to rest against the platform attached to the top ofthe piston. For reciprocating shear tests, mount the hori-zontal displacement transducer on the instrument supportframe; then screw the end of the transducer probe into thetransducer ball bearing.
(15) For gyratory shear tests, attach the housing of the horizon-tal displacement transducer to the top of the gyratory arm;then screw the other end of the transducer probe into thetransducer ball bearing.
(16) Make initial readings of the vertical dial extensometer andof the horizontal and vertical (if used) displacementtransducers.
3.5 Saturation of Specimen (Fig. 5)
While the vacuum is maintained, the cap valve and valves 6 and 8
are opened. Then the source of de-aired water is connected by means of
hose H-2 to the top of burette B-2, with pinchcock P closed. Valve 3
is then opened to evacuate the burette and the hose to pinchcock P.
Valve 5 is then closed and pinchcock P is opened to permit de-aired
water to flow through the specimen and through burette B-1 and hose H-1
as far as the water trap that protects the vacuum pump. Flow is
continued until no more air bubbles are observed to rise in burette
B-l. Then valves 1 and 3 are closed, and hoses H-l and H-2 are
11

disconnected from both burettes. A 2-kg weight is applied to the
hanger to prevent lifting of the cap by accidental application of
excessive water pressure. Now valve 1 is opened to establish atmo-
spheric pressure within the specimen. This causes a slight expansion
of the specimen and thereby several cubic centimetres of water to flow
into the specimen from burette B-l.
3.6 Consolidation of Specimen Under Desired Effective Stress,(Fig. 5)
Before application of the vertical load, the water level in
burette B-1 (which is open to the atmosphere) is adjusted approximately
to the lower third point, as follows: If the level is too high, water
is drained by opening valve 2 slightly; if the level is too low, de-
aired water is allowed to flow into the burette by opening valves 3
and 5 slightly. Then the vertical load is applied to the hanger, in
several increments, to produce the desired effective stress a . Eachc
increment is allowed to rest for about 5 min, and then burette B-1 and
the vertical dial extensometer are read before the next increment is
applied.
3.7 Application of Back Pressure
The principal purpose of application of back pressure is to main-
tain a high degree of saturation during the cyclic shear test. In
addition, the back pressure permits checking the entire system for
leakage. According to Fig. 5, the following steps are used to check
for leakage and to apply the back pressure:
(1) Tighten the hose clamp over the 0-rings of the cap and screwthe upper guide column holders firmly to the cap.
(2) Close valves 1 and 6 and the valve in the cap.
(3) Connect tube T-1 to burette B-2.
(4) Open valve 3 to connect burette B-2 to the bottom of thespecimen.
(5) Adjust the air pressure regulator to increase the porepressure in increments of about O.lac , in 1-min intervals,until the pore pressure reaches about 0.9ac , as read ongage G-1. After each increment, read and record the readingon (a) the dial extensometer, (b) burette B-2, and (c) gageG-1.
12

(6) To reduce the pore pressure to atmospheric pressure, adjustthe air pressure regulator in decrements of similar magnitudeas the increments applied in step 5; and finally openvalve 10 to connect to the atmosphere. After each decrement,read and record the readings on (a) the dial extensometer,(b) burette B-2, and (c) gage G-1.
(7) Close valve 10 and then increase the pore pressure to thedesired back pressure uc in similar increments as in step 5.Read and record the readings on (a) the dial extensometer,(b) burette B-2, and (c) gage G-1.
(8) Increase the dead load on the hanger to achieve again thedesired effective stress ac . Read and record the readingson (a) the dial extensometer, (b) burette B-2, and (c) gageG-l.
3.8 Application of Shear Force in X and Y Tests
The steps in applying the shear force in X and Y tests are as
follows:
(1) Rotate the gyratory arm in the X-direction which is shown inFig. 2(c). Attach the Negator springs to the shear forceball bearing (item 35 in Fig. 4). For springs with a capacityof less than 10 kg, stretch the springs by hand and attachthe spool holder to the gyratory arm with the screws (Fig. 4).It is recommended that springs with a capacity greater than10 kg be stretched by means of the threaded rod and wing nutshown in Fig. A-9.
(2) Pull out the coil spreaders through the large windows of.thechamber and remove the horizontal centering screws (Fig. A-ll).
(3) Start the pore pressure and displacement recorders.
(4) Close valve 3 (Fig. 5) when the pressure transducer in thevalve block is used. However, when the pressure transducerin the cap is used, close the valve in the base. (Note: Thevalve in the cap was closed already when applying the backpressure.)
(5) For X tests, the starting position of the rotating arm is asin step 1 above. For Y tests, rotate the gyratory arm byhand.90 deg counterclockwise to the Y-direction, i.e., towardthe operator, as shown in Fig. 2(c), and remove the twolateral guide bearings. The gyratory plate will then be freeto move in any direction.
(6) Start the Zero-Max motor and engage the transmission suchthat the gyratory arm will move counterclockwise. (Note:The counterclockwise rotation was arbitrarily adopted andused for all X and Y tests.)
13

(7) Apply the desired number of cycles; then disengage theZero-Max transmission and stop the motor. An X test shouldbe stopped when the gyratory arm moves through the Y-direction,i.e., when the specimen has reached the maximum deflectionpointing toward the operator. (Note: If the test is stoppedin the moment of zero deflection, i.e., when the pore pressurepasses through its cyclic maximum, the liquefied zones ofthe specimen consolidate under their own weight and expelwater to the top surface of the specimen where, after freez-ing, it becomes incorporated in the top elements and causeserroneously high water contents and low relative densitiesof these elements.) A Y test should be stopped when the armhas moved beyond the Y-direction by about 45 deg.
3.9 Recording Pore Pressures and Deflections
For most tests one pore pressure transducer and one or two
displacement transducers were used for recording the response of the
specimen. For X tests, normally one 2-channel recorder was used to
record the output from the pore pressure transducer and from the hori-
zontal displacement transducer. For Y tests, two 2-channel recorders
were used: one for recording the output from the pore pressure trans-
ducer and from the displacement transducer that measured the displace-
ments in the plane of the arm; and one channel of the second recorder
for recording the output of the displacement transducer that measured
the displacement normal to the rotating arm. For further details,
see Appendix A. In addition to the output signals from the transducers,
a signal was transmitted into the markers of the recorders to mark the
time required for each rotation of the arm, i.e., the period. Because
the chart moves at a constant speed, one can readily determine from the
record the period for each cycle and the position of the gyratory arm
at any time.
3.10 Slippage in Transmission
After completion of the testing program it was discovered that the
speed of rotation of the arm gradually decreased during a test, for
some tests only very slightly and for others substantially. A review
of the test results disclosed that the increase in the period is caused
chiefly by inertia forces created during liquefaction-dilation (L/D)
responses of the specimen. Because the type of variable transmission
used in this investigation causes slippage when sudden changes in the
14

magnitude of forces are transmitted into the transmission, the worst
slippage developed in those tests in which the greatest L/D responses
developed. This is illustrated by a comparison of the following two
tests.
In reciprocating test X12 (Fig. 12) on a very dense specimen
(relative density of 90.9 percent), the magnitude of the horizontal
deflections and the inertia forces caused by L/D responses were small;
and there was practically no change in the period during 100 cycles.
In reciprocating test X13 (Fig. 10), on a loose specimen (relative
density of 39.8 percent), the large horizontal deflections that occurred
in each cycle almost suddenly and then were stopped almost suddenly by
dilatancy created inertia forces which caused a progressive and substan-
tial increase in the period from 8.5 sec in the 2nd cycle to. 12.0 sec
in the 7th cycle, i.e., an increase of about l0 percent in five cycles.
This comparison, as well as similar ones that can be made with
other tests, demonstrate that it would have been better to use a type
of transmission which ensures a constant period. Fortunately, even
such large variations as illustrated in the preceding test did not
affect the basic results and conclusions of this investigation.
3.11 Freezing of Test Specimen
Before the specimen is frozen, it is necessary to establish in
burette B-2 (Fig. 5) the same pressure as that in the specimen at the
end of the test, which is shown on the record of the pore pressure
transducer. Then the fluid lines from the cap and the base are con-
nected to the valve block and valves 6 and 7 are opened (Fig. 5).
An elbow-shaped standpipe is screwed into the side-outlet hole
of the apparatus chamber (Fig. A-ll), and adjusted such that its outlet
elevation is at the same level as the bottom of the sample. Then a
freezing mixture of ground dry ice and ethyl alcohol, with a tempera-
ture of about minus 700C, is poured into the apparatus chamber through
one of the large windows, and the chamber is filled to the level of
the bottom of the specimen. As freezing progresses from the bottom
to the top of the specimen, the volume expansion of the freezing water
causes upward flow of pore water through the still unfrozen portion of
15

the test specimen. The expelled water raises the water level in
burette B-2 (Fig. 5) where it is measured. The time for freezing the
specimen averages 25 min. Freezing and upward flow of water progress
so slowly that the structure of the sand remains undisturbed. (Note:
By experimentation, a layout of drainage grooves in the cap was devel-
oped which ensures that no displaced water will be blocked prematurely
by freezing the outlet from the cap to the burette, Fig. A-3.) When
the theoretical volume of water that should flow into the burette
when freezing the water in base + specimen + cap was compared (i.e.,
the approximately nine percent increase in the total volume of water
upon freezing) with the volume of water as measured in the burette, good
agreement was found. For specimens that have not been subjected to cy-
c'ic shear, the agreement is within less than plus/minus 1 percent of
the expelled volume of water, or plus/minus 0.1 percent of the total
volume of water. When this comparison is made after cyclic shear tests,
the two quantities will agree within plus/minus 3 percent of the
expelled volume of water or less than plus/minus of 0.3 percent of the
total volume of water.
3.12 Disassembly of Equipment, Removal and Cutting of Frozen Specimen,
and Determination of Distribution of Water Content
Dismount the equipment in the following order: (1) Negator
springs from gyratory arm; (2) load from hanger; (3) displacement trans-
ducers; (4) dial extensometer; (5) loading yoke; (6) drain freezing
mixture from chamber through the hole in the sidewall of the chamber
by turning the standpipe downward; (7) upper guide ring, sliding plate,
and chamber; (8) guide columns, hose clamps, and cap 0-rings.
Removal and cutting of the frozen specimen is then carried out as
follows:
(1) Loosen slinky from membrane by slightly twisting top ofslinky clockwise.
(2) Cut membrane along edges of cap and base, i.e., along the topand the bottom of the specimen.
(3) With a screwdriver through the coils of the slinky, wedgeapart cap and base from specimen using very light blows witha hammer.

(4) Remove cap and slinky.
(5) Immediately place frozen specimen in a plastic sandwich bagand close it with a twist-tie; then place into a second sand-wich bag and close again with a twist-tie; and finally placeinto a precooled aluminum can which is immediately trans-ferred into a Styrofoam container, together with a smallamount of dry ice to maintain the specimen in a frozen state.
Two men working together can perform steps 1 through 5 in less
than 30 sec.
For determining the water content distribution, the specimen was
usually cut into 64 elements, in the following sequence: (a) the five
vertical slices in the direction of the deflection of the specimen;
(b) the four outside slices into four parallel columns each (the middle
slice being used for examining and photographing the distortions); and
finally (c) each column into four elements horizontally.
The cutting operations were performed inside a cabinet constructed
of transparent plastic sides and top. The cabinet is 40 cm high and
has 40 by 100-cm horizontal dimensions. One of the sidewalls has two
openings to which are attached two rubber sleeves that permit the
operator to work with his hands inside the cabinet. On the opposite
sidewall there is a flap door, normally sealed with masking tape,
through which a second operator can quickly place or remove a tray with
small aluminum cans for water content determinations. The cabinet is
placed over a jigsaw which stands on a table, with the jigsaw on one
side of the cabinet. A block of dry ice is placed on a platform that
hangs 10 cm below the ceiling in the middle of the cabinet. Below the
block of dry ice, an aluminum tray with calcium chloride rests directly
on the table and maintains low humidity to prevent condensation of
water vapor on the surfaces of the frozen elements. The bottom edges
of the cabinet are sealed to the table with masking tape.
When cutting and handling the frozen elements, the operator must
wear vinyl gloves. The elements are placed in aluminum cans with
covers and then on an aluminum tray which rests on the table inside the
cabinet opposite to the jigsaw. While a vertical slice is cut into
elements, the remaining slices should be kept sealed in plastic bags
17

and placed in the Styrofoam container. After a slice is cut into its
16 elements, the tray is removed by the second operator and both opera-
tors weigh the cans as fast as possible on two analytical balances with
digital readout, with an accuracy of + 0.001 g. It required not more
than 2 min to cut one slice into its 16 elements, and about 6 min
for both operators to weigh the 16 aluminum cans.
From the measured water content of an element, w' , the waterZ
content that existed in this element before freezing, wj , is computed
as follows: w' = 1.09w' . This water content w' is then used tof zfcompute the relative density of the element before freezing as follows:
e -s w'-_max s f
D100rf e - e .
max min
Careful attention to all details and speed of operations were
found necessary in order to keep condensation of water on the surfaces
of the frozen elements within a tolerable magnitude. Before this
technique was fully developed, and particularly during summer months
when the indoor humidity was high, condensation caused the computed
total water content of a test specimen after freezing to be up to
two percent greater than the actual water content of the specimen.
However, such a testing error affects all elements approximately to the
same degree and, therefore, does not affect the magnitude of the
redistribution of the water content or relative density which is pro-
duced within the specimen in reciprocating and gyratory tests.

CHAPTER 4
GENERAL INFORMATION ON TESTS PERFORMED ANDTYPICAL TEST RESULTS
Note: A detailed presentation of all tests performed and their
analysis will be included in the junior author's doctoral thesis.
4.1 Description of Sand Used in Tests
Sand with the trade name "Banding Sand," obtained from the Ottawa
Silica Co., Ottawa, Illinois, was used in this investigation. Although
it is the same type of sand that Gonzalo Castro (Ref. 3) used in his
doctoral research, the shipment received for this investigation was
slightly coarser. It is a uniform, clean, fine quartz sand with sub-
rounded to subangular grains, a specific gravity of 2.65, D60 = 0.24 mm ,
D10 = 0.140 mm , and a coefficient of uniformity of 1.7. On the basis
of a number of measurements of the loosest and densest states, the fol-
lowing void ratios were adopted for computing all relative densities in
this investigation: e = 0.821 ; e . = 0.487 .max min
4.2 Definitions of W, X, and Y Tests, and Number of Tests Performed
The distribution of water content and relative density in test
specimens was investigated in three types of tests:
(1) W test. The specimen is placed at a desired relative density,saturated, and consolidated under a desired effective normal
stress; then it is frozen and the water content and relative
density distributions are determined to establish the patternof typical distribution that can be expected in test specimens
as prepared. Five W tests were performed.
(2) X test. The specimen is placed at a desired relative density,saturated, consolidated under a desired effective normal
stress, and then subjected to a reciprocating (X) test using adesired shear stress. The specimen is then frozen, and the
distribution of water content and relative density is deter-
mined. Thirty-five X tests were performed.
(3) Y test. The specimen is placed at a desired relative density,
saturated, consolidated under a desired effective normalstress, and then subjected to a gyratory (Y) test using a de-
sired shear stress. The specimen is then frozen, and the dis-tribution of water content and relative density is determined.
Twenty-six Y tests were performed.
.19

)4.3 Distribution of Relative Density in W Tests
Typical results of the distribution of the relative density of a
specimen as placed and consolidated, but not subjected to cyclic shear,
are summarized in Fig. 9. The average water content of the specimen be-
fore freezing was w = 23.3 percent and at the end of the test (after
correction for water expelled by freezing) wf = 23.3 percent . (Note:
This was one of the rare tests in which the two water contents agreed
perfectly.) The water contents w' of the 64 individual elements, i.e.,
computed for the state before freezing, ranged between 22.6 percent and
23.9 percent, and the corresponding relative densities ranged from 66.5
percent to 56.3 percent. The 1.3 percent maximum difference in the
water contents of the elements is chiefly due to the range of testing
errors in measuring the water contents of such small elements which are
subjected to different lengths of time of exposure to absorption of
moisture by condensation while being cut in the cabinet. Only a portion
of the measured range is caused by variation in the density of the speci-
men as placed. It should be emphasized that the small range of 1.3 per-
cent in water content corresponds to the large 10.2 percent range in
terms of relative density. The histogram of the relative densities of
the 64 elements of the specimen in Fig. 9 has the shape of a normal dis-
tribution. A total of five W tests, performed over a range of relative
densities between 48 percent and 90 percent, yielded similar histograms.
Note: To assist in visualizing deviations from a uniform distribu-
tion of relative density in the distribution diagrams of the vertical
slices, in Figs. 9-15, zones with a range of relative density less than
plus/minus five percent from the average relative density Drf , as de-
termined at the end of the test, are shown by dotted areas; zones with
lower relative densities by blank areas; and zones with greater relative
densities by hatched areas. The range of plus/minus five percent from
the average relative density is the "normal" range of variation found
in specimens as prepared. Therefore, any substantial deviation from
such range, caused by redistribution of water content during testing,
can be brought out more clearly in the distribution diagrams of the
vertical slices.
20

4.4 Statistical Parameters for Analyzing Redistribution of RelativeDensity in X and Y Tests
During X and Y tests on loose to medium-dense specimens, the water
content and relative density develop substantial redistribution, as can
be seen by comparing the histograms of X and Y tests in Figs. 10, 11,
13, and 14 with the histogram in Fig. 9 for a specimen as placed but
not subjected to shear. For dense test specimens, Figs. 12 and 15, the
redistribution is small. To investigate the variables that affect re-
distribution and the deviations from normal distribution, two statisti-
cal parameters were used: (1) the standard deviation of relative den-
sity, a percent ; and (2) the "redistribution index," p. percent ,
which the senior author defined for the purpose of this investigation as
the difference between the average relative densities of the four
densest elements and of the four loosest elements, when the specimen is
cut into 64 elements. In contrast to the standard deviation, this re-
distribution index is quickly computed. For a normal distribution curve,
the relationship between these two parameters for 64 equal elements can
be computed and is p. = 3.914a , or approximately p. = 4a . This rela-
tionship was computed by the following formula for the distance z ofc
the center of gravity of a tail-end area of a normal distribution area
from the center line:
z =--c At
where
y = ordinate at point where the tail-end area starts
A = tail-end area, one side only, expressed as dimensionlessfraction of total area
(Note: This formula is valid only in conjunction with the normal dis-
tribution curve for which the pertinent (dimensionless) quantities can
be found in books on statistics, e.g., Tables A-3 and A-4 in Ref. 7.)
The ratio of both tail-end areas to the total area of normal distribu-
tion is zA = (1-A) = 8/64 = 0.125 . For this value the corresponding
coordinates z = 1.533 and y = 0.123 were obtained by plotting
21

pertinent points from above-referenced tables. Hence, zc= 0.123/
0.0625 = 1.97 and p. = 2z = 3.94a . This relationship between the
standard deviation a and the redistribution index p. for normal dis-
tribution is plotted in Figs. 7 and 8 as a full-drawn line. In Fig. 7
is also plotted a dashed line which is the relationship p. = 3.23a for
rectangular distribution of 64 equal elements that may be considered to
represent an extreme case of "thickening" of the ends as compared with
normal distribution.
4.5 Review of Three Typical Reciprocating (X) Tests
The results of three typical X tests on a loose, a medium-dense,
and a dense specimen are summarized in Figs. 10, 11 and 12, respectively.
In the upper left of these figures are reproduced the pore pressure
transducer and the horizontal displacement transducer records; and in
the lower left is shown the distribution of relative density in the 64
elements obtained after the test. In the upper right is shown the dis-
tribution histogram; and in the lower right are summarized all pertinent
quantities: (1) at start of test, (2) at end of test, and (3) after
freezing.
It can be seen in Figs. 10(a), 11(a) and 12(a) that the pore pres-
sures increase cyclically until they reach a maximum cyclic peak, and
that then a fairly steady pattern continues during all additional cycles.
Whenever the top of the specimen moves through zero displacement during
the steady pattern, the pore pressure rises momentarily to its cyclic
peak, which is almost equal to the confining pressure, and it drops to
a cyclic minimum when the displacements are at their cyclic maximum.
The pattern of pore pressures and displacements indicates that even in
the loose specimen X13, Fig. 10(a), a dilative response developed within
portions of the specimen. The denser the specimen, the greater is the
number of cycles required to reach the maximum peak pore pressure and
the steady pattern of pore pressure response.
The distribution diagrams in Figs. 10(b) and 11(b) show typical
patterns of compaction in zones adjacent to the cap and the base, i.e.,
adjacent to those boundaries where confining friction forces develop,
but volume expansion in the vertical end slices A and D and also
22

within a horizontal zone in the middle of the specimen, i.e., in the
zones that are left blank in these plots. However, the dense specimen,
Fig. 12(b), developed practically no redistribution of relative density.
There seems little doubt that some redistribution is also responsible
for the softening of dense specimens, but that the zones in which the
water content has increased are too narrow to permit clear definition
by measuring the water contents of relatively large elements. It is
not difficult to visualize the geometry of narrow zones of loosened sand
through the midplane and along the cylindrical surface, which can impart
to the specimen the observed mobility, while major zones of densified
sand adjacent to the top and bottom of the specimen remain practically
immobile during cycling when a steady pattern of deflections has
developed.
The displacements of the top of the specimen increase much more
slowly than the pore pressures, and they reach a steady pattern after a
much greater number of cycles than the pore pressures. Figures 11(a)
and 12(a) show that in medium-dense and dense specimens the cyclic dis-
placements start with a sinusoidal shape which gradually changes into a
rectangular pattern. However, Fig. 10(a) shows that in a loose specimen
a rectangular shape of cyclic displacements develops already during the
second half of the first cycle and before the maximum peak pore pressure
has developed. The sinusoidal cyclic displacements indicate that normal
frictional resistance is mobilized within the entire specimen. The
parallel sides of rectangular cyclic displacements indicate sudden dis-
placements caused by liquefaction in portions of the specimen followed
by dilation. The liquefaction-dilation response will be further dis-
cussed in Chapter 5.
The actual pattern of density distribution in loose and medium-
dense specimens, after a steady pattern of deflections has developed,
is probably not constant but is in a state of flux. Even within the
same cycle one would probably observe large variations in the shape of
the loosened zones in which liquefaction-dilation responses develop, if
it were possible to observe continuously the density distribution.
However, the shape of the compacted zones probably changes little,
23

although they may undergo slight additional compaction.
The histograms in Figs. 10(c), 11(c) and 12(c) are distinctly dif-
ferent. The histogram for the loose specimen, Fig. 10(c), shows a very
wide and unsymmetrical redistribution of relative density; for the
medium-dense specimen, Fig. 11(c), also an unsymmetrical but somewhat
narrower redistribution; and for the dense specimen, Fig. 12(c), almost
the same as for the W tests, i.e., for specimens as prepared but not
sheared.
To facilitate comparison of the results of these three X tests,
the following tabulation summarizes: (1) the average water content at
start of test, (2) the average water content at end of test computed
from the frozen elements, (3) the corresponding relative densities, and
(4) the redistribution parameters a and p.
Fig. and Test Numbers Fig. 10-X13 Fig. 11-X22 Fig. 12-X12
Description of Density loose medium-dense dense
Average Water at start of test 26.0 23.7 19.5Content, % at end of test 26.7* 24.0 19.8
Average Rela- at start of test 39.8 58.1 90.9tive Density, % at end of test 33.7 55.3 88.9
Standard Deviation, a% 9.8 8.5 2.6
Redistribution Index, p.% 35.2 31.0 10.8
* In test X13, the ambient humidity was not properly controlled whenthe frozen specimen was cut into elements. This caused the excessive,apparent increase of the water content from 26.0% to 26.7% and the
corresponding decrease in relative density from 39.8% to 33.7%.
In Fig. 7 are plotted all X
same shear stress ratio T /amax c
frequency f , as listed in that
with pi < 26 percent lie close
3.9)4a . However, the tests with
that line.
tests which were performed with the
and with approximately equal cyclic
figure. It can be seen that all tests
to the normal distribution line p. =
p. > 26 percent stray chiefly above
24

By comparing in Fig. 7 the tests performed at approximately the
same relative density, one can see that the redistribution index in-
creases with increasing number of cycles. However, above a certain num-
ber of cycles, when the pattern of displacements becomes steady, further
increase in redistribution seems to be only slight. For example,
points 8 and 13 in Fig. 7 are tests on specimens with relative densi-
ties of 39 percent and 40 percent, respectively; the first one with 2
cycles resulted in p. = li4 percent , and the second test with 7 cycles
produced p. = 35 percent . When comparing points 12 and 19, which are
tests on very dense specimens, we see that point 12, with 100 cycles,
resulted in only p. = 11 percent , i.e., still within the range of sam-
ples as placed but not subjected to shear, and point 19, with 200 cycles,
produced p. = 19 percent .
The normal distribution curves, which are plotted in the left upper
diagram in Fig. 7, convey a visual picture of the range of redistribu-
tion that developed in these tests for: (1) the standard deviation,
a = 2 percent , which corresponds to the lower limit of distribution of
samples as placed; and (2) the upper limit of redistribution, a = 10
percent , which was observed in this investigation. However, as already
stated, the actual shapes of redistribution may deviate considerably
from the shape of normal distribution; and this is reflected in Fig. 7
by tests located above the normal distribution line.
From Fig. 7, it is concluded that either of the two parameters a
and p. would be sufficient to indicate the magnitude of redistribution,
but with p. being much simpler to compute. Neither parameter alone
will indicate whether and to what extent the distribution deviates from
normal distribution. However, this information is reflected by using
both parameters a and p. and plotting the results, as in Fig. 7,
and more clearly by the histograms.
The results of all X tests which were performed with test parame-
ters other than those listed in Fig. 7, if plotted in this figure, would
show the same pattern in relation to the normal distribution line as the
points actually plotted.
A plot of redistribution index p. versus relative density, Fig. 16,
25

permits identifying the role of the number of cycles as a variable. In
Fig. 16, the number next to each point is the number of cycles at the
end of the test, N . The open circles are tests which were not car-
ried to a steady pattern of strains, whereas the N values for the
full circles were large enough to clearly define the number of cycles
Ns when a steady pattern of displacements started. In this plot, Ns
values are combined for groups of tests by encircled ranges; and from
this can be concluded that after a steady pattern of displacements is
reached, additional cycles do not cause a further increase in redistri-
bution. Also shown in Fig. 16, by two horizontal dashed lines, is the
range of distribution of "specimens as prepared," i.e., the inevitable
deviation from perfect uniformity, which in part is due to the method of
placement but probably chiefly due to errors produced by condensation of
water on the surfaces of the frozen elements. With allowance for scat-
ter of results, the full-drawn Ns line represents approximately the
relationship between p. and D when a steady pattern of displace-1 rc
ments is reached.
In Fig. 17 are plotted the shear strains during the steady pattern
of displacements or at end of test, as function of the relative density
and number of cycles. For the purpose of this investigation, shear
strain y in X tests is defined as one half of the total amplitude of
maximum displacements in one cycle divided by the thickness of the speci-
men, expressed in percent.
By combining the information in Figs. 16 and 17, it is possible to
summarize for X tests the relationsips between the variables affecting
redistribution when a steady pattern of displacements is reached, by the
following averages:
No. of Cycles toRelative Density Reach Steady Pattern RedistributionAfter Consolidation of Displacements Index Shear Strain
D N p. yrc s s
percent percent percent
50 10 35 4070 30 26 2590 50 15 9
26

4.6 Review of Three Typical Gyratory (Y) Tests
The results of three typical Y tests on a medium-loose, a medium-
dense, and a dense specimen are summarized in Figs. 13, 14, and 15,
respectively.
From a comparison of all X and Y tests performed, it is concluded
that the pore pressure response in the Y tests shows two significant
differences from those observed in X tests:
(1) In Y tests, the pore pressure rises to its maximum peak on anaverage in one-third the number of cycles -required in X tests.
(2) After the pore pressure cycles reach a steady pattern, thepeak pore pressures in Y tests are only about two-thirdsthe initial effective normal stress, and they fluctuate muchless than in X tests. Also, in contrast to X tests, the porepressures in Y tests never approach, even momentarily, theinitial effective confining pressure. In fact, the greatestpore pressures in Y tests do not rise higher than the minimumcyclic pore pressures during the phase of steady displacementsin X tests.
In spite of such radical differences in pore pressure response,
the redistribution of the water content and of the corresponding rela-
tive density in Y tests is fairly similar to that observed in the X
tests. In the medium-loose and in the medium-dense specimens,
Figs. 13(b) and 14(b), we observe compaction of the sand adjacent to
the upper and lower specimen boundaries.
The direction of the maximum horizontal displacement, i.e., the
displacement vector, which is measured with two displacement transducers
mounted at right angles to each other (Fig. 2(b) and Fig. A-13), lags
substantially behind the direction of the applied shear force. This
phenomenon will be reviewed in detail in Chapter 5. (Note: For future
tests, it is suggested to move the transducer which is mounted at right
angle to the gyratory arm (Fig. A-13) onto the opposite side of the arm
so that both transducers will register outward deflections.)
To facilitate comparison of the results of these three Y tests, the
following tabulation lists: (1) the average water content at start of
test, (2) the average water content at end of test computed from the
27

frozen elements, (3) the corresponding relative densities, and (4) the
redistribution parameters c and p. .
Fig. and Test Numbers Fig. 13-Y21 Fig. 14-Y25 Fig. 15-Y18
Description of Density medium-loose medium-dense dense
Average Water at start of test 24.7 23.3 19.8Content, % at end of test 25.0 23.5 20.1
Average Rela- at start of test 50.1 61.7 88.6tive Density, % at end of test 47.4 59.2 86.1
Standard Deviation, a% 7.7 6.2 3.6
Redistribution Index, p.% 28.4 27.0 12.6
In Fig. 8 are plotted all Y tests which were performed with the
same stress ratio T/QC and with approximately equal cyclic frequencyc
f , as listed in that figure. The full-drawn line is again the rela-
tionship p. = 3.94a for normal distribution. As can be seen, this
line represents a good average line of all tests plotted in this graph.
Computation of a linear regression, with the restraint requirement that
the line should pass through the origin, yielded p. = 3.87a , i.e., a
line very close to the line of normal distributions. For p. values up
to about 25 percent, we see again that the test results lie close to
the normal distribution line. The test results for greater redistribu-
tions scatter more widely about that line.
By comparing the results of tests for approximately equal relative
densities, but with different number of cycles, one can see that the
redistribution increases with increasing number of cycles. For example,
points 5, 17, 3, and 10 are for tests with Drc = 61 percent ; and for
1, 8, 11, and 14 cycles, respectively, for these four tests, with in-
creasing number of cycles, p. increases from 14 percent to 26 percent.
For the tests on dense specimens, points 19, 18, and 1, with 10,
25, and 100 cycles, respectively, p. increases from about 10 percent
to 21 percent.
The results of two additional Y tests, but with other test
28

parameters than those listed in Fig. 8, are located practically on the
normal distribution line.
For the Y tests, a plot of p. versus D shows a trend similar1 rc
to the X tests in Fig. 16, although not so well defined because of the
smaller number of Y tests performed.
29

CHAPTER 5
THE MECHANICS OF PORE PRESSURE RESPONSE AND OFCYCLIC DISPLACEMENTS IN X AND Y TESTS
5.1 General Comments on Liquefaction
In this report, the term "liquefaction" is used to define the
phenomenon that occurs when the structure of loose, saturated sand is
transformed into a "flow state" in which the grains keep turning in
relation to their neighbors so as to maintain a minimum frictional
resistance. In the flow state, sand has not the characteristics of a
solid, but its movement resembles the flow of a liquid. From Castro's
investigations (Ref. 3), it is concluded that a high rate of straining
facilitates development of a flow state. When the rate of straining is
reduced below a critical value, the sand grains lose the ability to
maintain themselves in the flow state, friction builds up, the sand
mass reverts to a normal structure of loose sand, and the conflict
between the grains creates dilatancy.
The transformation from a solid structure to the flow state at
constant volume and the reverse transformation are functions of
(1) relative density, (2) confining pressure, (3) principal stress
ratio at the moment when the sand is subjected to increasing shear
strains, and (4) whether the sand is subjected to an increase in shear
stresses by strain control or load control. (Note: When using load
control in laboratory tests, the rate of straining, which develops dur-
ing liquefaction, can reach magnitudes several orders greater than with
conventional strain control methods. Therefore, investigations of sus-
ceptibility to liquefaction by means of strain control tests are liable
to yield results that are well on the unsafe side.)
In nature, liquefaction will normally start in a lens of particu-
larly loose sand; and from such a nucleus it may spread also into
somewhat denser sand layers. The driving mechanism is usually by
gravity. Flow continues until the driving forces are reduced to the
small shearing resistance of the sand in its flow state; then dilation
will cause the liquefied mass to "freeze" again into a solid structure,
30

accompanied by a great reduction in pore pressures; and the mass then
stops flowing.
In cyclic laboratory tests, only those portions of a specimen
which have expanded into a loose state by redistribution of density
can change from a solid structure to a flow state and, by dilation,
revert again to a solid structure. The transformation of sand in por-
tions of a specimen from a normal structure of sand to a flow state and
then again to a solid structure, and the corresponding almost sudden
changes in shearing resistance from high to low and again to high, will
be referred to as the "liquefaction-dilation (L/D) response." During
this transformation, the compacted zones contribute to the L/D response.
In the moment when the pore pressures pass through their cyclic maximum
and minimum, the compacted sand zones develop contractive and dilative
responses, respectively. This probably makes a significant contribu-
tion to the sharp, momentary spikes in the pore pressure response.
Thus, the compacted zones not only contribute the volume of water for
the loosened zones but also accentuate the response after a steady
pattern of cyclic pore pressures and deflections has developed.
The patterns of L/D response are quite different in X and Y tests.
In X tests, it is easy to judge from the shape of the cyclic deflec-
tions whether an L/D response has developed within a test specimen.
Without liquefaction-dilation, the cyclic deflections have sinusoidal
shape which indicates that during the entire cycle the sand has main-
tained a solid structure. When redistribution has developed to the
extent that portions of the specimen have become so loose that they are
susceptible to liquefaction, or when the specimen is initially in a
loose state, two sudden deflections develop in each cycle, which can be
seen clearly in the transducer records in form of vertical lines that
appear as a quasi-rectangular pattern, differing distinctly from a
sinusoidal pattern. It can be seen in Fig. 10(a) that a loose specimen
can develop an L/D response pattern already during the first cycle.
However, the medium-dense and dense specimens, Figs. 11(a) and 12(a),
show during the first stage of these tests well-defined sinusoidal dis-
placements which gradually increase in amplitude. Later their shape
31

changes gradually to a rectangular pattern with parallel sides which
reflect very fast loss and recovery of shearing resistance, i.e., the
typical L/D response when portions of the specimen liquefy and dilate
in each cycle. Test X12 on a very dense specimen, Fig. 12(a), shows
during the first l14 cycles sinusoidal displacement with increasing
amplitude. In the 18th to 20th cycles, one can see the gradual develop-
ment of an almost vertical tangent when the displacements pass through
the point of zero applied shear force. Then, in the range of cycles
Nos. 90 to 100 (note that cycles Nos. 26 to 90 are deleted in Fig. 12),
one can see typical L/D responses that are created by redistribution of
density, even in such a dense specimen. Considering that additional
compaction in the densified zones of an initially dense specimen could
not have yielded much water, it follows that the zones, which have
loosened to the point that they can liquefy, must be narrow and there-
fore could not be easily detected by the procedure used for determining
redistribution.
In Y tests, the displacement records in Figs. 13(a), 14(a), and
15(a) show entirely different displacement patterns from those in X
tests. To convey a clear and complete picture of the deflections
requires computation of the movement of the displacement vector from
its components dl and d2 , as will be shown in a later section.
However, even without such detailed analysis, with some experience one
can judge from the shape of the displacement components whether the
specimen retained during a cycle its solid structure or developed L/D
responses. In Y tests, L/D responses are usually numerous within one
cycle, alternating with relatively slow displacements, as seen, e.g.,
in Fig. 13(a) by the zigzag pattern. On the other hand, test Y18, on
a dense specimen, Fig. 15(a), shows the regular deflections that indi-
cate no L/D responses. A similar Y test on a specimen with about the
same density was carried to 100 cycles and also did not develop L/D
responses. In contrast to X tests, in Y tests on dense specimens no
L/D responses were observed.
In the next two sections, the displacements and other observations
are analyzed in detail for typical cycles of X and Y tests without and
32

with liquefaction-dilation response.
5.2 Analysis of Typical Cycles Without and With Liquefaction/DilationResponse in Reciprocating (X) Tests
5.2.1 Cycles Without and With L/D Response in Dense Sand, Test X12
In Fig. 12(a), the transducer record of the displacements shows
for the first 14 cycles typical sinusoidal shapes with increasing
amplitude. In Fig. 18 are plotted, in the upper diagram, an enlargement
of the transducer record of the cyclic displacements during the 12th
cycle together with the applied shear stresses and, in the lower
diagram, the stress-displacement loop. The displacement curve in the
upper diagram is unsymmetrical, and therefore the lag angles 6 differ
substantially between the forward and backward displacements. In both
diagrams, there is no indication of the development of loss of shearing
resistance due to liquefaction in any portion of the test specimen.
In Fig. 12(a), it can be seen that the cyclic pore pressure was
still rising in the 12th cycle and reached its maximum cyclic peak
in the 18th or 19th cycle when also the shape of the cyclic displace-
ment is changing with the development of a vertical tangent in the mo-
ment the displacement passes through zero deflection. This vertical
tangent is probably the first indication that a momentary loss of shear-
ing resistance is developing in a small portion of the specimen. In
subsequent cycles the vertical segments of the cyclic displacements
keep increasing until the vertical sides modify the shape of the cyclic
displacements into the typical rectangular pattern of L/D response in
X tests, as can be seen well developed for the last ten cycles in
Fig. 12(a). Because the magnitude of asymmetry of these displacements
is unusually great, the more symmetrical shape of a cycle in test X22
was used.for a detailed analysis, which is presented in the next
section.
Note:. The authors suspect that the cause of the excessive asymme-
try in test X12 may have been inaccurate centering of the damping
springs at the bottom of the load hanger (Fig. 5), which would produce
an inclination of the vertical load and thus a horizontal component
acting on the piston. Therefore, it is recommended to replace the
33

damping springs by a vertical cylinder which is attached rigidly to
the bottom of the hanger and is immersed in a viscous fluid. A less
likely explanation of such great asymmetrical deflections would be that
they were generated by asymmetrical redistribution of density in the
specimen.
5.2.2 Cycles with L/D Response in Medium-Dense Sand, Test X22
The effects of redistribution on the development of (1) the pore
pressures, (2) the mobilized effective normal and shear stresses, and
(3) the displacements are analyzed for the 21st cycle, during the
phase of steady displacements, of test X22 performed on medium-dense
sand (Drc = 58 percent) . In the transducer records of this test,
Fig. 11(a), it can be seen that (1) the maximum pore pressure was
reached for the first time during the 3rd cycle, (2) a steady pattern
of pore pressures started with the 14th cycle, and (3) a pattern of
steady displacements started with the 18th cycle.
The displacement and pore pressure observations during the 21st
cycle are enlarged in Fig. 19, plotted as a function of the angle w
which defines the position of the rotating arm. In the lower diagram
is also plotted the sinusoidal shear stress T which is the component
in the direction of the displacements of the force applied by the
Negator springs, divided by the area of the specimen. It should be
noted that as the average shear stress T decreased from Tm to
zero during the last quadrant of the 20th cycle, the deflection of the
specimen remained almost constant. Then, when the shear force in-
creased from the negative to the positive direction during the first
quadrant of the 21st cycle, the specimen developed first a small,
gradually increasing displacement from A to B; and when the arm ad-
vanced by a lag angle 6 of about 65 deg from the zero-displacement
axis, i.e., when the shear force had increased to about 0.20 kg/sq cm,
almost to its maximum in the opposite direction, the specimen suddenly
deflected from the negative to the positive side, from B to D, by
almost 2 cm. (The lag angle 6 is the angle which the arm has
advanced after passing through w = 0 deg or o = 180 deg to the mo-
ment when the specimen deflects through the point of zero displacement.)
314

Such a great and sudden displacement reflects a sudden and substantial
decrease of the shear strength within the specimen and suggests that
loosened zones in the specimen had liquefied. Then, near the end of
this sudden displacement, the liquefied zones developed a dilative
response and "froze," i.e., the sand in the liquefied zones changed
from a flow state to a normal sand structure and thus mobilized the
required shear strength to arrest the movement at point D. The addi-
tional small increase in shear stress to T caused only the minormax
additional deflection from D to E. From E to F, while the average
shear stress decreased from T to zero, the deflection decreasedmax
by an insignificant amount. The applied shear force then increased in
the opposite direction, and a gradual acceleration of deflection
developed from F to G and then changed to a large, sudden displacement
to J, i.e. another L/D response. This sudden displacement developed
also at a shear stress of about 0.20 kg/sq cm. During the additional
small increase in shear stress to T = 0.22 kg/sq cm , the samplemax
deflected by a small amount from J to K. Finally, during the 4th
quadrant of the 21st cycle, when the shear stress decreased from Tmax
to zero, the deflection decreased only very slightly from K to L.
The essential feature of this pattern of deflections is that
while the externally applied shear force reciprocates back and forth in
a regular sinusoidal form, most of the deflection lags well behind the
applied shear force and develops in two major jumps in that cycle. The
specimen retains the shape which is deformed in one direction while the
shear force keeps increasing in the opposite direction almost to its
maximum; and then suddenly the specimen develops a major deflection in
the direction of the shear force.
The pore pressures are plotted in the upper diagram of Fig. 19
with A', B', etc., to designate the points that correspond in the lower
displacement diagram to A, B, etc. During the rapid acceleration and
then the sudden displacement from B to D, the pore pressure rose in the
form of a sharp spike from B' to C', reaching a maximum of 1.8 kg/sq cm
(as compared with the constant vertical stress of 2.0 kg/sq cm); and
then it dropped sharply to about 0.9 kg/sq cm, followed by an equally
35

sharp rise to about 1.2 kg/sq cm and oscillations that rapidly decayed.
The oscillations were probably induced by the shock when the fast dis-
placement was suddenly arrested by dilatancy. Then, when the shear
stress decreased from T to zero, the pore pressure rose onlymax
slightly from E' to F'. But when the shear stress then increased in
opposite direction, the pore pressure rose at a faster rate to point G',
increased sharply to its maximum at H', dropped suddenly to its minimum
at J', and then recovered to K'; and after the oscillations attenuated,
it remained almost constant to the end of the cycle, point L', where
the shear stress again passed through zero.
Because the changes in pore pressures from B' to D' and the dis-
placements from B to D developed very fast, it is not possible from
the instrument records to conclude that the peak pore pressures at C'
and H' correspond exactly to the moment when the displacements passed
through zero at points C and H. By analogy with cyclic triaxial tests,
in which the peak pore pressures always develop at the moment when the
mobilized cyclic shear stresses in the specimen are a minimum, it is
reasonable to assume that this holds true also for cyclic shear tests.
During the almost sudden displacement, when the pore pressure rose
momentarily to its peak, a substantial portion of the applied shear
force was used for accelerating the following parts of the apparatus:
cap, piston, and reciprocating sliding plate with piston bushing and
several bearings. Near the end of the sudden displacement, when the
sample "froze" by dilatancy and the pore pressure dropped to D', these
masses decelerated as additional frictional resistance was mobilized
in the sand. Therefore, during the very fast acceleration and decelera-
tion, the actually mobilized shearing resistance in the specimen was
not equal to the shear force component applied by the Negator springs,
except during a short transition when the velocity was constant.
During the rapid displacement, some loosened portions of the speci-
men had liquefied. Therefore, the actually mobilized shear stress T
can be computed from the equation Tm = tan 4 , where 4 is the
effective friction angle of the sand in a flow state, which is
estimated to be about 30 deg on the basis of other investigations. In
36

the moment of the peak pore pressure u = 1.8 kg/sq cm , the effec-maxtive normal stress was reduced to Q = 0.2 kg/sq cm . Therefore, the
mobilized shear strength in the liquefied zones of the specimen in
which the rapid deformation of the specimen developed dropped to only
about Tm = 0.2 tan 30 deg = 0.12 kg/sq cm . In Table 1 are summarized
all pertinent data and computed mobilized friction angles and shear
stresses for all points from A and A' to L and L'.
During the acceleration between B and C, the shear stresses mobi-
lized within the specimen are smaller than the force applied externally
by the Negator springs and energy is stored up in all moving parts; and
during the deceleration from C to D, the shear force mobilized within
the specimen is greater than the force applied externally by the
Negator springs and the stored-up energy is used to stop the moving
parts. Therefore, in the plot of mobilized shear stress versus dis-
placement, Fig. 20, the areas below and above the shear stress
T = +0.20 kg/sq cm , should be approximately equal. On the basism -of these considerations, the relationship between the mobilized shear
stress and the displacements was estimated as shown in Fig. 20. All
points from A" to L" in Fig. 20 correspond to points from A and A' to
L and L' in Fig. 19.
In Fig. 20, point C" is plotted to coincide approximately with
zero displacement. However, there is no physical reason why the transi-
tion from acceleration to deceleration should coincide with the point
of zero displacement. A more important question concerning the
accuracy of point C" arises because the authors have developed doubts
whether the writing pen of the recorder was able to record the extreme
maxima and minima of the sharp spikes of the developed pore pressures
during a fast liquefaction-dilation response. In fact, some of the
pore pressure transducer records show beyond the well-defined end
points of the spikes a series of faint dots in vertical extensions.
This suggests the possibility that the pen had moved very fast, consid-
erably beyond the recorded ends of the spikes, and was not able to
record a continuous line. Therefore, the correct maxima and minima in
the enlarged transducer record in Fig. 19 could be higher and lower,
37

Table 1
Pore Pressures, Shear Stresses and Displacements
During 21st Cycle of Reciprocating Test X22
1Points inFig. 18
andFig. 19
A
B
C
D
E
F
G
H
J
K
L
2ExternallyApplied
Shear StressT
kg/sq cm
zero
+0.19
+0.20
+0.20
+0.22
zero
-0.19
-0.20
-0.20
-0.22
zero
3InducedPore
Pressureu
kg/sq cm
1.35
1.47
1.80
0.90
1.20
1.30
1.50
1.80
0.90
1.25
1.35
5Friction AngleMobilized in
Specimen
$mdeg
zero
20
30
10
15
zero
21
30
10
16
zero
6Shear StressMobilized in
SpecimenTm = Q tan 0mkg/sq cm
zero
+0.19
+0.12
< +o.64**
+0.22
zero
-0.19
-0.12
-0.20
-0.22
zero
4
EffectiveStress
a = 2.0-ukg/sq cm
0.65
0.53
0.20
1.10
0.80
0.70
0.50
0.20
1.10
0.75
o.65
* Tan 0m = T/ ; but Om cannot exceed** Not exceeding the possible maximum for
30 deg.a = 1.10 kg/sq cm .
38
7Displacement
dmm
- 9.5
- 8.0
zero
+11.5
+12.5
+12.0
+10.0
zero
- 9.0
-10.0
- 9.5

respectively, than points C', H' and D', J'. This would move points
C" and H" in Fig. 20 much closer to the zero shear-stress axis, and
thus their positions would be more consistent with the low strength of
sand in liquefied state. There is no doubt that when an accurate
record of the pore pressures during a very fast L/D response is desired,
a different type of recording instrument will be needed.
In Fig. 11(a), it can be seen that during the first few cycles of
test X22, before redistribution caused the cyclic peak pore pressure
to increase to the maximum, the applied shear force probably did not
cause failure stresses to develop in a significant portion of the speci-
men. Only after redistribution caused some zones in the specimen to
expand into a loose state and then rendered them potentially capable of
liquefaction, should one expect sudden displacements to develop. Fail-
ure would then be controlled by the combination of (1) an effective
friction angle of about 30 deg of this sand in a loose state, and
(2) the acting effective vertical stress which is the total vertical
stress reduced by the induced pore pressure.
Finally, it is pertinent to inquire whether the test records yield
any indication concerning the size of the zones which are involved in
the L/D responses. Considering the limited degree of accuracy with
which the redistribution of density could be determined and the uncer-
tainties concerning the maximum and minimum cyclic pore pressures
during L/D cycles, it is probably not possible to derive any quantita-
tive information on this question.
5.3 Analysis of Typical Cycles Without and With Liquefaction/Dilation
Response in Gyratory (Y) Tests
5.3.1 Cycles Without L/D Response in Medium-Dense Sand, Test Y25
In Fig. 1(a), the displacement transducer record of test Y25,
on a medium-dense specimen with a relative density of 62 percent, indi-
cates no L/D response during the first six cycles. From an enlargement
of the records of the two displacement components, points of the actual
path of the displacement vector were derived for the arm in the posi-
tion u = 0, 90, 180, and 270 deg and were plotted in Fig. 21. Next
to each point is shown the cycle number, including fraction of cycle.
39

In addition, the lag angles A are shown for the points with w = 0
and 180 deg . It can be seen that the path of the displacement vector
is a spiral which approaches a circle when a steady pattern of deflec-
tions is reached.
After the 6th cycle, the displacement vector d1 gradually
developed, in each cycle, many alternating fast and slow movements
which are typical for L/D response in Y tests. To analyze such a pat-
tern, a more clearly defined cycle in test Y21 was selected and is
described in the next section.
5.3.2 Cycles With L/D Response in Medium-Loose Sand, Test Y21
The transducer records of test Y21, on a medium-loose specimen
with a relative density Drc = 50 percent , are reproduced in Fig. 13(a).
(Note that in Fig. 13(a) the vertical scales for the displacement trans-
ducers No. 1 and No. 2 are different.) To an enlarged scale, the dis-
placement components dl and d2 are plotted in Fig. 22(a) and (b),
for the 10th cycle, when a steady pattern of displacements had devel-
oped. In Fig. 22(c) are plotted the displacement vectors dA to E
and their reference angles w , , and A , which are defined in that
vector diagram and are tabulated next to that diagram. These displace-
ment vectors correspond to points A and A2 to E and E2 in the plot
of the displacement components dl and d2 in the upper part of
Fig. 22.
In order to understand clearly the deflection of the top of the
specimen during one full cycle of the arm, the reader should keep in
mind the meaning of the following details in the vector diagram:
(1) Point "0" represents the center of the base of the specimen and the
center of rotation of the arm, which does not change during the test;
and it is also the center of the top of the specimen at the start of
the test. (2) A horizontal line through "0" represents the starting
position of the arm in the direction to the left, from which the. angles
w and S are measured counterclockwise. The angle w , which defines
the direction of the arm, is only approximately equal to the angle a ,
which defines the direction in which the shear force is acting, be-
cause the center of the cap is not stationary. The angle S defines
)40

the direction of the displacement vector. For example, when the end-
point of the displacement vector is at point A, the displacement vector
is dA , its direction defined by the angle SA = 120 deg ; and the
direction of the arm, and approximately of the shear force, is defined
by the angle WA = 231 deg . Note that the direction of the displace-
ment is lagging behind the direction of the arm by the lag angle
AA WA - SA = 111 deg.
The gradual buildup and release of shear stress in combination
with the changing lag angle A causes the displacements to develop in
alternating steps of slow and fast and occasionally almost sudden move-
ments which are reflected by a zigzag pattern of the displacement d
in the direction of the arm. The actual elapsed times for the zigzags
between points A and E in Fig. 22 and the angular displacements of the
gyratory arm and of the displacement vectors were as follows:
Elapsed Time Rotation, degDisplacement sec Gyratory Arm Displacement Vector
A to B 0.70 23 17
B to C 0.04 Almost zero 48
C to D 0.82 27 10
D to E 0.09 3 12
During the almost sudden displacement from B to C, the direction of the
gyratory arm remained practically constant; and the displacement devel-
oped with a very fast acceleration during the first part and very fast
deceleration during the last part of that movement, i.e., by a
liquefaction-dilation response.
The component of the displacement normal to the arm, d2 '
changes at a much smaller rate; therefore, there is usually no zigzag
pattern in the record of d2 . For example, note that as the displace-
ment vector rotates from A to B in Fig. 22(c), the component d2
remains practically constant. However, in the direction of the arm,
the component d shows the displacement from A to B, Fig. 22(a).
At B, the lag angle A has increased to 117 deg. Then a sudden large
41

displacement developed from B to C. During this movement, the angle w ,
i.e., the direction of the arm, did not change and the magnitude of
the displacement vector remained practically unchanged, as disclosed by
the fact that points B2 and C2 coincide and points B1 and C1 lie
practically on the same vertical. This great, sudden displacement,
which is a typical liquefaction-dilation response in Y tests on medium-
loose sand, caused the lag angle A to decrease abruptly from 117 to 69
deg and the displacement dl to change from a negative to a positive
value. (Note: A lag angle A = 90 deg indicates that the displace-
ment in the plane of the arm is zero. For A < 90 deg the displace-
ment is positive, and for A > 90 deg it is negative.) During those
movements in which the lag angle increases, the frictional resistance
builds up within the specimen. However, sharp decreases in the lag
angle during rapid movements indicate that liquefaction has developed
in loosesed zones of the specimen.
In Fig. 13, it can be seen that (1) the induced pore pressure in
the 10th cycle of test Y21 decreased during the sudden displacement
from a peak of about 1.60 kg/sq cm to a low point of about 1.25
kg/sq cm, followed by oscillations that rapidly attenuated; and (2) all
transducer records of several preceding cycles are almost identical to
those of the 10th cycle, each cycle displaying one major L/D response.
5.)4 Comparison of Response of Saturated Sand in X and Y Tests
From a comparison of the results of all X and Y tests performed
with the same externally applied stresses and frequency, the following
differences and similarities in the response of the test specimens were
identified:
(1) The number of cycles to reach the maximum peak pore pressurein X tests as compared with Y tests is about the same for
loose specimens, about twice as great for medium-dense speci-mens, and up to four times as great for dense specimens.
(2) The maximum pore pressures that are developed in Y tests areonly about two thirds of the maximum in X tests, regardless
of the density of the specimen.
(3) The cyclic pore pressure fluctuations in Y tests are much
smaller than in X tests, regardless of density.
142

() The shear strains, when a steady pattern is reached, aresomewhat smaller Y tests than in X tests at equal density.
(5) A greater number of cycles are required to initiate L/D re-sponses in Y tests than in X tests at equal density. Indense specimens, even at 100 cycles, no L/D response was
observed in Y tests; whereas, in all X tests on densespecimens L/D responses developed.
(6) The intensity of the L/D response in X tests is substantiallygreater than in Y tests.
(7) The L/D responses in X and Y tests are entirely different.In one cycle of an X tests they consist of two well-definedand strong events. However, in one cycle of a Y test theydevelop in form of a complex pattern of many weak L/D eventsof irregular magnitude.
(8) The redistribution of density in Y tests, expressed by statis-tical parameters, is generally somewhat smaller than in Xtests at equal density.
(9) The patterns of redistribution in the zones adjacent to thecap and base, which develop compaction, are similar in bothtypes of tests. The zones along the sides and through themidplane of the specimen, in which the sand is loosened,develop somewhat different patterns in X and Y tests.
Most of the differences in response are consistent with the impor-
tant differences in the cyclic shear forces to which test specimens
are subjected in X and Y tests. In X tests, the applied shear forces
reciprocate between maxima and zero. In Y tests, the magnitude of the
applied shear force is constant, but its direction rotates monotoni-
cally at a constant angular velocity.
The reciprocating action in X tests is more effective in develop-
ing the liquefaction-dilation response. On the other hand, the gyra-
tory kneading action in Y tests is more effective during the first
phase of a test, while the pore pressures are rising, and before any
L/D responses have started. It is interesting that in spite of all
differences between the mechanisms of X and Y tests, almost the same
magnitude of redistribution of density is created in both types of
tests at equal density, when cycling is continued into the range of
a steady pattern of displacements.
)43

CHAPTER 6
DISCUSSION, CONCLUSIONS, AND RECOMMENDATIONS
6.1 Development, Capabilities, and Limitations of the Gyratory ShearApparatus
Development of the gyratory apparatus was a much more difficult,
time-consuming, and expensive undertaking than the senior author had
envisioned when he initiated this research project. By a systematic
investigation of the operation of the first model, and then changing
the design to reduce testing errors to tolerable magnitudes, and by
experimentation with various techniques of testing, particularly the
procedure of freezing the specimen and cutting it into a large number
of segments, we finally succeeded in measuring with reasonable accuracy
the distribution of the water content and corresponding relative density
in undrained sand specimens subjected to (1) reciprocating shear
(X) tests and (2) gyratory shear (Y) tests. As designed, the apparatus
was limited to narrow ranges of normal and shear stresses and to speci-
mens of one size only. In spite of these limitations, it proved to be
a useful research tool for investigating the redistribution of the rela-
tive density which is generated by boundary effects.
The principal purpose of this research project, investigation of
redistribution produced by reciprocating and gyratory shear tests, was
fulfilled. But inevitably, when an unexplored area is pioneered, for
every question answered new questions arise and demand further investi-
gations. In particular, we recognize that much greater accuracy in the
determination of the redistribution is required for the purpose of in-
vestigating the progress of redistribution during the first stage of
such tests when the pore pressure rises toward its maximum. For this
purpose, it would be necessary to test much larger specimens and to
develop refinements in the procedures of cutting the frozen specimen
into elements and in measuring the water content distribution.
6.2 Recommendation to Investigate Redistribution in Cyclic Triaxial
Tests
Comparison with the few available tests on redistribution in cyclic
I; 4

triaxial tests, which were carried out by Castro on small-diameter spec-
imens (Ref. 3), convinced the senior author that the mechanism of redis-
tribution in cyclic triaxial tests differs considerably from that in
X and Y tests. Therefore, he recommended to WES the construction of a
triaxial apparatus in which large-diameter specimens could be frozen in
the apparatus at the end of a cyclic test; and he assisted in its
design.
As compared with the complex three-dimensional redistribution of
density in gyratory test specimens, the great advantage of triaxial
tests is that the redistribution in the specimen is more nearly one-
dimensional. Therefore, it would probably be sufficient to investigate
the vertical redistribution by cutting a frozen specimen only into hor-
izontal slices. This would greatly increase the size of the individual
elements and the accuracy of the measurements and also decrease the
amount of work as compared with the tests described in this report.
For such triaxial tests there is no reason why one should adhere to the
conventional height-diameter ratio of about 2.5. Besides, it would be
desirable to investigate the effect of the height-diameter ratio as one
of the variables that may influence redistribution.
It would be necessary to develop a reliable procedure for placing
specimens with uniform density at the start of the tests, and this
would require use of thin layers and a systematic investigation of the
effects of all details of various placement procedures. The uniformity
achieved should be determined by freezing specimens as prepared and
saturated and cutting them into thin horizontal slices.
If water is used in the triaxial cell, it would have to be
drained before start of freezing. Probably the use of silicone oil,
which does not freeze, would ensure a reasonably uniform advance of the
freezing front through the specimen while the freezing mixture is cir-
culated within the base.
6.3 Discussion of Test Results
The following summary is based on the results of all 35 X tests
and 26 Y tests performed. The results of all these tests will be in-
cluded in the junior author's thesis.
)45

Under the following subheadings, the results of X and Y tests are
compared for tests performed with the same externally applied stresses
and frequency and similar relative densities.
6.3.1 Pore Pressure Development During X and Y Tests
In X tests, the pore pressure rises cyclically until the momentary
peak in each cycle almost reaches the effective vertical stress at the
start of the test; and the cyclic pore pressure fluctuations are great.
The cyclic peak pore pressures always occur when the applied cyclic
shear stress passes through zero.
In Y tests, the pore pressures do not rise higher than abotit two
thirds of the initial effective vertical stress; and the cyclic fluc-
tuations are small.
The number of cycles to reach the maximum peak pore pressure in
X tests as compared with Y tests at equal density is about the same for
loose specimens, about twice as great for medium-dense specimens, and
up to four times as great for dense specimens.
6.3.2 Redistribution of Water Content and Relative Density
The magnitude of redistribution of water content and relative
density in X and Y tests is approximately the same, or somewhat smaller
in Y tests than in X tests. Both types of tests produced in loose to
medium-dense specimens a similar geometry of the zones adjacent to cap
and base, in which the sand is being compacted, but somewhat different
geometry of the zones along the sides and in the midplane, where the
sand is being loosened. The progressive softening of the specimen
develops in these loosened zones. The compacted zones do not contrib-
ute significantly to the progressive increase in cyclic strains.
The redistribution of relative density can be expressed conven-
iently by two statistical parameters: (1) the standard deviation,
a percent ; and (2) the redistribution index, p. percent , which is
defined as the difference between the average relative densities
(in percent) of the four densest and the four loosest elements when the
specimen is cut into 64 elements of approximately the same size. For
a normal distribution curve, the theoretical relationship between the
two parameters is p. = 3.9)46 (or approximately p. = )a ), which is
46

represented by the full-drawn straight line in Figs. 7 and 8. The de-
viation of the test results from this straight line is a measure of the
deviation of the measured distribution from a normal distribution curve.
The inevitable testing errors in measuring the water contents of
the small elements into which a frozen specimen is cut, and the varia-
tions in density within an "as prepared" specimen caused typical stand-
ard deviations of about 2.0 percent to 2.5 percent and redistribution
indices of about 8 percent to 10 percent. The redistribution created
during X and Y tests is reflected by an increase in the magnitude of
these statistical parameters to a maximum of about four times the values
at the start of a cyclic test. This range of increase is best visual-
ized by comparing the normal distribution curves for Q = 2.5 percent
and 10 percent in the upper left diagrams in Figs. 7 and 8. The
plotted results of X and Y tests in Figs. 7 and 8, respectively, show
the wide range of redistribution, and its dependency on the relative
density and the number of cycles applied.
A systematic investigation of redistribution between the start
of cyclic loading and the moment when the induced pore pressure reaches
for the first time its maximum is urgently needed, as recommended in
Section 6.2. A hypothesis of the mechanics of redistribution, where it
starts and how it propagates in cyclic laboratory tests, was discussed
by the senior author in Chapter X of Ref. 6, with emphasis on the dif-
ferences between the cyclic stresses induced in an element in situ and
in laboratory test specimens.
6.3.3 Shear Displacements and Strains
After a steady pattern of displacements is reached in both X and Y
tests, the shear displacements and strains decrease in both with in-
creasing relative density such that for dense specimens the magnitude
is about one fifth as compared with loose specimens. For example, for
X tests performed with T /a = 0.11 and a = 2.0 kg/sq cm , at amax c c
relative density of 40 percent the shear strain y is about 50 per-
cent, and at a relative density of 90 percent the shear strain y is
about 10 percent.
For Y tests, the following deficiencies did not permit

determination of a reasonably well-defined relationship between the mag-
nitude of the shear strains and the relative density: (1) the smaller
number of Y tests performed; (2) a majority of Y tests not carried out
with a sufficient number of cycles; and (3) in about one half of the Y
tests, the displacement component normal to the plane of the arm was not
recorded. There is an indication that at equal test parameters the
shear strains in Y tests are somewhat smaller than in X tests at similar
relative densities.
6.3.4 Cyclic Deflection Patterns Without and With L/D Responses
Analysis of the X and Y tests on sand led to recognition of char-
acteristic patterns in the displacement records which permit differen-
tiation between the pattern when, during an entire cycle, the specimen
retains the structure of solid sand and the pattern when portions of
the specimen develop liquefaction-dilation responses.
In an X test, a sinusoidal shape of the displacement transducer
record indicates clearly that no portions of the specimen developed
liquefaction. A "rectangular" pattern, i.e., with parallel sides, shows
that two sudden displacements developed in each cycle during which the
shearing resistance in portions of the specimen dropped radically and
then recovered, i.e., that the specimen experienced two liquefaction-
dilation events. The gradual change from a sinusoidal to a rectangular
pattern reflects progressive redistribution of density within the speci-
men. The L/D responses will not develop until redistribution has
loosened the sand in portions of the specimen to a degree which renders
it susceptible to liquefaction. In a loose specimen, L/D responses may
develop already during the first cycle and before the pore pressure
reaches its maximum. In a dense specimen, a test may have to be con-
tinued many cycles beyond the point when the maximum pore pressure is
reached for the first time to achieve well-developed L/D responses.
During the first phase of a Y test in which no liquefaction devel-
ops, the displacement vector rotates and grows cyclically in form of a
smooth spiral. Then, when zones in the specimen become so loose by
redistribution that they are susceptible to liquefaction, the
18

displacement vector rotates in form of many alternating slow and fast
angular displacements within each cycle.
The type of liquefaction-dilation response in a Y test is quite
different and much less intense than the two strong and well-developed
L/D responses in X tests. The reason for this difference resides in the
fundamentally different application of the cyclic shear force. In X
tests, the shear force reciprocates between maxima and zero, whereas in
Y tests the magnitude of the applied shear force remains constant, but
its direction rotates monotonically.
In contrast to X tests, in which the geometry of the displacement
records conveys directly a clear picture of the type of response, the
records of the two displacement components in Y tests become meaningful
only after one has acquired some experience by analyzing in detail the
movement of the displacement vector in typical cycles, such as pre-
sented in Section 5.3 and Figs. 21, 22, and 23.
49

REFERENCES
1. Seed, H. B. and Lee, K. L., "Liquefaction of Saturated Sands duringCyclic Loading," Journal of the Soil Mechanics and FoundationsDivision, ASCE, Vol 92, No. 5M6, Nov 1966.
2. Lee, K. L. and Seed, H. B., "Cyclic Stress Conditions CausingLiquefaction of Sand," Journal of the Soil Mechanics and FoundationsDivision, ASCE, Vol 93, No. SMi, Jan 1967.
3. Castro, G., "Liquefaction of Sands," Harvard Soil Mechanics SeriesNo. 81, Jan 1969, Harvard University, Pierce Hall, Cambridge, Mass.
4. , "Liquefaction and Cyclic Mobility of Saturated Sands,"Journal of the Geotechnical Engineering Division, ASCE, Vol 101,No. GT6, Jun 1975.
5. Seed, H. B., "Evaluation of Soil Liquefaction and Cyclic Mobility onLevel Ground During Earthquakes," State-of-the-Art Report to the1976 ASCE National Convention in Philadelphia; Preprint Volumetitled "Liquefaction Problem in Geotechnical Engineering."
6. Casagrande, A., "Liquefaction and Cyclic Deformation of Sands -A Critical Review," Harvard Soil Mechanics Series No. 88, 1976,Harvard University, Pierce Hall, Cambridge, Mass., Presented at theFifth Panamerican Conference on Soil Mechanics and Foundation Engi-neering, Buenos Aires, November 1975.
7. Dixon, W. J. and Massey, F. J., Introduction to Statistical Analysis,3rd ed., McGraw-Hill, New York, 1969.
50

Back ard d3 0 d90
PP
/ p(+) -
aP
Forwardoc = 0 P3oc = 1800
Deflection of S = 0 90P S180 0Top of Specimen o S30 = 0.5P o = 90 d = 0
d =0 0 S =S = +P 1800 max 90
(a) Changing Magnitude of Shear Force Sa = P - sin oc and Deflectionof Top of Specimen During Reciprocating Shear Test (X Test)
'U,H
P = Constant Shear Force Applied by Rotating Arm p
P P s. 270*o=O = .=90
Start of Cycle P 1/4 Cycle 1/2 Cycle 3/4 Cycle
(b) A Constant Rotating Force P Applied to Top of Specimen Produces a GyratoryDeflection of Top of Specimen During Gyratory Shear Test (Y Test)
Fig. 1. Mechanics of (a) reciprocating and (b) gyratory shear
as applied to a perfectly elastic specimen

Displacement transducerNo. 1 only for gyratorytests
Gyratory SlidingPlate and Bearings
(shown for left half)-
Gyratory Arm
Note: Displacemenfor X testsY tests are
Vertical Loadiston
-- Transducer Hearing
Negator Springs I Piston Bushing
0-Ipper and Lower Guide Ringsand Spacers
--o o Reciprocating Sliding Plateand Guide Bearings (shownfor right half)
Cap - WPore Pressure Transducer in the Cap
- Displacement
Specimen-- -Slinky and Rubber Membrane- Tfor Confinement of Specimen
BaseChamber
o
t transducers - Pulley and Belt
and No. 2 fornot shown
--- To Pore Pressure Transducer in the Valve Block
(a) Section - Sliding Plate on Left for Gyratory Tests, on Right for Reciprocating Tests
Negator Springs and
Displacement Transducer No. - Displacement in Direction
of Gyratory Arm
fLg - 1zI\-- -Base and Bottom of Specimen
oAng/e ----- Cap and Top of SpecimenNotion of p I
Gyratory Arm Position
Y- oxis ofj . ' / Operator
-S /
Note: At start of test gyratory armDisplac ent Transducer . 2 -oxs must be in the X-axis direction
(b) GYRATORY SLIDING PLATE
/ Backwa rd (Displa cement
Cap and Top of Specimen-/ onward JBase and Bottom of Specim d dLateral Guide Bearings
..- Vertical Guide' Bearings
nP ion
Gyratory Arm oL- ' Y-ox/s Oeao
X-oxis Note: At start of test gyratory armmust be in the X-axis direction
(c) RECIPROCATING SLIDING PLATE
Fig. 2. Operation of gyratory apparatus
52

ws
era.
Fig. 3. Assembled gyratory shear apparatus with Negator springs attached
to gyratory arm and before removing centering screws


38
Wires to Spring Contacts :
37 3
- - -
(I(
(I(
(
3 9
36
9
Additional instrumentation not shown in this figure:
42 - Horizontal Displacement Transducer, to observelag between angle of shear force and angle ofmaximum horizontal displacement, mounted normalto direction of displacement transducer 38.
43 - Cap Pore Pressure Transducer.
(
r an
ly F
25
)) j
40,
LEGEND
315
33-
tes
19
28
27-- - - Tubing to valve 8, burett
16 /and pressure transducer
22 -- - . - 2
147
110
--
- - -- fi-
4
3
52
d
No. Item0
0 1
2
3
4
5
6
7
8
9
10
11
12
13
14
15
16
17
18
19
20
21
22
(23
(24
25
26
27
28
29 a
[29 b
30
31
(32
33
34
35
36
37
38
39
40
41
Note: For further details see figures in Appendix A
- Tubing to valve 7, burettes
and pressure transducer
Fig. 4. Front view and section of gyratory shear apparatus
Z3 /
31)
L/'
n1
Base of Apparatus Support Column (Steel).
Apparatus Support Column (Steel).
Insulating Cylinder (Bakelite).
Slip Rings (Brass).
Spring Contacts and Support of Spring Contacts.
Top of Apparatus Support Column.
Gyratory Arm Bearing.
Flanged Pulley.
Gyratory Arm (Steel).
Base Plate for Chamber.
Base of Specimen.
Conical Valve.
Porous Plate of the Base.
Test Specimen.
Porous Plate of the Cap.
Cap.
Rubber Membrane.0-rings (Parker 2-227).
Hose Clamp (Aero Seal QM 200 40).
Flat-coil Spring, "Slinky".
Column Holders.
Telescopic Slinky Columns.
Rigid Slinky Columns, not shown in this figure].
Slinky Coil Spreaders, not shown in this figure].
Loading Piston (Stainless Steel).
Apparatus Chamber (Stainless Steel).
Lower Guide Ring (Stainless Steel).
Gyratory Bearing.
Gyratory Sliding Plate (Stainless Steel).
Reciprocating Sliding Plate with Vertical Guide Bearings
not shown in this figure].
Upper Guide Ring (Stainless Steel).
Piston Bushing.
Lateral Guide Bearings, not shown in this figure].
Test Starting Plate (Stainless Steel).
Spacers.
Shear Force Ball Bearing
Negator Springs.
Negator Springs Support (Frame and Spool Assembly).
Horizontal Displacement Transducer.
Bearing into which transducers probes are screwed.
Platform for Probe of Vertical Displacement Transducer.
Probe of Vertical Displacement Transducer.
No. Item
)


Counter weight Beam
0Turnbuckle
DIo/ Extensome-ter
Gyratory ShearRecorders A pporus
1Spe
Zer"
ox
Tronsm/ssion
Connect hose H-1 to To water tropBurette during soturot/on ond vacuum pump
Pinchcock PbalIloon
Connect hose H-2 to Aspirator botte with de-airedB urett e w e sa rurar.g -.-. =or---le Wih d-o.-Specimen - - -=water used for 5aturating specimen
Connect tubing ftoburette B-2Burette B-! to apply back pressure
bleeding Burette B-2 p/ostic tubing T-1Stondpipe
6age 6-1
men 0 2 O
E4 Circle Soa /Pressure Uonrid////// MnioTrans duvcer ® U~
Stee/ Cable
Loading Frame
tlon9 er
WeightsBushin9 odn Springsto dompen horizontal
Osci//O fitOns Note : It is recommended
to repbce dumping springjby rigid cylinder-estensionimmersed in 'scous fluid.
Air Supplyat .
Valve Boand Bure1
Fig. 5. Diagram of gyratory shear apparatus and appurtenant equipment, exceptitems used for setting up a specimen and freezing it at end of test
cm
Anteus pressure
c k Requlator
,es

' ,,.
_ ...
dk'
y1
. M f s
_ 'x f
a
~
,
_..
.... ,rw .. , _ _ve_
t
4
f " S'
r
Fig. 6. Specimen set up in apparatus with slinky spreaders
inserted and guide columns mounted
58
y

12rCOMPARISON OF NORMAL DJSTRIBUTIONS
. For 64mpies as placed6"= 2%, '?; = G
2. For Mx. Redistribv'tor
W 6' =lolo%
52 /"Io y
88% 7'2 0 0 <' -7' % -*57'
2.y --
ze -2 y y'71
91% , c 8o o ,
cy- c-'
- - - +-sPrpreeimn-
+ As Prepared Specimens
with, rc Range 1t8 -90 '%.
10 20Redistribution Index, fP, t
Fig. 7. Standard deviation versus redistribution index for reciprocating shear (X) tests
% ' ,
629% .4Izcy -, 2% no
40 . y 6
'.9 %
~2 5 ey\~
23 DE
38 % D6ig g oo
Number of cyclesSTcst No. is shown
5 73 / Jnext to each point
" 35 Drc 6 55'
" 55 < D rc 65*rc
" 65 < D rc 952rc
At Start of Shear Test:
c= 2.00 kg/sq cm; u = 1.00 kq/sq cm
max-0.22 kg/sq cm; - /6 - 0.11ax max c
f= 0.1 cycles/sec
10
O0
i.0
wQ)baNu
baEu
81
61
4
2
O ..'
0 30 40

COMPARISON OF NORMAL
I. For Sam pies as O
2. For Max. Redisfribt
89 '.
10
0
o >
V
U
2
0C
DISTRIBUTIONS
'Iaced
/ d Normal Distributionuf io n= =
' 9 12.
S */""554*/- 5I 0 cy 35 cy
s cy 59
II 21
4 59'.447 / /
3" 25 25'y 2 cy a /5 7Y
. cy 1300 i92. 3Y+5x+7ylOOcy 3 24 62.*!.L ,N9 cy L &G E N
30Y+ o x + 30 1 58%/ 6 1*/
5 -y I4 y_ rec, % Test No. is shown2GI ' .. next to each point
8'I!90 ' s
SIcy
As Prepared SpecimensWith Drc Range 48 to 90'/
10 20
Redistribution Index, J,%
0%
5 cy
N umber or cyc tes5
40 6 Drc 55t
" 55 < Drc 65
" 85'D 95$rc
At Start of Shear Test:
6< -- 2.OO Rc/sq cm uc= 1.0O0g /sq cm= 0.22. kg/sq cm ; 2 / 4 = 0.11
f 0 .1 cycles /sec
30 40
Fig. 8. Standard deviation versus redistribution index for gyratory shear (Y) tests
I I I
1
1

a b c d
1 3 61.5 62.7 66.
2 0. 60.
3 1.7 -63.2 57.2 59.60.5 6
4 7.- 61.7 56.5 63.
Legend
"'I
Slice A
61.6 58.7 58.9 58.0
.3 61.4460.7
64.6 59.6 56.6 60.856.2 57.8 58.7 62.6
Slice B
57.3 59.2 56. 57.2
64.6 60.5 59. 60.2
65. 60.1 64. 63.1
61.6 62.7 64. 61.2
Slice C
...- -
59.2 58.7 60.2 64.
60.8 -65.6F64 64.8
61 646 63.3 14
60.0 63.5 65.4 0.5
Slice D
D' < 56.0%
56.0Drf 4 66.0%
Df > 66.0%rf
30 -
IE- D =61.0/.rf -
20 I
10 I
I ~ .
0 1150 60 70
Relative Density, Drf' %
After Consolidation,
Before Freezing
w =23.3%C
e = 0.617C
D =61.1%rcc = 1.00 kg/sq cm
u = 1.00 kg/sq cm
Computed from Water Contents
of Frozen Elements
wf = 23.3%
ef= 0.617
D = 61.0%rf
wf Range = 23.9 to 22.6%
D' Range = 56.1 to 66.4%
Standard deviation a = 2.66%
Redistribution index pi= 9.6%
Distribution of Relative Density in Vertical Slices Histogram of Distribution of Relative Density
Fig. 9. Distribution of relative density in specimens as prepared (test W3)
0NH
O1
4 )C
z,


2.0
o w
1.0
H
0
i
- + u f
-11111 [d
10 20 30 40
Relative Density, Df, %
50 60 70
(c) Histogram of Distribution of Relative Density
5
Cycles
(a) Induced Pore Pressure and Horizontal Displacement
versus Number of Cycles
a b c d
27.2 30.9 31.3 6.
25. 25.3 20.0 25.
26.2 21.8 27.2 32.
24. 44.8 41.2 34.
Slice A
31.0 50.8 48.7 30.9
27.7 29.4 29.9 28.3
29.8 25.2 34.2 35.3
32.5 63.0 47.7 39.5 LSlice B
After Consolidation
At Start of Test
Qc = 2.00 kg/sq cm
uc = 1.00 kg/sq cme = 0.689C
w = 26.0 %
Drc =39.8%
Zmax = 0.22 kg/sq cm
max c=0.11f = 0.10 cycles/sec
At End of Test and During Freezino
Nf= 7 cycles
f 0.19- kg/sq cmof = 0.71 kg/sq cm
Z~f/ = 0.27
uf = 1.29 kg/sq cm
df = 11.5 mm
Computed from Water Contents
of Frozen Elements
w f=26.7 %
ef = 0.708
Drf =33.7 %
w Range = 28.5 to 23.0%
Drf Range = 20.0 to 63.0 %Standard deviation a = 9.75 %
Redistribution Index p= 35.2 %
Legend
........./ I 3.6 51 .9 30.0
25.5 33.2 30.434.27
25 .9 28.0 34.727.5 49.2 61.1 39.2
D' < 28.7 %rf28.7 Drf 38.7%
D'f> 38.7 %
Slice C
32.3 36.2 36.8 33.8
26.1/24.0 27.426.1 22.8/ 22.5
23.9 25.627. 32.5 42.5 33.
Slice D
(b) Distribution of Relative Density in Vertical Slices
Parallel to Direction of Motion Fig. 10. Reciprocating test No. X13
on4JCw)
W
0
z-
backward
- 10
- r
+ 5 -
+10 -
forward
4J
*d H
m+ a
0
12
3
4
f
I! 1fflht1flttt1
Start IiIII I
_ 1
L 1 M" 11 . _ 1 1 .L I
1 ' 111 ,I
! E ! ,L1; il: ll ! i ;!i;l ; ; ; I,: 1 i; a
1 I l 44i' 'ff . : 1
1 I 1 I I II I I I
//L7
--
20
10 .-
--r-r---
T I
. .
= 33.7 %rf
II(( I II( ! li l!II!Il l lll li i ll if l
-_

II 'n

2.0-
a u
0
backward
-10
Nm c+ 5 -
s
+10r
forward
1 ' ' I 1 i 1, I M J I
Q 1 j j j
' ' , , .
, . _
u
0 10
m 20
a
0 10
003 0
S- D = 55.3 %
40 50 60
Relative Density, Df, %
70 80
(c) Histogram of Distribution of Relative Density20
21st cycle analysedin Figs. 18 and 19
(a) Induced Pore Pressure and Horizontal Displacement
versus Number of Cycles
La b c
1 50. 59.4 54.8 8.4
2 47.0 55.3 48.6 53.0
3 52. 53.0 45.7 52.34 55. 66.1 64.6 57.1
Slice A
48.1 70.4 65.2 48.07
45,4 52.25 53.452.9
50.1 61.0 58.7 52.652.6 74.6 77.8 58.6
Slice B
53.8 67.8 72.5 49.950.3 47.0 46.2 46.9
51.8 50.1 59.8 51.3
50.0 66.7 78.0 66.2/
Slice C
48.1 56.5 56.0 40.45.7 44.8 53.0 47.
52.4 49. 52. 51.
51.7 66.8 74.3 62.8
Slice D
(b) Distribution of Relative Density in Vertical Slices
Parallel to Direction of Motion
Legend
: : : : : : : : : :
After Con'solidation,
At Start of Test
3 = 2.00 kg/sq cmc
uc = 1.00 kg/sq cm
ec = 0.627
w =23.7 %
Drc =58.1 %
max = 0.22 kg/sq cm
max c = 0.11f = 0.10 cycles/sec
D < 50.3%
50.3 D' 60.3 %
rfD' > 60.3 %rf
At End of Test and During Freezing
Nf
of
df
df
= 25 cycles
= 0.19 kg/sq cm
= 0.82 kg/sq cm
= 0.23
= 1.18 kg/sq cm
= 12.5 mm
Computed from Water Contents
of Frozen Elements
Wf =24.0 %
ef = 0.636
Drf = 55.3 %
WfRange = 23.7 to 19.4 %
D' Range = 40.8 to 78.0 %rf
Standard deviation a = 8.53 %Redistribution Index p.= 31.0 %
Fig. 11. Reciprocating test No. X22
Cycles
Start 10 sec End -- >
-n,/ --- hi-H
z7


C)
ob (CO'
b a aas
H
2.0
1.0 -.
0 -
backward
-10
4. ,
-I
c o +o
4 )
A
+10
forward
SA NBO N Rew /_CO______________ __t____a____
_ h_:
V.-. - -- T -- - -l " . T. - -T -r -
-- 4
-- - _
I ~r1 .. .tf I.
- t- -i -- I --
T T
_
..
-- i---i- ; --- I---
:;
_, . _ ,
!~.
. .-.. 10 sec-+-2--eStart -nalys-d 2O 1..2h c***anayse.2.
U U UUUUtU.JUEnd
..- -
30 r-
0)
4-J
0l
r14W
20
10
0 i K
IF--- Dr = 88.9 %
rf
I1
70 80 90 100
Relative Density, D'f,
(c) Histogram of Distribution of Relative Density
100
in Fig. 17
Cycles
(a) Induced Pore Pressure and Horizontal
versus Number of Cycles
a b c d
- - |F---|
1 87.5 37.0 36.9 83.
2 39.7 90.9 91.5
92.1 91.3 91.1
4 87.3 90.5 90.1 90.-
SLICE A
9.1 /36.3 836.6 36.0/
91.3 33.2 3395.2
39.5 36.2 88.4 93.1
37.3 91.5 90.5 93.11
SLICE B
33.0 37.3 39.3 86.37
92.4 35.6 90.2 93.0
91.5 30.9 88.2 91.4
33.1 33.7 92.5 90.9
SLICE C
85.3 86.3 84.9 84.6
91.0 87.6 90.7 90
90.3397.6 . 87.8
73.7 38.0 90.3 90.
Cyc1O
90
es 26 to 90mitted
Displacement
After Consolidation.
At Start of Test
3 = 2.00 kg/sq cmC
u = 1.00 kg/sq cmC
e = 0.517c
w = 19.5 %C
D =90.9 %rc
Amax = 0.22 kg/sq cm
2- / = 0.11max c
f = 0.12cycles/sec
At End of Test and During Freezing
Nf
tfcaf
Z' / afof
df
Drf< 83.9 %
83.9 D' s 93.9 %rf
D' > 93.9 %rf
SLICE D
(b) Distribution of Relative Density in Vertical Slices
Parallel to Direction of Motion
= 100 cycles
= 0.19 kg/sq cm
= 0.58 kg/sq cm
= 0.33
= 1.42 kg/sq cm
= 3.5 mm
Computed from Water Contents
of Frozen Elements
wf = 19.8 %
ef = 0.524
D = 88.9 %rf
wf Range = 21.0 to 19.0 %
Dr Range = 78.7 to 95.2 %rf
Standard deviation a = 2.55 %Redistribution Index pi= 10.8 %
Fig. 12. Reciprocating test No. X12
_'
jI__ it| I I|- I
-/ --
- 1
1 +- - - -, - -- ! - -
-ni
:
.i
-: - -
.
:F::.
:Ly:._:_
. . . .-1


a)
H
a)
2.0
0 -
+100
C +5
u r0 1- -
-o 0>(
E - -0
a a 0A 0
H-4 H -1
0N N~
H 'a 0
is~ 101
0 20
O r
u
10 sec--- Start
Transducer No. 1
Transducer No. 2
10thin Fi
0 5
Note: For position of displacementtransducers see Fig. 2(b)
End
cycle analysedgs. 21 and 22
10
Cycles
(a) Induced Pore Pressure and Horizontal Displacements
versus Number of Cycles
Legenda b c d
/41. 44.46 45.942.
50.7 41.0
4 . 45.i 43.6 520.
40. - 49.3 50.7 1.57
D' < 42.4 %rf
42.4 D' 52.4 %
Drf> 52.4 %
After Consolidation,
At Start of Test
ac = 2.00 kg/sq cm
u = 1.00 kg/sq cm
e = 0.654C
w =24.7 %c
D , = 50.1 %Drc
T = 0.22 kg/sq cm
Z/ c = 0.11
f = 0.10 cycles/sec
438.5 58.0 63.9 48.948 .1337.9/ 32.5
43.2 40.6 48 42.347.0
39.0 57.1 60.1 49.8
Slice B
45.8 65.4 58.0 41.4
42.4 44.9 47.2 47.436.6 53.7 45.1 40.9
53.8 63.1 64.6 56.8
Slice C
40.8 48.4 42.9
37.8 40.4 36.4 9.9
42.5 43.1 42.3 45.
52.7 61.9 57.5 5.9
20
C4)
0' 10
0
30
I
F --- D = 4 7 .4 %
j
1
rf
I
I
I
I
I
I
40 50 60
Relative Density, D f, %
At End of Test and During Freezing
N = 10 cycles
Tf = 0.22 kg/sq cm
- 0.69 kg/sq cm
Z F/ =0.32
uf = 1.31 kg/sq cm
df= 9.5 mm
Computed from Water Contents
of Frozen Elements
w = 25.0 %
ef = 0.663
Drf=47.4%Drf
w' Range = 26.9 to 22.8 %
D' Range = 32.5 to 65.4 %rf
Standard deviation a = 7.72 %
Redistribution Index p = 28.4 %
70
(c) Histogram of Distribution of Relative Density
Slice D
(b) Distribution of Relative Density in Vertical Slices
in Direction of Final Deflection
Fig. 13. Gyratory test No. Y21
121
31
4
Slice A
- ---------- --------- ---
::::: :
---
..... ::: ::.----- :-e - -- :::


2.0v
44 -
a1u
u \44 1.0
0
4-4D +10
0 -
+ 5H0>
6 0
-10
_n10 L
ra
uI
y
10 sec
KA'
Cycles 2 to 6
analysed in Fig. 20
E-Start End
of
Transducer No. 1
(c) Histogram of Distribution of Relative Density
Transducer No. 2
I I 1 I I I 1 I
0
Note: For position of displacementtransducers see Fig. 2(b)
(a) Induced Pore Pressure and Horizontal Displacements
versus Number of Cycles
a b c d
1 49. 57.7 53.2 2.3
2 58.2 58.0 54.60.5
3 57. 59.4 69.54.2
4 50.1 59.7 63.5 55.
Legend
D'f( 54.2%
54.2 Drf 64.2 %
Dr f> 64.2 %rf'
After Consolidation,
At Start of Test
5c = 2.00 kg/sq cm
u = 1.00 kg/sq cm
cec = 0.615
W =23.2 %cD =61.7 %rc
= 0.22 kg/sq cm
T/Q = 0.11cf = 0.13 cycles/sec
Slice A
56.1 67.9 62.4 62.07
59.4 53.0 61.3 60.6
58.8 47.1 50.4/61:5/
53.9 68.6 73.7 61.1
Slice B
58.3 66.2 67.5 50.6
58.7 59.9 5S.9 62.0
55.9 59.1 48.759.4 74.9 75.6 64.7
Slice C
48.6 56.0 56.3 48.7
60.6 58.6 57.1 62.1
55.0 59.9 61.5 72.7
56.7 59. 58.9 59.5
Slice D
At End of Test and During Freezing
Nf= 10 cycles
Zf=0.22 kg/sq cm
= 0.66 kg/sq cm
/ o=0.33Uf = 1.34 kg/sq cm
d = 5.2 mm
Computed from Water Contents
of Frozen Elements
wf = 23.5 %
e = 0.623
Drf =59.2%
w'fRange = 25.6 to 21.4 %
Drf Range = 42.3 to 75.6 %
Standard deviation a = 6.17 %
Redistribution Index pi= 27.0 %
: :
(b) Distribution of Relative Density in Vertical Slices
in Direction of Final DeflectionFig. 14. Gyratory test No. Y25
)0N
0
20 -
41
0
a
Drf = 59.2 %
w_ _
1._
) 50 60 70
Relative Density, Df, %80
10
Cycles
T
f Y 1p
- ---1--r.
t-_'--_
i-
_


.W-
O H-
0~ 4o a
-5
4J $4-
HO
+0
"d +4-
us -
$5 --
-10 -
N H OcN
0- p ~-
r 5
0 b
Transducer No. 1
Transducer No. 2
Start 10 sec End
/ M-HF
30 I
Drf= 86.1 %
* Ic 20
4, 4
410 -
070 80 90 100
Relative Density, Drf %
(c) Histogram of Distribution of Relative Density
0
Note: For position of displacementtransducers see Fig. 2(b)
(a) Induced Pore Pressure and Horizontal Displacements
versus Number of Cycles
a b c d
1 81. 78. 81.7 81.4
2 89.2 89.9 86.889.4
3 88.0 86.0 89.9 90.
4 83.3 88.1 90.5 87.4
Slice A
84.1 76.9 89.5 89.3
88.4 86.5 89.24
90.5 84. 84.9 88.0_
84.9 89.3 91.0 88.1
Slice B
83.6 83.9 90.2 90.3
87.3 82.2 87.1 89.2
89.0 86.9 86.5 87.9
80.5 88.0 90.3 87.3
Slice C
81.9 79.3 81.3 76.9
89.0 86.6 90.4 86.
89.5 88.6 88. 90.
81.4 86.6 86.9 87.8
Slice D
Legend
IIIIiiiD'f< 80.5 %
80.5 Drf L90.5 %
Drf> 90.5 %
After Consolidation
At Start of Test
5c = 2.00 kg/sq cm
uc = 1.00 kg/sq cme = 0.525
We =19.8 %c
Drc =88.6 %
Z~= 0.22 kg/sq cm
Z/ c = 0.11
f = 0.14 cycles/sec
At End of Test and During Freezing
Nf = 25 cycles
Z = 0.22 kg/sq cm
& = 0.52 kg/sq cm
Z / 6 = 0.42
of= 1.48 kg/sq cm
d 1.5 mm
Computed from Water Contents
of Frozen Elements
Wf = 20.1 %
ef = 0.533
Df = 86.1 %
w Range = 21.3 to 19.5 %
Drf Range = 76.9 to 91.0 %Standard deviation a = 3.57 %
Redistribution Index p.= 12.6 %1.
(b) Distribution of Relative Density in Vertical Slices
in Direction of Final Deflection
Fig. 15. Gyratory test No. Yi8
10 20Cycles
-1L - -


Legend I I I At Start of Test:
Number at each point is number of cycles ac=- 2.0 kg/sq cmto end of test; N is number of cycles cto steady state s uc = 1.0 kg/sq cm
. carried to steady state; max = 0.22 kg/sq cmo not carried to~ steady state / = 0.11
o " " Ns - 20 -25 max c
7 f = 0.1 cycles/sec
s" 'oo A N~23-4O
V t 25 . 64 1- ' *71/
C.o -0
CO(00
; . soo-qO
- ~ ~- --- -
0 Specimens as Prepared 0
O4
so 40 So 60 70 6o 90 ,0Reotive Density , Dr., %
Fig. 16. Redistribution index versus relation density forreciprocating shear (S) tests
Sc II4)
2 At Start of Test:
.Ns *8c = 2.0 kg/sq cm
u = 1.0 kg/sq cmo 40 2 0 i~.2-25 c-
virmax= 0.22 kg/sq cm0 to Z4 zer / = 0.11
tI "ic0f = 0.1 cycles/sec
54o ---- I.C) S50
E30-C C
., a. Legend 0
n A 20 Number at each point isnumber of cycles to end of test
N Number of cycles to steady state
5 zoo
U4) y 0 NS 5-50
C)
0 I I I Io 4o 50 60 70 80 90 too
Relative Density, Drc,
Fig. 17. X tests - shear strain versus relative density
during steady state

.22
|6=100
- I
b=24 6=i0
stress "
-1 0
U,-0
- NO
U)
(o +0U)
U)
.H
aaL
12th Cycle
-1 0 +1Displacement, d, mm
V
G)
toQ14
+2
Fig. 18 Displacements and shear stresses during12th cycle of reciprocating test X12
Angle c ofRotation of Arm During
360
12
0
+1
Displacement
-
.22
9 90 18O0 270I I I I1
11
+ 0.20
+ 0.10 -w H
Q4
I U)
cowo
4)':
W N
U)
0
- 0.10
- -
- -
- 0.20
-2
'
r

Applied Vertical Stress, 2.0 kg/sq cm
EffectiveStress, Q
F'
EI
Induced PorePressure, u
I L 3
U
010)
0)
0)N
a)a
0
-ShearStress, r
-CI I
I I
I II I
I I
22I I
I 6 650
I I
I I
I I
2700 3600
ZeroDisplac ent\
0.20 ( 0 .01)kg/cm 2
I
E Fl
90 1800
S KIL-
0 .20 ( 0 .0l)kg/cm2Hi
T is accurate towithin + 0.007 kg/sq cm
Phase difference 6 isaccurate to within + 40
I
2700 3600
20 Angle w of 21Rotation of Arm During 21st Cycle
Time for full cycle = 9.9 sec
Fig. 19. Pore pressures, shear stresses, and displacementsduring 21st cycle of reciprocating test X22
77
2.0
1.0
0I I I
I I IAI~ ~ [Displacement
I I I
B'
AI
H'
Kt
JII
-10 r
-5
I
'
U
I0
a)
A
0
+5
U)
N"
U)U)
4,V)
C)
04a4+10
+15
I
B
1
i
i
i
ib -69

1.5 sec
Almost instantaneous (<<0.1sec
0.3 sec
I I
I I
+ 0.30 1-
+ 0.20
u '+ 0.10
o a.w !
a a 0
CONN 4
0.10
c -z
O'A
S-0.20
- 0.301-
I II II I
SB"
- C
L"
-t
91J"
K
A-
- 10 -5
t
0
I I
I
i
I
+5 + 10Displacement, d, nun
Fig. 20. Mobilized shear stresses versus displacementsduring 21st cycle of reciprocating test X22
7 sec
+ 15
Ss.
'T''
7D
-- ---------------------
1 L/// I ! 1 1 1
I
I
I
i i i
/ t4'
Fi"w-"
F "
H."
G "
}

Scale, mm0 1 2 3 4 5
I I I I I
a =77
\ , 5.0
5" S*
4.0
a = 3523.0 c. - 270' 3.75 ,, .7'5
\- -I - -- '' - 4.75
Center of base pn i hFP =zero-P of specimen and
c fulcrum of arm
=I 1* .7
/.2
1..5
w=9o *
/5.2 - q25 - __-" 2.5------- 3.5 2.
Positon o arm t 4-
star andendof ccle, - =6\
i~~~e.~( =1=80'-dx\ 3 00s~
\=74
For oint shon, isplcemet vetor wer co3ute
Foig.on2f1. rmat fdslce4.5cor cldrng2dt t
cyceo.clesnyratoryet.2
79

(a) Displacement d in
Direction of ArmCI
19
+5
0
-5
0
+5'd
+10Angle a
9 Angle of Rotation w of Arm During 10th Cycle
132
,5 II
'aI II:I I i I
I I IIM "fI Il
I I III I II
(b) Displacement d2 I I IINormal to Arm I II
I I II
I I II
SI II
10
Time for full cycle = 10.9 sec
Fulcrum of arm and a$>center of bottom aof specimen D
SD
Reference Cfor Angles 0- C
d / dC
w Arm
\ \ N \ A dB
d2z sB B
A
A 2
(c) Diagram ofDisplacementVectors d to EE
Fig. 22. Displacements during 10th cycle of gyratory test Y21
00
Vector Cw) /9 \
23/* /20* //
5 254 /37* //7*do 254 /85* ,9*
d1, 28/* /950 86'7 E 284 207' 770
1

f sLag angles at 6o-
start and end 2e27of cycleX0s/.5
1 2
6
Position of arm at 21end of cycle
= 3600do
cu = 0Position of arm at ' Vector
start of cycle - Path
fast d
f = fast displacements = slow displacement
f s s
0 5 10 s
Displacement VectorScale, mi
Fig. 23. Path of displacement vector d during10th cycle of gyratory test Y21


APPENDIX A
DETAILED DESCRIPTION OF GYRATORY APPARATUSAND SHOP DRAWINGS
A.1 Lateral Confinement of Specimen by Slinky (Flat Coil Spring) andRubber Membrane (Fig. h)
A flat coil spring, of the type sold for children's play under the
trade name "Slinky," supports a cylindrical rubber membrane, which in
turn confines the specimen. The membrane is sealed to the base and to
the cap by means of 0-rings and hose clamps. To prevent development of
friction in the slinky, the flat coils are separated by "coil spreaders"
during consolidation of the specimen. These coil spreaders are removed
before application of cyclic shear stresses.
The slinky springs used in this investigation were obtained from
James Industries (Hollidaysburg, Pennsylvania) with the following di-
mensions: I.D. = 2.700 + 0.005 in. and O.D. = 2.913 + 0.005 in. For
the size of the specimens used they were cut to a length of L.3 cm.
The surfaces of these springs were treated by spraying with Molykote
523 Bonded Coating Lubricant, manufactured by Dow Corning Corp.
The rubber membranes were obtained from the Testlab Division of
GOI (Chicago, Illinois) with the following dimensions: diameter =
2.8 in. and thickness = 0.012 in. For this investigation they were
cut to a length of 6.5 cm. They fit easily inside the slinky.
Nine coil spreaders are required to separate the slinky over the
full height of the specimen. They are inserted, as shown in Fig. 6,
in sets of three, one above the other, 120 deg apart. Each coil
spreader consists of 12 circular, stainless steel shims, 0.003 in.
thick, with a diameter of 0.5 in., which are mounted in an aluminum
cylinder as shown in Fig. A-1. The shims are glued to and held in
place by 0.025-in, stainless steel plates. Each coil spreader is
0.36 in. long.
The membrane is sealed by two 0-rings to the base and two 0-rings
to the cap as shown in the detail in Fig. 14. To apply or to develop
pore water pressures up to >4.0 kg/sq cm above atmospheric pressure,
83

the 0-rings (Parker 2-227) are confined by two commercial hose clamps
(Aero Seal QS 200 M 40).
A.2 Slinky Guide Columns (Fig. A-1)
To achieve simple shear deformation of the specimen, three stain-
less steel guide columns, with universal joints top and bottom, are
mounted 120 deg apart around the slinky. Each column consists of two
telescopic cylinders to allow changes in thickness of the specimen.
They are attached to the base and to the cap by means of column holders.
Two universal joints (Stainless Steel Minijoint No. lBS, Falcon Machine
and Tool Company, North Wilmington, Massachusetts) in each column allow
horizontal displacement of the cap in any direction while maintaining a
straight-sided cylindrical shape of the slinky and specimen. (Note:
Tests made without these guide columns resulted in C- or S-shaped defor-
mations of the specimen.) Fig. A-1 shows the guide columns with the
universal joints and the column holders.
A.3 Base, Cap, and Valves (Figs. A-2, A-3)
The base and the cap, including valves, are shown in Figs. A-2 and
A-3 and are described below:
(1) The base is permanently attached to the support by a flatheadscrew which is sealed with a Parker 0-ring No. 2-9.
(2) The open spaces in the bottom of the base allow rapid coolingof the base during the freezing operation after these spacesare filled with the freezing mixture.
(3) The grooves in the cap above the porous plate are so designedthat they allow the water, which is expelled by freezing, toescape without being trapped.
(4) A pore pressure transducer, placed above the porous plate ofthe cap, permits measurement of pore pressures in the top ofthe specimen. This pore pressure transducer is described inSection A.ll.
(5) Conical stainless steel valves in the base and the cap permitperformance of gyratory and reciprocating shear tests withoutdrainage; see detail "B" in Fig. A-2.
(6) Before the piston is inserted into the cap, the cap must becentered by the three horizontal screws, which are shown inFigs. A-ll and A-12. They are screwed through the cylinderwall of the apparatus chamber as indicated in Fig. A-ll andshown in the photograph, Fig. 3. These screws are removedafter consolidation of the specimen is completed and immedi-ately before the start of cyclic load application.
84

The base and the cap are connected to the valve block and burettes,
Fig. 5, by means of 0.125-in.-diam plastic tubing. The essential parts
of the valve block are:
(1) A manifold unit (Circle Seal P-727); valves 5, 6, and T.(2) Attached to the manifold unit is valve 4 (Hoke R310 A),
which connects to the exterior pressure transducer holderand through valve 1 (Whitney R316) to burette B-l.
(3) A bleeding standpipe and valve 2 connect to the left instru-ment port of the manifold unit.
(4) Burette B-2 connects through valve 3 to the right instrumentport of the manifold unit.
Valves 2 and 3 are 9559-B Circle Seal Plug Shutoff valves. The
burettes are graduated in 0.10-cu-cm divisions and have a capacity of
5.00 cu cm.
A.h Application of Vertical Load (Figs. A-3 and A-h)
The vertical load is applied by means of a loading yoke and hanger,
shown schematically in Fig. 5. The weight of the loading yoke (consist-
ing of the hanger and the upper and lower loading beams connected by
steel cables) is balanced by adjusting the position of a counterweight
that can be moved along a beam overhead. By means of a turnbuckle, the
elevation of the loading yoke can be adjusted in reference to the load-
ing frame that supports the apparatus. To dampen horizontal oscilla-
tions of the hanger, its lower extension is guided by a bushing which
is supported laterally by three pairs of springs spaced 120 deg.
Springs of somewhat different stiffness were paired. Pads of visco-
elastic rubber (Norton Company) were inserted between a few of the
coils in each spring and also in the joints of yoke and hanger for
additional control of horizontal and vertical vibrations.
The upper loading beam of the yoke transmits the load to the load-
ing piston (3/8-in, diameter, Thomson Shaft 60 Case), which is guided
by two sets of Thomson ball bushings mounted in the piston bushing,
Fig. A-h. The loading piston fits tightly into a steel cylinder set
in the cap, Fig. A-3, and transmits the load by a line contact on a
conical hardened steel seat in the bottom of this cylinder. Because
this cylinder was added after all holes in the cap had been made, it
85

became necessary to make a cut on one side. In a new design, the adja-
cent fitting would be located differently to permit use of a cylinder
of uniform thickness.
A.5 Equipment for Saturation and Application of Back Pressure
A specimen is saturated with de-aired water, which is forced
from bottom to top into the evacuated specimen with the arrangement
schematically illustrated in Fig. 5. The de-aired water is stored in
an aspirator bottle, under vacuum, at an elevation approximately 1 m
above the elevation of the test specimen. The aspirator bottle is con-
nected to burette B-2 by a rubber hose, and the flow of water is con-
trolled by laboratory pinchcocks.
Vacuum in the specimen is produced with a Cenco-Megavac pump,
which is capable of producing a vacuum of 0.99 + 0.01 kg/sq cm.
The desired back pressure, to achieve at least 98 percent degree
saturation of the test specimens, is maintained by means of an Anteus
Pressure Regulator into which air is fed at about 5-kg/sq cm pressure.
This regulator is connected to a Heise Test Bourdon gage, G-l, gradu-
ated in 0.02-kg/sq cm divisions, with a capacity from zero to
20 kg/sq cm. The test gage G-1 is connected with a plastic tubing to
burette B-2 from which it is led to the bottom of the sample.
A.6 Application of Horizontal Force (Figs. A-8 and A-9)
A constant horizontal force is applied to the top of the specimen
by means of two Negator springs which are attached to the gyratory arm
and to the piston bushing, as shown in Fig. 4. The springs are wound
on spools turning on ball bearings, as shown in Fig. A-8. The
characteristics of the Negator springs used in this investigation
(AMETEK/Hunter, Hatfield, Pennsylvania) are tabulated in Fig. A-8.
Motorized rotation of the gyratory arm is accomplished by means
of an E3-M2 Zero-Max Power Block Assembly with a 600 H 100 Timing Belt
and flanged pulleys. This permits a wide range of speeds that can be
further extended by changing the ratio of the pulleys. The driven
pulley is attached to the gyratory arm bearing, as shown in Fig. A-9.
The Zero-Max Power Block is mounted on a support independent of the
loading frame to avoid transmission of vibrations to the specimen.
86

A.7 Gyratory Sliding Plate and Gyratory Test Starting Plate
The design and the assembly of the sliding plate for gyratory
shear tests are shown in Figs. A-4 and A-5. The sliding plate consists
of a circular, 6.50-in.-diam by 0.225-in.-thick, stainless steel plate
(lapped and polished) to which the piston bushing is bolted. The
sliding plate has slots, as shown in Fig. A-4, to allow access to the
interior of the apparatus chamber, Fig. A-ll.
The sliding plate moves between two gyratory bearings, which are
guided by the upper and lower guide rings, Figs. A-5 and A-6. Thus,
the gyratory bearings allow horizontal motion of the sliding plate in
any direction. Each bearing includes a set of forty-eight, 1/4-in.-
diam, hard vinyl acetate balls (purchased from Grafco Maptack Inc.,
Sommerville, Massachusetts). The balls are loosely held within a three-
layer retaining "sandwich." They protrude approximately 0.03 in. above
and below the sandwich. Plastic balls are used instead of steel balls
to avoid damage to the surfaces of the sliding plate and the guide
rings. The bearings are lubricated with light machine oil to minimize
sliding friction between the plastic balls and the retaining sandwich.
The separation between the lower and upper guide rings is fixed by the
height of the column spacers shown in Fig. A-12(c). The magnitude of
the friction developed in this arrangement was found by tests to be
negligible.
The lower guide ring is welded to the apparatus chamber, as shown
in Fig. A-ll. The apparatus chamber has windows and slots which permit
access to the specimen (1) for tightening column holders and hose clamp
on the cap, (2) for removing the slinky coil spreaders, and (3) for
filling and removing the freezing mixture.
The motion of the cap and the top of the specimen in gyratory
shear is illustrated in Fig. 1(b). The cap is displaced and the speci-
men is deformed in the direction of the shear force. The motion of the
sliding plate and the cap is also illustrated in Fig. A-13 where, for
the sake of clarity, the test starting plate is omitted.
The gyratory test starting plate, as shown in Fig. A-10, is placed
over the piston bushing to apply the horizontal force before starting
87

the motor of the Zero-Max Power Block. The plate is laterally guided
by two New Departure ball bearings, type R2 (Fig. A-10), which are
mounted on top of the upper guide ring at the left of the plate,
Fig. A-ll. With the gyratory arm in the X-direction to the left of
the operator, Fig. 2, the Negator springs are stretched and attached to
the arm. Then the gyratory arm is rotated by hand 90 deg, and gradually
the force of the springs is applied to the specimen. Then the lateral
guide bearings are removed, freeing the sliding plate and the cap.
A.8 Reciprocating Sliding Plate
The design and the assembly of the sliding plate for reciprocating
shear tests are shown in Fig. A-14. To the rectangular stainless steel
plate, 0.25 in. thick, the piston bushing is bolted. The plate is
guided by six horizontal ball bearings (New Departure R2), which roll
between the upper and lower guide rings of which only two corner and
the opposite middle bearings are engaged at one time for controlling
motion of the plate between the guide rings. The position of the four
corner ball bearings are adjusted by rotating the mounting pins and by
tightening the corresponding set screws (detail "A" in Fig. A-1)4) to
create a gap of 0.0015 in. between the top of the middle ball bearings
and the lower surface of the upper guide ring. The separation between
the upper and lower guide rings is fixed by the height of the column
spacers shown in Fig. A-12b.
The sliding plate is guided laterally by four vertical ball bear-
ings (New Departure R2) which are mounted on the lower guide ring,
Figs. A-ll and A-14.
Calibration tests showed that friction developed by the horizontal
and vertical ball bearings is negligible for practical purposes.
A.9 Measurement of Horizontal Displacements
For gyratory shear tests, the horizontal displacements are mea-
sured by two displacement transducers mounted on the gyratory arm,
Figs. 2(b), 4, and A-13. Transducer D-1 measures the displacements in
the direction of the gyratory arm. Transducer D-2 measures the dis-
placements normal to the direction of the gyratory arm. The probes of
both transducers are connected to a ring mounted on a ball bearing
88

which rotates around the loading piston, Fig. 4. The wires from both
transducers lead to spring contacts that in turn transfer the signal to
slip rings surrounding the apparatus support column, Fig. A-7, from
which wires lead to the power supply and the recorders, Fig. 4.
The displacement transducers (Sanborn Co., Waltham, Massachusetts,
Model 7 DCDT-500) have a displacement range of 1 in. They work with an
excitation voltage of 6 V DC and have an output of 6.8 V/in.
For reciprocating shear tests, the displacement transducers are
removed from the gyratory arm. One is mounted in a fixed position to
measure the linear motion of the cap, as schematically shown in
Fig. A-15, with details in Fig. A-17, and the other one can be used to
measure vertical displacements as explained in Section A-10.
A DC power supply (Power Designs, Westbury, New York, Model 2005)
was used to provide a stable excitation voltage for the transducers.
The output voltage of this power supply may be selected from 0 to 20
volts, and it changes a maximum of 100 microvolts when the input
voltage is doubled. The calibration of the power supply is guaranteed
to be better than 0.1 percent of the selected voltage +1 my.
The ideal arrangement would be to use one 4-channel recorder for
the two displacement transducers and the two pore pressure transducers.
However, two different models of 2-channel recorders were available
and were used as follows. The output of transducer D-1 is recorded by
one channel of a 2-channel DC amplifier recorder (Sanborn Co., Waltham,
Massachusetts, Model 320), which will be referred to as Recorder No. 1.
The output of transducer D-2 is recorded by one channel of a second
2-channel DC amplifier recorder (Sanborn Co., Model 60-1300), which
will be referred to as Recorder No. 2. Both recorders have the follow-
ing characteristics: The channels are 50 mm wide, and the recording is
made with hot wire writing arms on heat-sensitive paper. The recording
speed can be selected from 1 to 100 mm/sec. For the great majority
of tests the speed of 1 mm/sec was used. The response time for full
displacement of the writing pen is 5 msec.
The recorders were adjusted so that 1-mm displacement measured by
means of a dial extensometer, with 0.01-mm divisions, will correspond
89

to a width of 20 mm on the strip chart. For this purpose, the trans-
ducer probe was screwed into the dial extensometer in lieu of the tip
of the dial stem, with both instruments mounted on a suitable support.
This adjustment was checked after every four or five tests. At the
start of each test, the amplification dial on each recorder was so set
that the maximum anticipated deflection would not exceed the width of
the strip chart.
A.10 Measurement of Vertical Displacements
Before the transmission of the Zero-Max Power Block is engaged,
the vertical displacements are measured with a dial extensometer with
0.01-mm divisions and a travel of 25 mm. It is mounted on the instru-
ment supporting frame and measures the displacement of the upper load-
ing beam of the loading yoke with respect to a fixed reference frame,
Fig. 5 and Fig. A-17.
If desired, vertical displacements can be measured in reciprocat-
ing shear tests with one of the two displacement transducers described
in Section A.9. For such measurements, the transducer probe rests on
an aluminum plate which is attached to the loading piston, Fig. 4. To
reduce sliding friction, the probe is provided with a tip made of
Teflon. A weak spring maintains continuous contact between the probe
and the plate as shown in Fig. A-l7. The transducer is mounted on the
instrument supporting frame.
A.ll Pore Pressure Measurements
For most of the tests made in this investigation, the pore pres-
sures were measured at the bottom of the test specimen by means of
the pore pressure transducer mounted outside the apparatus below
burette B-l, Fig. 5. This transducer (General Transducer Co., Santa
Clara, California, Model GT-20) has a range of 0 to 250 psi and a
natural frequency of 50,000 cps. It measures the difference between
the pore pressure applied to a diaphragm and the atmospheric pressure.
It is used with an excitation voltage of 10 V DC and has an output of
1.75 mv/kg per sq cm.
To check the pore pressures, a second pressure transducer (Entram
Devices, New York, New York, Model EPA-125-50D) was installed in the
90

cap, immediately above the porous plate, Fig. A-3. It measures the
difference between the pore pressure applied to a diaphragm and the at-
mospheric pressure with a range of +50 psi. It is used with an excita-
tion voltage of 6 V DC and has an output of 1.97 my/psi.
The pore pressure transducer in the cap was used only in a few
tests to demonstrate that there is no phase difference in the pore
pressure fluctuations between top and bottom of a specimen. Both pore
pressure transducers are excited by a second power supply of the same
type as that used for the displacement transducers.
Because the two available recorders did not have sufficient ampli-
fication, rather than to acquire another recorder, the necessary ampli-
fication was achieved by amplifying the signal first in one channel of
Recorder No. 2, then feeding it into one channel of Recorder No. 1
where it was again amplified.
The amplification of Recorder No. 2 was set at its maximum, and
the amplification of Recorder No. 1 was adjusted to obtain a width of
20 mm on the strip chart for 1-kg/sq cm pore pressure, as measured on
the Heise Test Bourdon Gage (Gage G-1, Fig. 5).
A.12 Auxiliary Devices for Placement and Compaction of Specimens
During placement and compaction of a specimen, the slinky is
supported by the "rigid columns," which are shown in Fig. A-l.
For placing sand layers of uniform thickness, the device called
"sand placer" is used, which is shown in Fig. A-16(b). This device
consists of a levelling vane which is turned by means of a solid brass
stem. The vane is inclined at 60 deg, such that its bottom edge is
ahead of the top edge in the direction of clockwise movement. The
stem is guided by a brass bushing to which are attached four brackets
that support a thinwall brass cylinder which fits with a small clear-
ance inside the rubber membrane. To the bottom edge of this cylinder
is soldered a No. 16 mesh screen. Experience with the use of this
spreader demonstrated the need of the cutouts from the bottom of the
thin wall cylinder as shown in Fig. A-16(b). Different layer thick-
nesses can be achieved by changing the position of the stop collar
which limits the downward travel of the stem. The upward travel of the
91

stem is limited by the radial brackets. The sand placer is lifted and
lowered by means of a thread fastened to the stem and suspended from a
turnbuckle, as shown in Fig. A-16(a). To effect smooth vertical move-
ment of the spreader, the thread is passed one turn around a guide
pulley which is attached to an overhead beam.
Placement of a sand layer is performed as follows:
(1) The position of the collar is adjusted for the desired layerthickness.
(2) With a teaspoon, a prepared quantity of sand is placed in thespreader. Then the stem is rotated clockwise until the sandsurface is level. The spreader is then lifted slowly byturning the turnbuckle until all sand has dropped through andslightly below the screen. The turnbuckle is then turned inopposite direction, until the screen rests on the surface ofthe sand. The turnbuckle is then turned further until thestop collar rests on the bushing.
(3) To achieve a relative density of about h0 percent, thespreader is lifted and lowered, as described before, two orthree times. For relative densities of 45 percent to 55 per-cent, the total weight of stem, stop collar, and levellingarm is used to tamp the layer by raising and dropping thestem a specified height and transmitting the tamping forcethrough the bushing, brass cylinder, and screen to the sand.To achieve relative densities between 55 percent and 75 per-cent, a 20-g weight is added to the stem on top of the stopcollar, and appropriate variations are used in the number oftamps. For relative densities greater than 75 percent, com-paction is performed by dropping a tamping weight onto ananvil, i.e. the device shown in Fig. A-16(c). The weight islifted by hand to the desired height, which is marked on thestem, and then dropped by free fall.
92

C) 10.l/87 (3/f6')o 480
o 1 i
- -
Dril/ # 30 for screws - -
0205 to fasten to Cop I I
H-I and Base I
Drill and II
' farsc+Yscrew Separation III" - ~-~for set screw Pin LJ
0./50J I Bore 3/16" hole for 9g/de colAmn
COLUMN HOLDER (Brass,6required) I
IStainless Steel MInjoint I INo /BS (2 required lor I I-
0.300 each co/urjn).
0.375 LIJ
I0.091
-r
S toinless Steel
Pin (3 requiredfor each colurnn)
D = height of specimen
D= 1.0 In. +
e '/9" for dense sond
4 '/4' (or loose sonc
a I
V '
n -O
O
I
d
ti
SL INKY GUIDE COLUMN (Stainless Steel) RIGID COLUMNS (for temporor( 3 columns required ) suppor t of Slinhy , S tainless
Steel; 3 required )
0062 (//6")
Dr/// Ond topp00-
0.025 " Stinless Steel Plates '#7-4d 11/2"A/urninumI(I13 required (or eact, ipreader) brass screw
-C/inder ( 2 required )
0.003' Stoin/ess Steel shims
(/2 required for each spreoder) 0.125
Note : Plotes and Shims 3. 875S- are glued with OI
o Devcon Epoxy W
o. /25O. /25 0.400 O./00I
SLINKY COIL SPREADER (9 required)0-RING EXPANDER (Bross)
y
Fig. Al. Slinky guide columns, 0-ring expander and slinky coil spreader
93
0

00. >
/ For w/ve see
\ \ detail "B"
-I- --- A
N--- - '-- - - -
I /1
1\ \ Or/ll and top # 4 -406 holes to fasten
Guide Column Molders
- - 0.093
0.062
Groove forParker 2-9 0-Ring
- -- I "-20 Screw
6rc
Stoin/ess Stiel Screw
Detail "A
For screwsee detail'A
0.590 i 20/1 size Stainless Steel2 (Type 3/6) Porous P/ate
!~Dr/// and top #12-280.375 0.125 0312
BRASS 0.216
0.3/0
4--Side View "8"
Dr//l and top 5 / 16 "-/ 8tOr VOlve shown in
detail "B"
F/.2/S2i0.208
a\o- o 0200 0.485 O. /80
cve for Parker 2-6 0-Ring Thread S/i/-a/89
Conical Stainiess Steel Valve (2 requIred)
Deta/ "B"
Open spaces 0.3 in. Aigh
Section C -CDRILL AND TAP
S/Ie-I -I FOR VALVE
I I
1 DRILL AND TAP
-- - - HA- 4STO FASTENGUIDE COLUMN HOLDERS
Ocv--I_-1:_1L 1cGROVES
Side View ."'
,Sect ion A-A
Fig. A2. Base (brass)
aT.4
D. /SO
K/// / - / fi / /2
// / / Y ' \" / /
/' /' / / // / 0\ 50 / / "
/ = / / / ~/ / 7 / /I I/01/0/i / / i / _/t/
--h
O
I
---
NOTE: ALL DIMENSIN AEIINHSuATC " 1 / u u
L
r
.

0.
Ori/l and tao 3/8- ,28 az5* ./-Housing foe Col 0
bre Pressure Tonsducer-. /
/*/
/ II, ,/ \ \ V
- 7
L-- ~ Drill and1 too # 4-40
-- --- 6 ho/es to f'astenGuide Columnn Holders
J L T(HI-
Entron Pressure TransaucerEPA -/25-SOD
H-- ~ L ~ Pessue~re srtlve o'eo-- - ---
L -- ~~ -~brher 0-Ring 2-6
Assembly of Pressure Tansducer ha Retoiner
0.600
S0.370 0.160H O 375
o. /00l I I II
3/8 '-28 thread
Retainer [or Pore Pressure Transducer (fBrass)
DETAIL A
0.435 FOR VALVE SEE DETAIL B
IN FIG. A-20.375 1. 030
Stee/ Cylinder,
I iondl top#/0- 3/8"-28 tired {or retainer (see deoil A)
O{rcl ///ar -0I// / / ~ -. ~ I - ////
0 Hrdened Sleet -
/ / il-nd tap 5//6'-/8
1(' '1 (1GROOVES
.02 . 20 size Stailess steel0.,/2S (Type 3/6) Porous PlateSect/ o-a' (through Housi
1 /./BO
2. /2S I
/ /
/ / /
// // ///////// // /
/ /GROOVES
ing for Cop Pressure Tronsducer)
ote: oil dimensions are in inches.
Fig. A3. Cap (brass)
0mC
00
?.730 N

Slot to introduce stem ofdia/ extensometer to measurechange in height ofapparatusbe/ow the specimen duringfreezing Cutout for dia/ measurements 0550
during freezing to fit gyratoryand reciprocating /idiog plates. . 341 / 344
Dri// and top for 3/8'-24 bolt (4 required)
/ \ l//4"pin to center pis on bushing o
o(- )/ ~on sli/noaote+ N/ (XU (2 requ ired)
0 /
(II7I)Drill for 1/4' pinII oles lo*opart --- - - -
-- This slot and corresponding-- A
1/4" Din I-cutout was not used and may 1.18/be deleted.
t- - - -
o0 Brass spacer/ 0 /-0.437-H
2. 68 0250
I I. / 2 _ _ I . I,0.250
r I 137C
10.22 54 no/es 90
All dimensions in inches
(a) GYRATORY SLIDING PLATE (STAINLESS STEEL)
L
00
N
V.J/ bolt 0.625 Thomson boll Bushing) opar t No. XA -6/0/4 SS (2 required)
(For 3/8" diameter ThomsonShaft 60THE d)
(b) PISTON BUSHING (STAINLESS STEEL)
Fig. A4. Gyratory sliding plate and piston bushing

Gyratory Bearing Ringswith Plastic Balls
Gyratory Sliding-/ -Plate
-- Upper Guide\\ /Ring
Spacer/\
Columns _ - O
\ / \
/'
/c) \0
Notes: 1. See Fig. A-6 fordetails of gyratorybearing rings.
2. All dimensions arein inches.
SpacerColumns
ryx N-
I.-1'.
Piston Bushing
3/8"-24 Bolt
Gyratory
SliineUpe
I0I.___________________________-_______-_______________
GyratoryBea ringRings
Gyratory erBearing Guide
Rings Ring
Fig. A5. Assembly of gyratory sliding plate, gyratorybearings and piston bushing
I\ I
n
r
i
r
.,

6. 000
A ODD
-IP. A S T
PLA N A ND SEC TION
I. 250-J
GYRATORY
SLIDING VINYL PLASTIC BALL BEARING
PLATE / (4s REQUIRED FOR EACH BEARING)
0.160
TEFLON SHEET
s 0 / LUCITE
TEFLON SHEET
D.P50 /LOWER GUIDE RING
DETAIL OF GYRATORY BEARING RING
Fig. A6. Gyratory bearing (2 required)
I
"
O N
O O
C"
1
S-- , 5" 7.S" 75 " r : -
1
-is / 1
'1.5"
>S"
\ s
n
I / /
"\
\
i'
r
y
1
(
r
////// \\\\\
"S .
.s< S 1. 1
0.625 "
,n, " r < " s c . S z .5 .,- j
X81 i , " +,'1 18 ,
f

/. 062
//8" hole for /8' plastic tubecarry/ng pore press ure AN/i and top #10-32 for screwstransducer wires to fasten Base Plate2 ho/es 120* apart 3 holes /20 port
- .. /4" hole for brosstube leading into
b'ose
Mole to (it .D. of BalBearing Hoover No 52/5
(2.952t) of Gyro story Arm
Dr//l and'top /4x-20for screw to fasten Bose
0
10.200
2" pipe thread screwed
2000 to column
3.6(00
(B) TO0P O F SU P POR T ( BR ASS)
I_
m
O
2T
- -O
P
2. 000
L3/64'ho for dispitronsdu er wires
/2 holes 90'opart-"
I. 750
0.2 so --
2" pioe thread
/D of .boeli te cylindermade to fit 00. o Column
~-Bross ring for sprirng contacts(/2 required )1.O. = 2.750 in.0.0. 2.625/n.w/d th 0./25 in.
Steel p/ate 7' /0"Weld7
7. 000
(A) B A S E A N D COLUMN OF SUPPO R T
Fig. A7. Apparatus support column
0
N
a937

0.187 Slot to permit using different Springs
HII
00.200
- \ Weld
1'\ Hoover Boll Beoring
No. .5206-FFSPOOL. (see N.50 F
.- - detail "A")Dril/and top #5-40
Bross N E G ATOR SPRING-- as ~0I72. 41$ 0.375-J-0./87
0
-i rr -D \I II \
- r- -C1.DI I ' I ' II
Spacer __.12_
.252. 69/ /. l25
Drill and tap 1/4"-20for 6 in. long 1/4 in.threaded rod 0375
ASSEMBLY
AND
.375
I. 700
OF NEGATOR SPRINGS
SPOOL HOLDER
Note All dimensions in inches.
MALL MARI N IG TO T R ANSWER
SPRING FORCE TO PISTON BUSHING
(TO FIT LOOSELY OVER PISTON BUSHING)
Data Perto/ning to detoil "A"
Ax IC
Boll BeoringSpacer ~Bross Spool
HI"\ \\ ~b\ \\we
Bo/I Bearing L
Pin Spacer ping
Thread /-32
DETAIL "A"
(BALL BEARING FOR SPOOL)
Ronges ofNegotor Springs Bo// eo rlng Spool A xle Spacer Ring
(Width) Type 0.0. 1.0. Wb 0.0. I.D. Wc 0/a. H O.D. /.D. L
0.50" to 0.75 R M B 0.5000.50"_t_0.75 UL Z 8016 X 0.500 0.250 0.187 0.873 0.400 0.625 0.250 '.532 0.375 0.250 0.440
/.00" to /.25" MRC R6 0.875 0.375 0.2/9 1.400 0.500 /.000 0.375 /537 0.437 0.375 0.250
Fig. A8. Assembly of Negator springs

Slide rod through No. F hole and screw end into 1/4 in.tapped holes of spool holder; then stretch springs byturning wing nut until holder meets gyratory arm;finally, attach spool holder with No. 5-40 screws to arm.
Lu /4"-20 threaded rod
wing nut 6.0
5. 25
F~t I. .mvke to tit t g ht o n Hoover Bo/IBeartng No 52 /S0
A
l
' I j
02 0
LA
OTj
6./8 7
9. 000
/ \ I
-I- I
5 0FIatst rw( euie 1 1 'OOf
I \
/ \'%I
N4
O4
# 30 fri// for disoplcement tronsdv erwires /2 holes 3'aort
Fig. A9. Gyratory arm (steel)
F Dr///o -io~1
0N4
Li
A
#30 Drill# F Dril
0h4
14)1 .
N'
A1
J
1.000
coSection A -A
c
010101
L- iM/NG BELT PULLEYTL 40 H /00
1 _ //
S 5- 0 Flat set screw (B requ/r 5 oport )
/A 1V 1 w i i

8.000
2.500
H- I
I I
'I I
{0 -LoateralO Bearng
Attached to ..Upper Guide Ring
H0N\
- "
I '
- /1/Guide
. fto fit
3.750
0.187
/.500 Note: Two of the four lateral guide bearings that aused for the reciprocating sliding plate canused as lateral guides for the test startingplate; use No. 5-40 RH screws 7/16" long to
1.825 attach lateral guide bearings to upper guide
BUSH0IN 010ring for gyratory tests.
rebe
Fig. A10. Test starting plate (used at start of gyratory shear test)
00over p/s ton bushing
I
_
1
L

0208 0.208
Dr///a nd top # 5-40/230/es Threded ho/es to otfac \n-/a -- -eroiaude bearirs Dri and tap #8-32
0.35'I 6 holes 60Opart
- .354 ----lole for centering Screw
Dri n tao #5-40
Drl/'and tap "---- - -- %ro /2o- fp}~ ~~~~~~i~
for s yews to 1
c ent r cop
Q---® ------ - - - 35.21 _i 220
Dri// # 30 --/ -- O6E/es 6o oport -- .354 2.428 wndow 2.428
8.000
5.5000.25 I
7.750
UPPER GUIDE RING (STAINLESS STEEL)
8jIOO -J
7. 50I -
5. 500
Lower Suide Sing
1Y N0./65
O. I0Dr/// and too 1/4"-20A ,/f to Too/en gross Post
/ri// an d tao #8-32_.Groove Detail 6 o/es 60*oport
- /
.o. o'
5000
I -I - ---- N--6.000
h)
00)
3s/ots for fig / ten/ng
9 iide co/u m n o/c/erss paced /20 \
- - 7 KI O.25 O
window O.75"# for I Onr I Of 5tr0tightening hose I. 70 windows - -
copfor removingslinky spreaders
1/4" 0 Threaded hole for inserting elbow-shapedstand pipe to (1) maintain freezing mixture oflevel of too of bose, and (2) drain the mixture
Front View Section
4. 3 75
For deto/s of column
snocers see Fig. A-12
One of three holesLor screws to center cap 0O./25 0.250
----- 1
0
0
0
0)
We 1
#30 Drill 6 holes60* apart
5."000
H-6. 000
APPARATUS CHAMBER WITH
LOWER GUIDE R INO0 (STAINLESS STEEL)
BASE PLATE
(STAINLESS STEEL)
Fig. All. Apparatus chamber, base plate for chamber and guide rings
00
0.125 0250
F


0 6 4 0 H
0 .375
I To./ 75
3.200
1.3/0 0.950 0.500 0.240 02
" I/4*-28 thread
Two lock nuts on each screw are so adjusted that the end of the screwdefines the correct position of the cap. The screws and the holes inthe chamber wall are numbered 1 - 2 - 3, and each screw must beused only in the hole with the same number for which the lock nutsare properly adjusted.
a) SCREW FOR CENTERING CAP (stainless steel, 3 required)
-#30 drill --
~I flb) GUIDE RING SPACERS FOR USEWITH RECIPROCATING SLIDING PLATE
oT
LfHc) GUIDE RING SPACERS FOR USEWITH GYRATORY SLIDING PLATE
Fig. A12. Guide ring spacers and horizontal screws to center cap
105

Path of Center of Slding Plote
D/sp/acemen tTransducer D-2
Support P/ate ,BracKet supportiflg D-2
Guide Rings 7 '
S/id/ng P/a t e-----
-Motion of Gyro tory0.1
Gyro tory 8eorlrnDsp9emn
TransducerD-1 0
G yrolory Arm
Ne90 tor Springsand Holder
Var/o ble Transm/ss/o n
Fig. A13. Arrangement for measuring displacements in gyratory shear tests
6yrotory
VArm

0Lateral Guide Bearing(l9reg'd; some as Ihoseused or gyrotory sheartests; see detail "B"and Fig. A-IC)
/ Siding
d \Q
y /\ rLong/tud/n\ Lt B eorings C
Par p/n ofIseedetoi
o 11 1
Slot to introduce stem ofdial extensometer toneosure\change in height of opporatusbe/ow the specimen during freezing
0 -
l/9" Din to center k -- 1./ Guide 4 pedestal
oT 0br,11 and top 3/8"- 24( ___(_ r .t14 required )
o. 2 .1
- -T
..1
1/8" hole to insertpin [or Longitudinal guideBearing
II I
L-'-
Drill and top -#5-40 [or set screw
(4 required)
-- -7.7/ '7 0.250,0.42sITT
RECIPROCATING SLIDING PLATE
(STAINLESS STEEL)
ASSEMBLY WITH UPPER GUIDE RING REMOVED
Lateral GuideBearing
Column Spacer
Mt--
Piston Bushing
73/8 "-4 alt Sliding Piate
Upper . Guide Ping
Longitudinal G uidBearings
I0.391
Lower Guide fing
0/25
N
O1
K_E
Pin for Long/tudino/ Guide Beoring(stainless steel, 4 req'd)
D E T A I L "A'
0208 0.579
0J25
I--0.250
Pin for ball bearing
0.1871 02/902910 /870.099
t_ /. 000
Lateral Guide Bearing Support(stainless sfee/, 4req'd)
DETAIL "B"
Fig. A 14. Assembly of reciprocating sliding plate, lateral guide bearings, and piston bushing
6.500
6. 250
-H
L
3.062
3.3 2
i /
Note: all dmensions are in inches.
0~ 1
5.q75
S. 2 S
Y
I YL_
f


Fixed DisplacementTransducer
Lateral Guide with~BoleringSupport P/ate
B etVorio ble Transmission
GuidepringL-_.
SI/ding P/a te- -
~ ~ Motlon a( Gyro tory Arm
L ongitudinal Ba/I ibearings
Siding P/ate Gyrotory Arm
Negator Sprirgasand Holder
Fig. A15. Arrangement for measuring displacements in reciprocating shear tests

8 Cu/outs spaced a5 j
0.7s In. wide, 2 S in. high
rnbuck /e
de Pulley
Thr eo ad
0
Spreoder
Membrane
-SIInky
---- Base
RadialBraocke fs
0;
~T~
0a~
O./87
Rod/o/ Brocket (Bross)
h Brass cylinder2 -__i 0.070 i. thick Wa//
- djvstoble
0.25 2. 500 .TI eight of Leveling Vane
No /6 mesh scree by means of Stop Col/or.2. 640"
'.9h~
No /6 mesh screen(So/dere 1 to bobornof brass cylinder)
Leveling Vane (Brass)(0.020" thick, o./5' wide,inclined in direction of travel)
Bross stem3/52" dio.
I&W
Stop Co//or (0.275'0.0.)#4-40 set screw
B
Bros s Bush/ng ( 0.125"' .D., 0./oo"/.D.)
/.
/
Ar
0.e4
TampingWeights
H Weight
40.0 mm ^~53 nm80.0 mm -/08 gm
Tomping Weight
TH
l/4"-28 -2 set screw
N
'-//4"-20 threoa(Dri/ ond top in onvil)
(b) SAND PLACER (Bross) (C) ANVIL AND TAMPING WEIGHTS (Aluminum)
Fig. A16. Devices for placement and compaction of test specimens
Tv.
G uic
(a) ASSEMBLY
_I_1tItt tit
_..
I
)D i
--
iii-

V ~8.0 ]
II-- I - ---- / - 7 Y oxis
IS.Oham--Plon (without frasducers)I-
Screw this end to firedoverhead beam to
0.so
Alum/num
.50.0.75x 9.5'
Hof/
Note : All dimensions are in inches
AI.
r
{
Aluminum o.5o .0.75 A 8.c
3/8- /6 threaded rods
Drill and top //4'jZofor screw to Itor'
Ouxiiary dial exlensorne
1 _________1 1 1
2.0
~t
insert r
e xrenson(1,ix with/ /
, (Vertical Disp/oj Transducer
Holder
cemen
tforrn
O.
S eci%, n -1Q
Fig. AlT. Supporting frame(2) for displacement
for (1) dial extensometers and
transducers when used
111
terl s t cae~w). we& spring to/rroinloin con trcf
I of probe on ploLeve/ of plotfcrm
(see 1Fig. 4)
dir (aluminum)
- - - «w lrtsoJsducmr pnibe
lorizonla/ D/.splacerent to cVlnd- to measureTransduc'.r. horizons/ displacemerts (see Fig. 4)
Side View
" "v"vG


In accordance with letter from DAEN-RDC, DAEN-ASI dated22 July 1977, Subject: Facsimile Catalog Cards forLaboratory Technical Publications, a facsimile catalogcard in Library of Congress MARC format is reproducedbelow.
Casagrande, ArthurGyratory shear apparatus design, testing procedures, and
test results on undrained sand / by Arthur Casagrande andFranklin Rendon, Harvard University, Cambridge, Massachu-setts. Vicksburg, Miss. : U. S. Waterways Experiment Sta-tion ; Springfield, Va. : available from National TechnicalInformation Service, 1978.xiii, 111 p. : ill. ; 27 cm. (Technical report - U. S.
Army Engineer Waterways Experiment Station ; S-78-15)Prepared for Office, Chief of Engineers, U. S. Army,
Washington, D. C., under Contract No. DACW39-74-C-0026.Harvard Soil Mechanics Series No. 89.References: p. 50.
1. Cyclic load tests. 2. Gyratory testing machines. 3. Sands.4. Undrained shear tests. I. Rendon, Franklin, joint author.II. Harvard University. III. United States. Army. Corps ofEngineers. IV. Series: United States. Waterways ExperimentStation, Vicksburg, Miss. Technical report ; S-78-15.TAT.W34 no.S-78-15