Embed Size (px)
Citation preview
A Novel Grid-based Visualization Approach for Metabolic Networks
with Advanced Focus&Context View
Markus Rohrschneider ¹, Christian Heine ¹,
André Reichenbach ¹, Andreas Kerren ², Gerik Scheuermann ¹
¹ Department of Computer Science, University of Leipzig, Germany
² Department of Computer Science, School of Mathematics and Systems Engineering, Växjö University, Sweden
Markus Rohrschneider
A Novel Grid-based Visualization Approach for Metabolic Networks with Advanced Focus&Context View
2
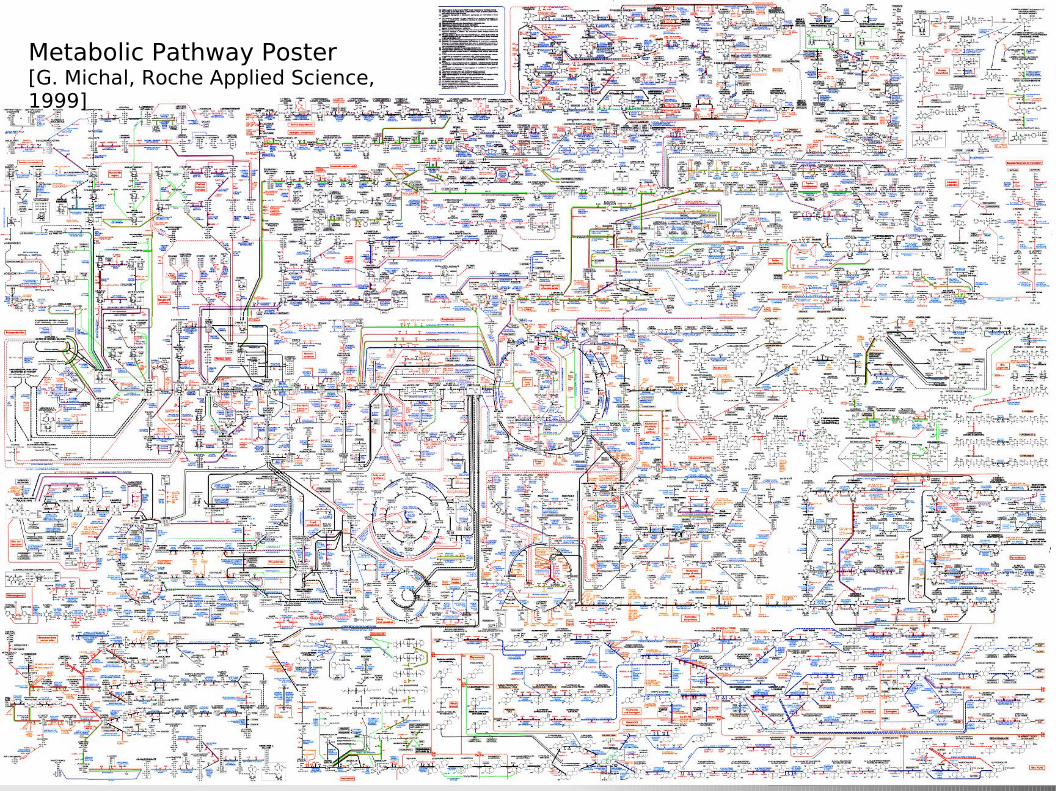
Metabolic Pathway Poster[G. Michal, Roche Applied Science, 1999]
Markus Rohrschneider
A Novel Grid-based Visualization Approach for Metabolic Networks with Advanced Focus&Context View
3
Markus Rohrschneider
A Novel Grid-based Visualization Approach for Metabolic Networks with Advanced Focus&Context View
4
Markus Rohrschneider
A Novel Grid-based Visualization Approach for Metabolic Networks with Advanced Focus&Context View
5

Markus Rohrschneider
A Novel Grid-based Visualization Approach for Metabolic Networks with Advanced Focus&Context View
6
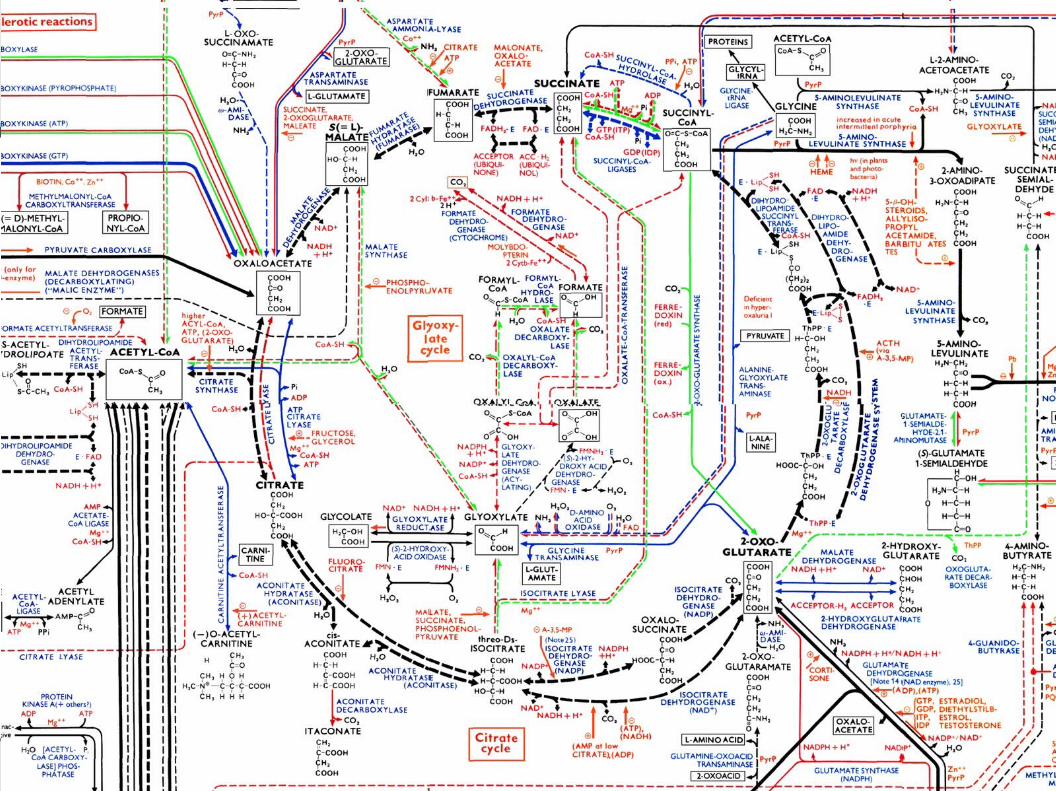
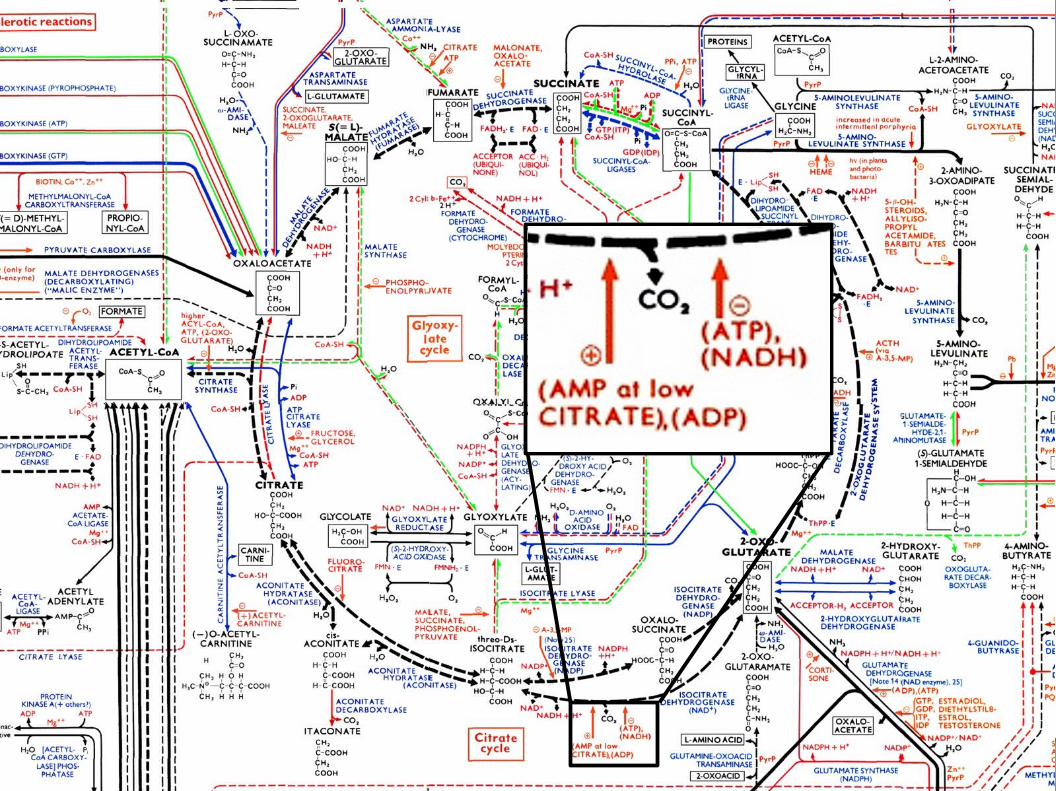
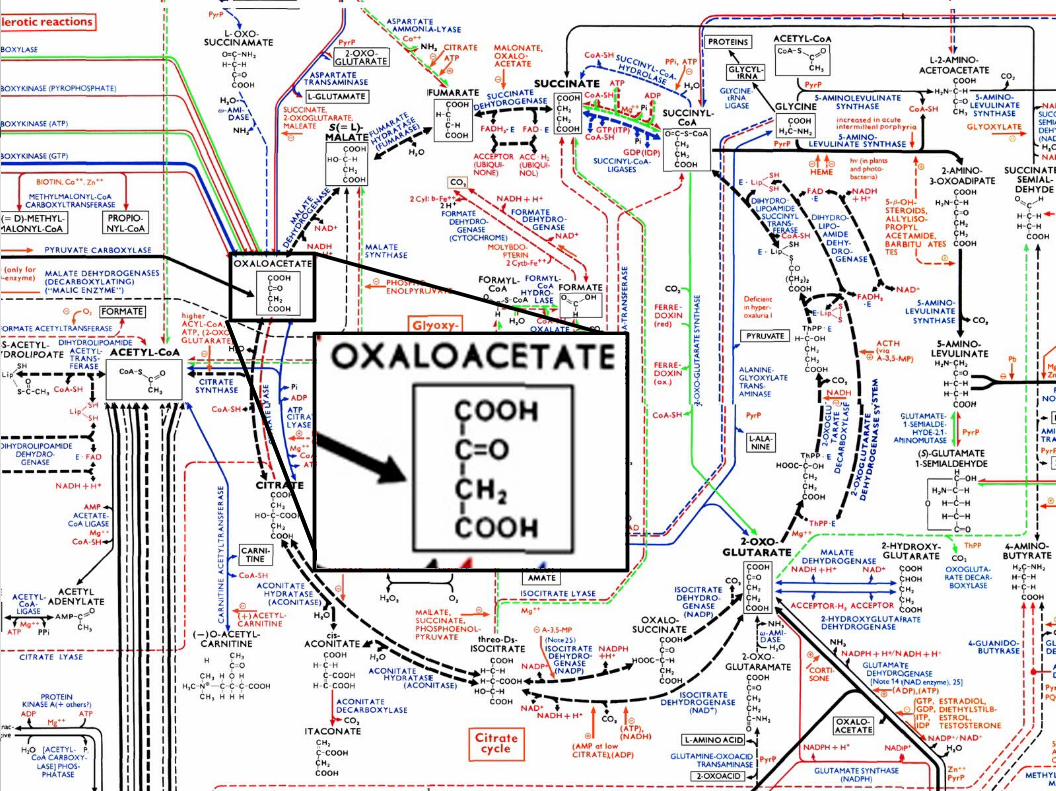
Metabolic Pathway Poster[G. Michal, Roche Applied Science, 1999]
Markus Rohrschneider
A Novel Grid-based Visualization Approach for Metabolic Networks with Advanced Focus&Context View
7
Outline
(1) Introduction
(2) The Table Lens Metaphor
(3) Hierarchical Orthogonal Grid Layout
(4) Interaction Techniques / Implementation
(5) Conclusion
Markus Rohrschneider
A Novel Grid-based Visualization Approach for Metabolic Networks with Advanced Focus&Context View
8
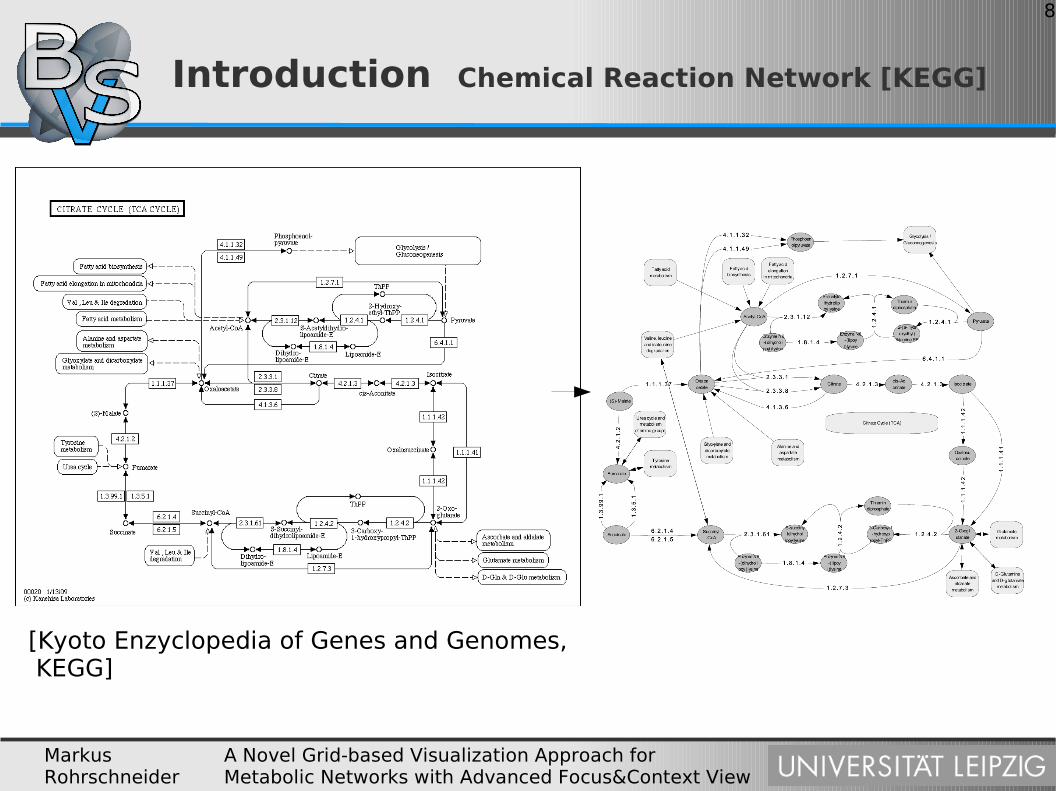
Introduction Chemical Reaction Network [KEGG]
[Kyoto Enzyclopedia of Genes and Genomes, KEGG]
Markus Rohrschneider
A Novel Grid-based Visualization Approach for Metabolic Networks with Advanced Focus&Context View
9
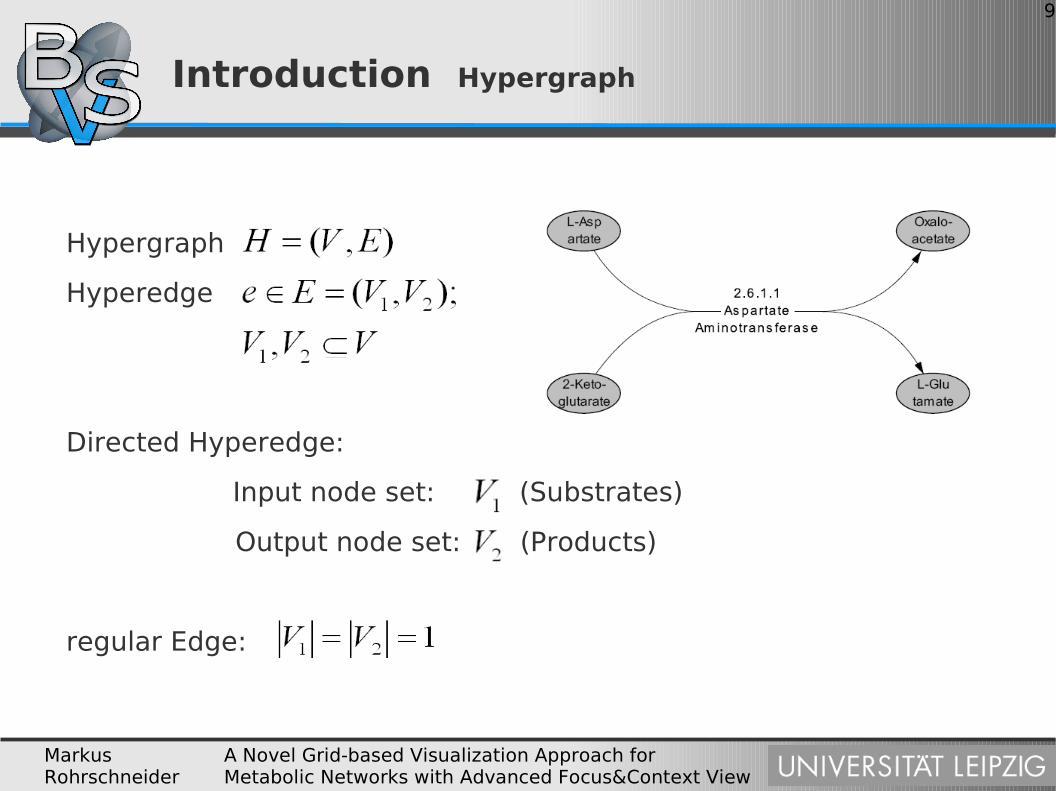
Introduction Hypergraph
Hypergraph
Hyperedge
Directed Hyperedge:
Input node set: (Substrates)
Output node set: (Products)
regular Edge:
Markus Rohrschneider
A Novel Grid-based Visualization Approach for Metabolic Networks with Advanced Focus&Context View
10

Markus Rohrschneider
A Novel Grid-based Visualization Approach for Metabolic Networks with Advanced Focus&Context View
11
Markus Rohrschneider
A Novel Grid-based Visualization Approach for Metabolic Networks with Advanced Focus&Context View
12
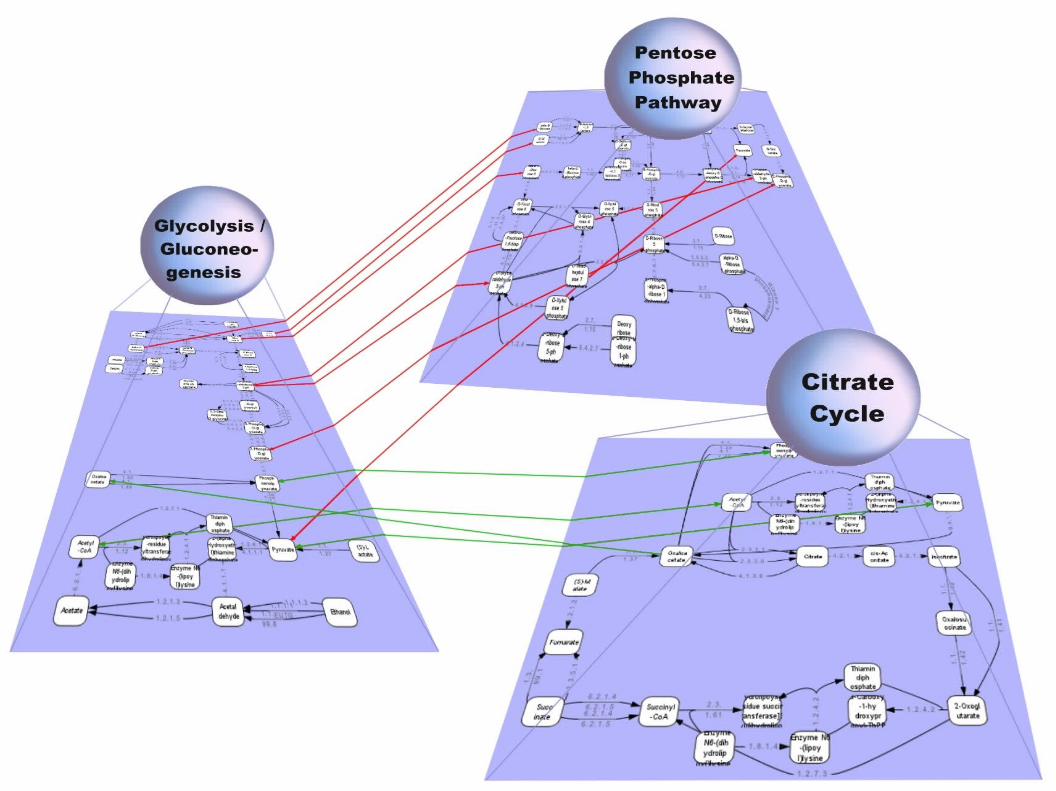
Introduction Hierarchical Hypergraph
Hierarchical Hypergraph
● Top layer: Metabolic pathways
● Bottom layer: Chemical reactions + compounds
● Construction of two metabolic network graphs
● Carbohydrate metabolism
17 expandable + 37 referenced pathway nodes
649 substances, 814 reactions● Complete metabolism of generalized eucaryotic cell
135 expandable + 17 referenced pathway nodes
~4200 substance nodes, ~4800 reactions
Markus Rohrschneider
A Novel Grid-based Visualization Approach for Metabolic Networks with Advanced Focus&Context View
13
Introduction Requirements
Requirements for navigating large graphs:
● Clustering: Partition of the node set
● Node duplication if occuring in two different clusters
● Node expansion / collapse while preserving the Mental Map
● Focus&Context:
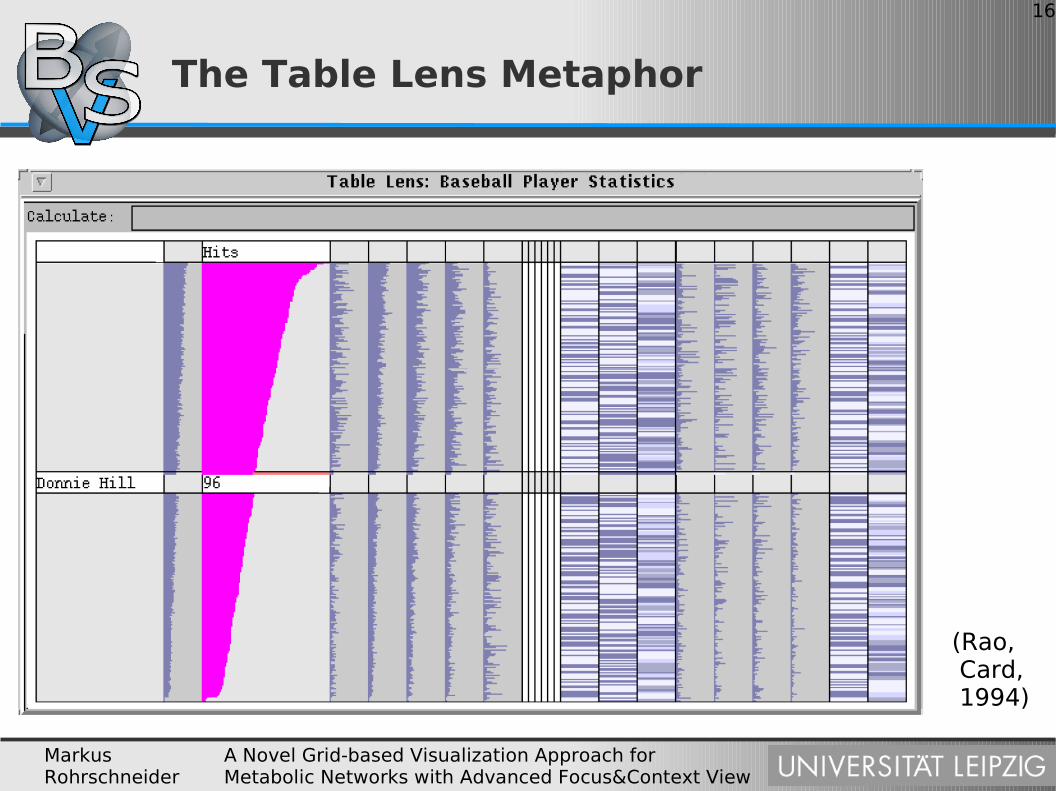
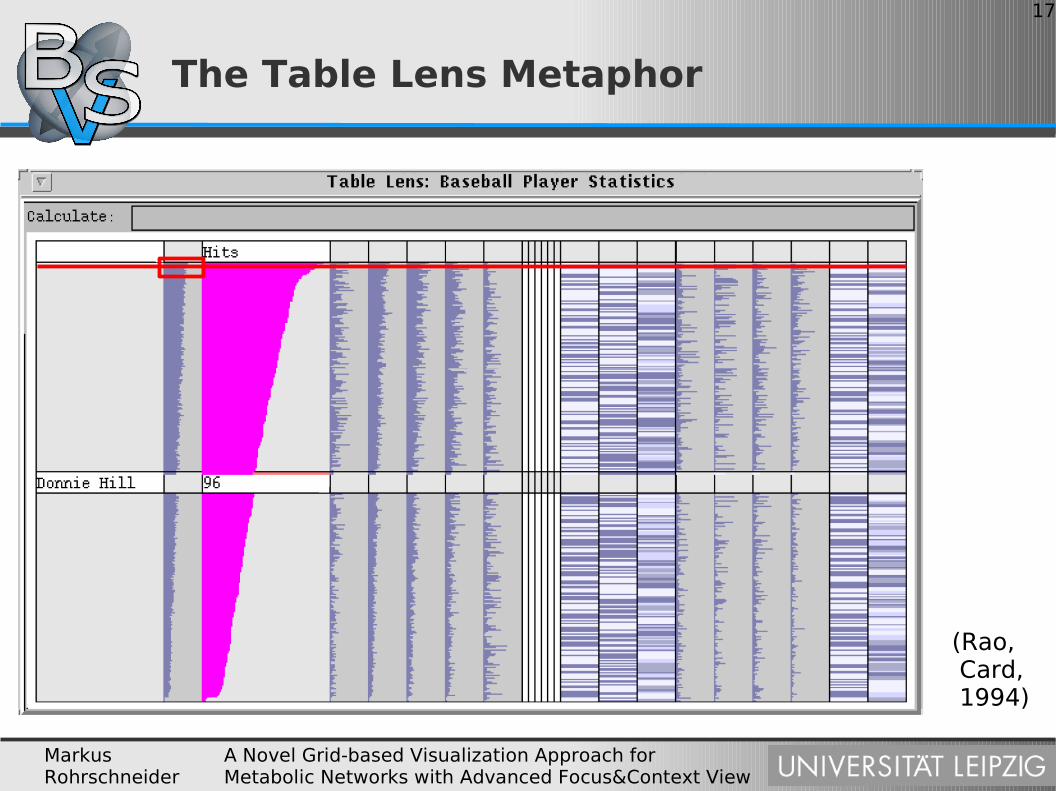
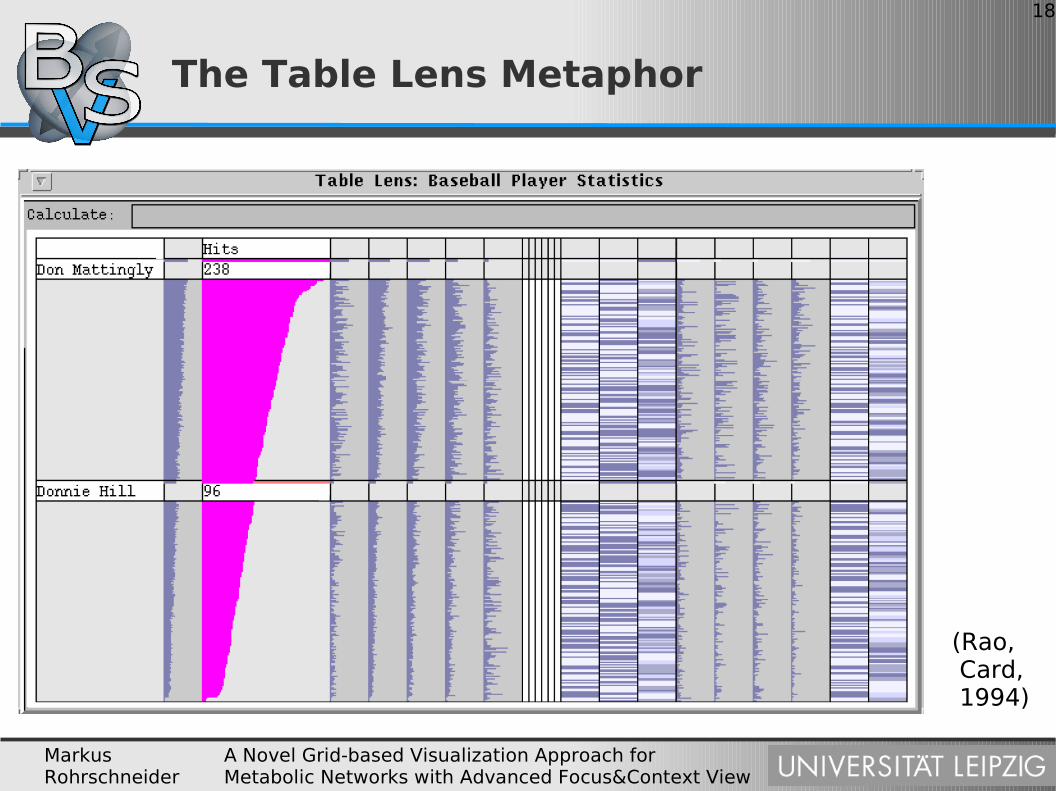
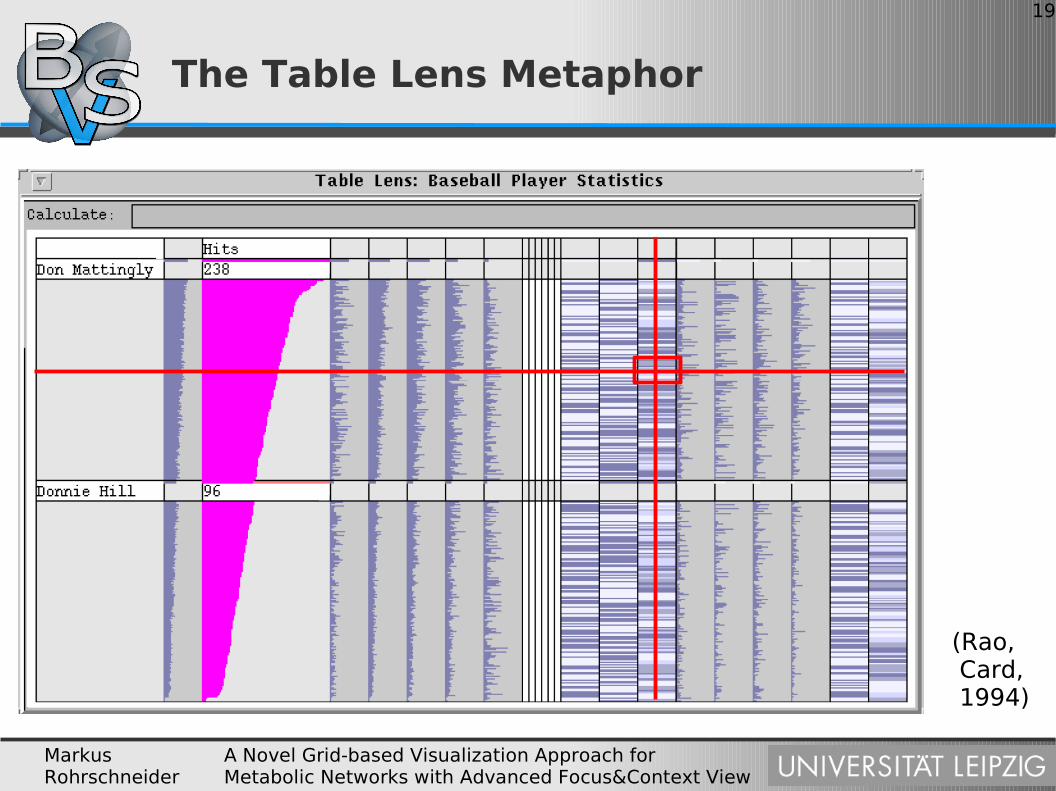
Table Lens Technique [Rao&Card, 1994]
Markus Rohrschneider
A Novel Grid-based Visualization Approach for Metabolic Networks with Advanced Focus&Context View
14
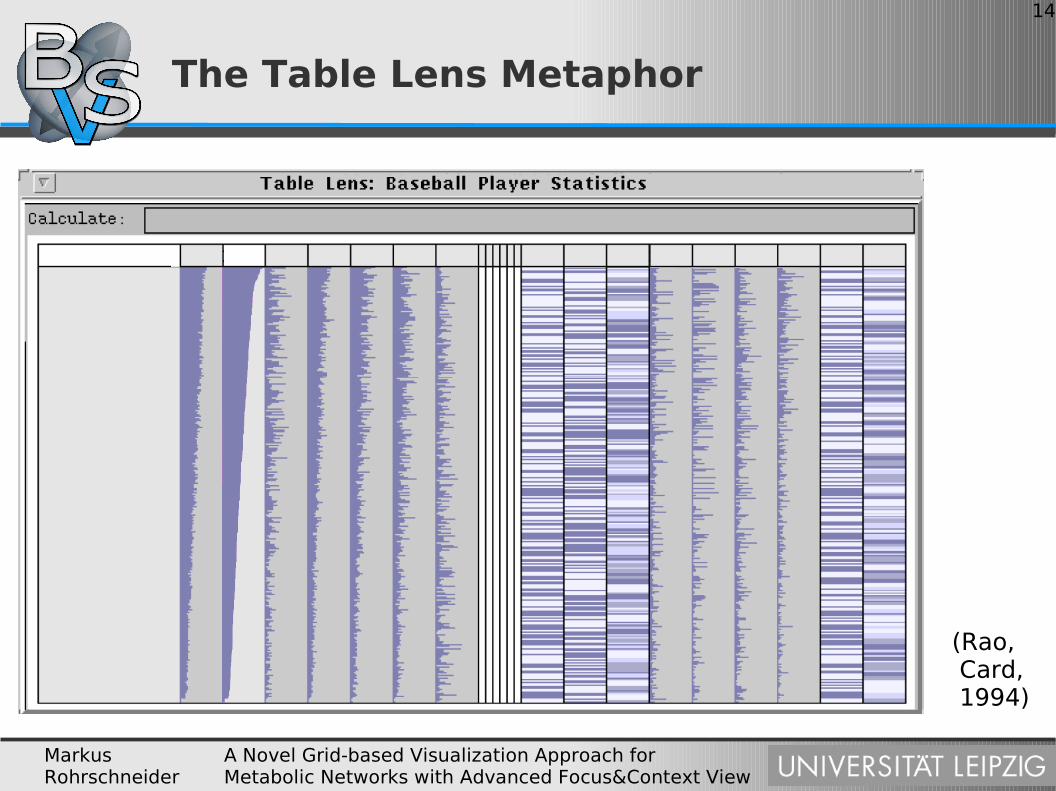
The Table Lens Metaphor
(Rao, Card, 1994)
Markus Rohrschneider
A Novel Grid-based Visualization Approach for Metabolic Networks with Advanced Focus&Context View
15
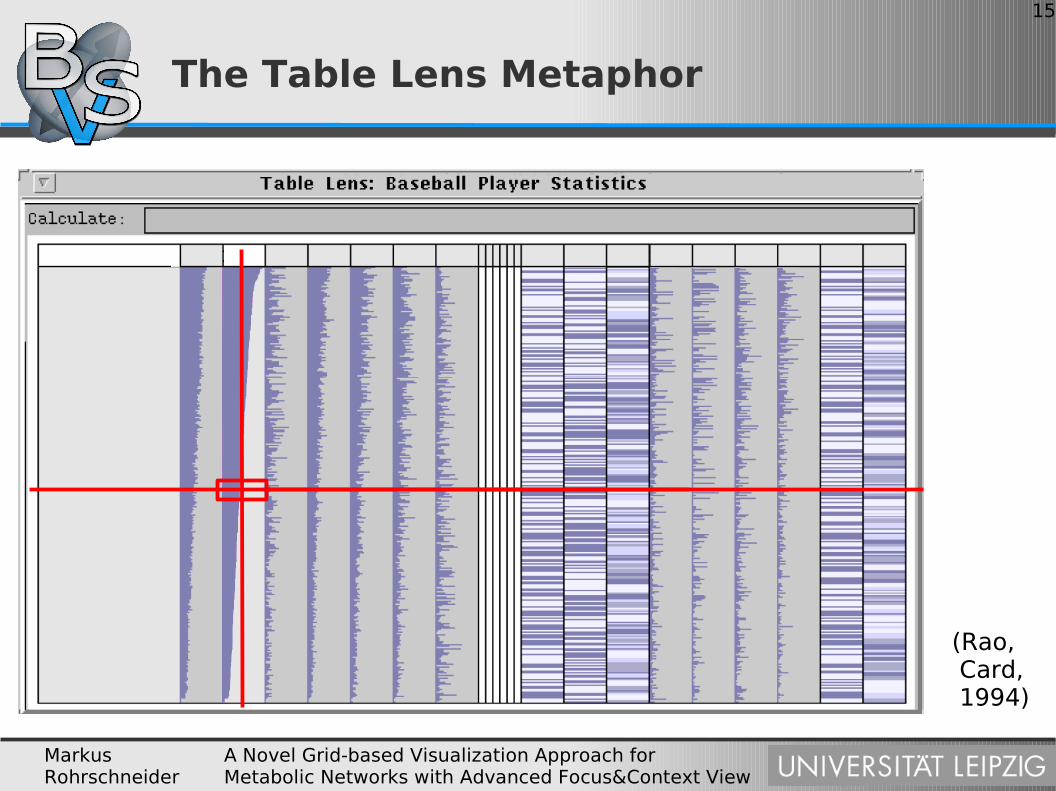
The Table Lens Metaphor
(Rao, Card, 1994)
Markus Rohrschneider
A Novel Grid-based Visualization Approach for Metabolic Networks with Advanced Focus&Context View
16
The Table Lens Metaphor
(Rao, Card, 1994)
Markus Rohrschneider
A Novel Grid-based Visualization Approach for Metabolic Networks with Advanced Focus&Context View
17
The Table Lens Metaphor
(Rao, Card, 1994)
Markus Rohrschneider
A Novel Grid-based Visualization Approach for Metabolic Networks with Advanced Focus&Context View
18
The Table Lens Metaphor
(Rao, Card, 1994)
Markus Rohrschneider
A Novel Grid-based Visualization Approach for Metabolic Networks with Advanced Focus&Context View
19
The Table Lens Metaphor
(Rao, Card, 1994)
Markus Rohrschneider
A Novel Grid-based Visualization Approach for Metabolic Networks with Advanced Focus&Context View
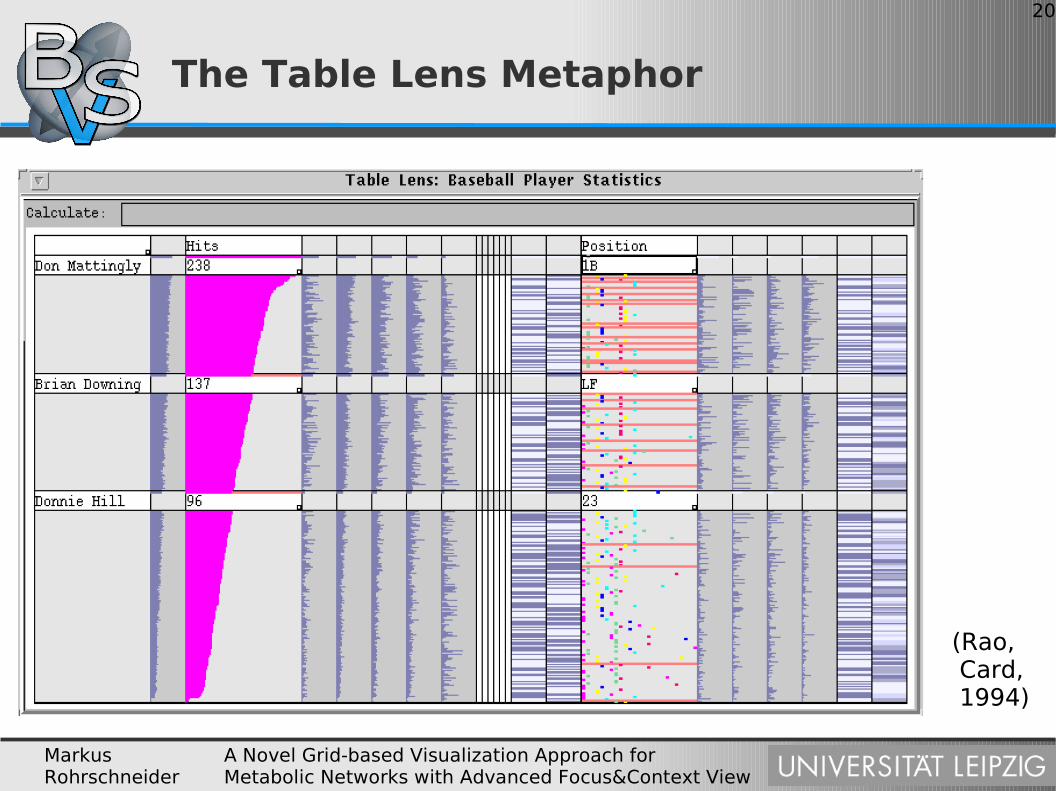
20
The Table Lens Metaphor
(Rao, Card, 1994)
Markus Rohrschneider
A Novel Grid-based Visualization Approach for Metabolic Networks with Advanced Focus&Context View
21
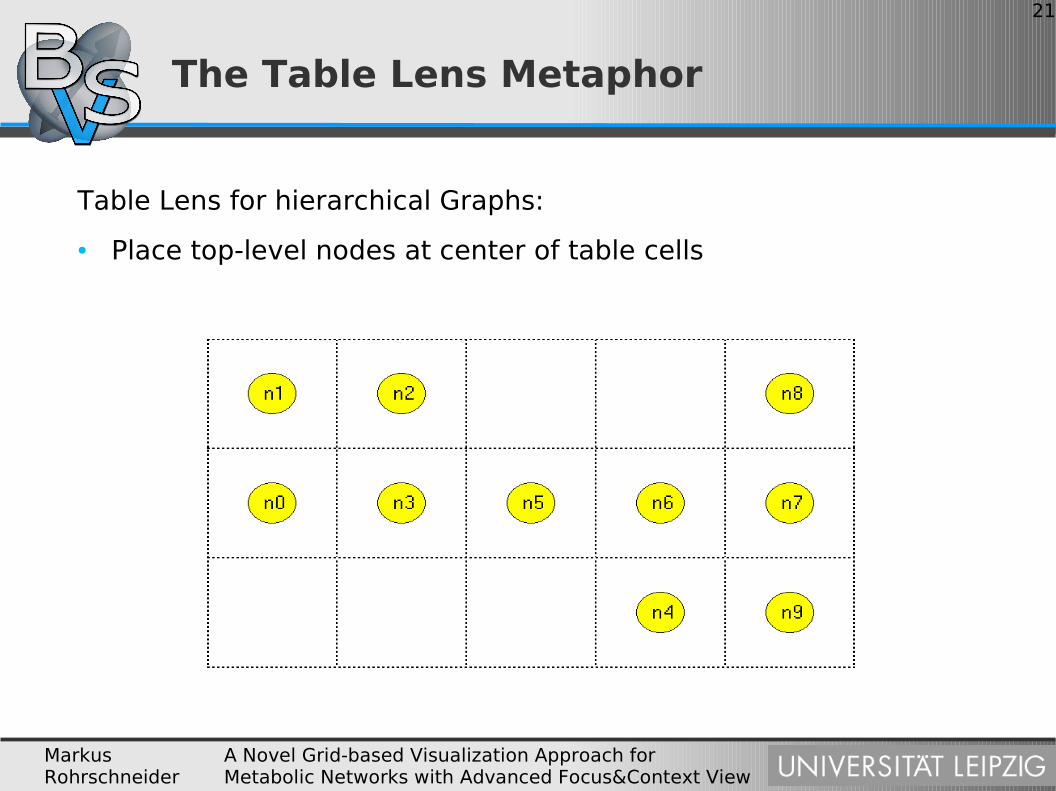
The Table Lens Metaphor
Table Lens for hierarchical Graphs:
● Place top-level nodes at center of table cells
Markus Rohrschneider
A Novel Grid-based Visualization Approach for Metabolic Networks with Advanced Focus&Context View
22
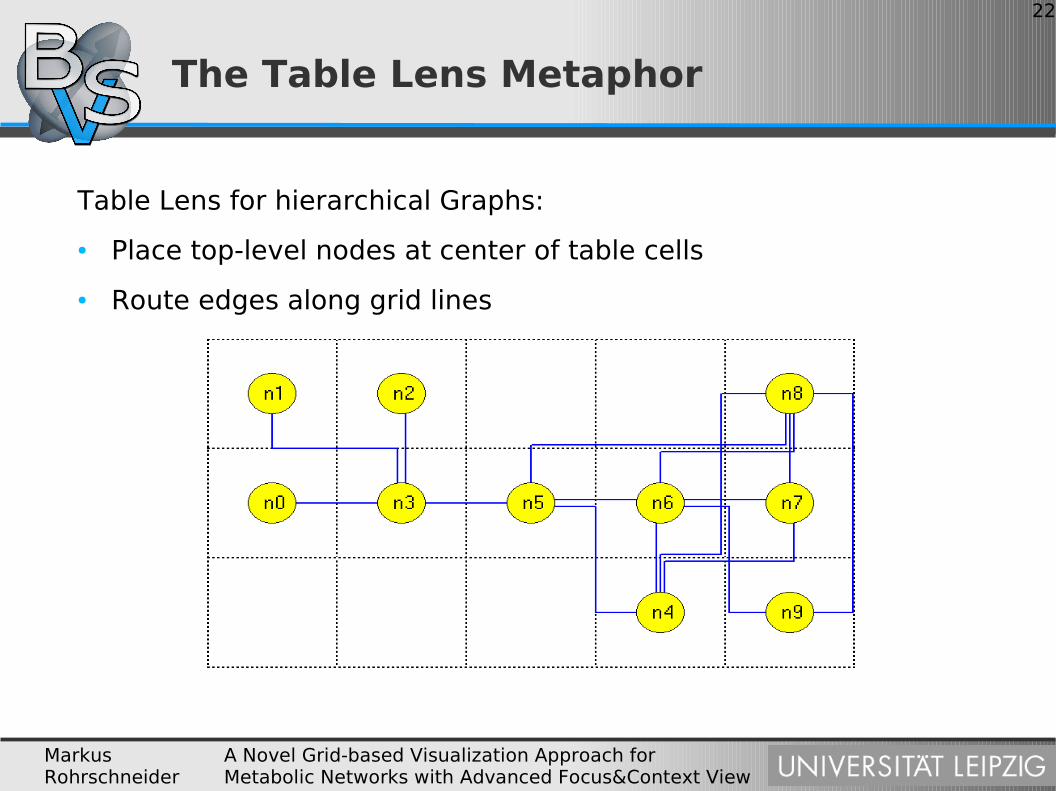
The Table Lens Metaphor
Table Lens for hierarchical Graphs:
● Place top-level nodes at center of table cells
● Route edges along grid lines
Markus Rohrschneider
A Novel Grid-based Visualization Approach for Metabolic Networks with Advanced Focus&Context View
23
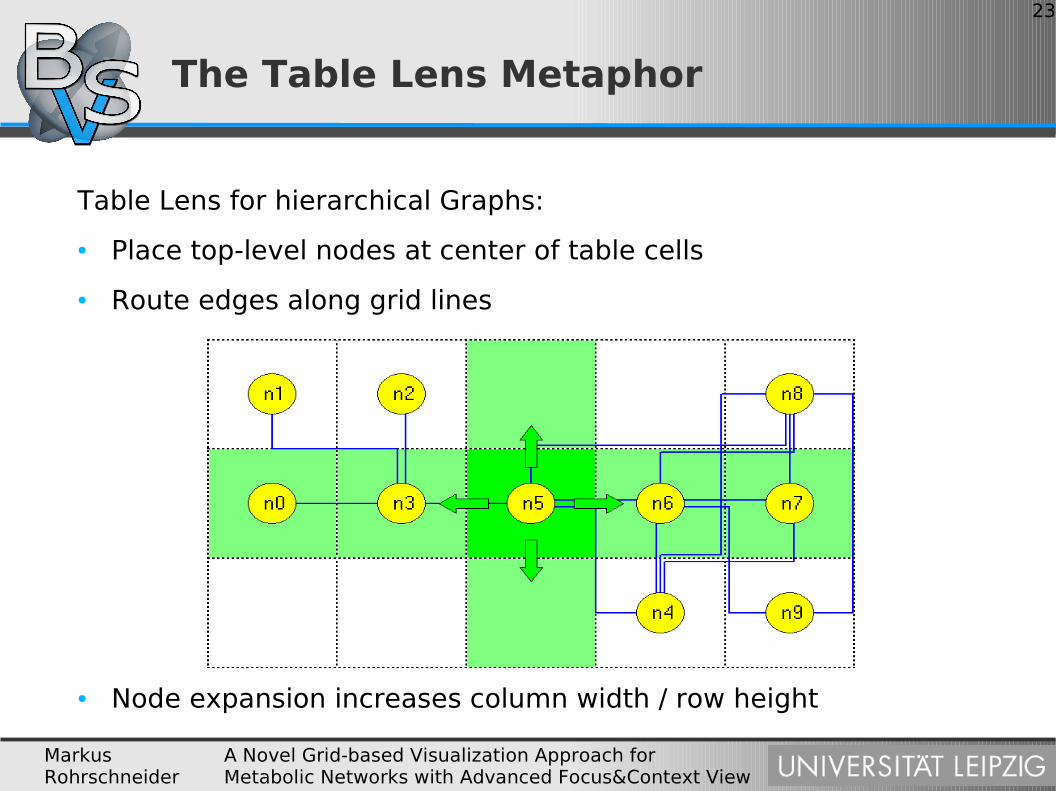
The Table Lens Metaphor
Table Lens for hierarchical Graphs:
● Place top-level nodes at center of table cells
● Route edges along grid lines
● Node expansion increases column width / row height
Markus Rohrschneider
A Novel Grid-based Visualization Approach for Metabolic Networks with Advanced Focus&Context View
24
Hierarchical Orthogonal
Grid Layout
(1) Vertex Placement
(2) Edge Routing
(3) Edge Bundling
Markus Rohrschneider
A Novel Grid-based Visualization Approach for Metabolic Networks with Advanced Focus&Context View
25
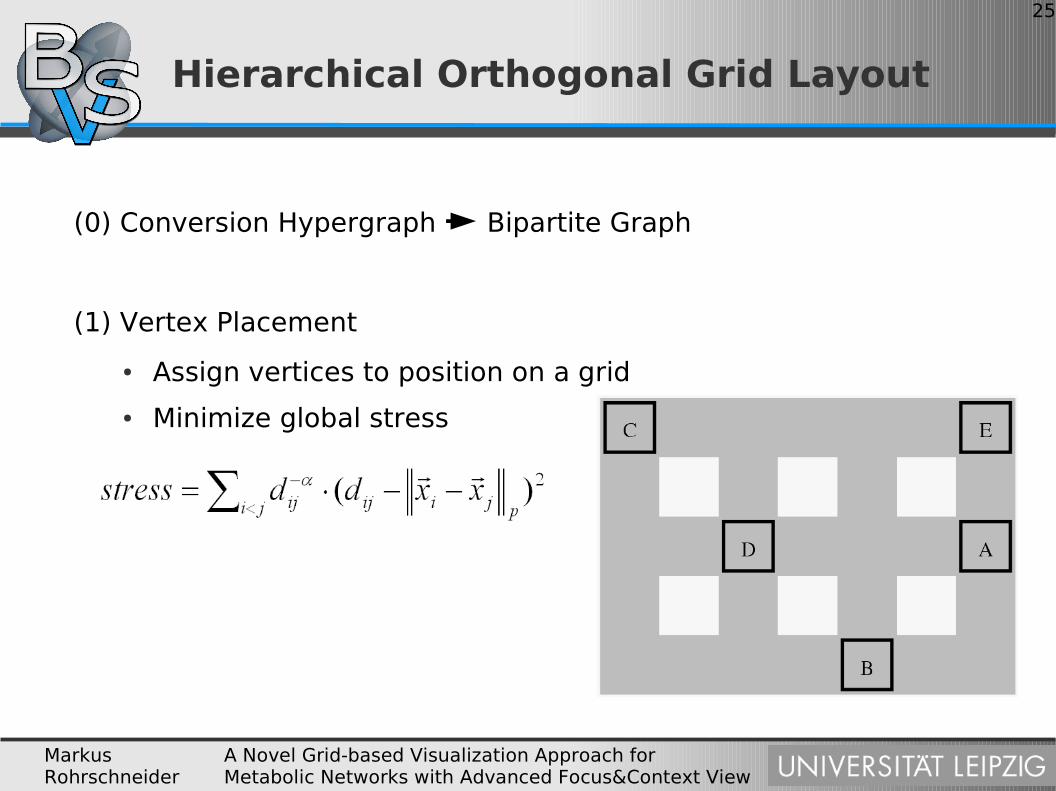
(0) Conversion Hypergraph Bipartite Graph
(1) Vertex Placement
● Assign vertices to position on a grid
● Minimize global stress
Hierarchical Orthogonal Grid Layout

Markus Rohrschneider
A Novel Grid-based Visualization Approach for Metabolic Networks with Advanced Focus&Context View
26
Hierarchical Orthogonal Grid Layout
(2) Edge Routing
● Route: Sequence of grid segments
● Route graph: Combinatorial description of all possible edge routes
● Vertices of original graph● Vertices for each segment of grid graph● Edges describe valid transitions between these elements
● Add edges iteratively
Markus Rohrschneider
A Novel Grid-based Visualization Approach for Metabolic Networks with Advanced Focus&Context View
27
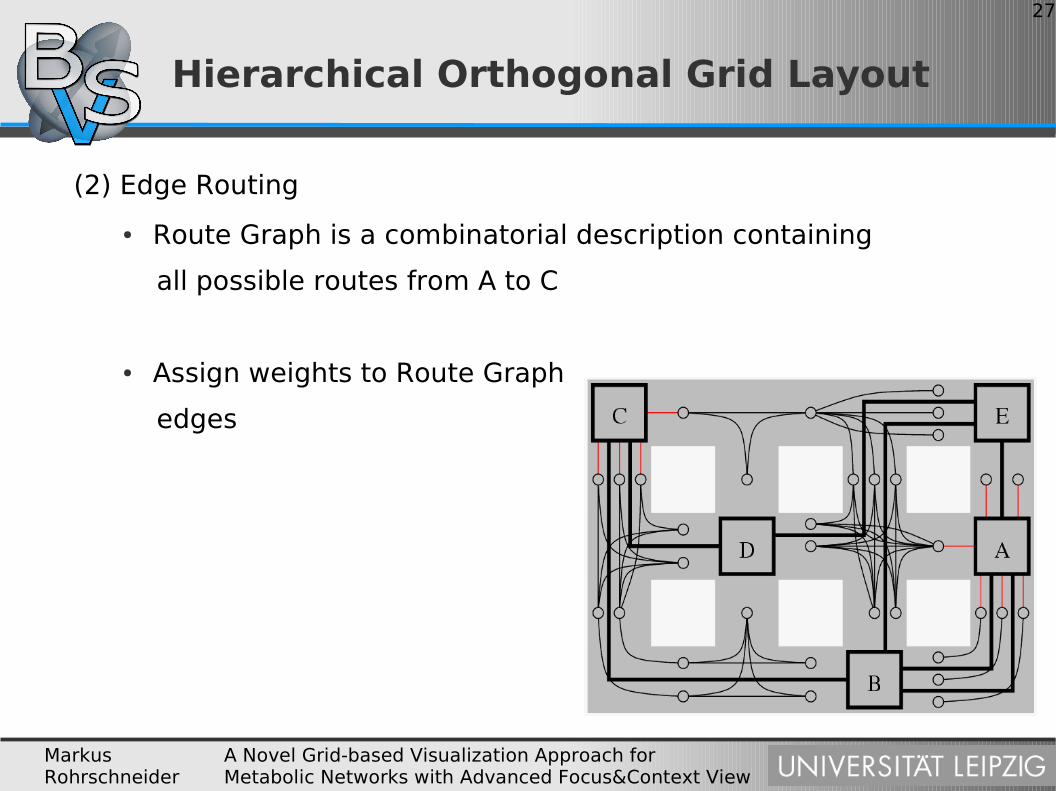
Hierarchical Orthogonal Grid Layout
(2) Edge Routing
● Route Graph is a combinatorial description containing
all possible routes from A to C
● Assign weights to Route Graph
edges
Markus Rohrschneider
A Novel Grid-based Visualization Approach for Metabolic Networks with Advanced Focus&Context View
28
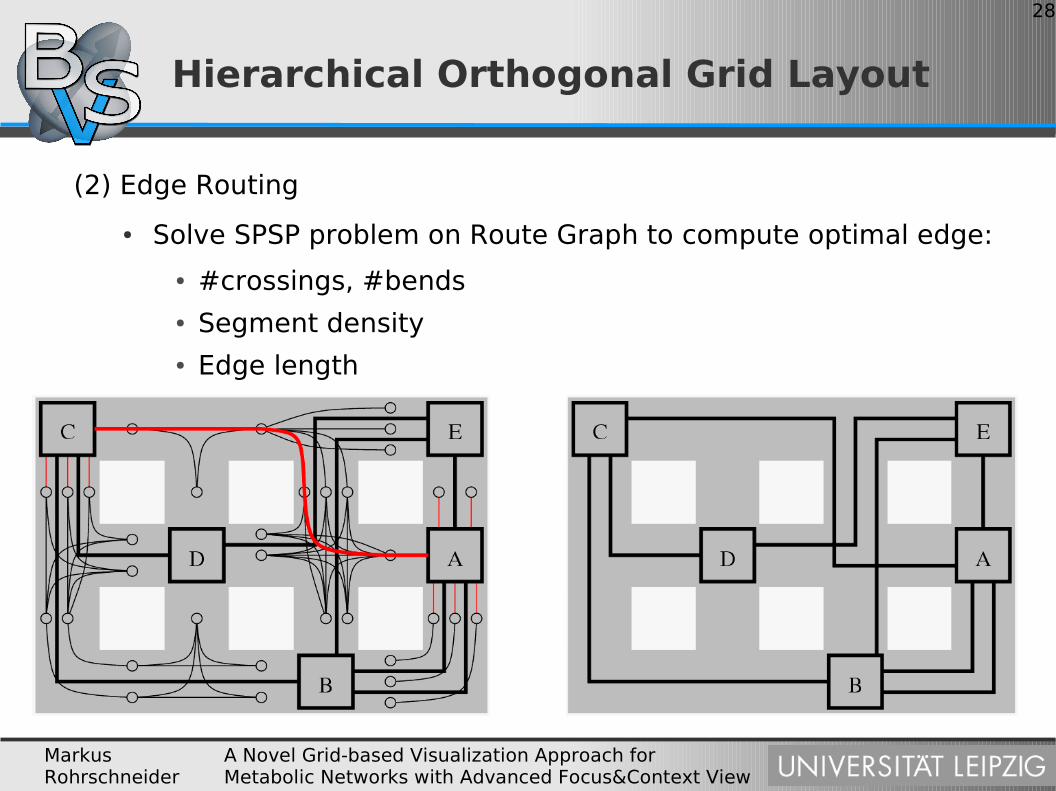
Hierarchical Orthogonal Grid Layout
(2) Edge Routing
● Solve SPSP problem on Route Graph to compute optimal edge:
● #crossings, #bends● Segment density● Edge length

Markus Rohrschneider
A Novel Grid-based Visualization Approach for Metabolic Networks with Advanced Focus&Context View
29
Hierarchical Orthogonal Grid Layout
(3) Edge Bundling
● Prevent edge overlaps by shifting route segments orthogonally to grid segments
● Use combinatorial description of edge routes (2) to construct a DAG
● Topological numbering gives displacement (offsets) avoiding occlusion
Markus Rohrschneider
A Novel Grid-based Visualization Approach for Metabolic Networks with Advanced Focus&Context View
30
Hierarchical Orthogonal Grid Layout
(3) Edge Bundling
● Prevent edge overlaps by shifting route segments orthogonally to grid segments
● Use combinatorial description of edge routes (2) to construct a DAG
● Topological numbering gives displacement (offsets) avoiding occlusion
Hierarchical Version:
● Layout top-level first
● Layout bottom-level graphs individually
Markus Rohrschneider
A Novel Grid-based Visualization Approach for Metabolic Networks with Advanced Focus&Context View
31
Interaction Techniques
Implementation
Markus Rohrschneider
A Novel Grid-based Visualization Approach for Metabolic Networks with Advanced Focus&Context View
32
Interaction Techniques / Implementation
Ben Shneiderman's mantra of Information Visualization:
(1) Overview first
(2) Zoom and Filter
(3) Details on Demand
Top-Down Exploration of Metabolic Network Graph
Markus Rohrschneider
A Novel Grid-based Visualization Approach for Metabolic Networks with Advanced Focus&Context View
33
Interaction Techniques / Implementation
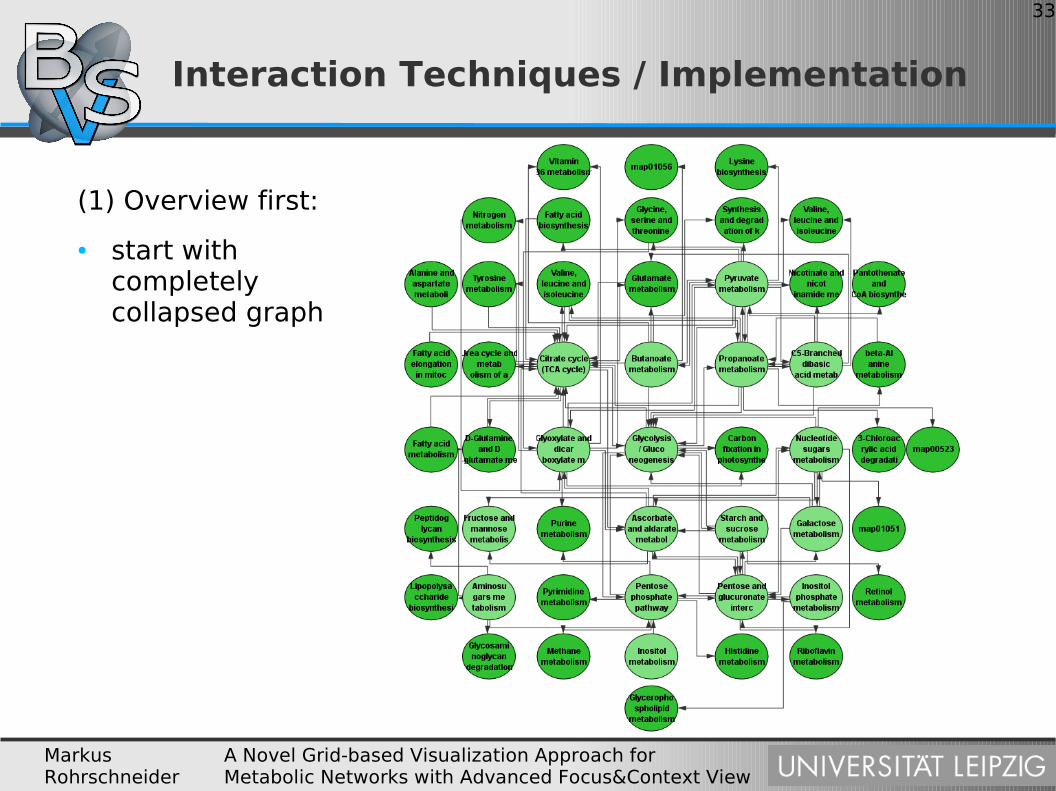
(1) Overview first:
● start with completely collapsed graph
Markus Rohrschneider
A Novel Grid-based Visualization Approach for Metabolic Networks with Advanced Focus&Context View
34
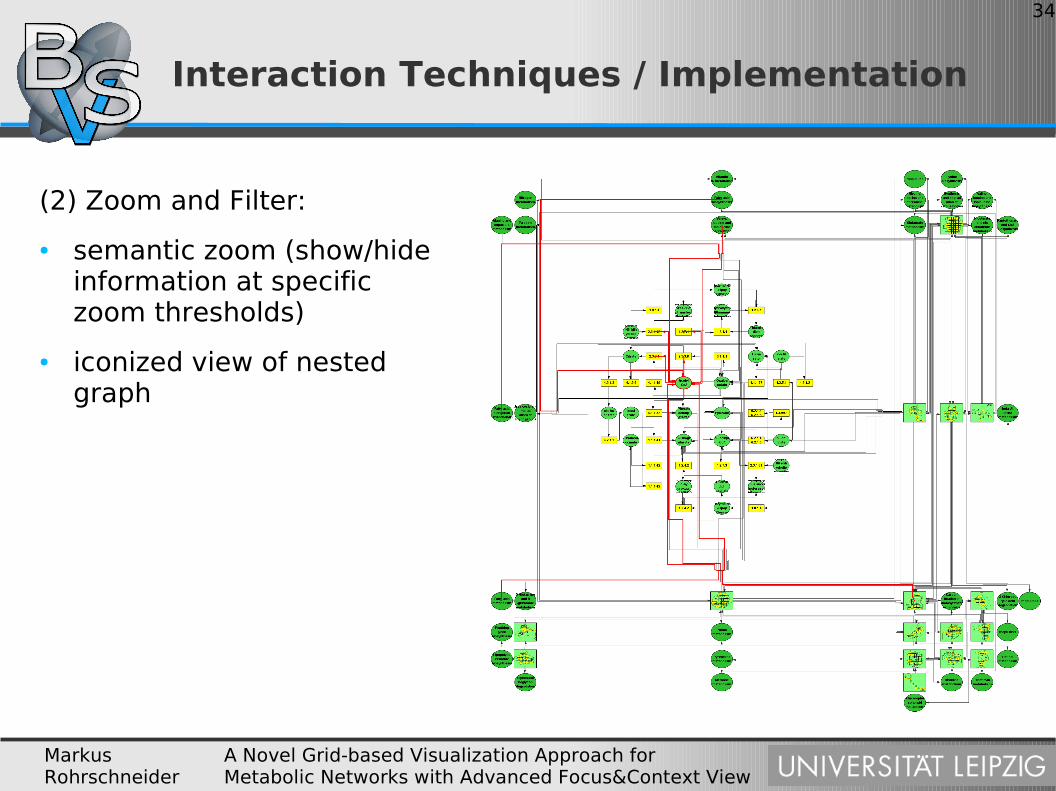
Interaction Techniques / Implementation
(2) Zoom and Filter:
● semantic zoom (show/hide information at specific zoom thresholds)
● iconized view of nested graph
Markus Rohrschneider
A Novel Grid-based Visualization Approach for Metabolic Networks with Advanced Focus&Context View
35
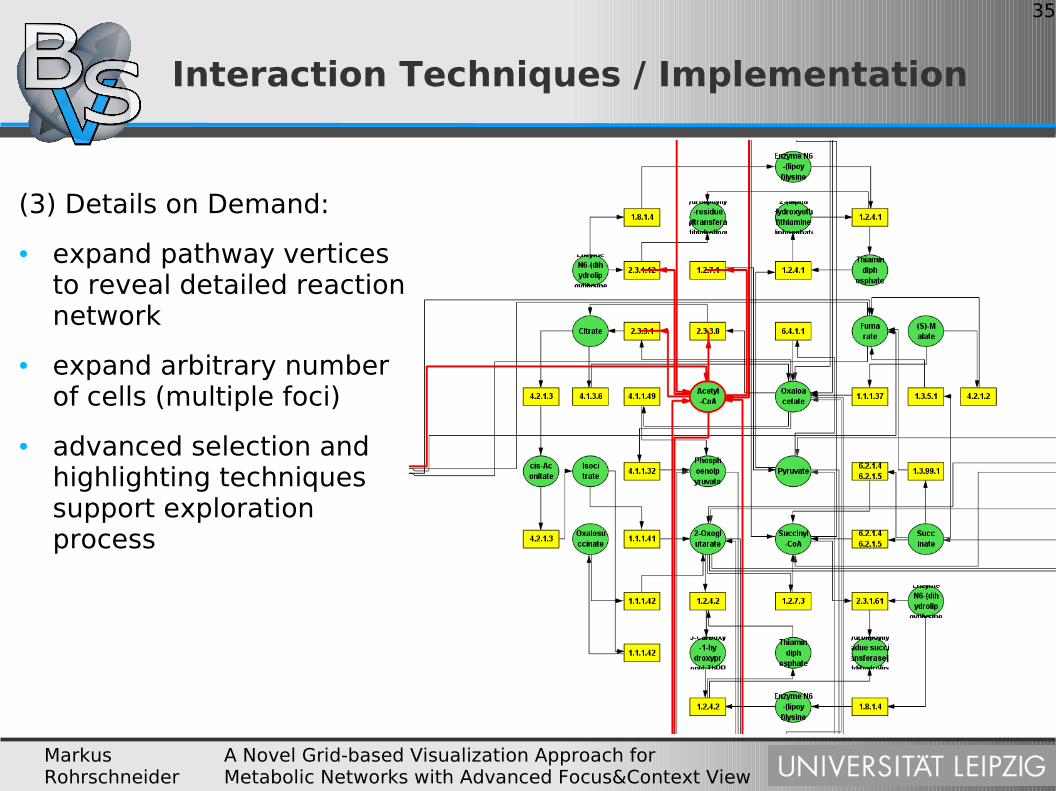
Interaction Techniques / Implementation
(3) Details on Demand:
● expand pathway vertices to reveal detailed reaction network
● expand arbitrary number of cells (multiple foci)
● advanced selection and highlighting techniques support exploration process
Markus Rohrschneider
A Novel Grid-based Visualization Approach for Metabolic Networks with Advanced Focus&Context View
36
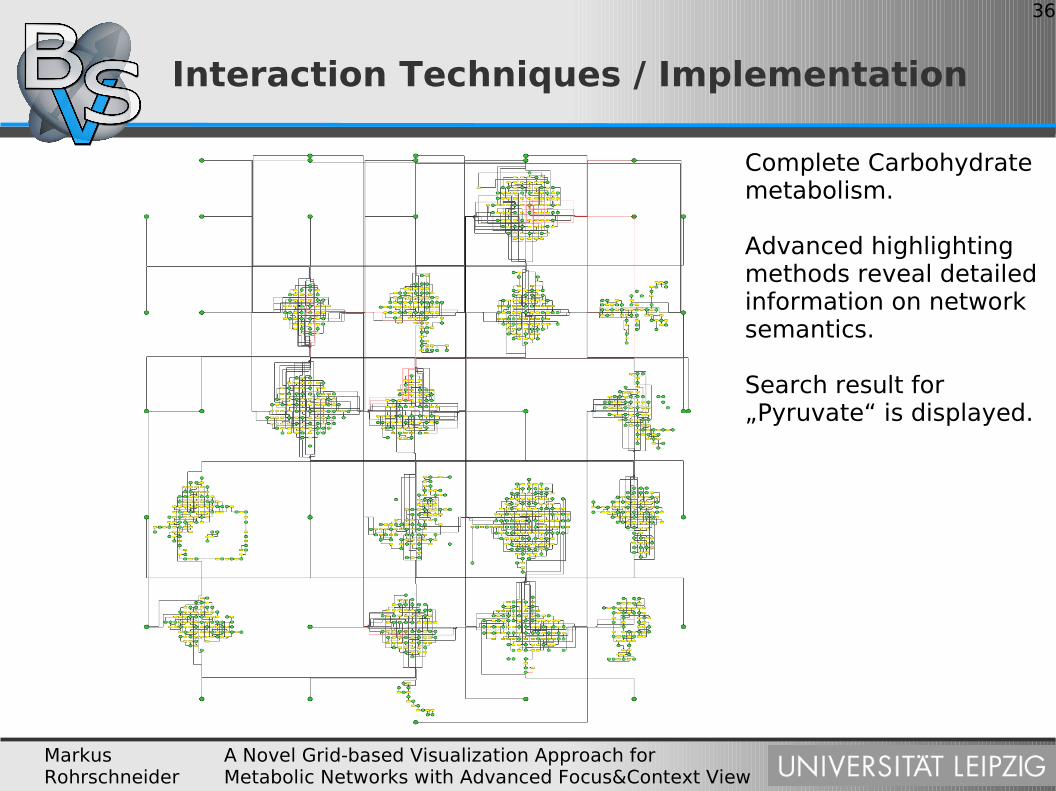
Interaction Techniques / Implementation
Complete Carbohydrate metabolism.
Advanced highlighting methods reveal detailed information on network semantics.
Search result for „Pyruvate“ is displayed.
Markus Rohrschneider
A Novel Grid-based Visualization Approach for Metabolic Networks with Advanced Focus&Context View
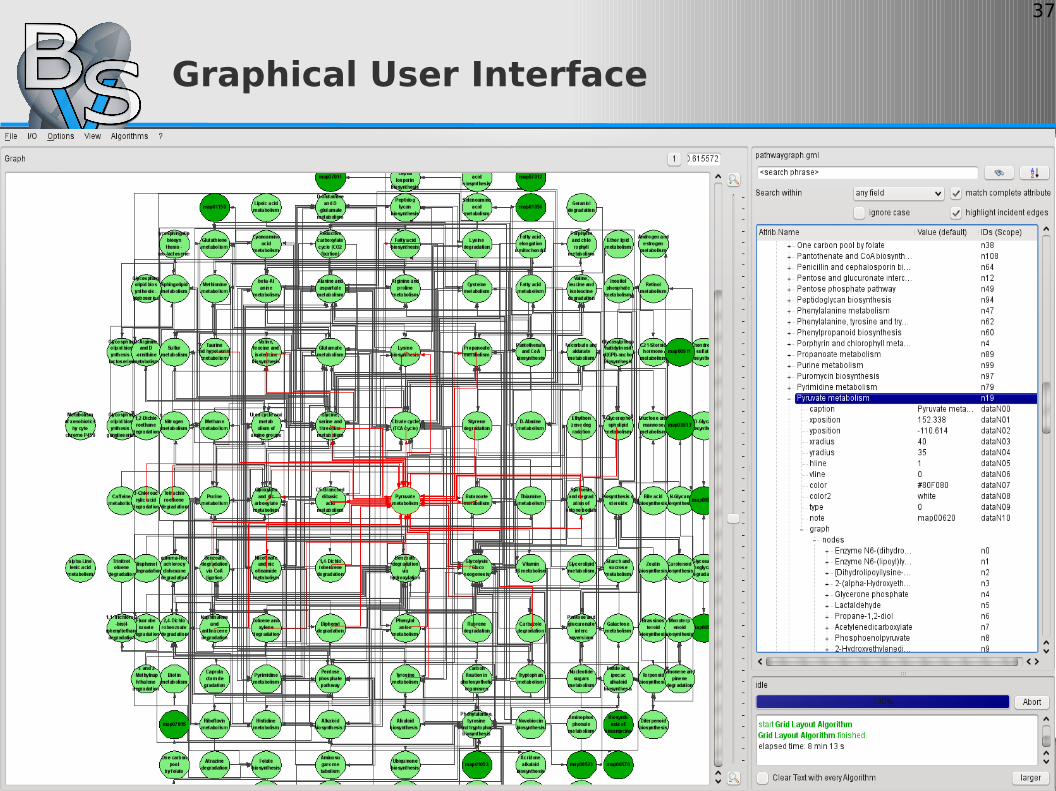
37
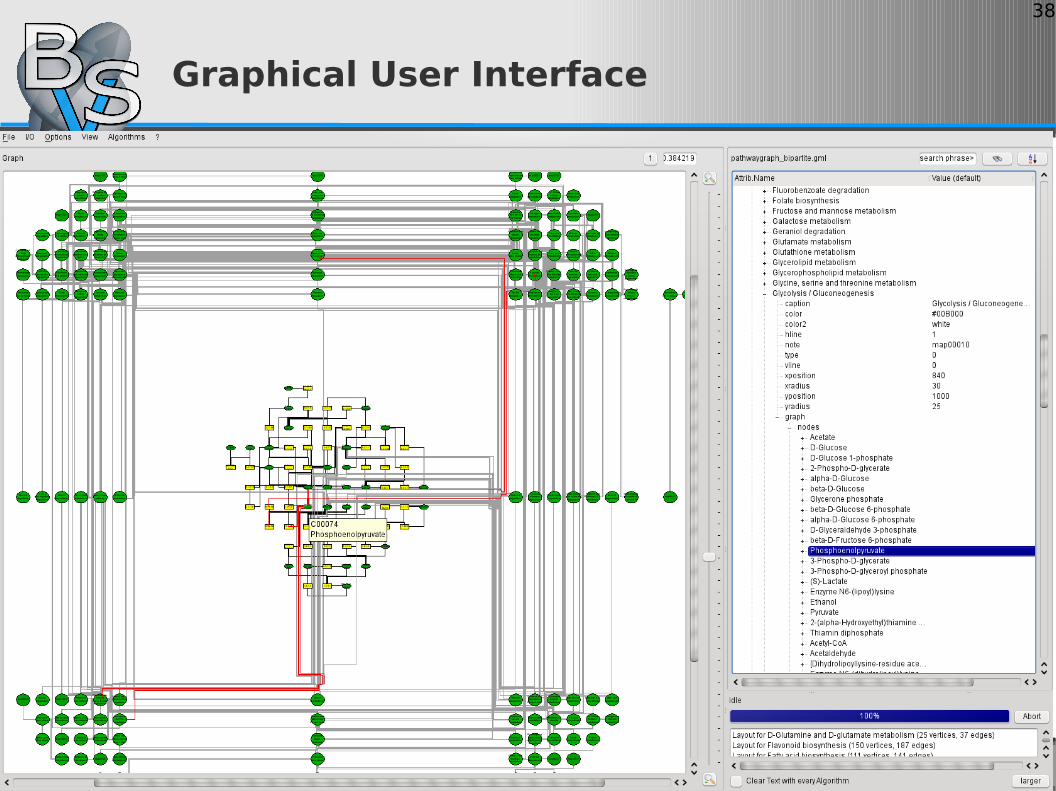
Graphical User Interface
Markus Rohrschneider
A Novel Grid-based Visualization Approach for Metabolic Networks with Advanced Focus&Context View
38
Graphical User Interface

Markus Rohrschneider
A Novel Grid-based Visualization Approach for Metabolic Networks with Advanced Focus&Context View
39
Graphical User Interface
Markus Rohrschneider
A Novel Grid-based Visualization Approach for Metabolic Networks with Advanced Focus&Context View
40
Conclusion
Markus Rohrschneider
A Novel Grid-based Visualization Approach for Metabolic Networks with Advanced Focus&Context View
41
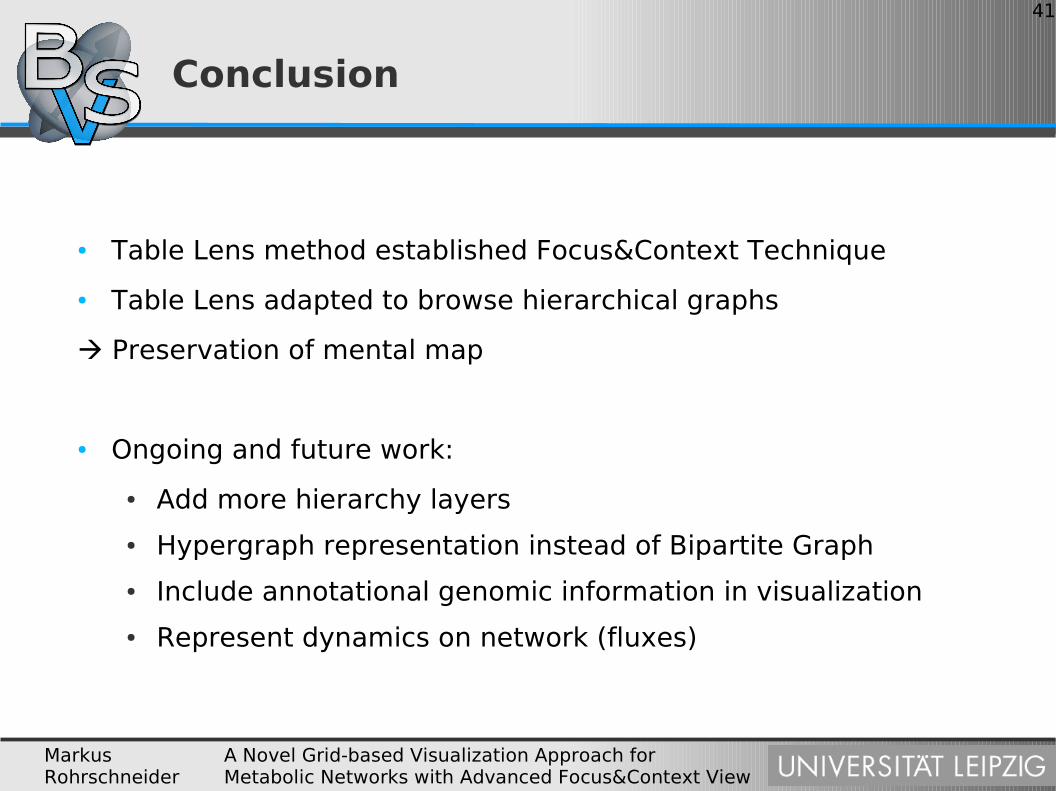
Conclusion
● Table Lens method established Focus&Context Technique
● Table Lens adapted to browse hierarchical graphs
Preservation of mental map
● Ongoing and future work:
● Add more hierarchy layers
● Hypergraph representation instead of Bipartite Graph
● Include annotational genomic information in visualization
● Represent dynamics on network (fluxes)
Markus Rohrschneider
A Novel Grid-based Visualization Approach for Metabolic Networks with Advanced Focus&Context View
42
Thank you.
Questions?

Markus Rohrschneider
A Novel Grid-based Visualization Approach for Metabolic Networks with Advanced Focus&Context View
43
Thank you.
Questions?
Markus Rohrschneider
A Novel Grid-based Visualization Approach for Metabolic Networks with Advanced Focus&Context View
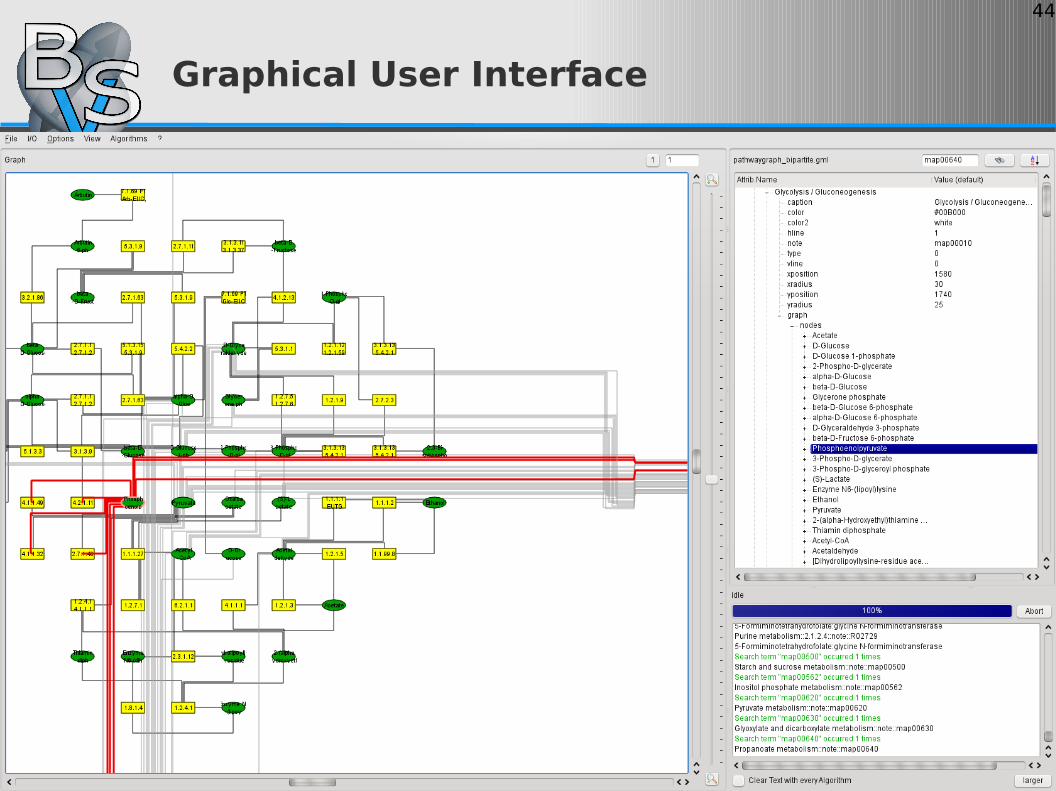
44
Graphical User Interface
Markus Rohrschneider
A Novel Grid-based Visualization Approach for Metabolic Networks with Advanced Focus&Context View
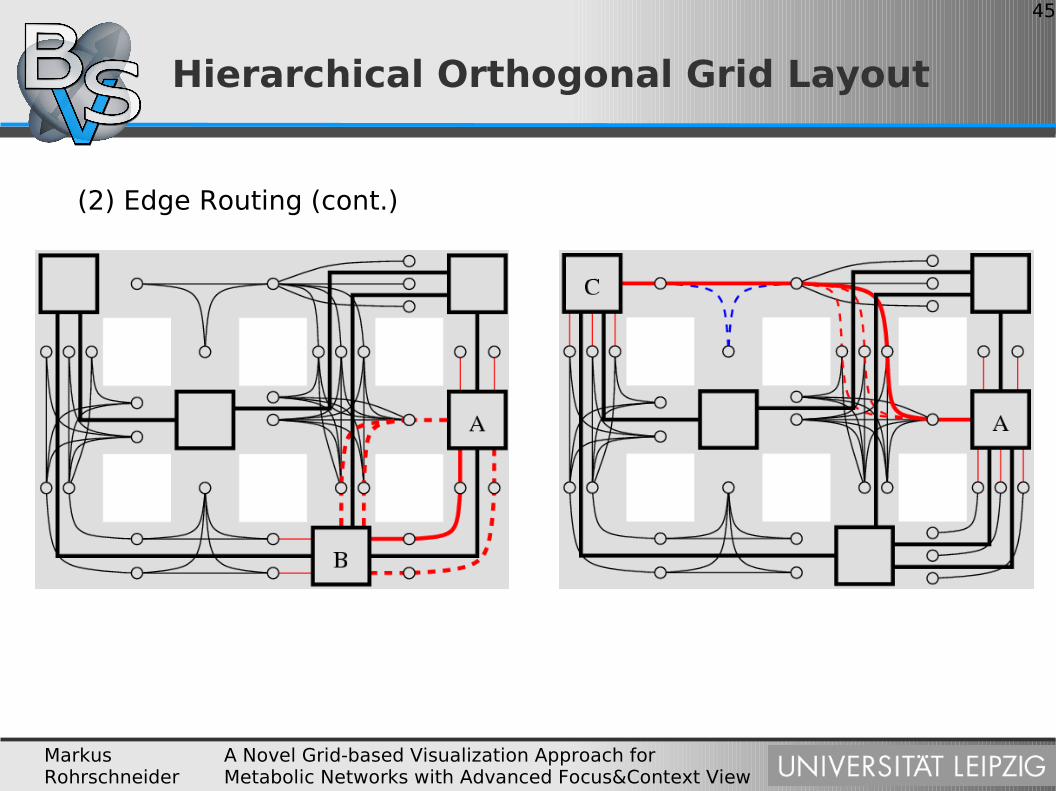
45
Hierarchical Orthogonal Grid Layout
(2) Edge Routing (cont.)
Markus Rohrschneider
A Novel Grid-based Visualization Approach for Metabolic Networks with Advanced Focus&Context View
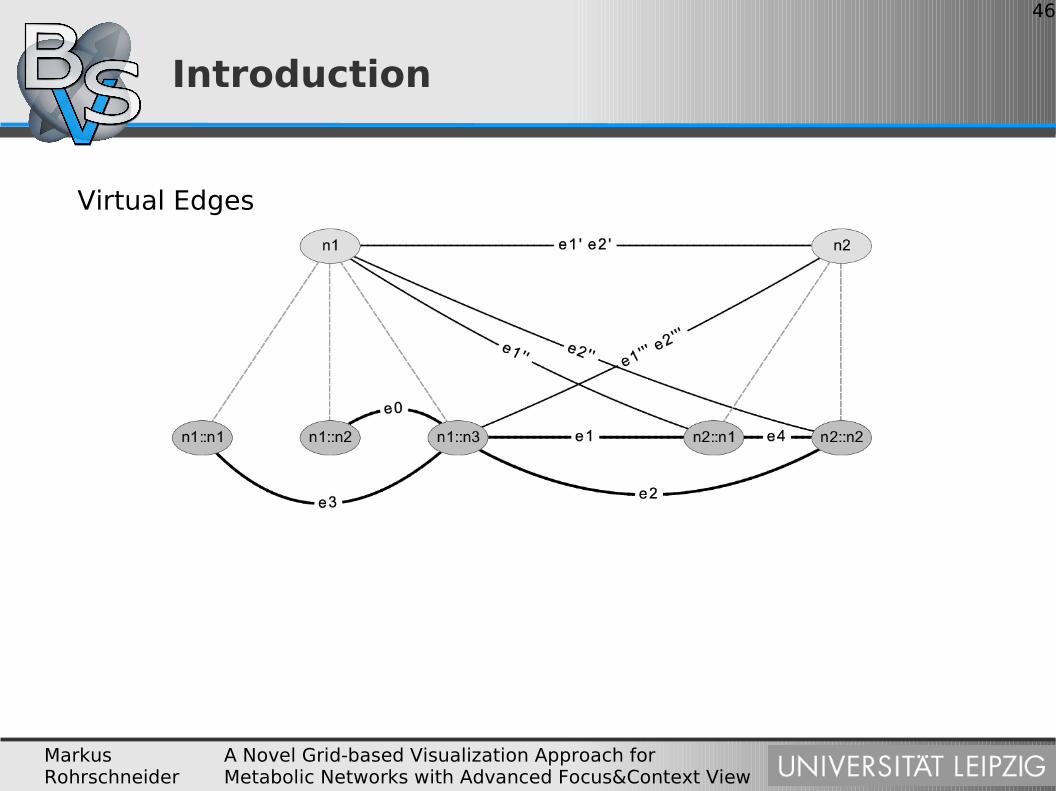
46
Introduction
Virtual Edges

Markus Rohrschneider
A Novel Grid-based Visualization Approach for Metabolic Networks with Advanced Focus&Context View
47
Introduction
Virtual Edges
Markus Rohrschneider
A Novel Grid-based Visualization Approach for Metabolic Networks with Advanced Focus&Context View
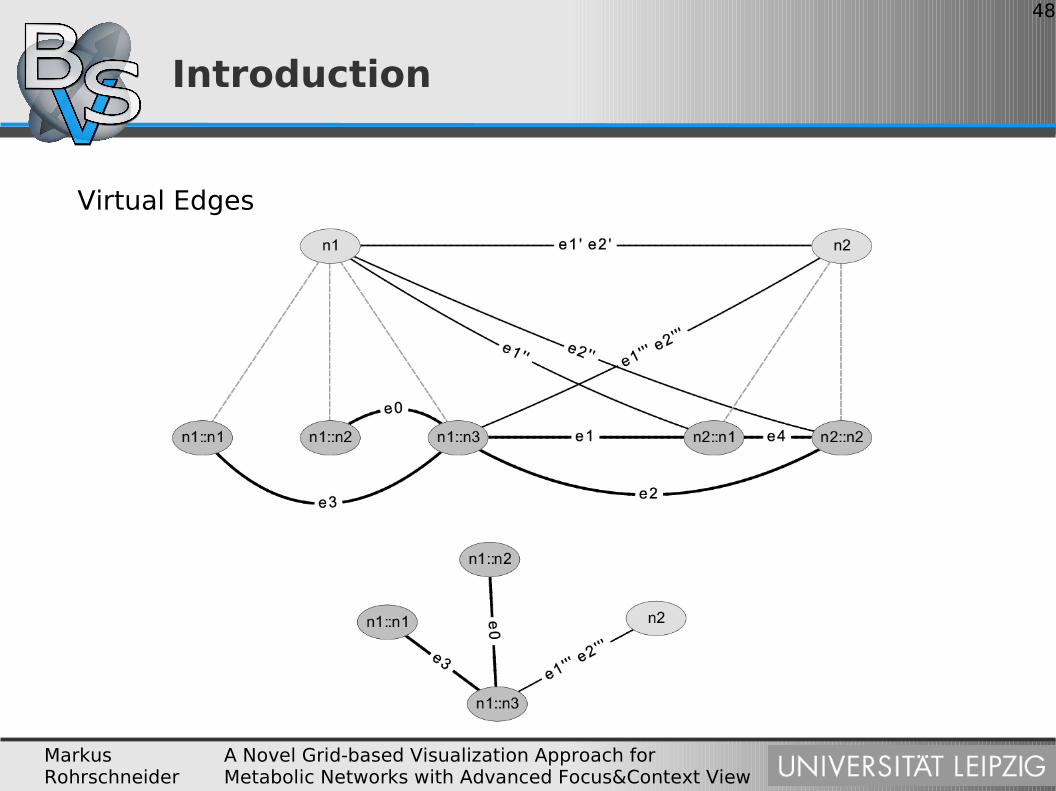
48
Introduction
Virtual Edges
Markus Rohrschneider
A Novel Grid-based Visualization Approach for Metabolic Networks with Advanced Focus&Context View
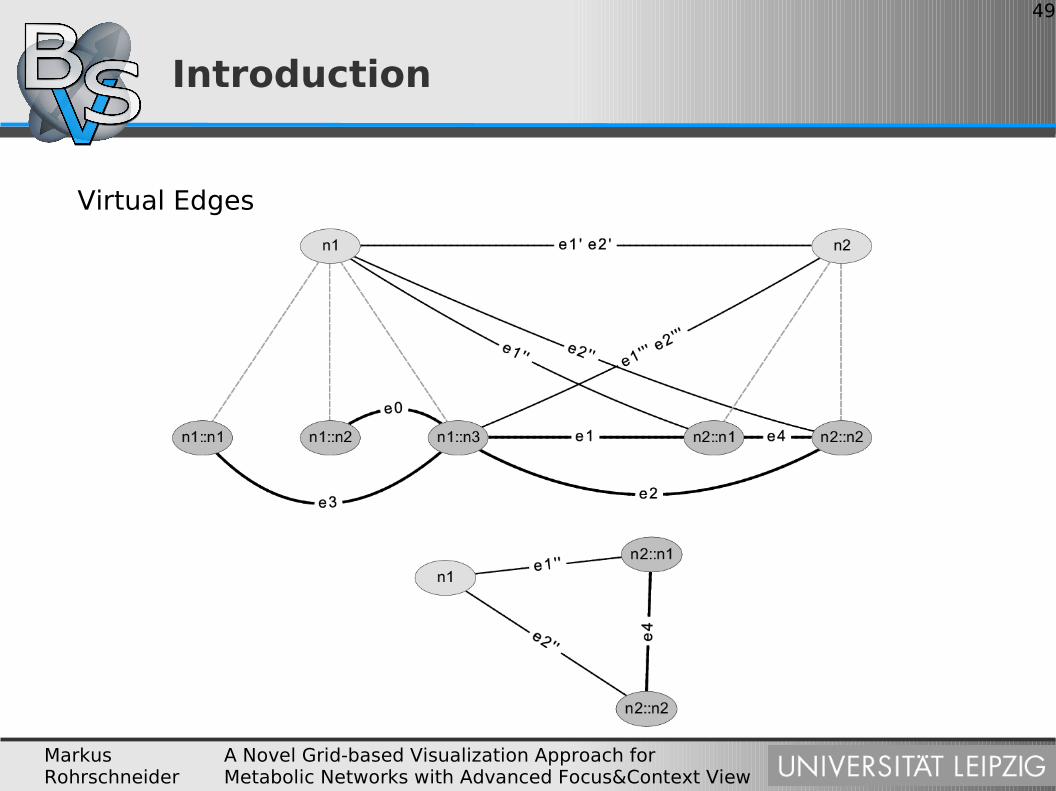
49
Introduction
Virtual Edges

Markus Rohrschneider
A Novel Grid-based Visualization Approach for Metabolic Networks with Advanced Focus&Context View
50
Introduction
Virtual Edges