Embed Size (px)
Citation preview
International Journal of Computer Engineering and Applications, Volume XI, Issue VIII, August 17, www.ijcea.com ISSN 2321-3469
RATNA NITIN PATIL AND Dr. SHARVARI CHANDRASHEKHAR TAMANE 76
A NOVEL SCHEME FOR PREDICTING TYPE 2 DIABETES IN
WOMEN: USING KMEANS WITH PCA AS DIMENSIONALITY
REDUCTION
RATNA NITIN PATIL 1, Dr. SHARVARI CHANDRASHEKHAR TAMANE 2
1Department of Computer Engineering, Reasearch Scholor, Babasaheb Ambedkar Marathwada University,
Aurangabad, India. 2Department of Computer Engineering JNEC, Babasaheb Ambedkar Marathwada University,
Aurangabad, India.
ABSTRACT: Disease diagnosis is one of the applications where machine learning algorithms are giving successful results. Different classifiers can be used to explore patients’ data and extract a predictive model. Machine learning algorithms can provide reliable performance in determining diabetes mellitus. PIMA Indian Dataset consists of women’s records. The risk of developing diabetes in Women is quite high. Hence, the idea is to Detect and Predict this Disorder with the help of Machine Learning techniques. In this study firstly PCA is used as dimensionality reduction and then KMeans is used to cluster the data set. The prime objective of this research work is to provide a better classification of diabetes. The experimental results show the performance of this work on PIDD.
Keywords: Diabetes mellitus; early diagnosis; PCA; machine learning; clustering; KMeans.
[1] INTRODUCTION
Diabetes mellitus (DM) is a group of metabolic disorders in which there are high blood
sugar levels over a prolonged period. The chronic hyperglycemia of diabetes is associated
with long-term damage, dysfunction, and failure of different organs, especially the eyes,
kidneys, nerves, heart, and blood vessels. Diabetes Mellitus is a metabolic disease where the
person will have high blood sugar due to the pancreas unable to produce sufficient insulin or
International Journal of Computer Engineering and Applications, Volume XI, Issue VIII, August 17, www.ijcea.com ISSN 2321-3469
RATNA NITIN PATIL AND Dr. SHARVARI CHANDRASHEKHAR TAMANE
77
the cells which are not responding to the insulin produced. There are three types of diabetes.
They are Type 1 diabetes, Type 2 diabetes and Gestational diabetes. Type 1 diabetes mostly
occurs in children. Its cause is an absolute deficiency of insulin secretion. Type 2 diabetes is
called adult-onset diabetes which is common in adults. The cause of Type 2 diabetes is a
combination of resistance to insulin action and an inadequate compensatory insulin secretory
response. In this category, a degree of hyperglycemia is sufficient to cause pathologic and
functional changes in various target tissues, but without clinical symptoms may be present for
a long period of time before diabetes is detected. Gestational diabetes (GDM) has been
defined as any degree of glucose intolerance with onset during pregnancy.
Diabetes is a deadly disease and a major public health challenge worldwide. The number of
diabetics in India is doubled from 32 million in 2000 to 63 million in 2013 and the figure is
projected to further increase to 102.2 million in the next 15 years. This is the latest
assessment by the World Health Organization, raising an alarm over the need to treat the
condition. The annual spend on diabetes treatment in India is pegged at Rs1.5 lakh crore,
which is 4.7 times the Centre’s allocation of Rs32000 crore for health. This cost is projected
to rise by 20-30% every year.
Diabetes disease diagnosis via proper interpretation of the Diabetes data is an important
classification problem. There are several methodologies available on classification of diabetes
disease. This work will help to develop a predictive model based on set of attributes collected
from the patients to develop a mathematical model. It is essential to find a way that can help
in detection with high accuracy and less complexity.
MATERIAL
A. DATASET
In the machine learning research community, a work is going on to solve the classification
problem. Pima Indian Dataset (PIMA) has been used to test the classification performance by
most of the scholars. It is publically available in the machine learning dataset UCI. All the
instances in this dataset are Pima Indian women of at least 21 years old and living near
Phoenix, Arizona, USA. The data is a collection of 768 records.
B. Risk Factors
The following are the parameters which contribute to the development of diabetes. The
prevalence of Type 2 diabetes is increasing at a fast pace due to obesity, physical inactivity
and unhealthy dietary habits.
Age – Indians develop diabetes earlier than western population. An early occurrence
gives abundant time for the development of prolonged complications of diabetes. The
incidence of diabetes increases with an age.
A NOVEL SCHEME FOR PREDICTING TYPE 2 DIABETES IN WOMEN:
USING KMEANS WITH PCA AS DIMENSIONALITY REDUCTION
Ratna Nitin Patil and Dr Sharvari Chandrashekhar Tamane
78
Family History – The occurrence of diabetes increases with a family history of diabetes.
A high incidence of diabetes is seen among the first degree relatives.
Lifestyle – Deskbound lifestyle is an independent factor for the growth of Type2
diabetes.
Obesity – There is a close association of obesity with Type2 diabetes. Increase in weight
increases Body Mass Index (BMI).
Stress – The impact of physical and mental stress along with lifestyle changes has an
effect of incidence of Type 2 diabetes from persons in a strong genetic background
[2] LITERATURE REVIEW
This section discusses about the existing techniques and algorithms used for the diagnosis of
diabetes mellitus. Each and every algorithm used for the diagnosis of diabetes mellitus has
their own limitations and advantages. This section presents an analytical study on the features
of the existing techniques.
Machine learning is an area of artificial intelligence research, which uses statistical methods
for data classification. Several machine learning techniques have been applied in clinical
settings to predict disease and have shown higher accuracy for diagnosis than classical
methods [23]. Support vector machines (SVM) and artificial neural networks (ANN) have
been widely used approaches in machine learning. They are the most frequently used
supervised learning methods for analyzing complex medical data [28].
Nirmala Devi et al [29] presented a fusion model that integrates k-means clustering and k-
Nearest Neighbor (KNN) with multi-step preprocessing. It is observed that KNN algorithm
provides significant performance on various data sets. In this fusion model, the quality of the
data is improved through eliminating noisy data thus improving the accuracy and efficiency
of the KNN algorithm. K-means clustering is determines and avoids incorrectly classified
instances. An efficient classification is carried out through KNN by taking the correctly
clustered samples with preprocessed subset as inputs for the KNN. The finest choice of k is
based on the data. The main goal of this work is to identify the value of k for PIDD for better
classification accuracy using fusion based KNN. It is observed from the results that this
fusion work based on KNN along with preprocessing provides best result for different k
values. If k value is more, the classification accuracy of the proposed fusion framework is
97.4%. The results are also compared with simple KNN and cascaded K-MEANS and KNN
for the same k values.
Literature Review on Diabetes, by National Public health: Women tend to be hardest hit by
diabetes with 9.6 million women having diabetes. This represents 8.8% of the adult
population of women 18 years of age and older in and a two fold increase from 1995 (4.7%).
By 2050, the projected number of all persons with diabetes will have increased from 17
million to 29 million. [5]
Nahla H Barakat [1] utilized SVM for the diagnosis of diabetes. This work uses an additional
intelligent module, which transforms the black box model of SVM into an intelligent SVM's
diagnostic model with adaptive results. It is observed from the results that the intelligent
International Journal of Computer Engineering and Applications, Volume XI, Issue VIII, August 17, www.ijcea.com ISSN 2321-3469
RATNA NITIN PATIL AND Dr. SHARVARI CHANDRASHEKHAR TAMANE
79
SVMs provide a potential framework for the prediction of diabetes, where a logical rule set
have been generated,
Jayalakshmi and Santhakumaran (2010) proposed a new and efficient technique for the
classification of diagnosis of diabetes disease using Artificial Neural Network (ANN). The
methodology implemented here is based on the concept of ANN which requires a complete
set of data for the accurate classification of diabetes. The paper also implements an efficient
technique for the improvement of classification accuracy of missing values in the dataset. It
also provides a pre-processing stage during classification.
Patil et al. (2010) implements an association-rule-based technique for the classification of
type-2 diabetic patients. The methodology provides the generation of rules using apriori
algorithm on the basis of some support and confidence. In the first stage, the numeric
attributes are converted into categorical form which is based on the input parameters. Lastly
generated the association rules which are useful to identify general associations in the data, to
understand the relationship between the measured fields whether the patient goes on to
develop diabetes or not.
Meng et al. [30] compared the performance of logistic regression, ANNs, and decision tree
models for predicting diabetes or prediabetes using common risk factors in China population.
Dilip Kumar Choubey et al., [31] have applied NBs, GA_NBs method on PIMA dataset. The
classification has been done by using NBs and then using GA for Attributes selection and
there by performed classification on the selected attributes. The proposed method minimizes
the computation cost, computation time and maximizes the ROC and classification accuracy
than several other existing methods.
M. Kothainayaki, P. Thangaraj [32] presented the Classification of diabetic’s data set and the
k-means algorithm to categorical domains. Before classification the preprocessing of data set
is done to remove the noise in the data set. They have used the missing value algorithm to
replace the null values in the data set. This algorithm is also used to improve the classification
rate and cluster the data set using two attributes namely plasma and pregnancy attribute.
[3] ALGORITHEMS USED
[3.1] Principal component analysis (PCA)
PCA is used abundantly in all forms of analysis - from neuroscience to computer graphics,
because it is a simple, non-parametric method of extracting relevant information from
confusing data sets. With minimal additional effort PCA provides a roadmap for how to
reduce a complex data set to a lower dimension to reveal the sometimes hidden, simplified
dynamics that often underlie it.
Principal Component Analysis (PCA) is an unsupervised dimensionality reduction method; it
is also named the discrete Karhunen–Loève transform (KLT). Principal components analysis
is a technique that can be used to simplify a dataset. It is a linear transformation that chooses
a new coordinate system for the data set such that greatest variance by any projection of the
dataset comes to lie on the first axis (then called the first principal component), the second
greatest variance on the second axis, and so on. PCA can be used for reducing
dimensionality by eliminating the later principal components [34].

A NOVEL SCHEME FOR PREDICTING TYPE 2 DIABETES IN WOMEN:
USING KMEANS WITH PCA AS DIMENSIONALITY REDUCTION
Ratna Nitin Patil and Dr Sharvari Chandrashekhar Tamane
80
By finding the eigenvalues and eigenvectors of the covariance matrix, we find that the
eigenvectors with the largest eigenvalues correspond to the dimensions that have the
strongest correlation in the dataset. This is the principal component.
Listed below are the 6 general steps for performing a principal component analysis,
1. Take the whole dataset consisting of d-dimensional samples ignoring the class labels
2. Compute the d-dimensional mean vector (i.e., the means for every dimension of the
whole dataset)
3. Compute the scatter matrix (alternatively, the covariance matrix) of the whole data set
4. Compute eigenvectors (e1,e2,...,ed) and corresponding eigenvalues (λ1,λ2,...,λd) of the
covariance matrix
C = λ1> λ2>⋯>λN (eigenvalues)
C = e1, e2, …, ed (eigenvectors)
5. Sort the eigenvectors by decreasing eigenvalues and choose k eigenvectors with the
largest eigenvalues to form a d×k dimensional matrix W (where every column
represents an eigenvector)
6. Use this d×k eigenvector matrix to transform the samples onto the new subspace. This
can be summarized by the mathematical equation: y=WT×x (where x is a d×1-
dimensional vector representing one sample, and y is the transformed k×1-dimensional
sample in the new subspace.)
PCA is a useful statistical technique that has found application in:
– Fields such as face recognition and image compression
– finding patterns in data of high dimension [35].
[3.2] KMeans Clustering
KMeans is one of the simplest unsupervised learning algorithms that solve the well-known
clustering problem. The procedure follows a simple and easy way to classify a given data
set through a certain number of clusters (assume k clusters) fixed Apriori. The main idea is
to define k centers, one for each cluster. These centers should be placed in a
calculating way because of different location causes different result. So, the better choice is to
place them as much as possible far away from each other. The next step is to take each point
belonging to a given data set and associate it to the nearest center. When no
point is pending, the first step is completed. At this point we need to re-calculate k new
centroids as barycenter of the clusters resulting from the previous step. After we have these k
new centroids, a new binding has to be done between the same data set points and the nearest
new center. A loop has been generated. As a result of this loop we may notice that the k
centers change their location step by step until no more changes are done or in other words
centers do not move any more. Finally, this algorithm aims at minimizing an objective function
known as squared error function given by:
Where,
‘||xi - vj||’ is the Euclidean distance between xi and vj
International Journal of Computer Engineering and Applications, Volume XI, Issue VIII, August 17, www.ijcea.com ISSN 2321-3469
RATNA NITIN PATIL AND Dr. SHARVARI CHANDRASHEKHAR TAMANE
81
‘ci’ is the number of data points in ith cluster.
‘c’ is the number of cluster centers.
Algorithmic steps for k-means clustering
Let X = {x1, x2, x3,…….., xn} be the set of data points and
V = {v1, v2,……., vc} be the set of centers.
1) Randomly select ‘c’ cluster centers.
2) Calculate the distance between each data point and cluster centers.
3) Assign the data point to the cluster center whose distance from the cluster center is minimum
of all the cluster centers.
4) Recalculate the new cluster center using:
Where, ‘ci’ represents the number of data points in ith cluster.
5) Recalculate the distance between each data point and new obtained cluster centers.
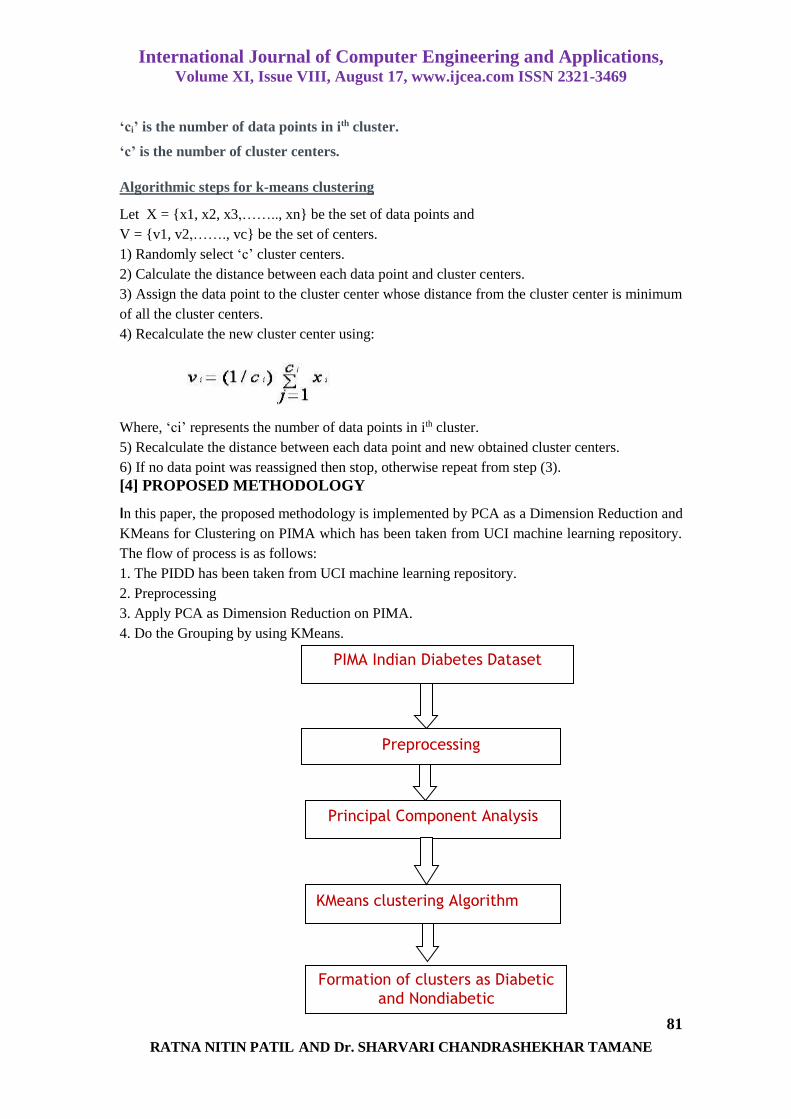
6) If no data point was reassigned then stop, otherwise repeat from step (3). [4] PROPOSED METHODOLOGY
In this paper, the proposed methodology is implemented by PCA as a Dimension Reduction and
KMeans for Clustering on PIMA which has been taken from UCI machine learning repository.
The flow of process is as follows:
1. The PIDD has been taken from UCI machine learning repository.
2. Preprocessing
3. Apply PCA as Dimension Reduction on PIMA.
4. Do the Grouping by using KMeans.
Preprocessing
Principal Component Analysis
KMeans clustering Algorithm
Formation of clusters as Diabetic
and Nondiabetic
PIMA Indian Diabetes Dataset
A NOVEL SCHEME FOR PREDICTING TYPE 2 DIABETES IN WOMEN:
USING KMEANS WITH PCA AS DIMENSIONALITY REDUCTION
Ratna Nitin Patil and Dr Sharvari Chandrashekhar Tamane
82
[5] EXPERIMENTAL RESULTS
The data set is classified using the algorithm and attain the result as tested_positive or
tested_negative.
Some notations used for performance measure:
TP – True Positives (Samples the classifier has correctly classified as positives)
TN – True Negatives (Samples the classifier has correctly classified as negatives)
FP – False Positives (Samples the classifier has incorrectly classified as positives)
FN – False Negatives (Samples the classifier has incorrectly classified as negatives)
Then calculate the classification rate using followings formulas:
Precision: Proportion of all positive predictions that are correct. Precision is a measure of how
many positive predictions were actual positive observations.
Precision = TP / (TP + FP)
Recall: Proportion of all real positive observations that are correct. Precision is a measure of
how many actual positive observations were predicted correctly.
Recall = TP / (TP + FN)
F1 Score: The harmonic mean of precision and recall. F1 score is an 'average' of both precision
and recall. We use the harmonic mean because it is the appropriate way to average ratios (while
arithmetic mean is appropriate when it conceptually makes sense to add things up).
F1 Score = 2*(Recall * Precision) / (Recall + Precision)
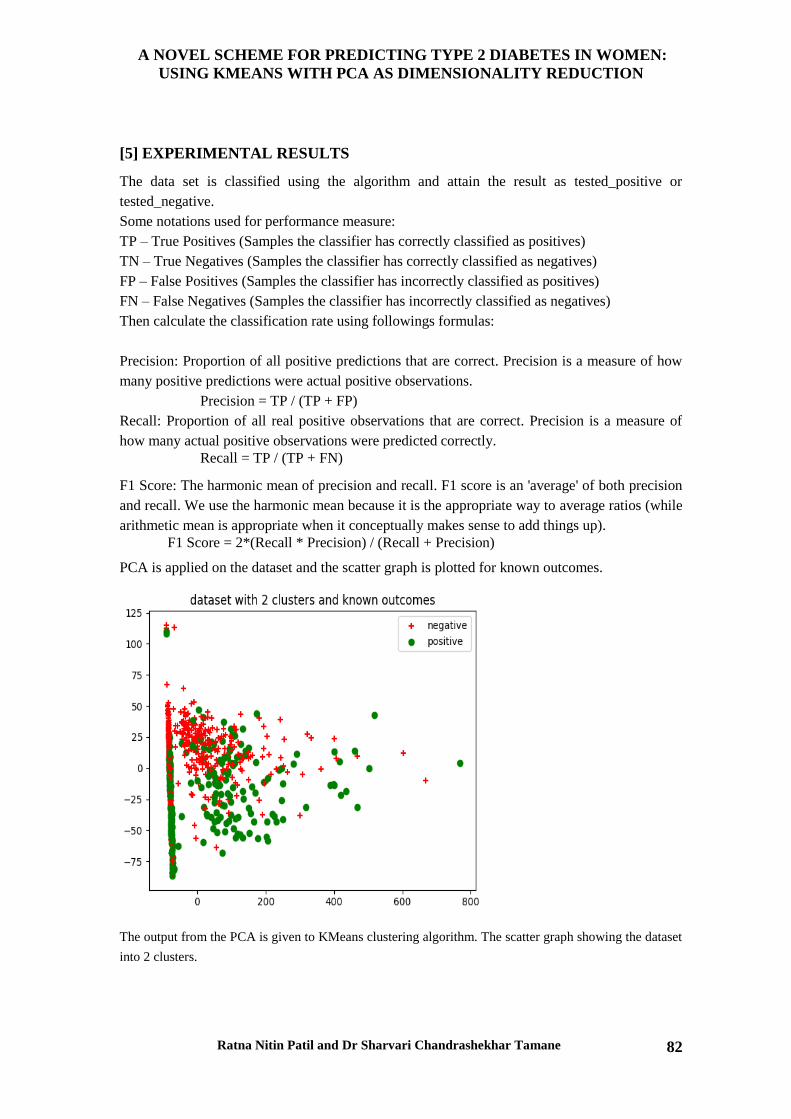
PCA is applied on the dataset and the scatter graph is plotted for known outcomes.
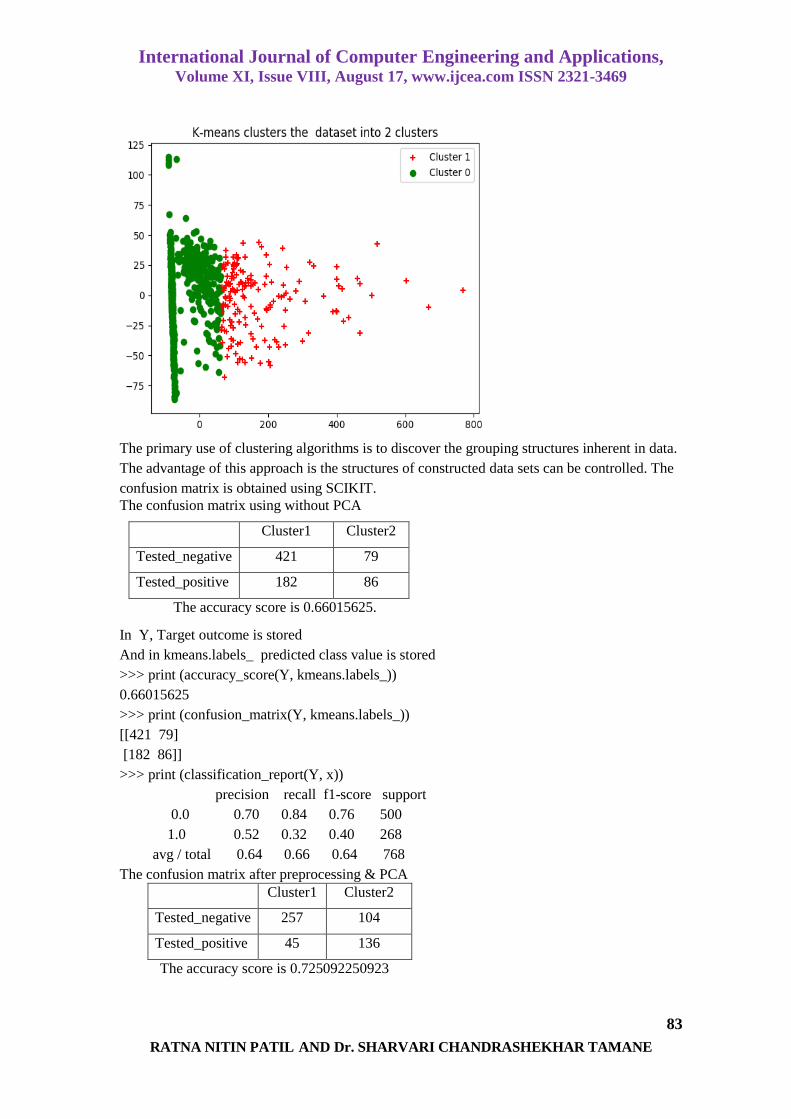
The output from the PCA is given to KMeans clustering algorithm. The scatter graph showing the dataset
into 2 clusters.
International Journal of Computer Engineering and Applications, Volume XI, Issue VIII, August 17, www.ijcea.com ISSN 2321-3469
RATNA NITIN PATIL AND Dr. SHARVARI CHANDRASHEKHAR TAMANE
83
The primary use of clustering algorithms is to discover the grouping structures inherent in data.
The advantage of this approach is the structures of constructed data sets can be controlled. The
confusion matrix is obtained using SCIKIT.
The confusion matrix using without PCA
Cluster1 Cluster2
Tested_negative 421 79
Tested_positive 182 86
The accuracy score is 0.66015625.
In Y, Target outcome is stored
And in kmeans.labels_ predicted class value is stored
>>> print (accuracy_score(Y, kmeans.labels_))
0.66015625
>>> print (confusion_matrix(Y, kmeans.labels_))
[[421 79]
[182 86]]
>>> print (classification_report(Y, x))
precision recall f1-score support
0.0 0.70 0.84 0.76 500
1.0 0.52 0.32 0.40 268
avg / total 0.64 0.66 0.64 768
The confusion matrix after preprocessing & PCA
Cluster1 Cluster2
Tested_negative 257 104
Tested_positive 45 136
The accuracy score is 0.725092250923
A NOVEL SCHEME FOR PREDICTING TYPE 2 DIABETES IN WOMEN:
USING KMEANS WITH PCA AS DIMENSIONALITY REDUCTION
Ratna Nitin Patil and Dr Sharvari Chandrashekhar Tamane
84
>>> print (accuracy_score(Y, x))
0.725092250923
>>> print (confusion_matrix(Y, x))
[[257 104]
[ 45 136]]
>>> print (classification_report(Y, x))
precision recall f1-score support
0.0 0.85 0.71 0.78 361
1.0 0.57 0.75 0.65 181
avg / total 0.76 0.73 0.73 542
[6] CONCLUSION AND FUTURE SCOPE
The proposed method yields better results than single classifier. In this paper we have proposed
KMeans clustering algorithm which first implements the dimensionality reduction technique
i.e., PCA and then uses KMeans algorithm to fine tune the result. Using the proposed method a
given dataset is partitioned in such a way that the sum of total clustering error is reduced to a
large extent. The limitation of this work is that it may not provide the same accuracy for any
other data set which it has provided for the Pima Indian diabetic data set in this approach. This
study can be further extended to deal datasets with multiple classes.
REFERENCES
[1] Nahla H. Barakat, Andrew P. Bradley, Senior Member, IEEE, and Mohamed Nabil H.Barakat
“Intelligible Support Vector Machines For Diagnosis Of Diabetes Mellitus” IEEE
Transactions On Information Technology In Biomedicine, Vol. 14, No. 4, July 2010 Digital
Object Identifier10.1109/TITB.2009.2039485 July 2010.
[2] Muhammad Waqar Aslam, Zhechen Zhu, Asoke Kumar Nandi “Feature generation using
genetic programming with comparative partner selection for diabetes classification” Expert
Systems with Applications 40(2013) 5402-5412
[3] Kamadi V.S.R.P. Varma, Allam Appa Rao, T. Sita Maha Lakshmi, P.V. Nageswara Rao “A
computational intelligence approach for a better diagnosis of diabetic patients” Computers
and Electrical Engineering 40 (2014) 1758–1765
[4] T. Santhanam, M.S Padmavathi “Application of K-Means and Genetic Algorithms for
Dimension Reduction by Integrating SVM for Diabetes Diagnosis” Procedia Computer
Science 47 (2015) 76 – 83.
[5] Kamer Kayaer, Tulay Yildirim “Medical Diagnosis on Pima Indian Diabetes Using General
Regression Neural Networks” Yildiz Technical University, Department of Electronics and
Comm. Eng. Besiktas, Istanbul 34349 TURKEY.
[6] Margret Anouncia S., Clara Madonna L. J., Jeevitha P., Nandhini R. T. “Design of a Diabetic
Diagnosis System Using Rough Sets” Cybernetics and Information Technologies Volume 13,
No 3 DOI: 10.2478/cait-2013-0030.
[7] Mostafa Fathi Ganji, Mohammad Saniee Abadeh “Using fuzzy Ant Colony Optimization for
Diagnosis of Diabetes Disease” Proceedings of ICEE 2010, May 11-13, 2010 978-1-4244-
6760-0/10/$26.00 ©2010 IEEE
International Journal of Computer Engineering and Applications, Volume XI, Issue VIII, August 17, www.ijcea.com ISSN 2321-3469
RATNA NITIN PATIL AND Dr. SHARVARI CHANDRASHEKHAR TAMANE
85
[8] Chang-Shing Lee, Senior Member, IEEE, and Mei-Hui Wang “A Fuzzy Expert System for
Diabetes Decision Support Application” IEEE Transactions on Systems, Man, and
Cybernetics- Part B: Cybernetics, Vol. 41, No. 1, February 2011 Digital Object Identifier
10.1109/TSMCB.2010.2048899.
[9] Siva Sundhara Raja Dhanushkodi, and Vasuki Manivannan “Diagnosis System for Diabetic
Retinopathy to Prevent Vision Loss” Applied Medical Informatics Soft Computing
Approaches for Diabetes Disease Diagnosis: A Survey 11725 Original Research Vol. 33, No.
3 /2013, pp: 1-11Licensee SRIMA, Cluj-Napoca, Romania.
[10] Polat, K., Gunes, S. An expert system approach based on principal component analysis and
adaptive neuro-fuzzy inference system to diagnosis of diabetes disease. Digital Signal
Processing, 17(4), 702-710, 2007
[11] Karthikeyini.V., Pervin begum.I., “Comparison a performance of data mining algorithms
(CPDMA) in prediction of Diabetes Disease”, International journal of Computer Science and
Engineer-ing, Vol.5, No. 03, March 2013, pp. 205-210.
[12] Karthikeyini.V., Pervin begum.I., Tajuddin.K., Shahina Begum, “Comparative of data mining
classification algorithm (CDMCA) in Diabetes Disease Prediction”, International journal of
Computer Applications, Vol.60, No. 12, Dec. 2012, pp. 26-31.
[13] D.S.Kumar, G.Sathyadevi, S.Sivanesh Decision, “Support Sys-tem for Medical Diagnosis
Using Data Mining ”, International journal of computer applications, Vol. 4, No. 5, 2011.
[14] Oliver Faust & Rajendra Acharya U. E. Y. K. Ng Kwan-Hoong Ng Jasjit S. Suri “Algorithms
for the Automated Detection of Diabetic Retinopathy Using Digital Fundus Images: A
Review” J Med Syst (2012) 36:145–157 DOI 10.1007/s10916-010-9454-7
[15] Fayssal Beloufa, Chikh MA. Algeria: s.n. Automatic fuzzy rules-base generation using
modified particle swarm optimization. In: 2nd International symposium on modeling and
implementation of complex systems constantine 2012. p. 1–6.
[16] Han Jiawei, Kamber Micheline, Pei Jian. “Data Mining Concepts and Techniques.” Waltham:
Morgan Kaufmann; 2012.
[17] IDF Diabetes Atlas. The Economic Impacts of Diabetes. Available from
http://www.diabetesatlas.org/content/economic-impacts-diabetes. Accessed April 1, 2011.
[18] Xue-Hui Meng, Yi-Xiang Huang, Dong-Ping Rao, Qiu Zhang, Qing Liu “Comparison of
three data mining models for predicting diabetes or prediabetes by risk factors.” SciVerse
ScienceDirect Elsevier 2013.
[19] Md. Mozaharul Mottalib, Md. Mokhlesur Rahman, Md. Tarek Habib and 4Farruk Ahmed
“Detection of the Onset of Diabetes Mellitus by Bayesian Classifier Based Medical Expert
System” Transaction on Machine Learning and Artificial Intelligence DOI:
10.14738/tmlai.44.1962 Publication Date: 19th July, 2016.
[20] T. Karthikeyan, K. Vembandasamy , RaghavanAn Intelligent Type-II Diabetes Mellitus
Diagnosis Approach using Improved FP-growth with Hybrid Classifier Based Arm Research
Journal of Applied Sciences, Engineering and Technology 11(5): 549-558, 2015. DOI:
10.19026 /rjaset.11 .1860ISSN: 2040-7459; e-ISSN: 2040-7467.
[21] Oliver Faust & Rajendra Acharya U. E. Y. K. Ng Kwan-Hoong Ng Jasjit S. Suri “Algorithms
for the Automated Detection of Diabetic Retinopathy Using Digital Fundus Images: A
Review” J Med Syst (2012) 36:145–157 DOI 10.1007/s10916-010-9454-7
[22] Fayssal Beloufa, Chikh MA. Algeria: s.n. Automatic fuzzy rules-base generation using
modified particle swarm optimization. In: 2nd International symposium on modeling and
implementation of complex systems constantine 2012. p. 1–6.
[23] Han Jiawei, Kamber Micheline, Pei Jian. “Data Mining Concepts and Techniques.” Waltham:
Morgan Kaufmann; 2012.
[24] IDF Diabetes Atlas. The Economic Impacts of Diabetes. Available from
http://www.diabetesatlas.org/content/economic-impacts-diabetes. Accessed April 1, 2011.
A NOVEL SCHEME FOR PREDICTING TYPE 2 DIABETES IN WOMEN:
USING KMEANS WITH PCA AS DIMENSIONALITY REDUCTION
Ratna Nitin Patil and Dr Sharvari Chandrashekhar Tamane
86
[25] Xue-Hui Meng, Yi-Xiang Huang, Dong-Ping Rao, Qiu Zhang, Qing Liu “Comparison of
three data mining models for predicting diabetes or prediabetes by risk factors.” SciVerse
ScienceDirect Elsevier 2013.
[26] Md. Mozaharul Mottalib, Md. Mokhlesur Rahman, Md. Tarek Habib and 4Farruk Ahmed
“Detection of the Onset of Diabetes Mellitus by Bayesian Classifier Based Medical Expert
System” Transaction on Machine Learning and Artificial Intelligence DOI:
10.14738/tmlai.44.1962 Publication Date: 19th July, 2016.
[27] T. Karthikeyan, K. Vembandasamy , RaghavanAn Intelligent Type-II Diabetes Mellitus
Diagnosis Approach using Improved FP-growth with Hybrid Classifier Based Arm Research
Journal of Applied Sciences, Engineering and Technology 11(5): 549-558, 2015. DOI:
10.19026 /rjaset.11 .1860ISSN: 2040-7459; e-ISSN: 2040-7467.
[28] C. Hsieh, R. Lu, N. Lee, W. Chiu, M. Hsu, and Y. Li, “Novelsolutions for an old disease:
diagnosis of acute appendicitis with random forest, support vector machines, and artificial
neural networks,” Surgery, vol. 149, no. 1, pp. 87–93, 2011.
[29] Nirmala Devi, M.; Appavu, S. ; Swathi, U.V., ―An amalgam KNN to predict diabetes
mellitus:, IEEE, 2013.
[30] X. H. Meng, Y. X. Huang, D. P. Rao, Q. Zhang, and Q. Liu, “Comparison of three data
mining models for predicting diabetes or prediabetes by risk factors,” Kaohsiung Journal of
Medical Sciences, vol. 29, no. 2, pp. 93–99, 2013.
[31] Dilip Kumar Choubey, Santosh Kumar , “Classification of Pima indian diabetes datasetusing
naive bayes with genetic algorithm as anattribute selection” Communication and Computing
Systems – Prasad et al. (Eds) © 2017 Taylor & Francis Group, London, ISBN 978-1-138-
02952-1
[32] M. Kothainayaki*, P. Thangaraj “Clustering and Classifying Diabetic DataSets Using K-
Means Algorithm” Journal of Applied Information Science Volume 1 Issue 1 June 2013
[33] Vidyullatha Pellakuri et al. “Performance Analysis and Optimization of Supervised Learning
Techniques for Medical Diagnosis Using Open Source Tools” International Journal of
Computer Science and Information Technologies, Vol. 6 (1) , 2015, 380-383
[34] Y. pang, Y. Yuan, and X. Li. Effective feature extraction in high dimensional space, IEEE
Trans. Syst., Man, Cybern. B, Cybe
[35] Telgaonkar Archana H., Deshmukh Sachin “Dimensionality Reduction and Classification
through PCA and LDA” International Journal of Computer Applications (0975 – 8887)
Volume 122 – No.17, July 2015.
Author[s] brief Introduction
Ratna Nitin Patil has obtained her Masters in Computer Engineering from Thapar
Institute, Patiala, Punjab in 2001. She is pursuing PhD from Babasaheb Ambedkar
Marathwada University, Aurangabad, India. She has worked as an Associate Professor
at Kanpur Institute of Technology, Kanpur, St Peters College of Engineering, Chennai,
Sriram College of Engineering, Chennai, Mar Baselios College of Engineering,
Trivandrum and at Vishwakarma Institute of Technology, Pune. She has 22 years of
teaching experience. Her research interest includes Machine Learning, Natural
Language Processing and Analysis of Algorithms.
Email:[email protected]
Dr. Sharavari Chandrashekhar Tamane has obtained her PhD in Computer Science
and Engineering from Babasaheb Ambedkar Marathwada University, Aurangabad,
India. She has 15 international publications. She is working as an associate professor in
Jawaharlal Nehru Engineering College, Aurangabad. She is designated as a chairperson
of Second International Conference on Internet of Things, Data and Cloud Computing

International Journal of Computer Engineering and Applications, Volume XI, Issue VIII, August 17, www.ijcea.com ISSN 2321-3469
RATNA NITIN PATIL AND Dr. SHARVARI CHANDRASHEKHAR TAMANE
87
(ICC’17), Cambridge university, United Kingdom Her research area includes Cloud Computing,
Analysis of Algorithms and Network Security.
Email: [email protected]