Embed Size (px)
Citation preview

Lu et al. Biomarker Research (2020) 8:48 https://doi.org/10.1186/s40364-020-00215-2
RESEARCH Open Access
FibroBox: a novel noninvasive tool for
predicting significant liver fibrosis andcirrhosis in HBV infected patients Xiao-Jie Lu1†, Xiao-Jun Yang2†, Jing-Yu Sun1, Xin Zhang3* , Zhao-Xin Yuan4,5* and Xiu-Hui Li6*Abstract
Background: China is a highly endemic area of chronic hepatitis B (CHB). The accuracy of existed noninvasivebiomarkers including TE, APRI and FIB-4 for staging fibrosis is not high enough in Chinese cohort.
Methods: Using liver biopsy as a gold standard, a novel noninvasive indicator was developed using laboratorytests, ultrasound measurements and liver stiffness measurements with machine learning techniques to predictsignificant fibrosis and cirrhosis in CHB patients in north and east part of China. We retrospectively evaluated thediagnostic performance of the novel indicator named FibroBox, Fibroscan, aspartate transaminase-to-platelet ratioindex (APRI), and fibrosis-4 index (FIB-4) in CHB patients from Jilin and Huai’an (training sets) and also in Anhui andBeijing cohorts (validation sets).
Results: Of 1289 eligible HBV patients who had liver histological data, 63.2% had significant fibrosis and 22.5% hadcirrhosis. In LASSO logistic regression and filter methods, fibroscan results, platelet count, alanine transaminase(ALT), prothrombin time (PT), type III procollagen aminoterminal peptide (PIIINP), type IV collagen, laminin,hyaluronic acid (HA) and diameter of spleen vein were finally selected as input variables in FibroBox. Consequently,FibroBox was developed of which the area under the receiver operating characteristic curve (AUROC) wassignificantly higher than that of TE, APRI and FIB-4 to predicting significant fibrosis and cirrhosis. In the Anhui andBeijing cohort, the AUROC of FibroBox was 0.88 (95% CI, 0.72–0.82) and 0.87 (95% CI, 0.83–0.91) for significantfibrosis and 0.87 (95% CI, 0.82–0.92) and 0.90 (95% CI, 0.85–0.94) for cirrhosis. In the validation cohorts, FibroBoxaccurately diagnosed 81% of significant fibrosis and 84% of cirrhosis.
Conclusions: FibroBox has a better performance in predicting liver fibrosis in Chinese cohorts with CHB, which mayserve as a feasible alternative to liver biopsy.
Keywords: Liver fibrosis, HBV, Noninvasive diagnosis, Machine learning
© The Author(s). 2020 Open Access This article is licensed under a Creative Commons Attribution 4.0 International License,which permits use, sharing, adaptation, distribution and reproduction in any medium or format, as long as you giveappropriate credit to the original author(s) and the source, provide a link to the Creative Commons licence, and indicate ifchanges were made. The images or other third party material in this article are included in the article's Creative Commonslicence, unless indicated otherwise in a credit line to the material. If material is not included in the article's Creative Commonslicence and your intended use is not permitted by statutory regulation or exceeds the permitted use, you will need to obtainpermission directly from the copyright holder. To view a copy of this licence, visit http://creativecommons.org/licenses/by/4.0/.The Creative Commons Public Domain Dedication waiver (http://creativecommons.org/publicdomain/zero/1.0/) applies to thedata made available in this article, unless otherwise stated in a credit line to the data.
* Correspondence: [email protected]; [email protected];[email protected]†Xiao-Jie Lu and Xiao-Jun Yang are co-first authors.3Department of Medical Imaging, The Fourth People’s Hospital of Huai’an,Huai’an, China4Changchun Medical College, Changchun, Jilin, China6Department of Integrated Traditional Chinese Medicine and WesternMedicine, Beijing Youan Hospital, Capital Medical University, Beijing, ChinaFull list of author information is available at the end of the article
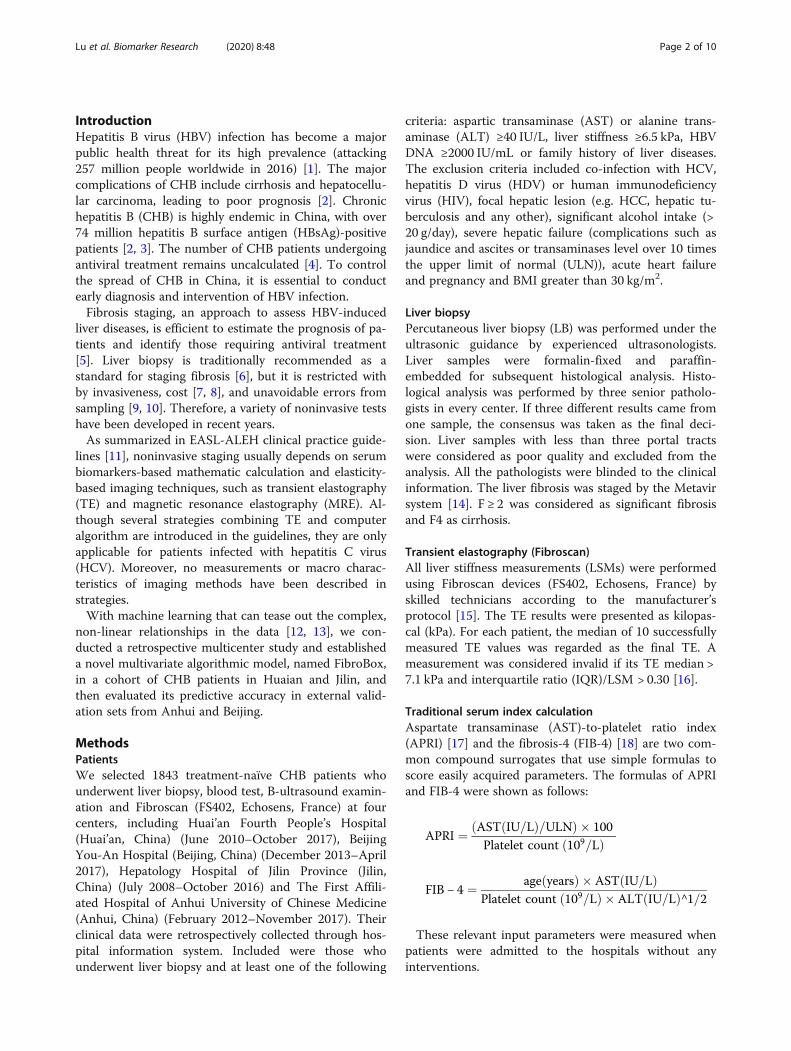
Lu et al. Biomarker Research (2020) 8:48 Page 2 of 10
IntroductionHepatitis B virus (HBV) infection has become a majorpublic health threat for its high prevalence (attacking257 million people worldwide in 2016) [1]. The majorcomplications of CHB include cirrhosis and hepatocellu-lar carcinoma, leading to poor prognosis [2]. Chronichepatitis B (CHB) is highly endemic in China, with over74 million hepatitis B surface antigen (HBsAg)-positivepatients [2, 3]. The number of CHB patients undergoingantiviral treatment remains uncalculated [4]. To controlthe spread of CHB in China, it is essential to conductearly diagnosis and intervention of HBV infection.Fibrosis staging, an approach to assess HBV-induced
liver diseases, is efficient to estimate the prognosis of pa-tients and identify those requiring antiviral treatment[5]. Liver biopsy is traditionally recommended as astandard for staging fibrosis [6], but it is restricted withby invasiveness, cost [7, 8], and unavoidable errors fromsampling [9, 10]. Therefore, a variety of noninvasive testshave been developed in recent years.As summarized in EASL-ALEH clinical practice guide-
lines [11], noninvasive staging usually depends on serumbiomarkers-based mathematic calculation and elasticity-based imaging techniques, such as transient elastography(TE) and magnetic resonance elastography (MRE). Al-though several strategies combining TE and computeralgorithm are introduced in the guidelines, they are onlyapplicable for patients infected with hepatitis C virus(HCV). Moreover, no measurements or macro charac-teristics of imaging methods have been described instrategies.With machine learning that can tease out the complex,
non-linear relationships in the data [12, 13], we con-ducted a retrospective multicenter study and establisheda novel multivariate algorithmic model, named FibroBox,in a cohort of CHB patients in Huaian and Jilin, andthen evaluated its predictive accuracy in external valid-ation sets from Anhui and Beijing.
MethodsPatientsWe selected 1843 treatment-naïve CHB patients whounderwent liver biopsy, blood test, B-ultrasound examin-ation and Fibroscan (FS402, Echosens, France) at fourcenters, including Huai’an Fourth People’s Hospital(Huai’an, China) (June 2010–October 2017), BeijingYou-An Hospital (Beijing, China) (December 2013–April2017), Hepatology Hospital of Jilin Province (Jilin,China) (July 2008–October 2016) and The First Affili-ated Hospital of Anhui University of Chinese Medicine(Anhui, China) (February 2012–November 2017). Theirclinical data were retrospectively collected through hos-pital information system. Included were those whounderwent liver biopsy and at least one of the following
criteria: aspartic transaminase (AST) or alanine trans-aminase (ALT) ≥40 IU/L, liver stiffness ≥6.5 kPa, HBVDNA ≥2000 IU/mL or family history of liver diseases.The exclusion criteria included co-infection with HCV,hepatitis D virus (HDV) or human immunodeficiencyvirus (HIV), focal hepatic lesion (e.g. HCC, hepatic tu-berculosis and any other), significant alcohol intake (>20 g/day), severe hepatic failure (complications such asjaundice and ascites or transaminases level over 10 timesthe upper limit of normal (ULN)), acute heart failureand pregnancy and BMI greater than 30 kg/m2.
Liver biopsyPercutaneous liver biopsy (LB) was performed under theultrasonic guidance by experienced ultrasonologists.Liver samples were formalin-fixed and paraffin-embedded for subsequent histological analysis. Histo-logical analysis was performed by three senior patholo-gists in every center. If three different results came fromone sample, the consensus was taken as the final deci-sion. Liver samples with less than three portal tractswere considered as poor quality and excluded from theanalysis. All the pathologists were blinded to the clinicalinformation. The liver fibrosis was staged by the Metavirsystem [14]. F ≥ 2 was considered as significant fibrosisand F4 as cirrhosis.
Transient elastography (Fibroscan)All liver stiffness measurements (LSMs) were performedusing Fibroscan devices (FS402, Echosens, France) byskilled technicians according to the manufacturer’sprotocol [15]. The TE results were presented as kilopas-cal (kPa). For each patient, the median of 10 successfullymeasured TE values was regarded as the final TE. Ameasurement was considered invalid if its TE median >7.1 kPa and interquartile ratio (IQR)/LSM > 0.30 [16].
Traditional serum index calculationAspartate transaminase (AST)-to-platelet ratio index(APRI) [17] and the fibrosis-4 (FIB-4) [18] are two com-mon compound surrogates that use simple formulas toscore easily acquired parameters. The formulas of APRIand FIB-4 were shown as follows:
APRI ¼ AST IU=Lð Þ=ULNð Þ � 100
Platelet count 109=Lð Þ
FIB − 4 ¼ age yearsð Þ � AST IU=Lð ÞPlatelet count 109=Lð Þ � ALT IU=Lð Þ^1=2
These relevant input parameters were measured whenpatients were admitted to the hospitals without anyinterventions.

Lu et al. Biomarker Research (2020) 8:48 Page 3 of 10
Ultrasonic measurementIn this study, the parameters measured during ultrasonicexaminations included the size of spleen (mm2, length ×thickness), the diameter of splenic vein (mm) and thediameter of portal vein (mm). Every parameter was mea-sured for at least three times by experienced ultrasonol-ogists and the mean value was calculated as the finalscore of each measurement.
Training setsTwo training data sets of treatment-naïve HBV-infectedpatients who entirely met the study criteria from Huai’anand Jilin (n = 549) were subjected to the algorithmicmodel (FibroBox). The sets were not absolutely compar-able, but the mode could normalize these sets.
Validation setsThe diagnostic performances of the FibroBox and othernoninvasive markers were evaluated with external valid-ation sets from Anhui and Beijing cohorts. In the Anhui(n = 408) and Beijing cohorts (n = 332), the CHB patientswho underwent biopsy with available data on TE, AST,ALT and Platelet count were included in the analysis.
FibroBox constructionThe data characteristics, preprocessing and training/test-ing procedures of FibroBox were described in Supple-ment Material 1. All variables were normalized in order
Fig. 1 Flow diagram of the study population and reasons for exclusion. CH
to minimize systematic errors from different centers.And then algorithm models (Supplement Material 1)were used to select significant variables and conducttraining and validation. The machine learning algorithmwas implemented using Python 3.7 (Amsterdam,Netherlands).
Statistical analysisThe diagnostic accuracy of FibroBox and conventionalfibrosis markers (APRI, FIB-4 and Fibroscan) was esti-mated using the area under the receiver operating char-acteristic curve (AUROC) and the rate of correctlyclassified fibrosis/cirrhosis. Delong’s test [19] with a sig-nificant level of 0.05 was used to compare AUROCvalues of the FibroBox and other markers. Agreementsbetween them were described using Cohen’s kappa coef-ficient. The decision curve analysis (DCA) and ROC ana-lysis were computed with R 3.5.1. Statistical analysis wasconducted using SPSS 19.0 (SPSS Inc., Chicago, IL,USA).
ResultsStudy populationBetween July 2008 and November 2017, 1843 HBV-infected patients were retrospectively enrolled in thisstudy (Fig. 1). After exclusion of patients with HCC orother tumors (n = 193) and liver abscess (n = 86), histo-logical specimens of 1393 (75.6%) patients showed
B, chronic HBV; HCC, hepatocellular carcinoma; HDV, hepatitis D virus
Lu et al. Biomarker Research (2020) 8:48 Page 4 of 10
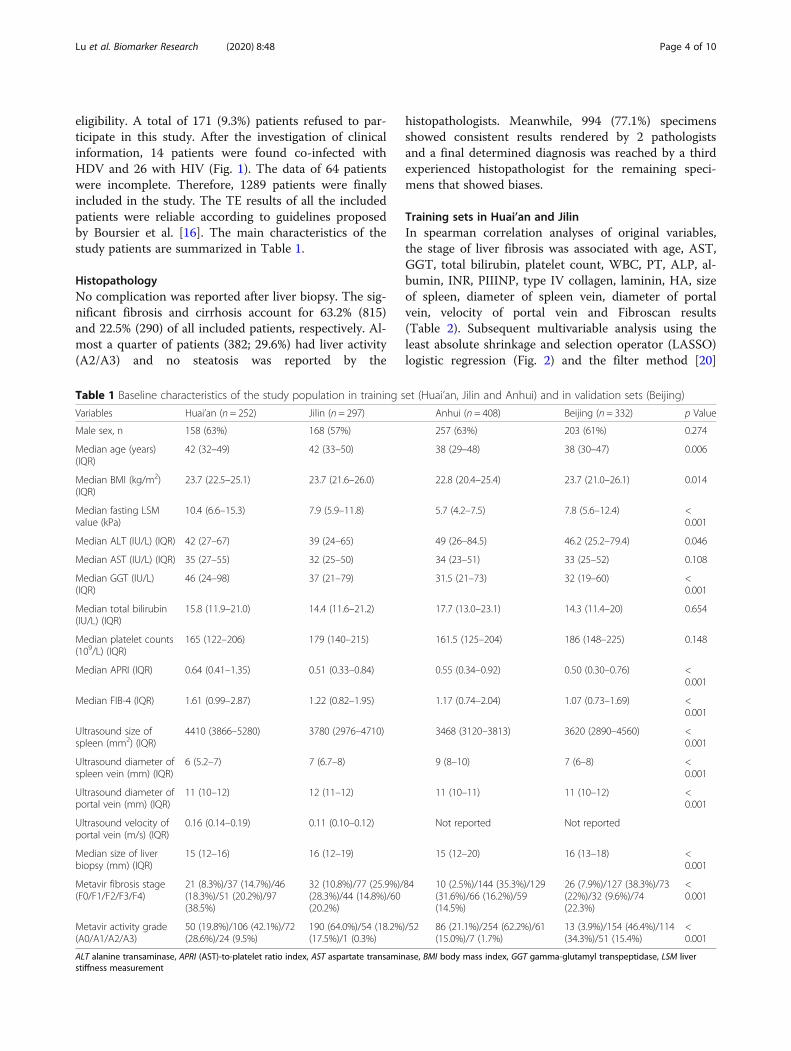
eligibility. A total of 171 (9.3%) patients refused to par-ticipate in this study. After the investigation of clinicalinformation, 14 patients were found co-infected withHDV and 26 with HIV (Fig. 1). The data of 64 patientswere incomplete. Therefore, 1289 patients were finallyincluded in the study. The TE results of all the includedpatients were reliable according to guidelines proposedby Boursier et al. [16]. The main characteristics of thestudy patients are summarized in Table 1.
HistopathologyNo complication was reported after liver biopsy. The sig-nificant fibrosis and cirrhosis account for 63.2% (815)and 22.5% (290) of all included patients, respectively. Al-most a quarter of patients (382; 29.6%) had liver activity(A2/A3) and no steatosis was reported by the
Table 1 Baseline characteristics of the study population in training s
Variables Huai’an (n = 252) Jilin (n = 297)
Male sex, n 158 (63%) 168 (57%)
Median age (years)(IQR)
42 (32–49) 42 (33–50)
Median BMI (kg/m2)(IQR)
23.7 (22.5–25.1) 23.7 (21.6–26.0)
Median fasting LSMvalue (kPa)
10.4 (6.6–15.3) 7.9 (5.9–11.8)
Median ALT (IU/L) (IQR) 42 (27–67) 39 (24–65)
Median AST (IU/L) (IQR) 35 (27–55) 32 (25–50)
Median GGT (IU/L)(IQR)
46 (24–98) 37 (21–79)
Median total bilirubin(IU/L) (IQR)
15.8 (11.9–21.0) 14.4 (11.6–21.2)
Median platelet counts(109/L) (IQR)
165 (122–206) 179 (140–215)
Median APRI (IQR) 0.64 (0.41–1.35) 0.51 (0.33–0.84)
Median FIB-4 (IQR) 1.61 (0.99–2.87) 1.22 (0.82–1.95)
Ultrasound size ofspleen (mm2) (IQR)
4410 (3866–5280) 3780 (2976–4710)
Ultrasound diameter ofspleen vein (mm) (IQR)
6 (5.2–7) 7 (6.7–8)
Ultrasound diameter ofportal vein (mm) (IQR)
11 (10–12) 12 (11–12)
Ultrasound velocity ofportal vein (m/s) (IQR)
0.16 (0.14–0.19) 0.11 (0.10–0.12)
Median size of liverbiopsy (mm) (IQR)
15 (12–16) 16 (12–19)
Metavir fibrosis stage(F0/F1/F2/F3/F4)
21 (8.3%)/37 (14.7%)/46(18.3%)/51 (20.2%)/97(38.5%)
32 (10.8%)/77 (25.9%)/(28.3%)/44 (14.8%)/60(20.2%)
Metavir activity grade(A0/A1/A2/A3)
50 (19.8%)/106 (42.1%)/72(28.6%)/24 (9.5%)
190 (64.0%)/54 (18.2%(17.5%)/1 (0.3%)
ALT alanine transaminase, APRI (AST)-to-platelet ratio index, AST aspartate transaminstiffness measurement
histopathologists. Meanwhile, 994 (77.1%) specimensshowed consistent results rendered by 2 pathologistsand a final determined diagnosis was reached by a thirdexperienced histopathologist for the remaining speci-mens that showed biases.
Training sets in Huai’an and JilinIn spearman correlation analyses of original variables,the stage of liver fibrosis was associated with age, AST,GGT, total bilirubin, platelet count, WBC, PT, ALP, al-bumin, INR, PIIINP, type IV collagen, laminin, HA, sizeof spleen, diameter of spleen vein, diameter of portalvein, velocity of portal vein and Fibroscan results(Table 2). Subsequent multivariable analysis using theleast absolute shrinkage and selection operator (LASSO)logistic regression (Fig. 2) and the filter method [20]
et (Huai’an, Jilin and Anhui) and in validation sets (Beijing)
Anhui (n = 408) Beijing (n = 332) p Value
257 (63%) 203 (61%) 0.274
38 (29–48) 38 (30–47) 0.006
22.8 (20.4–25.4) 23.7 (21.0–26.1) 0.014
5.7 (4.2–7.5) 7.8 (5.6–12.4) <0.001
49 (26–84.5) 46.2 (25.2–79.4) 0.046
34 (23–51) 33 (25–52) 0.108
31.5 (21–73) 32 (19–60) <0.001
17.7 (13.0–23.1) 14.3 (11.4–20) 0.654
161.5 (125–204) 186 (148–225) 0.148
0.55 (0.34–0.92) 0.50 (0.30–0.76) <0.001
1.17 (0.74–2.04) 1.07 (0.73–1.69) <0.001
3468 (3120–3813) 3620 (2890–4560) <0.001
9 (8–10) 7 (6–8) <0.001
11 (10–11) 11 (10–12) <0.001
Not reported Not reported
15 (12–20) 16 (13–18) <0.001
84 10 (2.5%)/144 (35.3%)/129(31.6%)/66 (16.2%)/59(14.5%)
26 (7.9%)/127 (38.3%)/73(22%)/32 (9.6%)/74(22.3%)
<0.001
)/52 86 (21.1%)/254 (62.2%)/61(15.0%)/7 (1.7%)
13 (3.9%)/154 (46.4%)/114(34.3%)/51 (15.4%)
<0.001
ase, BMI body mass index, GGT gamma-glutamyl transpeptidase, LSM liver

Table 2 Selection for orginal variables associated with the presence of fibrosis stage in the training set
Variables Spearman correlation analysis Combined multivariate analysis
r value p value Significant fibrosis vs none Cirrhosis vs F0–3
Age (years) 0.223 < 0.001
Male sex, n (%) −0.021 0.630
BMI −0.013 0.770
ALT (IU/L) 0.030 0.489
AST (IU/L) 0.171 < 0.001 √ √
GGT (IU/L) 0.187 < 0.001 √ √
Total bilirubin (IU/L) 0.110 0.010
Platelet count (109/L) −0.356 < 0.001 √ √
WBC (109/L) −0.257 < 0.001
PT (s) 0.321 < 0.001 √ √
ALP (IU/L) 0.094 0.027
Albumin (g/L) −0.144 0.001
Cholesterol (mmol/L) −0.071 0.099
INR 0.356 < 0.001
PIIINP (ng/ml) 0.330 < 0.001 √ √
Type IV collagen (ng/ml) 0.478 < 0.001 √ √
Laminin (ng/ml) 0.465 < 0.001 √ √
HA (ng/ml) 0.444 < 0.001 √ √
Ultrasound size of spleen (mm2) 0.223 < 0.001
Ultrasound diameter of spleen vein (mm) 0.097 0.024
Ultrasound diameter of portal vein (mm) 0.138 0.001 √ √
Ultrasound velocity of portal vein (m/s) 0.179 < 0.001
Fibroscan results (kPa) 0.767 < 0.001 √ √
ALT alanine transaminase, ALP alkaline phosphatase, AST aspartate transaminase, BMI body mass index, GGT gamma-glutamyl transpeptidase, HA hyaluronic acid,INR international normalized ratio, PIIINP type III procollagen aminoterminal peptide, PT prothrombin time, WBC white blood cell
Lu et al. Biomarker Research (2020) 8:48 Page 5 of 10
(supplement material 1) selected Fibroscan results, plate-let count, AST, PT, PIIINP, type IV collagen, laminin,HA and diameter of portal vein as input parameters ofdiagnostic models for significant fibrosis and cirrhosis.In the training cohort, the AUROC of the FibroBox
for predicting significant fibrosis (0.914, 95% CI 0.890 to0.938) was higher than that of the models using TEalone (0.886, 95% CI 0.856 to 0.917), APRI (0.692, 95%CI 0.643 to 0.741) or FIB-4 (0.707, 95% CI 0.659 to0.755). The optimal cut-off value of FibroBox was 0.38.For predicting cirrhosis, the AUROC of FibroBox
(0.914, 95% CI 0.885 to 0.943) was better than that ofTE (0.880, 95% CI 0.844 to 0.917), APRI (0.705, 95% CI0.659 to 0.752) and FIB-4 (0.758, 95% CI 0.713 to 0.804).The optimal cut-off value of FibroBox was 0.56.
Validation set in AnhuiIn the Anhui cohort (n = 408), fibrosis stage based onhistopathology was shown as follows: 10 (2.5%) in F0,144 (35.3%) in F1, 129 (31.6%) in F2, 66 (16.2%) in F3and 59 (14.5%) in F4 (Table 1).
The diagnostic performance (Fig. 3a) of FibroBox wasbetter than TE, APRI and FIB-4: AUROC at 0.88 (95%CI 0.84 to 0.92) for predicting significant fibrosis and0.87 (95% CI 0.82 to 0.92) for predicting cirrhosis(Table 3). Applying the optimal cut-off value (0.38 forsignificant fibrosis and 0.56 for cirrhosis) determined inthe training set, the correctly classified rate of predictingsignificant fibrosis and cirrhosis was both 0.81 (se: 0.80,sp.: 0.82; se: 0.51, sp.: 0.94, respectively).Across the range of reasonable threshold probabilities
in this cohort, DCA graphically demonstrated thatFibroBox provided a larger net benefit compared withTE, APRI and FIB-4 in diagnosing significant fibrosisand cirrhosis (Fig. 4a). This became as the supplemen-tary evidence for the comparison of FibroBox and TE(p = 0.058) in predicting cirrhosis.
Validation set in BeijingIn the Beijing cohort (n = 332), 26 (7.9%) were F0, 127(38.3%) were F1, 73 (22%) were F2, 32 (9.6%) were F3

Fig. 2 Feature selection by using a parametric method, the least absolute shrinkage and selection operator (LASSO) regression. a Significant fibrosisfeature selection of tuning parameter (λ) in the LASSO model used 10-fold cross-validation via minimum criteria. The AUC curve was plotted versus log(λ).Dotted vertical lines were drawn at the optimal values by using the minimum criteria and the 1 standard error of the minimum criteria (the 1 – standarderror criteria). The optimal log(λ) of − 3.96 was chosen. b Cirrhosis feature selection and the optimal log(λ) of − 4.83 was chosen. c LASSO coefficientprofiles of the 18 initially selected features. A vertical line was plotted at the optimal λ value, which resulted in 9 features with nonzero coefficients. dLASSO coefficient profiles of the 16 initially selected features. A vertical line was plotted at the optimal λ value, which resulted in 9 features withnonzero coefficients
Lu et al. Biomarker Research (2020) 8:48 Page 6 of 10
and 74 (22.3%) were F4 according to the liver histologyresults (Table 1).For the prediction of significant fibrosis (Fig. 3b), it
was statistically significant that the AUROC of FibroBox(0.87, 95% CI 0.83 to 0.91) was higher than that of TE(0.82, 95% CI 0.77 to 0.87, p < 0.001), APRI (0.70, 95%CI 0.65 to 0.76, p < 0.001) and FIB-4 (0.67, 95% CI 0.61to 0.73, p < 0.001) (Table 3). For predicting cirrhosis(Fig. 3b), the performance of FibroBox (0.90, 95% CI0.85 to 0.94) was significantly better than that of APRI(0.75, 95% CI 0.67 to 0.82, p < 0.001) and FIB-4 (0.70,95% CI 0.62 to 0.79, p < 0.001) (Table 3). There was nosignificant difference between FibroBox and TE (0.89,95% CI 0.85 to 0.94, p = 0.863). DCA also showed con-sistent results (Fig. 4b).
DiscussionIn China, assessing the severity of CHB infection is acritical step before timely intervention [4]. TE has alsobeen widely applied in Chinese hospitals in recent years,regardless of its high price.To stage liver fibrosis noninvasively in patients with
HBV, our study established and validated a multivariablemodel based on machine-learning and incorporatingFibroscan results, serum biomarker indices and ultrasonicmeasurements. This FibroBox model demonstrated favor-able diagnostic performances in two external validationcohorts for the prediction of significant fibrosis which wassuperior to TE, APRI and FIB-4. The diagnostic perform-ance of FibroBox for predicting cirrhosis was potentiallybetter than TE, which required more validations.
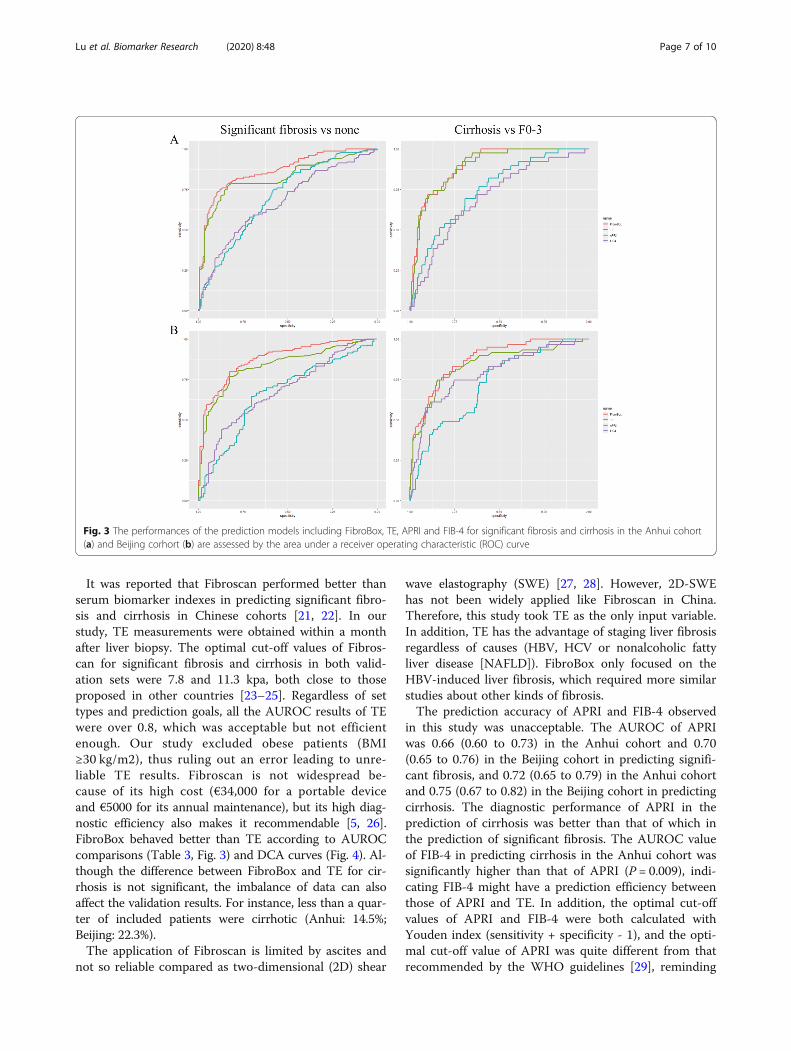
Fig. 3 The performances of the prediction models including FibroBox, TE, APRI and FIB-4 for significant fibrosis and cirrhosis in the Anhui cohort(a) and Beijing corhort (b) are assessed by the area under a receiver operating characteristic (ROC) curve
Lu et al. Biomarker Research (2020) 8:48 Page 7 of 10
It was reported that Fibroscan performed better thanserum biomarker indexes in predicting significant fibro-sis and cirrhosis in Chinese cohorts [21, 22]. In ourstudy, TE measurements were obtained within a monthafter liver biopsy. The optimal cut-off values of Fibros-can for significant fibrosis and cirrhosis in both valid-ation sets were 7.8 and 11.3 kpa, both close to thoseproposed in other countries [23–25]. Regardless of settypes and prediction goals, all the AUROC results of TEwere over 0.8, which was acceptable but not efficientenough. Our study excluded obese patients (BMI≥30 kg/m2), thus ruling out an error leading to unre-liable TE results. Fibroscan is not widespread be-cause of its high cost (€34,000 for a portable deviceand €5000 for its annual maintenance), but its high diag-nostic efficiency also makes it recommendable [5, 26].FibroBox behaved better than TE according to AUROCcomparisons (Table 3, Fig. 3) and DCA curves (Fig. 4). Al-though the difference between FibroBox and TE for cir-rhosis is not significant, the imbalance of data can alsoaffect the validation results. For instance, less than a quar-ter of included patients were cirrhotic (Anhui: 14.5%;Beijing: 22.3%).The application of Fibroscan is limited by ascites and
not so reliable compared as two-dimensional (2D) shear
wave elastography (SWE) [27, 28]. However, 2D-SWEhas not been widely applied like Fibroscan in China.Therefore, this study took TE as the only input variable.In addition, TE has the advantage of staging liver fibrosisregardless of causes (HBV, HCV or nonalcoholic fattyliver disease [NAFLD]). FibroBox only focused on theHBV-induced liver fibrosis, which required more similarstudies about other kinds of fibrosis.The prediction accuracy of APRI and FIB-4 observed
in this study was unacceptable. The AUROC of APRIwas 0.66 (0.60 to 0.73) in the Anhui cohort and 0.70(0.65 to 0.76) in the Beijing cohort in predicting signifi-cant fibrosis, and 0.72 (0.65 to 0.79) in the Anhui cohortand 0.75 (0.67 to 0.82) in the Beijing cohort in predictingcirrhosis. The diagnostic performance of APRI in theprediction of cirrhosis was better than that of which inthe prediction of significant fibrosis. The AUROC valueof FIB-4 in predicting cirrhosis in the Anhui cohort wassignificantly higher than that of APRI (P = 0.009), indi-cating FIB-4 might have a prediction efficiency betweenthose of APRI and TE. In addition, the optimal cut-offvalues of APRI and FIB-4 were both calculated withYouden index (sensitivity + specificity - 1), and the opti-mal cut-off value of APRI was quite different from thatrecommended by the WHO guidelines [29], reminding
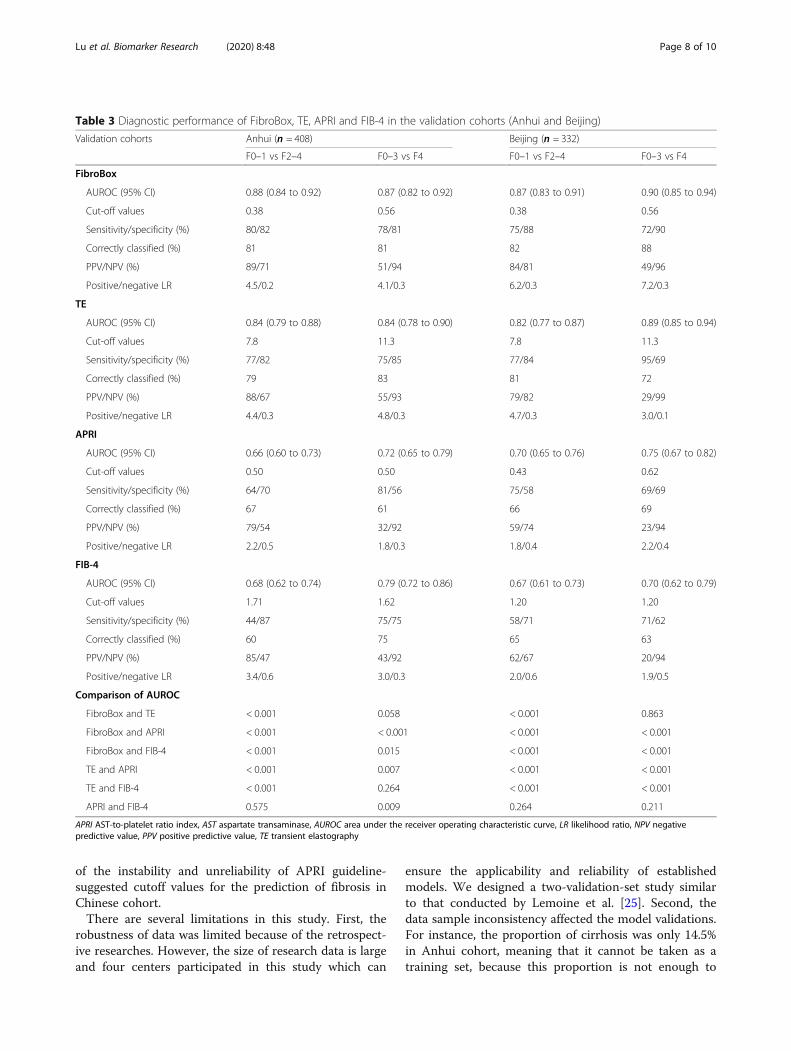
Table 3 Diagnostic performance of FibroBox, TE, APRI and FIB-4 in the validation cohorts (Anhui and Beijing)
Validation cohorts Anhui (n = 408) Beijing (n = 332)
F0–1 vs F2–4 F0–3 vs F4 F0–1 vs F2–4 F0–3 vs F4
FibroBox
AUROC (95% CI) 0.88 (0.84 to 0.92) 0.87 (0.82 to 0.92) 0.87 (0.83 to 0.91) 0.90 (0.85 to 0.94)
Cut-off values 0.38 0.56 0.38 0.56
Sensitivity/specificity (%) 80/82 78/81 75/88 72/90
Correctly classified (%) 81 81 82 88
PPV/NPV (%) 89/71 51/94 84/81 49/96
Positive/negative LR 4.5/0.2 4.1/0.3 6.2/0.3 7.2/0.3
TE
AUROC (95% CI) 0.84 (0.79 to 0.88) 0.84 (0.78 to 0.90) 0.82 (0.77 to 0.87) 0.89 (0.85 to 0.94)
Cut-off values 7.8 11.3 7.8 11.3
Sensitivity/specificity (%) 77/82 75/85 77/84 95/69
Correctly classified (%) 79 83 81 72
PPV/NPV (%) 88/67 55/93 79/82 29/99
Positive/negative LR 4.4/0.3 4.8/0.3 4.7/0.3 3.0/0.1
APRI
AUROC (95% CI) 0.66 (0.60 to 0.73) 0.72 (0.65 to 0.79) 0.70 (0.65 to 0.76) 0.75 (0.67 to 0.82)
Cut-off values 0.50 0.50 0.43 0.62
Sensitivity/specificity (%) 64/70 81/56 75/58 69/69
Correctly classified (%) 67 61 66 69
PPV/NPV (%) 79/54 32/92 59/74 23/94
Positive/negative LR 2.2/0.5 1.8/0.3 1.8/0.4 2.2/0.4
FIB-4
AUROC (95% CI) 0.68 (0.62 to 0.74) 0.79 (0.72 to 0.86) 0.67 (0.61 to 0.73) 0.70 (0.62 to 0.79)
Cut-off values 1.71 1.62 1.20 1.20
Sensitivity/specificity (%) 44/87 75/75 58/71 71/62
Correctly classified (%) 60 75 65 63
PPV/NPV (%) 85/47 43/92 62/67 20/94
Positive/negative LR 3.4/0.6 3.0/0.3 2.0/0.6 1.9/0.5
Comparison of AUROC
FibroBox and TE < 0.001 0.058 < 0.001 0.863
FibroBox and APRI < 0.001 < 0.001 < 0.001 < 0.001
FibroBox and FIB-4 < 0.001 0.015 < 0.001 < 0.001
TE and APRI < 0.001 0.007 < 0.001 < 0.001
TE and FIB-4 < 0.001 0.264 < 0.001 < 0.001
APRI and FIB-4 0.575 0.009 0.264 0.211
APRI AST-to-platelet ratio index, AST aspartate transaminase, AUROC area under the receiver operating characteristic curve, LR likelihood ratio, NPV negativepredictive value, PPV positive predictive value, TE transient elastography
Lu et al. Biomarker Research (2020) 8:48 Page 8 of 10
of the instability and unreliability of APRI guideline-suggested cutoff values for the prediction of fibrosis inChinese cohort.There are several limitations in this study. First, the
robustness of data was limited because of the retrospect-ive researches. However, the size of research data is largeand four centers participated in this study which can
ensure the applicability and reliability of establishedmodels. We designed a two-validation-set study similarto that conducted by Lemoine et al. [25]. Second, thedata sample inconsistency affected the model validations.For instance, the proportion of cirrhosis was only 14.5%in Anhui cohort, meaning that it cannot be taken as atraining set, because this proportion is not enough to
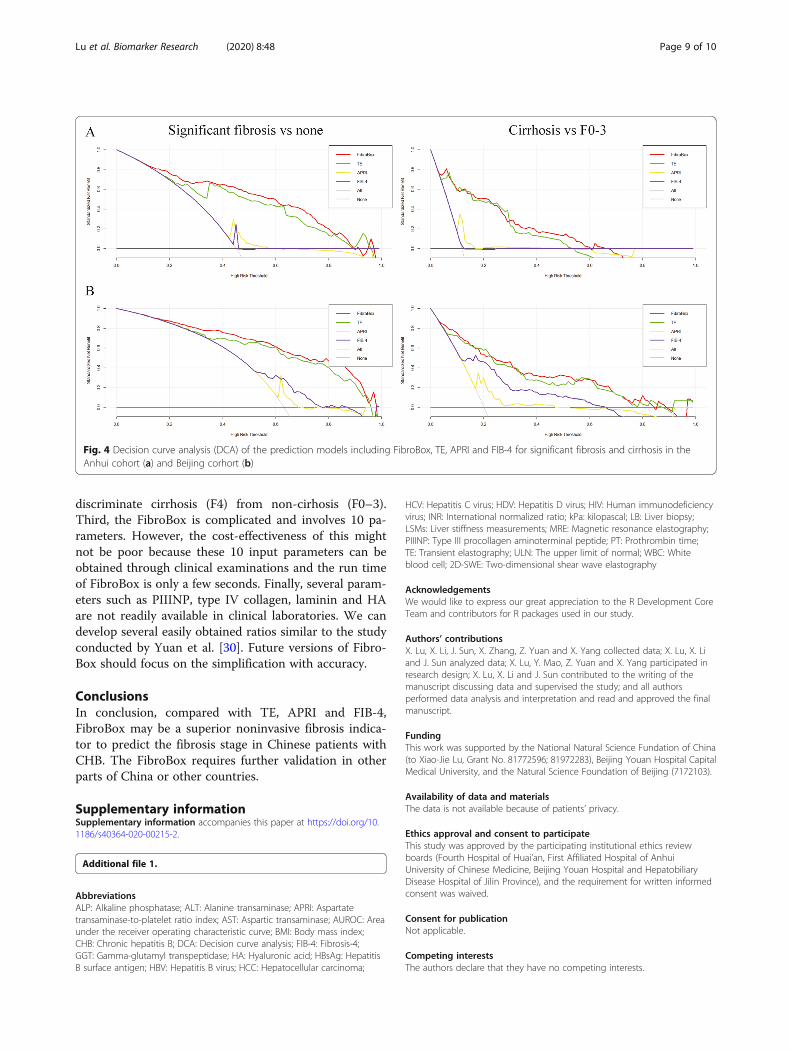
Fig. 4 Decision curve analysis (DCA) of the prediction models including FibroBox, TE, APRI and FIB-4 for significant fibrosis and cirrhosis in theAnhui cohort (a) and Beijing corhort (b)
Lu et al. Biomarker Research (2020) 8:48 Page 9 of 10
discriminate cirrhosis (F4) from non-cirhosis (F0–3).Third, the FibroBox is complicated and involves 10 pa-rameters. However, the cost-effectiveness of this mightnot be poor because these 10 input parameters can beobtained through clinical examinations and the run timeof FibroBox is only a few seconds. Finally, several param-eters such as PIIINP, type IV collagen, laminin and HAare not readily available in clinical laboratories. We candevelop several easily obtained ratios similar to the studyconducted by Yuan et al. [30]. Future versions of Fibro-Box should focus on the simplification with accuracy.
ConclusionsIn conclusion, compared with TE, APRI and FIB-4,FibroBox may be a superior noninvasive fibrosis indica-tor to predict the fibrosis stage in Chinese patients withCHB. The FibroBox requires further validation in otherparts of China or other countries.
Supplementary informationSupplementary information accompanies this paper at https://doi.org/10.1186/s40364-020-00215-2.
Additional file 1.
AbbreviationsALP: Alkaline phosphatase; ALT: Alanine transaminase; APRI: Aspartatetransaminase-to-platelet ratio index; AST: Aspartic transaminase; AUROC: Areaunder the receiver operating characteristic curve; BMI: Body mass index;CHB: Chronic hepatitis B; DCA: Decision curve analysis; FIB-4: Fibrosis-4;GGT: Gamma-glutamyl transpeptidase; HA: Hyaluronic acid; HBsAg: HepatitisB surface antigen; HBV: Hepatitis B virus; HCC: Hepatocellular carcinoma;
HCV: Hepatitis C virus; HDV: Hepatitis D virus; HIV: Human immunodeficiencyvirus; INR: International normalized ratio; kPa: kilopascal; LB: Liver biopsy;LSMs: Liver stiffness measurements; MRE: Magnetic resonance elastography;PIIINP: Type III procollagen aminoterminal peptide; PT: Prothrombin time;TE: Transient elastography; ULN: The upper limit of normal; WBC: Whiteblood cell; 2D-SWE: Two-dimensional shear wave elastography
AcknowledgementsWe would like to express our great appreciation to the R Development CoreTeam and contributors for R packages used in our study.
Authors’ contributionsX. Lu, X. Li, J. Sun, X. Zhang, Z. Yuan and X. Yang collected data; X. Lu, X. Liand J. Sun analyzed data; X. Lu, Y. Mao, Z. Yuan and X. Yang participated inresearch design; X. Lu, X. Li and J. Sun contributed to the writing of themanuscript discussing data and supervised the study; and all authorsperformed data analysis and interpretation and read and approved the finalmanuscript.
FundingThis work was supported by the National Natural Science Fundation of China(to Xiao-Jie Lu, Grant No. 81772596; 81972283), Beijing Youan Hospital CapitalMedical University, and the Natural Science Foundation of Beijing (7172103).
Availability of data and materialsThe data is not available because of patients’ privacy.
Ethics approval and consent to participateThis study was approved by the participating institutional ethics reviewboards (Fourth Hospital of Huai’an, First Affiliated Hospital of AnhuiUniversity of Chinese Medicine, Beijing Youan Hospital and HepatobiliaryDisease Hospital of Jilin Province), and the requirement for written informedconsent was waived.
Consent for publicationNot applicable.
Competing interestsThe authors declare that they have no competing interests.
Lu et al. Biomarker Research (2020) 8:48 Page 10 of 10
Author details1Department of General Surgery, The First Affiliated Hospital of NanjingMedical University, Nanjing Medical University, Nanjing, China. 2Departmentof Infection, the First Affiliated Hospital of Anhui University of ChineseMedicine, Hefei, China. 3Department of Medical Imaging, The Fourth People’sHospital of Huai’an, Huai’an, China. 4Changchun Medical College,Changchun, Jilin, China. 5Department of Hepatology, Hepatobiliary DiseaseHospital of Jilin Province, Changchun, Jilin, China. 6Department of IntegratedTraditional Chinese Medicine and Western Medicine, Beijing Youan Hospital,Capital Medical University, Beijing, China.
Received: 21 April 2020 Accepted: 11 August 2020
References1. Seto WK, Lo YR, Pawlotsky JM, Yuen MF. Chronic hepatitis B virus infection.
Lancet. 2018;392(10161):2313–24.2. Schweitzer A, Horn J, Mikolajczyk RT, Krause G, Ott JJ. Estimations of
worldwide prevalence of chronic hepatitis B virus infection: a systematicreview of data published between 1965 and 2013. Lancet. 2015;386(10003):1546–55.
3. Ott JJ, Horn J, Krause G, Mikolajczyk RT. Time trends of chronic HBVinfection over prior decades - a global analysis. J Hepatol. 2017;66(1):48–54.
4. Wang FS, Fan JG, Zhang Z, Gao B, Wang HY. The global burden of liverdisease: the major impact of China. Hepatology. 2014;60(6):2099–108.
5. European Association for the Study of the Liver. EASL 2017 clinical practiceguidelines on the management of hepatitis B virus infection. J Hepatol.2017;67(2):370–98 Electronic address: [email protected].
6. Rockey DC, Caldwell SH, Goodman ZD, Nelson RC. Smith AD; AmericanAssociation for the Study of Liver Diseases. Liver Biopsy Hepatology. 2009;49(3):1017–44.
7. Perrault J, McGill DB, Ott BJ, Taylor WF. Liver biopsy: complications in 1000inpatients and outpatients. Gastroenterology. 1978;74(1):103–6.
8. Strassburg CP, Manns MP. Approaches to liver biopsy techniques--revisited.Semin Liver Dis. 2006;26(4):318–27 Review.
9. Maharaj B, Maharaj RJ, Leary WP, Cooppan RM, Naran AD, Pirie D, PudifinDJ. Sampling variability and its influence on the diagnostic yield ofpercutaneous needle biopsy of the liver. Lancet. 1986;1(8480):523–5.
10. Regev A, Berho M, Jeffers LJ, Milikowski C, Molina EG, Pyrsopoulos NT, FengZZ, Reddy KR, Schiff ER. Sampling error and intraobserver variation in liverbiopsy in patients with chronic HCV infection. Am J Gastroenterol. 2002;97(10):2614–8.
11. European Association for Study of Liver; Asociacion Latinoamericana para elEstudio del Higado. EASL-ALEH clinical practice guidelines: non-invasivetests for evaluation of liver disease severity and prognosis. J Hepatol. 2015;63(1):237–64.
12. Obermeyer Z, Emanuel EJ. Predicting the future - big data, machinelearning, and clinical medicine. N Engl J Med. 2016;375(13):1216–9.
13. Chen JH, Asch SM. Machine learning and prediction in medicine - beyondthe peak of inflated expectations. N Engl J Med. 2017;376(26):2507–9.
14. Bedossa P, Poynard T. An algorithm for the grading of activity in chronichepatitis C. The METAVIR Cooperative Study Group. Hepatology. 1996;24(2):289–93.
15. Sandrin L, Fourquet B, Hasquenoph JM, Yon S, Fournier C, Mal F, ChristidisC, Ziol M, Poulet B, Kazemi F, Beaugrand M, Palau R. Transient elastography:a new noninvasive method for assessment of hepatic fibrosis. UltrasoundMed Biol. 2003;29(12):1705–13.
16. Boursier J, Zarski JP, de Ledinghen V, Rousselet MC, Sturm N, Lebail B,Fouchard-Hubert I, Gallois Y, Oberti F, Bertrais S, Calès P, Multicentric Groupfrom ANRS/HC/EP23 FIBROSTAR Studies. Determination of reliability criteriafor liver stiffness evaluation by transient elastography. Hepatology. 2013;57(3):1182–91.
17. Wai CT, Greenson JK, Fontana RJ, Kalbfleisch JD, Marrero JA, ConjeevaramHS, Lok AS. A simple noninvasive index can predict both significant fibrosisand cirrhosis in patients with chronic hepatitis C. Hepatology. 2003;38(2):518–26.
18. Vallet-Pichard A, Mallet V, Pol S. FIB-4: a simple, inexpensive and accuratemarker of fibrosis in HCV-infected patients. Hepatology. 2006;44(3):769author reply 769-70.
19. Delong ER, Clarke-Pearson DLL. Comparing the areas under two or morecorrelated receiver operating characteristic curves: a nonparametricapproach. Biometrics. 1988;44(3):837–45.
20. Torlay L, Perrone-Bertolotti M, Thomas E, Baciu M. Machine learning-XGBoost analysis of language networks to classify patients with epilepsy.Brain Inform. 2017;4(3):159–69.
21. Chen Y, Wang Y, Chen Y, Yu Z, Chi X, Hu KQ, Li Q, Tan L, Xiang D, Shang Q,Lei C, Chen L, Hu X, Wang J, Liu H, Lu W, Chi W, Dong Z, Wang X, Li Z, XiaoH, Chen D, Bai W, Zhang C, Xiao G, Qi X, Chen J, Zhou L, Sun H, Deng M, QiX, Zhang Z, Qi X, Yang Y. A novel noninvasive program for staging liverfibrosis in untreated patients with chronic hepatitis B. Clin TranslGastroenterol. 2019;10(5):1–12.
22. Lu XJ, Li XH, Yuan ZX, Sun HY, Wang XC, Qi X, Zhang X, Sun B. Assessmentof liver fibrosis with the gamma-glutamyl transpeptidase to platelet ratio: amulticentre validation in patients with HBV infection. Gut. 2018;67(10):1903–4.
23. Marcellin P, Ziol M, Bedossa P, Douvin C, Poupon R, de Lédinghen V,Beaugrand M. Non-invasive assessment of liver fibrosis by stiffnessmeasurement in patients with chronic hepatitis B. Liver Int. 2009;29(2):242–7.
24. Castéra L, Bernard PH, Le Bail B, Foucher J, Trimoulet P, Merrouche W,Couzigou P, de Lédinghen V. Transient elastography and biomarkers forliver fibrosis assessment and follow-up of inactive hepatitis B carriers.Aliment Pharmacol Ther. 2011;33(4):455–65.
25. Lemoine M, Shimakawa Y, Nayagam S, Khalil M, Suso P, Lloyd J, Goldin R,Njai HF, Ndow G, Taal M, Cooke G, D'Alessandro U, Vray M, Mbaye PS, NjieR, Mallet V, Thursz M. The gamma-glutamyl transpeptidase to platelet ratio(GPR) predicts significant liver fibrosis and cirrhosis in patients with chronicHBV infection in West Africa. Gut. 2016;65(8):1369–76.
26. Terrault NA, Lok ASF, McMahon BJ, Chang KM, Hwang JP, Jonas MM, BrownRS Jr, Bzowej NH, Wong JB. Update on prevention, diagnosis, and treatmentof chronic hepatitis B: AASLD 2018 hepatitis B guidance. Hepatology. 2018;67(4):1560–99.
27. Dietrich CF, Bamber J, Berzigotti A, Bota S, Cantisani V, Castera L, CosgroveD, Ferraioli G, Friedrich-Rust M, Gilja OH, Goertz RS, Karlas T, de Knegt R, deLedinghen V, Piscaglia F, Procopet B, Saftoiu A, Sidhu PS, Sporea I, Thiele M.EFSUMB guidelines and recommendations on the clinical use of liverultrasound Elastography, update 2017 (long version). Ultraschall Med. 2017;38(4):e16–47.
28. Jeong JY, Cho YS, Sohn JH. Role of two-dimensional shear waveelastography in chronic liver diseases: a narrative review. World JGastroenterol. 2018;24(34):3849–60.
29. WHO. World Health Organization. Guidelines for the Prevention, Care andTreatment of Persons with chronic Hepatitis B infection. 2015. http://who.int/hiv/pub/hepatitis/hepatitis-b-guidelines/en/ (accessed 17 Mar 2015).
30. Yuan X, Duan SZ, Cao J, Gao N, Xu J, Zhang L. Noninvasive inflammatorymarkers for assessing liver fibrosis stage in autoimmune hepatitis patients.Eur J Gastroenterol Hepatol. 2019;31(11):1467–74.
Publisher’s NoteSpringer Nature remains neutral with regard to jurisdictional claims inpublished maps and institutional affiliations.