Embed Size (px)
Citation preview
Applied Energy 126 (2014) 78–89
Contents lists available at ScienceDirect
Applied Energy
journal homepage: www.elsevier .com/ locate/apenergy
A novel thermomechanical energy conversion cycle
http://dx.doi.org/10.1016/j.apenergy.2014.03.0690306-2619/� 2014 Elsevier Ltd. All rights reserved.
⇑ Corresponding author. Tel.: +1 (310) 206 5598; fax: +1 (310) 206 4830.E-mail address: [email protected] (L. Pilon).
Ian M. McKinley, Felix Y. Lee, Laurent Pilon ⇑Mechanical and Aerospace Engineering Department, Henry Samueli School of Engineering and Applied Science, University of California, Los Angeles, Los Angeles, CA 90095, USA
h i g h l i g h t s
� Demonstration of a novel cycle converting thermal and mechanical energy directly into electrical energy.� The new cycle is adaptable to changing thermal and mechanical conditions.� The new cycle can generate electrical power at temperatures below those of other pyroelectric power cycles.� The new cycle can generate larger electrical power than traditional mechanical cycles using piezoelectric materials.
a r t i c l e i n f o
Article history:Received 21 May 2013Received in revised form 18 February 2014Accepted 26 March 2014
Keywords:Pyroelectric materialsDirect energy conversionWaste heat harvestingFerroelectric materialsOlsen cycleThermomechanical energy
a b s t r a c t
This paper presents a new power cycle for direct conversion of thermomechanical energy into electricalenergy performed on pyroelectric materials. It consists sequentially of (i) an isothermal electric polingprocess performed under zero stress followed by (ii) a combined uniaxial compressive stress and heatingprocess, (iii) an isothermal electric de-poling process under uniaxial stress, and finally (iv) the removal ofcompressive stress during a cooling process. The new cycle was demonstrated experimentally on[001]-poled PMN-28PT single crystals. The maximum power and energy densities obtained were41 W/L and 41 J/L/cycle respectively for cold and hot source temperatures of 22 and 130 �C, electric fieldbetween 0.2 and 0.95 MV/m, and with uniaxial load of 35.56 MPa at frequency of 1 Hz. The performanceand constraints on the operating conditions of the new cycle were compared with those of the Olsencycle. The new cycle was able to generate power at temperatures below those of the Olsen cycle. Inaddition, the new power cycle can adapt to changing thermal and mechanical conditions.
� 2014 Elsevier Ltd. All rights reserved.
1. Introduction
Harvesting thermal and/or mechanical energies that are typi-cally wasted could contribute to more sustainable and efficientenergy use. Waste mechanical energy is an unavoidable by-prod-uct of objects in motion and exists in the form of vibrations, shocks,or strains [1]. Sources of waste mechanical energy include fluidflow, household appliances, industrial equipment, motor vehicles,and structures such as buildings and bridges [1]. In addition, wasteheat is the inevitable by-product of power, refrigeration, and heatpump cycles, according to the second law of thermodynamics [2].In fact, many sources of waste heat, such as electricity generationand transportation systems, also waste mechanical energy.
The most widely used method to harvest mechanical energy ispiezoelectric energy conversion [3]. It makes use of the piezoelectriceffect to convert time-dependent mechanical deformations intoelectricity [1]. Other methods for direct mechanical to electrical
energy conversion include electromagnet, electrostatic, and electro-active polymer generators [1]. Similarly, various methods are avail-able to harvest waste heat. For example, Stirling engines [4] andorganic Rankine cycles [5] have been used to convert low gradethermal energy into mechanical energy. Thermoelectric devicesconvert a steady-state temperature difference at the junction oftwo dissimilar metals or semiconductors into electrical energy [6].By contrast, the Olsen cycle [7] performed on pyroelectric materialsutilizes time-dependent temperature oscillations to convert ther-mal energy directly into electricity. Note that none of these energyconversion methods are capable of converting both thermal andmechanical energies directly into electricity.
Pyroelectric materials possess a temperature-dependent spon-taneous polarization, defined as the average electric dipolemoment per unit volume, in absence of an applied electric field[8]. A subclass of pyroelectric materials, known as ferroelectrics,has the ability to switch the direction and magnitude of the spon-taneous polarization by reversing the applied electric field abovethe coercive electric field [9]. Pyroelectric materials are also piezo-electric, i.e., the electric charge at the material surface changes
I.M. McKinley et al. / Applied Energy 126 (2014) 78–89 79
when the material is mechanically deformed. Applying a compres-sive stress in the poling direction decreases the electric displace-ment for a given temperature and electric field. The reduction insurface charge results in current in the external load.
This study aims to demonstrate the feasibility of a novel powercycle performed on pyroelectric materials to convert both thermaland mechanical energies directly into electrical energy. This newcycle was demonstrated on commercially available [001]-poledlead magnesium niobate-lead titanate 0.72PbMg1/3Nb2/3O3-
�0.28PbTiO3
(PMN-28PT) single crystals.
2. Background
2.1. Dielectric hysteresis loops
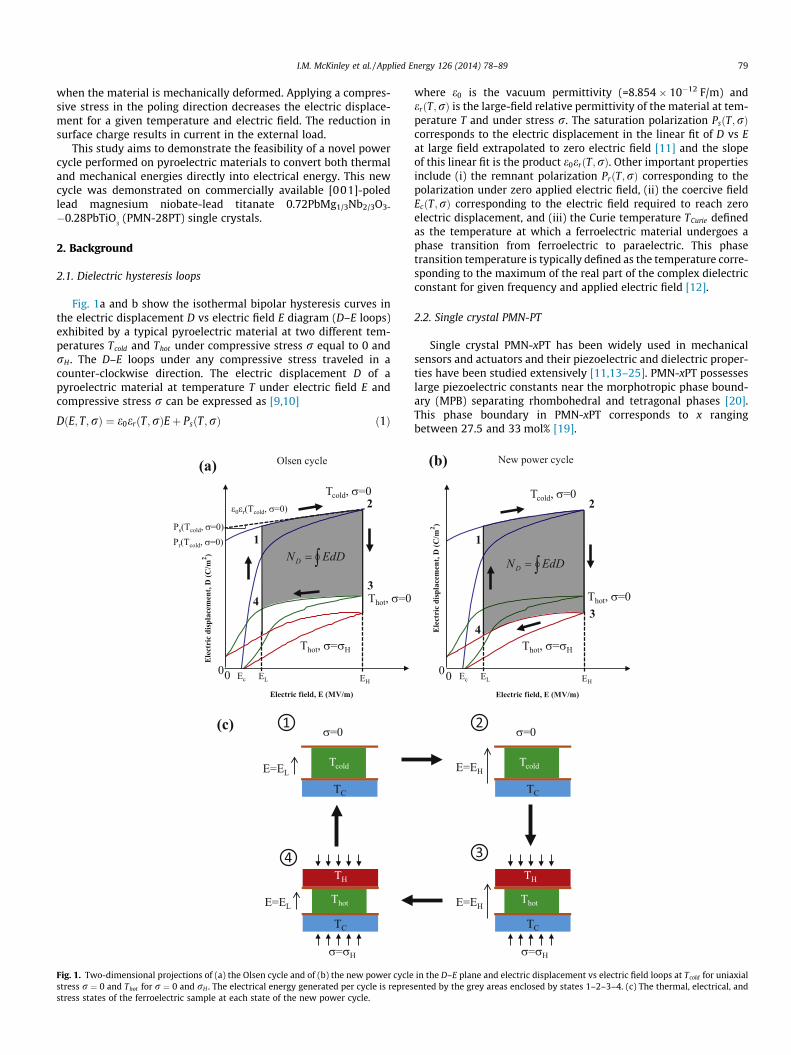
Fig. 1a and b show the isothermal bipolar hysteresis curves inthe electric displacement D vs electric field E diagram (D–E loops)exhibited by a typical pyroelectric material at two different tem-peratures Tcold and Thot under compressive stress r equal to 0 andrH . The D–E loops under any compressive stress traveled in acounter-clockwise direction. The electric displacement D of apyroelectric material at temperature T under electric field E andcompressive stress r can be expressed as [9,10]
DðE; T;rÞ ¼ e0erðT;rÞEþ PsðT;rÞ ð1Þ
Fig. 1. Two-dimensional projections of (a) the Olsen cycle and of (b) the new power cyclestress r ¼ 0 and Thot for r ¼ 0 and rH . The electrical energy generated per cycle is represstress states of the ferroelectric sample at each state of the new power cycle.
where e0 is the vacuum permittivity (=8.854 � 10�12 F/m) anderðT;rÞ is the large-field relative permittivity of the material at tem-perature T and under stress r. The saturation polarization PsðT;rÞcorresponds to the electric displacement in the linear fit of D vs Eat large field extrapolated to zero electric field [11] and the slopeof this linear fit is the product e0erðT;rÞ. Other important propertiesinclude (i) the remnant polarization PrðT;rÞ corresponding to thepolarization under zero applied electric field, (ii) the coercive fieldEcðT;rÞ corresponding to the electric field required to reach zeroelectric displacement, and (iii) the Curie temperature TCurie definedas the temperature at which a ferroelectric material undergoes aphase transition from ferroelectric to paraelectric. This phasetransition temperature is typically defined as the temperature corre-sponding to the maximum of the real part of the complex dielectricconstant for given frequency and applied electric field [12].
2.2. Single crystal PMN-PT
Single crystal PMN-xPT has been widely used in mechanicalsensors and actuators and their piezoelectric and dielectric proper-ties have been studied extensively [11,13–25]. PMN-xPT possesseslarge piezoelectric constants near the morphotropic phase bound-ary (MPB) separating rhombohedral and tetragonal phases [20].This phase boundary in PMN-xPT corresponds to x rangingbetween 27.5 and 33 mol% [19].
in the D–E plane and electric displacement vs electric field loops at Tcold for uniaxialented by the grey areas enclosed by states 1–2–3–4. (c) The thermal, electrical, and
80 I.M. McKinley et al. / Applied Energy 126 (2014) 78–89
Properties of PMN-xPT with x between 30 and 33 mol% as func-tions of electric field and mechanical stress have been recentlyinvestigated[13,17]. For example, Feng et al. [13] reported theeffect of uniaxial compressive stress r, applied in the polingdirection, on (i) the bipolar D–E loops at room temperature, (ii)the coercive electric field Ec , and (iii) the remnant polarization Pr
for [001]-oriented PMN-30PT single crystals [13]. The remnantpolarization Pr was approximately 0.25 C/m2 under zero loadingbut vanished for bias compressive stress r around 50 MPa.Similarly, Wan et al. [17] reported remnant polarizations of0.25 and 0.30 C/m2 at room temperature under zero load forPMN-32PT and PMN-33PT, respectively. Under compressive stresslarger than 30 MPa, the remnant polarization was negligibly small(�0.08 C/m2). Overall, the coercive field Ec and remnant polariza-tion Pr decreased with increasing compressive stress [17,13].
Recent studies demonstrated that not only external electricfield but also mechanical loading contribute to polarization switch-ing and phase transitions in PMN-xPT single crystals [13,14,17,18].Zhou et al. [23] compared the performance of PMN-xPT with xequal to 28%, 30%, and 32% and determined that PMN-28PT wasthe preferred composition for transducer, sensor, and actuatorapplications due to its larger piezoelectric properties in a broadtemperature range. Based on these observations, single crystalPMN-28PT samples were used in the present study. The electricfield vs temperature (E–T) phase diagram for [001] PMN-28PTunder zero stress indicates that the material can assume four dif-ferent crystalline phases in the temperature range from 27 to177 �C for electric field between 0 and 1.5 MV/m including themonoclinic phases MA and MC , the tetragonal (T), and the cubicphase (C) [22]. The associated phases boundaries are both temper-ature and electric field dependent. At room temperature underzero electric field, the material is in the rhombohedral phase[26]. The Curie temperature at zero field was reported to be around125 �C [22] above which a pseudocubic state existed featuring locallattice distortions [27]. An applied electric field can cause a phasetransition from the pseudocubic phase to the ferroelectric stateresulting in double hysteresis loops [28].
2.3. Thermomechanical cycles
Traditional thermodynamic power cycles, such as the Stirling,Rankine, and Ericsson cycles, are performed on a working fluidand convert thermal energy into mechanical work. Their efficiencyis defined as the ratio of the net mechanical work produced by thecycle to the thermal energy input. These cycles are often repre-sented in the pressure vs specific volume (p–v) diagrams. In someof them (e.g., the Rankine cycle), the working fluid undergoesliquid to vapor phase transition. Additionally, thermoelectricdevices convert thermal energy to electrical energy by takingadvantage of the Seebeck effect [6]. Their conversion efficiency isdefined as the ratio of the electrical energy generated to the ther-mal energy provided at the hot junction [6]. On the other hand, inpiezoelectric energy conversion, mechanical energy is convertedinto electrical energy. Then, the conversion efficiency is definedas the ratio of the generated electrical energy to the appliedmechanical energy [29].
Alternatively, the Olsen cycle can be performed on pyroelectricmaterials and consists of two isothermal and two isoelectric fieldprocesses in the displacement versus electric field diagram [7]. Itis analogous to the Ericsson cycle defined in the p–v diagram of aworking fluid [7]. The first process of the Olsen cycle correspondsto an increase in electric field from EL to EH at constant temperatureTcold. The second process consists of heating the material from Tcold
to Thot under constant electric field EH . The third process corre-sponds to a decrease in the electric field from EH to EL at constanttemperature Thot . Finally, the cycle is closed by cooling the material
from Thot to Tcold under constant electric field EL. Note that theseprocesses are performed under zero mechanical stress.
Fig. 1a shows the Olsen cycle in the two-dimensional D–Ediagram for r = 0 MPa. The area enclosed by the four processes pre-viously described corresponds to the electrical energy generatedper unit volume of material per cycle, denoted by ND. It is expressedin J/L/cycle (1 J/L/cycle = 1 kJ/m3/cycle) and defined as [7]
ND ¼I
EdD ð2Þ
The power density PD (in W/L) is the amount of electrical energygenerated by the pyroelectric material per unit volume of materialper unit time. It is expressed as PD ¼ NDf where f is the cyclefrequency.
In order to maximize the energy density ND generated by theOlsen cycle, the electric field span ðEH � ELÞ should be as large aspossible without causing de-poling and/or electric breakdown[30]. Similarly, the electric displacement span should be the largestpossible. To do so, Thot should be greater than the Curie temperatureTCurie. Indeed, when the material is paraelectric, the spontaneouspolarization vanishes. However, near TCurie an applied electric fieldcan re-pole the material. As the temperature increases above TCurie,the paraelectric state becomes more and more stable and the elec-tric field required to induce the ferroelectric state increases [22].Thus, the cycle should be performed with Thot sufficiently aboveTCurie so that even a high electric field cannot re-pole the material.
Numerous studies have investigated the Olsen cycle performedon pyroelectric polymers [31,39–41], single crystals [32,33,42] andceramics [7,30,34,35,36–38]. In particular, Kandilian et al. [32]studied the pyroelectric energy generation of 140 lm thick[001]-oriented PMN-32PT single crystals using the Olsen cycle.The maximum generated energy density was 100 J/L/cycle for elec-tric field cycled between 0.2 and 0.9 MV/m and temperatures vary-ing between 80 and 170 �C. In addition, TCurie under zero field wasdetermined to be around 150 �C [32]. Moreover, the PMN-32PTsamples experienced dielectric breakdown for electric fields largerthan �0.9 MV/m, and samples suffered from cracking due to ther-mal stress for temperature differences in excess of 90 �C [32].
The use of heat conduction to heat and cool a pyroelectric mate-rial in the Olsen cycle was explored by performing a ‘‘stampingprocedure’’ [41]. It consisted of alternately pressing a pyroelectricsample in thermal contact with cold and hot aluminum blocksunder specified electric fields. Lee et al. [41] used co-polymer60/40 P (VDF-TrFE) films as the pyroelectric material and achieveda maximum energy density of 155 J/L/cycle at 0.066 Hz for temper-atures between 25 and 110 �C electric fields between 20 and35 MV/m. Note that single crystals and ceramics offer advantagesover polymers in that (i) they possess significantly lower leakagecurrent thanks to their higher electrical resistivity and (ii) theydo not require electrical poling prior to performing the Olsen cycle.However, polymer films can sustain significantly larger electricfield.
The Olsen cycle has been demonstrated to generate the largestenergy densities of any power cycle performed on ferroelectricmaterials [43]. However, the Olsen cycle performed on a givenmaterial requires the hot source temperature to be larger thanTCurie in order to generate energy. Moreover, the power density ofthe Olsen cycle is limited by the low cycle frequency due to slowheat transfer and relaxation processes. The energy and power den-sities generated by a pyroelectric material undergoing the Olsencycle could be increased by increasing the electric displacementspan between temperatures Tcold and Thot . This can be achievedby subjecting the sample to compressive stress. This is particularlytrue at temperatures around TCurie.
Here, we present a new cycle using uniaxial compressive stressin addition to thermal and electric field cycling. It circumvents the
I.M. McKinley et al. / Applied Energy 126 (2014) 78–89 81
above mentioned difficulties to increase both energy and powerdensities (i) by combining piezoelectric and pyroelectric energyconversion and (ii) by increasing the cycle frequency by quicklyforcing the material into a specific phase using mechanical stressinstead of heating and cooling which are inherently slow. Singlecrystal PMN-28PT was chosen for its advantageous piezoelectricproperties.
3. New thermomechanical power cycle
Fig. 1b illustrates the new power cycle projected onto the D–Eplane overlaid with the corresponding isothermal bipolar hystere-sis curves (D–E loops) at cold temperature Tcold under zero stressand at hot temperature Thot under compressive stress rH . Fig. 1cschematically illustrates the practical implementation of the newpower cycle and the stress, temperature, and electric field imposedin each state. Process 1-2 consists of an isothermal increase in elec-tric field from EL to EH at Tcold in the absence of compressive stress.Process 2-3 corresponds to simultaneously compressing the sam-ple at rH and heating it up to Thot . Process 3-4 consists of an iso-thermal decrease in electric field from EH to EL at Thot undercompressive bias stress rH . Finally, process 4-1 closes the cycleby simultaneously cooling the sample to Tcold and removing theloading under constant electric field EL. The area enclosed by thefour processes in the D–E diagram, shown in Fig. 1b, correspondsto the generated energy density ND defined by Eq. (2). The overallcycle frequency (in Hz) is defined as f = ðs12 þ s23 þ s34 þ s41Þ�1
with sij corresponding to the duration of process i–j. This new cyclecan be implemented using a procedure similar to the ‘‘stampingprocedure’’ [41] previously discussed but under significantly largercompressive stress. This was implemented experimentally todirectly convert both thermal and mechanical energies into electri-cal energy using single crystal PMN-28PT.
3.1. Material efficiency
The material efficiency of a power cycle is typically defined asthe ratio of the electrical energy generated by the material duringthe cycle to the thermal and/or mechanical energy consumed bythe material to be converted by the cycle. In the present cycle, boththermal and mechanical energies are converted into electricalenergy. Then, the material efficiency of the new cycle can beexpressed as
g ¼ ND
Q in þWinð3Þ
Note that this definition of efficiency is consistent with that used forpiezoelectric materials given by g ¼ ND=Win [29] and for the Olsencycle given by g ¼ ND=Qin [44]. The thermal energy provided to thematerial during the cycle may be expressed, per unit volume, as
Q in ¼I
qcpðTÞdT ð4Þ
where q and cpðTÞ are the density and specific heat of the ferroelec-tric material in kg/m3 and J/kg K, respectively. The specific heat offerroelectric materials cpðTÞ is temperature-dependent and can bemeasured by differential scanning calorimetry [45]. The netmechanical work Win provided during the cycle per unit volumeof material can be defined as
Win ¼I
rð�Þd� ð5Þ
where � represents the strain in the longitudinal direction parallel tothe polarization. For ferroelectric materials undergoing phase transi-tion(s), the relationship between r and � is typically non-linear
[13,46]. Thus, Win cannot be expressed in terms of the Young’s mod-ulus. Instead, it should be estimated from stress–strain curves [47].Note that the material efficiency defined above accounts for the con-version of thermomechanical energy into electricity by the materialitself. It does not represent the efficiency of a potential device imple-menting the cycle and subject to heat losses, friction, and other irre-versible processes. In other words, g represents the upper limit of adevice’s efficiency. The latter will also depend on the size of thesystem.
4. Materials and methods
4.1. Samples
Single crystal samples of PMN-28PT were purchased fromSinoceramics, LLC. The dimensions of the samples were5 � 5 � 3 mm3. The average weight of the samples was588.5 ± 0.8 mg, corresponding to a density of q ¼ 7847� 11 kg/m3.These samples were poled in the [001]-direction. The two5 � 5 mm2 faces of each sample were coated with Cr/Au electrodes.
4.2. Experimental setup
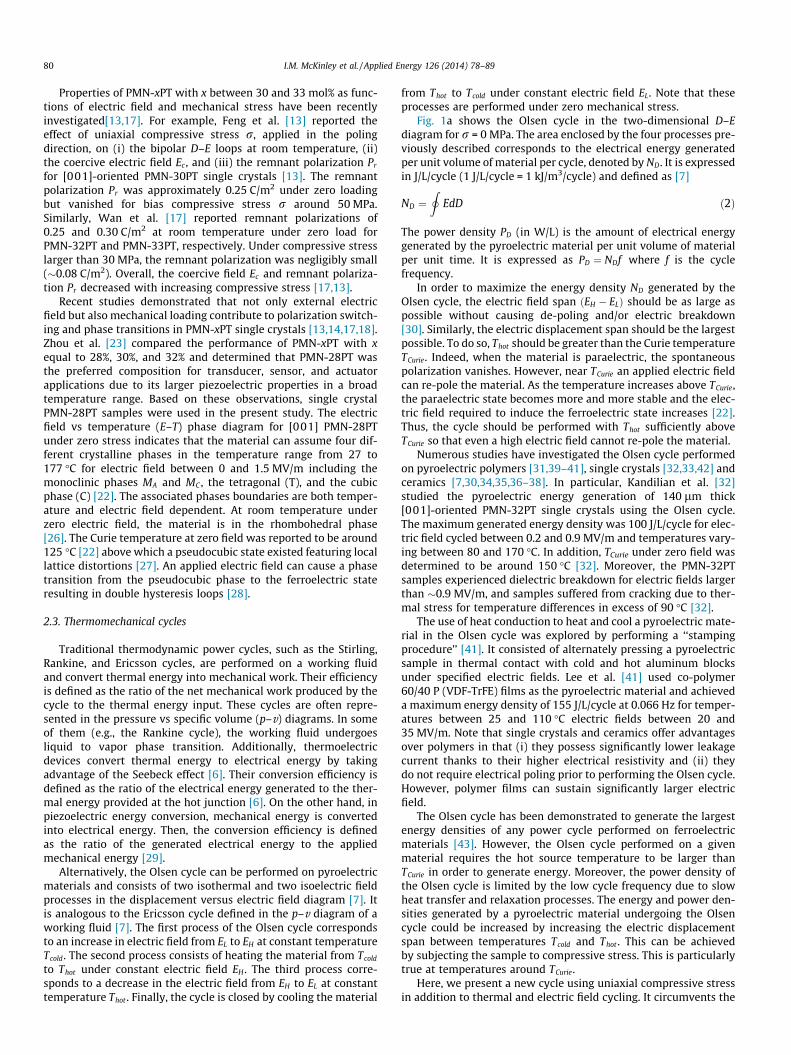
The experimental setup consisted of an electrical and athermomechanical subsystem. The electrical subsystem was aSawyer–Tower circuit identical to that used in our previous studies[30–33,42,48]. Fig. 2a and b show a schematic and a photograph ofthe thermomechanical subsystem used to perform the novel powercycle, respectively. This subsystem consisted of a spring return aircylinder (McMaster–Carr 6498K252) vertically actuated usingcompressed air at a maximum pressure of 469 kPa. The extensionand contraction of the cylinder rod were controlled by a 24 V DCsolenoid valve. The heat source consisted of a 100-W cartridge hea-ter imbedded in a 1.27 cm thick aluminum plate. A type-K thermo-couple was placed at the center of the heating block. The block’stemperature was kept constant using a proportional integralderivative (PID) temperature controller (Omega CN-7823). ThePMN-28PT sample was sandwiched between two copper tapes toprovide electrical contact between the sample’s electrodes andthe wires. This assembly was placed on top of a 5 mm thick steeldie. An aluminum heat sink (Cool Innovations 3-151514 M) wasplaced in thermal contact with the steel die by epoxy adhesiveOMEGABOND
�200 to passively cool the pyroelectric sample to
Tcold during process 4-1. A 140 lm thick Kapton film was used toelectrically isolate the sample’s electrodes from the metallic heatsource and sink. Note that the sample temperature could not bemeasured during electric field cycling due to electrical conductionbetween the sample and the thermocouple.
This setup was modified slightly when collecting isothermalD–E loops under different compressive stresses. Then, the heat sinkand steel die were replaced with an aluminum heating plate andwood block identical to the heat source placed above the sample.This was done to ensure the sample was uniformly heated to Thot
from both sides and to minimize the temperature gradient in thesample. In this case, a type-K thermocouple placed directly onthe sample was used to measure the sample temperature. It wasremoved before electric field cycling began.
4.3. Experimental procedure
Isothermal D–E loops under different compressive stresses werecollected and the new power cycle was performed on the PMN-28PT samples using the above-described experimental setup. Forcomparison purposes, the Olsen cycle was also performed using
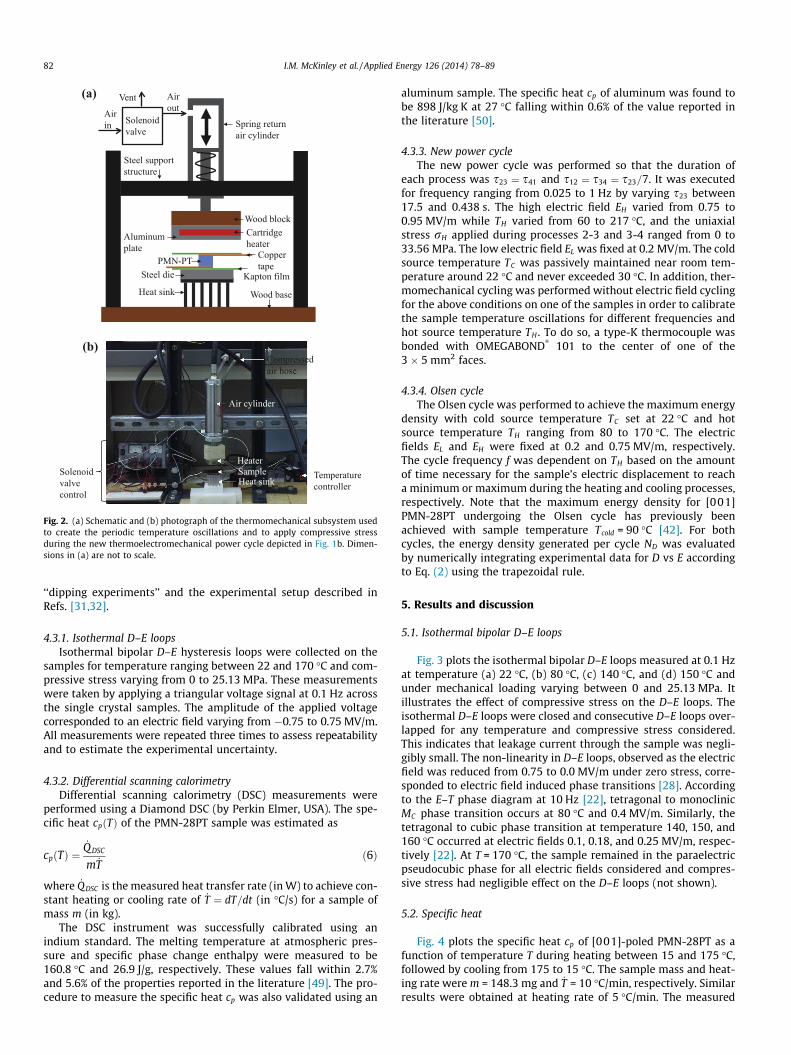
Fig. 2. (a) Schematic and (b) photograph of the thermomechanical subsystem usedto create the periodic temperature oscillations and to apply compressive stressduring the new thermoelectromechanical power cycle depicted in Fig. 1b. Dimen-sions in (a) are not to scale.
82 I.M. McKinley et al. / Applied Energy 126 (2014) 78–89
‘‘dipping experiments’’ and the experimental setup described inRefs. [31,32].
4.3.1. Isothermal D–E loopsIsothermal bipolar D–E hysteresis loops were collected on the
samples for temperature ranging between 22 and 170 �C and com-pressive stress varying from 0 to 25.13 MPa. These measurementswere taken by applying a triangular voltage signal at 0.1 Hz acrossthe single crystal samples. The amplitude of the applied voltagecorresponded to an electric field varying from �0.75 to 0.75 MV/m.All measurements were repeated three times to assess repeatabilityand to estimate the experimental uncertainty.
4.3.2. Differential scanning calorimetryDifferential scanning calorimetry (DSC) measurements were
performed using a Diamond DSC (by Perkin Elmer, USA). The spe-cific heat cpðTÞ of the PMN-28PT sample was estimated as
cpðTÞ ¼_Q DSC
m _Tð6Þ
where _QDSC is the measured heat transfer rate (in W) to achieve con-stant heating or cooling rate of _T ¼ dT=dt (in �C/s) for a sample ofmass m (in kg).
The DSC instrument was successfully calibrated using anindium standard. The melting temperature at atmospheric pres-sure and specific phase change enthalpy were measured to be160.8 �C and 26.9 J/g, respectively. These values fall within 2.7%and 5.6% of the properties reported in the literature [49]. The pro-cedure to measure the specific heat cp was also validated using an
aluminum sample. The specific heat cp of aluminum was found tobe 898 J/kg K at 27 �C falling within 0.6% of the value reported inthe literature [50].
4.3.3. New power cycleThe new power cycle was performed so that the duration of
each process was s23 ¼ s41 and s12 ¼ s34 ¼ s23=7. It was executedfor frequency ranging from 0.025 to 1 Hz by varying s23 between17.5 and 0.438 s. The high electric field EH varied from 0.75 to0.95 MV/m while TH varied from 60 to 217 �C, and the uniaxialstress rH applied during processes 2-3 and 3-4 ranged from 0 to33.56 MPa. The low electric field EL was fixed at 0.2 MV/m. The coldsource temperature TC was passively maintained near room tem-perature around 22 �C and never exceeded 30 �C. In addition, ther-momechanical cycling was performed without electric field cyclingfor the above conditions on one of the samples in order to calibratethe sample temperature oscillations for different frequencies andhot source temperature TH . To do so, a type-K thermocouple wasbonded with OMEGABOND
�101 to the center of one of the
3 � 5 mm2 faces.
4.3.4. Olsen cycleThe Olsen cycle was performed to achieve the maximum energy
density with cold source temperature TC set at 22 �C and hotsource temperature TH ranging from 80 to 170 �C. The electricfields EL and EH were fixed at 0.2 and 0.75 MV/m, respectively.The cycle frequency f was dependent on TH based on the amountof time necessary for the sample’s electric displacement to reacha minimum or maximum during the heating and cooling processes,respectively. Note that the maximum energy density for [001]PMN-28PT undergoing the Olsen cycle has previously beenachieved with sample temperature Tcold = 90 �C [42]. For bothcycles, the energy density generated per cycle ND was evaluatedby numerically integrating experimental data for D vs E accordingto Eq. (2) using the trapezoidal rule.
5. Results and discussion
5.1. Isothermal bipolar D–E loops
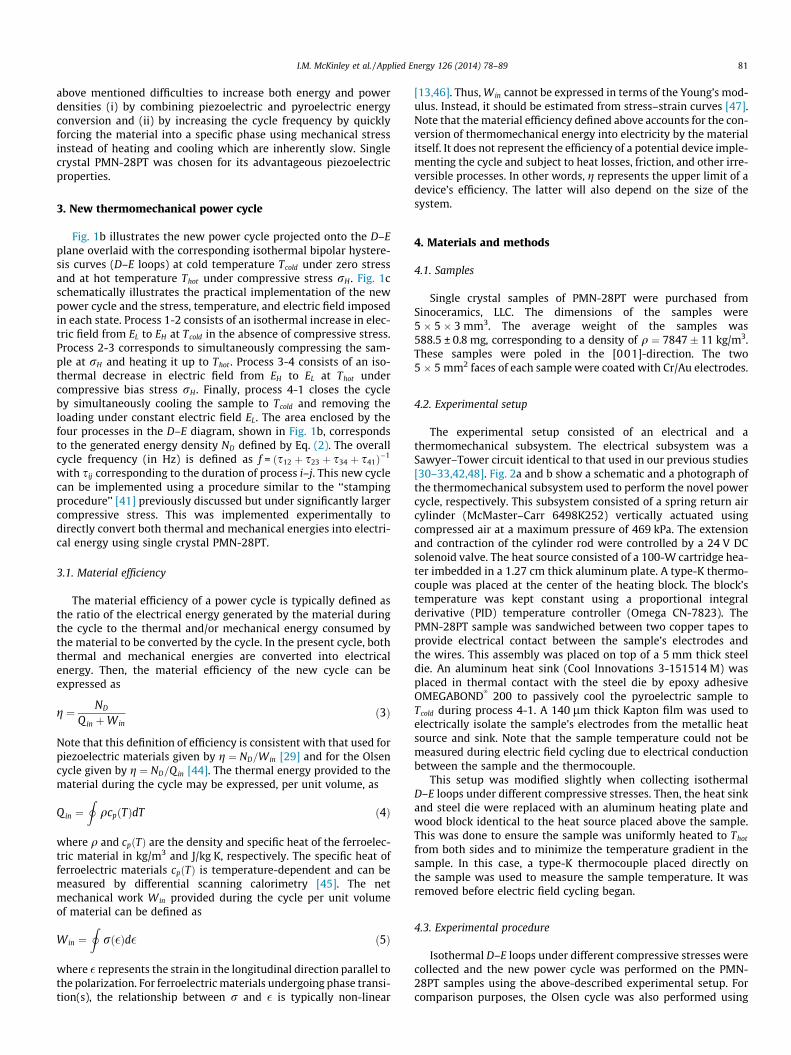
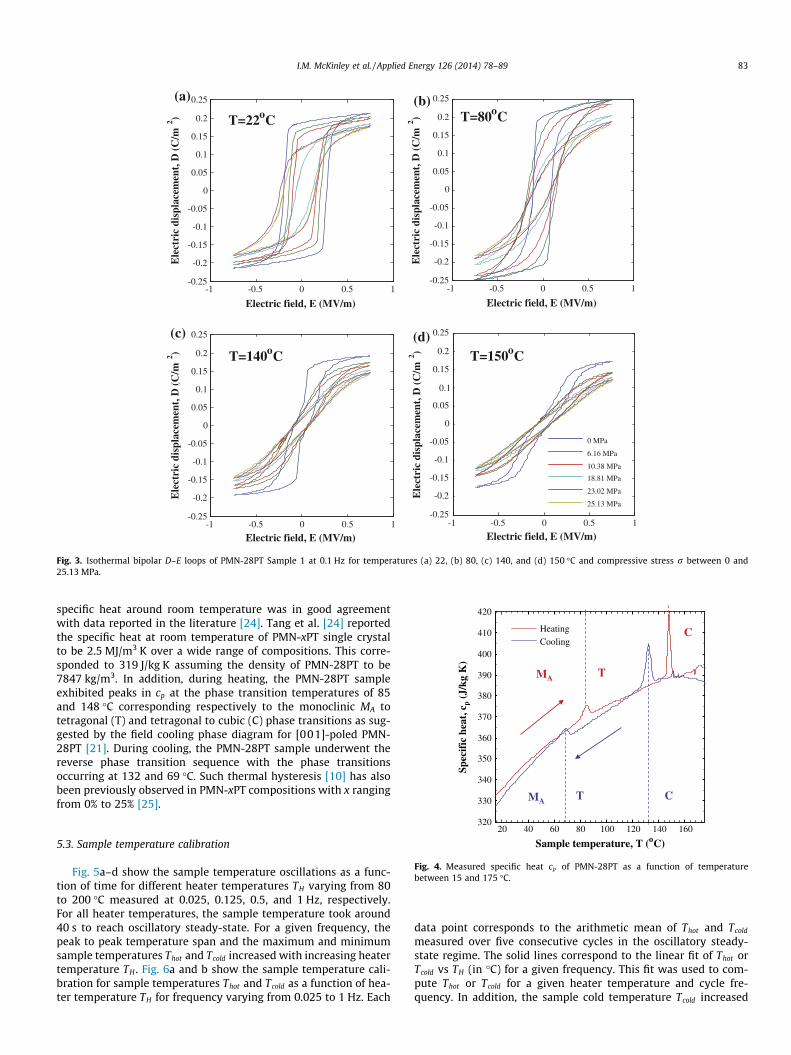
Fig. 3 plots the isothermal bipolar D–E loops measured at 0.1 Hzat temperature (a) 22 �C, (b) 80 �C, (c) 140 �C, and (d) 150 �C andunder mechanical loading varying between 0 and 25.13 MPa. Itillustrates the effect of compressive stress on the D–E loops. Theisothermal D–E loops were closed and consecutive D–E loops over-lapped for any temperature and compressive stress considered.This indicates that leakage current through the sample was negli-gibly small. The non-linearity in D–E loops, observed as the electricfield was reduced from 0.75 to 0.0 MV/m under zero stress, corre-sponded to electric field induced phase transitions [28]. Accordingto the E–T phase diagram at 10 Hz [22], tetragonal to monoclinicMC phase transition occurs at 80 �C and 0.4 MV/m. Similarly, thetetragonal to cubic phase transition at temperature 140, 150, and160 �C occurred at electric fields 0.1, 0.18, and 0.25 MV/m, respec-tively [22]. At T = 170 �C, the sample remained in the paraelectricpseudocubic phase for all electric fields considered and compres-sive stress had negligible effect on the D–E loops (not shown).
5.2. Specific heat
Fig. 4 plots the specific heat cp of [001]-poled PMN-28PT as afunction of temperature T during heating between 15 and 175 �C,followed by cooling from 175 to 15 �C. The sample mass and heat-ing rate were m = 148.3 mg and _T = 10 �C/min, respectively. Similarresults were obtained at heating rate of 5 �C/min. The measured
-1 -0.5 0 0.5 1-0.25
-0.2
-0.15
-0.1
-0.05
0
0.05
0.1
0.15
0.2
0.25
T=140oC
Electric field, E (MV/m)
Ele
ctri
c di
spla
cem
ent,
D (
C/m
2 )
-1 -0.5 0 0.5 1-0.25
-0.2
-0.15
-0.1
-0.05
0
0.05
0.1
0.15
0.2
0.25
T=150oC
Electric field, E (MV/m)
Ele
ctri
c di
spla
cem
ent,
D (
C/m
2 )
0 MPa
16 psi
24 psi
40 psi
48 psi
52 psi
-1 -0.5 0 0.5 1-0.25
-0.2
-0.15
-0.1
-0.05
0
0.05
0.1
0.15
0.2
0.25
T=22oC
Electric field, E (MV/m)
Ele
ctri
c di
spla
cem
ent,
D (
C/m
2 )
0 MPa
6.16 MPa
10.38 MPa
18.81 MPa
23.02 MPa
25.13 MPa
(a)
(c) (d)
(b)
-1 -0.5 0 0.5 1-0.25
-0.2
-0.15
-0.1
-0.05
0
0.05
0.1
0.15
0.2
0.25
T=80oC
Electric field, E (MV/m)
Ele
ctri
c di
spla
cem
ent,
D (
C/m
2 )
Fig. 3. Isothermal bipolar D–E loops of PMN-28PT Sample 1 at 0.1 Hz for temperatures (a) 22, (b) 80, (c) 140, and (d) 150 �C and compressive stress r between 0 and25.13 MPa.
330
340
350
360
370
380
390
400
410
420
Heating
Cooling
MA
MA T
T
C
C
Spec
ific
hea
t, c
p(J
/kg
K)
I.M. McKinley et al. / Applied Energy 126 (2014) 78–89 83
specific heat around room temperature was in good agreementwith data reported in the literature [24]. Tang et al. [24] reportedthe specific heat at room temperature of PMN-xPT single crystalto be 2.5 MJ/m3 K over a wide range of compositions. This corre-sponded to 319 J/kg K assuming the density of PMN-28PT to be7847 kg/m3. In addition, during heating, the PMN-28PT sampleexhibited peaks in cp at the phase transition temperatures of 85and 148 �C corresponding respectively to the monoclinic MA totetragonal (T) and tetragonal to cubic (C) phase transitions as sug-gested by the field cooling phase diagram for [001]-poled PMN-28PT [21]. During cooling, the PMN-28PT sample underwent thereverse phase transition sequence with the phase transitionsoccurring at 132 and 69 �C. Such thermal hysteresis [10] has alsobeen previously observed in PMN-xPT compositions with x rangingfrom 0% to 25% [25].
20 40 60 80 100 120 140 160320
Sample temperature, T (oC)
Fig. 4. Measured specific heat cp of PMN-28PT as a function of temperaturebetween 15 and 175 �C.
5.3. Sample temperature calibration
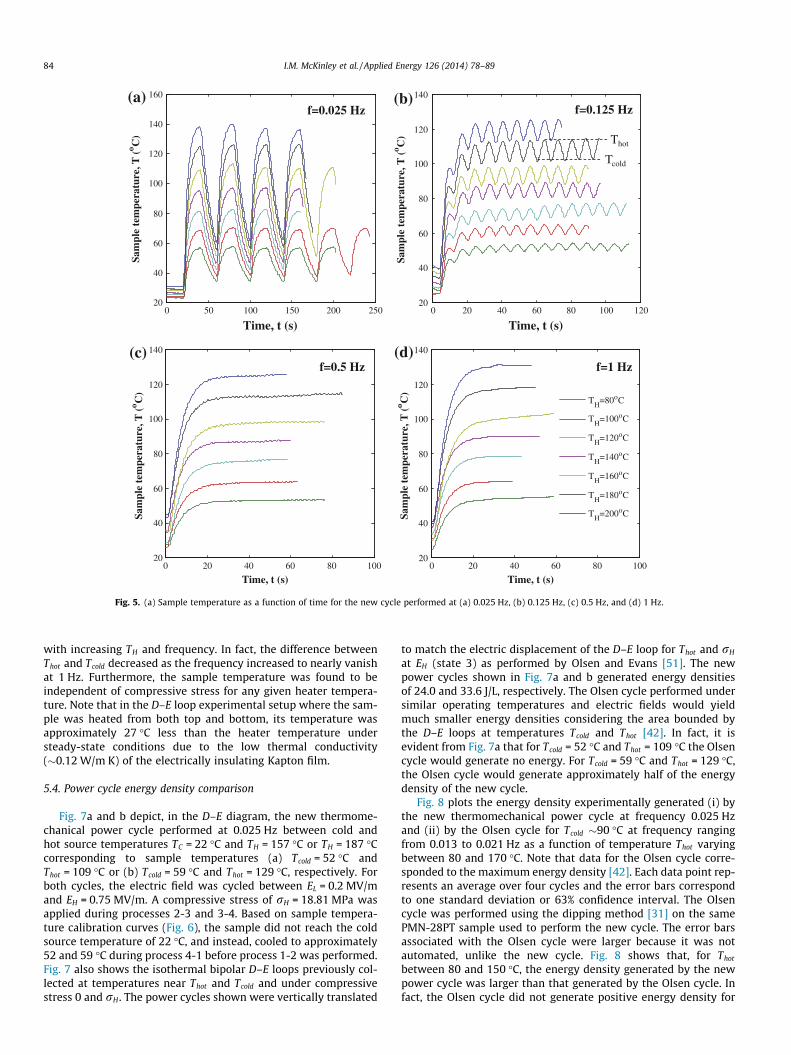
Fig. 5a–d show the sample temperature oscillations as a func-tion of time for different heater temperatures TH varying from 80to 200 �C measured at 0.025, 0.125, 0.5, and 1 Hz, respectively.For all heater temperatures, the sample temperature took around40 s to reach oscillatory steady-state. For a given frequency, thepeak to peak temperature span and the maximum and minimumsample temperatures Thot and Tcold increased with increasing heatertemperature TH . Fig. 6a and b show the sample temperature cali-bration for sample temperatures Thot and Tcold as a function of hea-ter temperature TH for frequency varying from 0.025 to 1 Hz. Each
data point corresponds to the arithmetic mean of Thot and Tcold
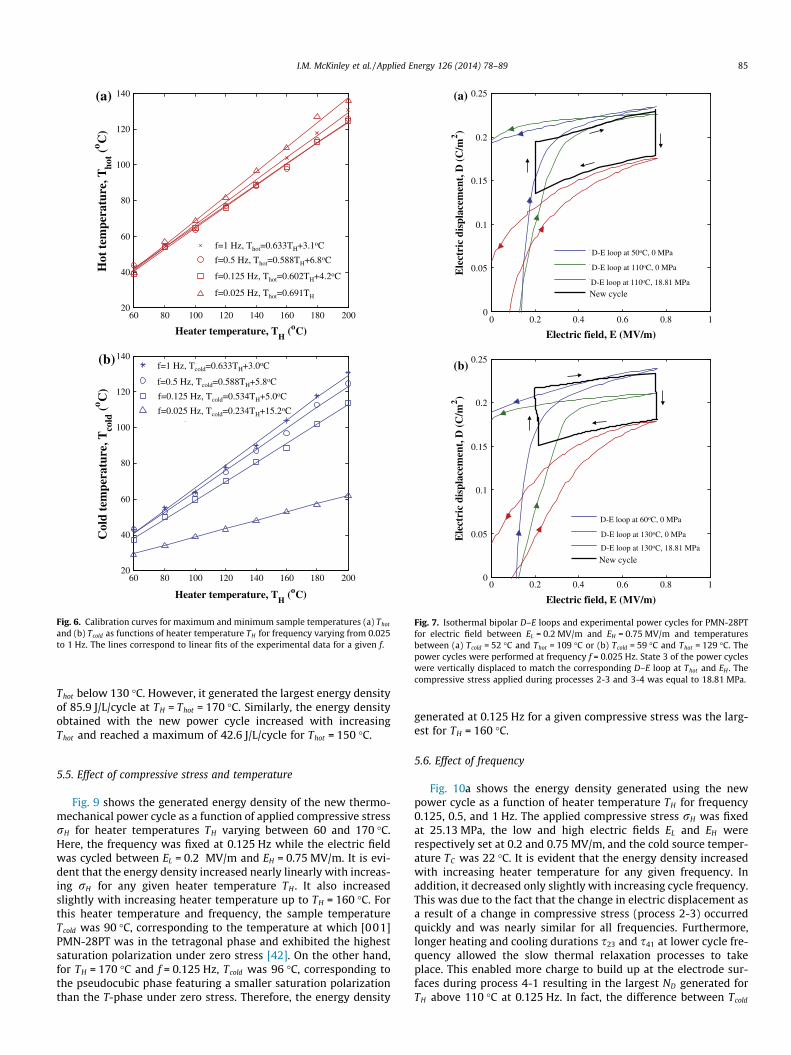
measured over five consecutive cycles in the oscillatory steady-state regime. The solid lines correspond to the linear fit of Thot orTcold vs TH (in �C) for a given frequency. This fit was used to com-pute Thot or Tcold for a given heater temperature and cycle fre-quency. In addition, the sample cold temperature Tcold increased
0 50 100 150 200 25020
40
60
80
100
120
140
160
Time, t (s)
Sam
ple
tem
pera
ture
, T (o C
)
f=0.025 Hz
0 20 40 60 80 100 12020
40
60
80
100
120
140
Time, t (s)
Sam
ple
tem
pera
ture
, T (o C
)
f=0.125 Hz(a)
0 20 40 60 80 10020
40
60
80
100
120
140
Time, t (s)
Sam
ple
tem
pera
ture
, T (o C
)
f=0.5 Hz
0 20 40 60 80 10020
40
60
80
100
120
140
Time, t (s)
Sam
ple
tem
pera
ture
, T (o C
)
f=1 Hz
TH=80oC
TH=100oC
TH=120oC
TH=140oC
TH=160oC
TH=180oC
TH=200oC
(b)
(d)(c)
Thot
Tcold
Fig. 5. (a) Sample temperature as a function of time for the new cycle performed at (a) 0.025 Hz, (b) 0.125 Hz, (c) 0.5 Hz, and (d) 1 Hz.
84 I.M. McKinley et al. / Applied Energy 126 (2014) 78–89
with increasing TH and frequency. In fact, the difference betweenThot and Tcold decreased as the frequency increased to nearly vanishat 1 Hz. Furthermore, the sample temperature was found to beindependent of compressive stress for any given heater tempera-ture. Note that in the D–E loop experimental setup where the sam-ple was heated from both top and bottom, its temperature wasapproximately 27 �C less than the heater temperature understeady-state conditions due to the low thermal conductivity(�0.12 W/m K) of the electrically insulating Kapton film.
5.4. Power cycle energy density comparison
Fig. 7a and b depict, in the D–E diagram, the new thermome-chanical power cycle performed at 0.025 Hz between cold andhot source temperatures TC = 22 �C and TH = 157 �C or TH = 187 �Ccorresponding to sample temperatures (a) Tcold = 52 �C andThot = 109 �C or (b) Tcold = 59 �C and Thot = 129 �C, respectively. Forboth cycles, the electric field was cycled between EL = 0.2 MV/mand EH = 0.75 MV/m. A compressive stress of rH = 18.81 MPa wasapplied during processes 2-3 and 3-4. Based on sample tempera-ture calibration curves (Fig. 6), the sample did not reach the coldsource temperature of 22 �C, and instead, cooled to approximately52 and 59 �C during process 4-1 before process 1-2 was performed.Fig. 7 also shows the isothermal bipolar D–E loops previously col-lected at temperatures near Thot and Tcold and under compressivestress 0 and rH . The power cycles shown were vertically translated
to match the electric displacement of the D–E loop for Thot and rH
at EH (state 3) as performed by Olsen and Evans [51]. The newpower cycles shown in Fig. 7a and b generated energy densitiesof 24.0 and 33.6 J/L, respectively. The Olsen cycle performed undersimilar operating temperatures and electric fields would yieldmuch smaller energy densities considering the area bounded bythe D–E loops at temperatures Tcold and Thot [42]. In fact, it isevident from Fig. 7a that for Tcold = 52 �C and Thot = 109 �C the Olsencycle would generate no energy. For Tcold = 59 �C and Thot = 129 �C,the Olsen cycle would generate approximately half of the energydensity of the new cycle.
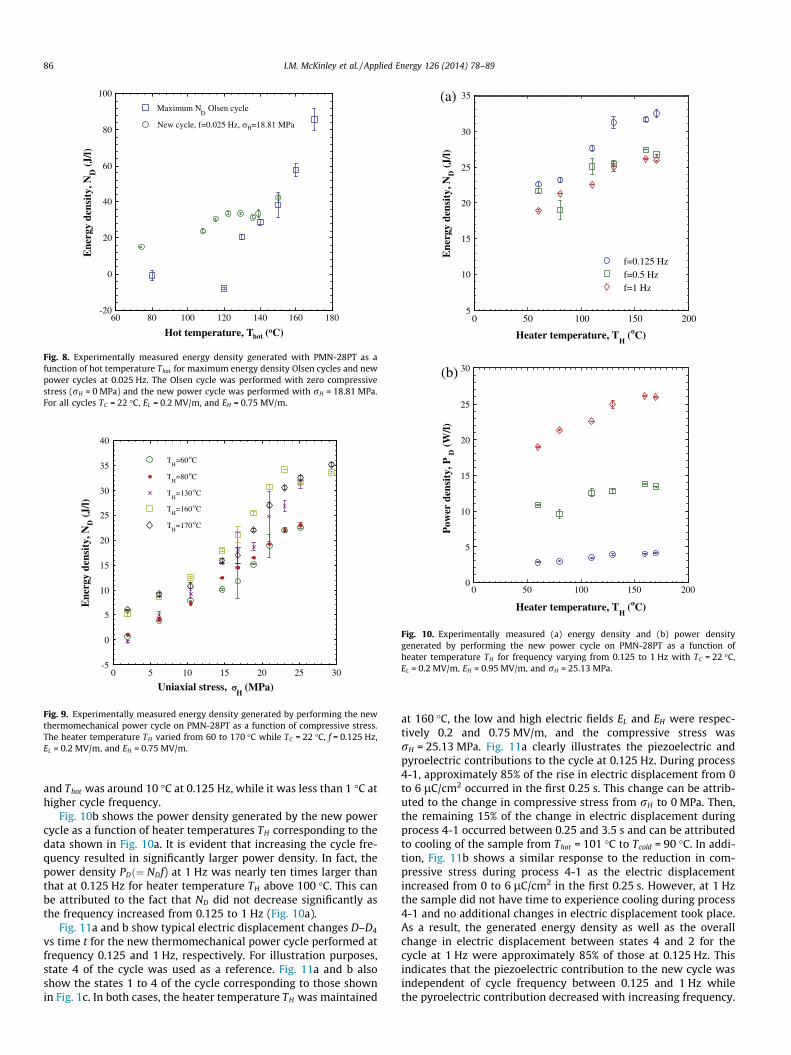
Fig. 8 plots the energy density experimentally generated (i) bythe new thermomechanical power cycle at frequency 0.025 Hzand (ii) by the Olsen cycle for Tcold �90 �C at frequency rangingfrom 0.013 to 0.021 Hz as a function of temperature Thot varyingbetween 80 and 170 �C. Note that data for the Olsen cycle corre-sponded to the maximum energy density [42]. Each data point rep-resents an average over four cycles and the error bars correspondto one standard deviation or 63% confidence interval. The Olsencycle was performed using the dipping method [31] on the samePMN-28PT sample used to perform the new cycle. The error barsassociated with the Olsen cycle were larger because it was notautomated, unlike the new cycle. Fig. 8 shows that, for Thot
between 80 and 150 �C, the energy density generated by the newpower cycle was larger than that generated by the Olsen cycle. Infact, the Olsen cycle did not generate positive energy density for
60 80 100 120 140 160 180 20020
40
60
80
100
120
140
Heater temperature, TH
(oC)
Col
d te
mpe
ratu
re, T
cold
(o C
)
60 80 100 120 140 160 180 20020
40
60
80
100
120
140
Heater temperature, TH
(oC)
Hot
tem
pera
ture
, Tho
t (o C
)(a)
(b)
f=1 Hz, Thot=0.633TH+3.1oC
f=0.5 Hz, Thot=0.588TH+6.8oC
f=0.125 Hz, Thot=0.602TH+4.2oC
f=0.025 Hz, Thot=0.691TH
f=1 Hz, Tcold=0.633TH+3.0oC
f=0.5 Hz, Tcold=0.588TH+5.8oC
f=0.125 Hz, Tcold=0.534TH+5.0oC
f=0.025 Hz, Tcold=0.234TH+15.2oC
Fig. 6. Calibration curves for maximum and minimum sample temperatures (a) Thot
and (b) Tcold as functions of heater temperature TH for frequency varying from 0.025to 1 Hz. The lines correspond to linear fits of the experimental data for a given f.
(a)
(b)
0 0.2 0.4 0.6 0.8 10
0.05
0.1
0.15
0.2
0.25
Electric field, E (MV/m)
Ele
ctri
c di
spla
cem
ent,
D (
C/m
2 )
T=50oC, =0 MPa
T=110oC, =0 MPa
T=110oC, =18.81 MPaNew cycle
D-E loop at 50oC, 0 MPa
D-E loop at 110oC, 0 MPa
D-E loop at 110oC, 18.81 MPa
0 0.2 0.4 0.6 0.8 10
0.05
0.1
0.15
0.2
0.25
Electric field, E (MV/m)
Ele
ctri
c di
spla
cem
ent,
D (
C/m
2 )
T=60oC, =0 MPa
T=130oC, =0 MPa
T=130oC, =18.81 MPaNew cycle
D-E loop at 60oC, 0 MPa
D-E loop at 130oC, 0 MPa
D-E loop at 130oC, 18.81 MPa
Fig. 7. Isothermal bipolar D–E loops and experimental power cycles for PMN-28PTfor electric field between EL = 0.2 MV/m and EH = 0.75 MV/m and temperaturesbetween (a) Tcold = 52 �C and Thot = 109 �C or (b) Tcold = 59 �C and Thot = 129 �C. Thepower cycles were performed at frequency f = 0.025 Hz. State 3 of the power cycleswere vertically displaced to match the corresponding D–E loop at Thot and EH . Thecompressive stress applied during processes 2-3 and 3-4 was equal to 18.81 MPa.
I.M. McKinley et al. / Applied Energy 126 (2014) 78–89 85
Thot below 130 �C. However, it generated the largest energy densityof 85.9 J/L/cycle at TH = Thot = 170 �C. Similarly, the energy densityobtained with the new power cycle increased with increasingThot and reached a maximum of 42.6 J/L/cycle for Thot = 150 �C.
5.5. Effect of compressive stress and temperature
Fig. 9 shows the generated energy density of the new thermo-mechanical power cycle as a function of applied compressive stressrH for heater temperatures TH varying between 60 and 170 �C.Here, the frequency was fixed at 0.125 Hz while the electric fieldwas cycled between EL = 0.2 MV/m and EH = 0.75 MV/m. It is evi-dent that the energy density increased nearly linearly with increas-ing rH for any given heater temperature TH . It also increasedslightly with increasing heater temperature up to TH = 160 �C. Forthis heater temperature and frequency, the sample temperatureTcold was 90 �C, corresponding to the temperature at which [001]PMN-28PT was in the tetragonal phase and exhibited the highestsaturation polarization under zero stress [42]. On the other hand,for TH = 170 �C and f = 0.125 Hz, Tcold was 96 �C, corresponding tothe pseudocubic phase featuring a smaller saturation polarizationthan the T-phase under zero stress. Therefore, the energy density
generated at 0.125 Hz for a given compressive stress was the larg-est for TH = 160 �C.
5.6. Effect of frequency
Fig. 10a shows the energy density generated using the newpower cycle as a function of heater temperature TH for frequency0.125, 0.5, and 1 Hz. The applied compressive stress rH was fixedat 25.13 MPa, the low and high electric fields EL and EH wererespectively set at 0.2 and 0.75 MV/m, and the cold source temper-ature TC was 22 �C. It is evident that the energy density increasedwith increasing heater temperature for any given frequency. Inaddition, it decreased only slightly with increasing cycle frequency.This was due to the fact that the change in electric displacement asa result of a change in compressive stress (process 2-3) occurredquickly and was nearly similar for all frequencies. Furthermore,longer heating and cooling durations s23 and s41 at lower cycle fre-quency allowed the slow thermal relaxation processes to takeplace. This enabled more charge to build up at the electrode sur-faces during process 4-1 resulting in the largest ND generated forTH above 110 �C at 0.125 Hz. In fact, the difference between Tcold
60 80 100 120 140 160 180-20
0
20
40
60
80
100E
nerg
y de
nsit
y, N
D (
J/l)
Maximum ND
Olsen cycleMaximum N
D Olsen cycle
New cycle, f=0.025 Hz, 18.81 MPaNew cycle, f=0.025 Hz, H=18.81 MPa
Hot temperature, Thot (oC)
Fig. 8. Experimentally measured energy density generated with PMN-28PT as afunction of hot temperature Thot for maximum energy density Olsen cycles and newpower cycles at 0.025 Hz. The Olsen cycle was performed with zero compressivestress (rH = 0 MPa) and the new power cycle was performed with rH = 18.81 MPa.For all cycles TC = 22 �C, EL = 0.2 MV/m, and EH = 0.75 MV/m.
0 5 10 15 20 25 30-5
0
5
10
15
20
25
30
35
40
Ene
rgy
dens
ity,
ND
(J/
l)
TH
=60oC
TH
=80oC
TH
=130 oC
TH
=160 oC
TH
=170 oC
H=60oC
H=80oC
H=130 oC
H=160 oC
H=170 oC
Uniaxial stress, H
(MPa)
Fig. 9. Experimentally measured energy density generated by performing the newthermomechanical power cycle on PMN-28PT as a function of compressive stress.The heater temperature TH varied from 60 to 170 �C while TC = 22 �C, f = 0.125 Hz,EL = 0.2 MV/m, and EH = 0.75 MV/m.
0 50 100 150 2000
5
10
15
20
25
30
Heater temperature, TH
(oC)
Pow
er d
ensi
ty, P
D (
W/l)
(a)
(b)
0 50 100 150 2005
10
15
20
25
30
35
Heater temperature, TH
(oC)
Ene
rgy
dens
ity,
ND
(J/
l)
f=0.125 Hzf=0.5 Hzf=1 Hz
Fig. 10. Experimentally measured (a) energy density and (b) power densitygenerated by performing the new power cycle on PMN-28PT as a function ofheater temperature TH for frequency varying from 0.125 to 1 Hz with TC = 22 �C,EL = 0.2 MV/m, EH = 0.95 MV/m, and rH = 25.13 MPa.
86 I.M. McKinley et al. / Applied Energy 126 (2014) 78–89
and Thot was around 10 �C at 0.125 Hz, while it was less than 1 �C athigher cycle frequency.
Fig. 10b shows the power density generated by the new powercycle as a function of heater temperatures TH corresponding to thedata shown in Fig. 10a. It is evident that increasing the cycle fre-quency resulted in significantly larger power density. In fact, thepower density PDð¼ NDf) at 1 Hz was nearly ten times larger thanthat at 0.125 Hz for heater temperature TH above 100 �C. This canbe attributed to the fact that ND did not decrease significantly asthe frequency increased from 0.125 to 1 Hz (Fig. 10a).
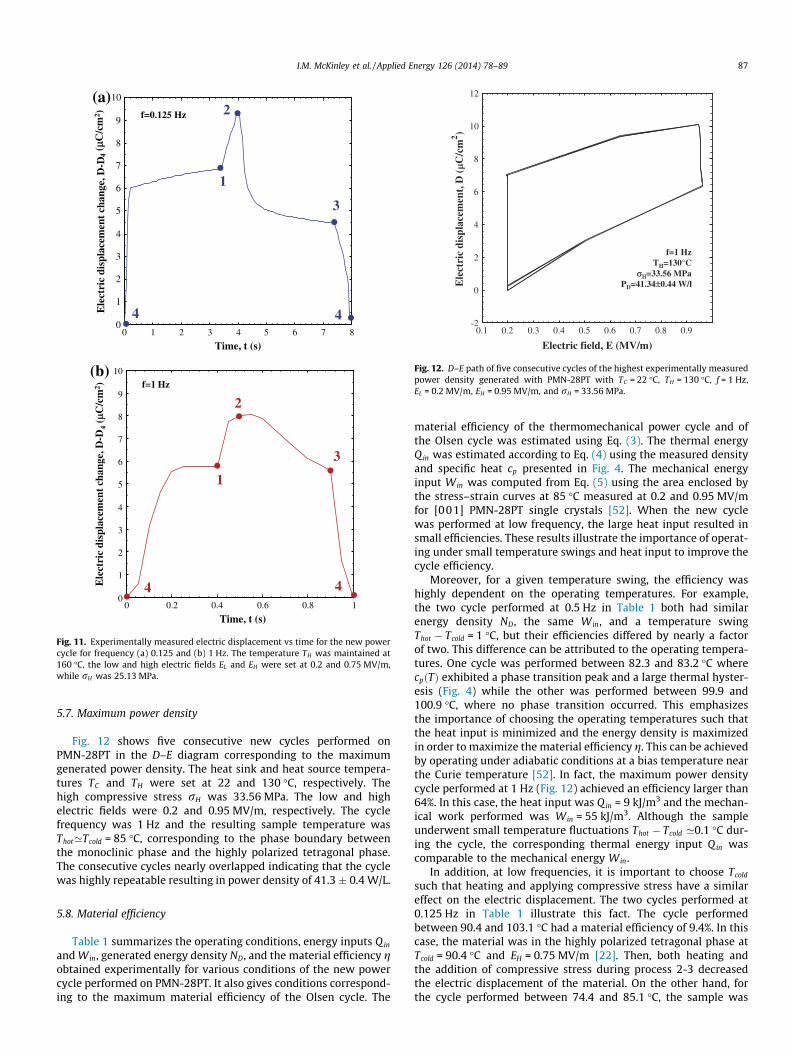
Fig. 11a and b show typical electric displacement changes D–D4
vs time t for the new thermomechanical power cycle performed atfrequency 0.125 and 1 Hz, respectively. For illustration purposes,state 4 of the cycle was used as a reference. Fig. 11a and b alsoshow the states 1 to 4 of the cycle corresponding to those shownin Fig. 1c. In both cases, the heater temperature TH was maintained
at 160 �C, the low and high electric fields EL and EH were respec-tively 0.2 and 0.75 MV/m, and the compressive stress wasrH = 25.13 MPa. Fig. 11a clearly illustrates the piezoelectric andpyroelectric contributions to the cycle at 0.125 Hz. During process4-1, approximately 85% of the rise in electric displacement from 0to 6 lC/cm2 occurred in the first 0.25 s. This change can be attrib-uted to the change in compressive stress from rH to 0 MPa. Then,the remaining 15% of the change in electric displacement duringprocess 4-1 occurred between 0.25 and 3.5 s and can be attributedto cooling of the sample from Thot = 101 �C to Tcold = 90 �C. In addi-tion, Fig. 11b shows a similar response to the reduction in com-pressive stress during process 4-1 as the electric displacementincreased from 0 to 6 lC/cm2 in the first 0.25 s. However, at 1 Hzthe sample did not have time to experience cooling during process4-1 and no additional changes in electric displacement took place.As a result, the generated energy density as well as the overallchange in electric displacement between states 4 and 2 for thecycle at 1 Hz were approximately 85% of those at 0.125 Hz. Thisindicates that the piezoelectric contribution to the new cycle wasindependent of cycle frequency between 0.125 and 1 Hz whilethe pyroelectric contribution decreased with increasing frequency.
0 0.2 0.4 0.6 0.8 10
1
2
3
4
5
6
7
8
9
10
0 1 2 3 4 5 6 7 80
1
2
3
4
5
6
7
8
9
10(a)
(b)
4 4
3
2
1
4 4
3
2
1
f=0.125 Hz
Ele
ctri
c di
spla
cem
ent
chan
ge, D
-D4
(C
/cm
2 )E
lect
ric
disp
lace
men
t ch
ange
, D-D
4(
C/c
m2 )
Time, t (s)
Time, t (s)
f=1 Hz
Fig. 11. Experimentally measured electric displacement vs time for the new powercycle for frequency (a) 0.125 and (b) 1 Hz. The temperature TH was maintained at160 �C, the low and high electric fields EL and EH were set at 0.2 and 0.75 MV/m,while rH was 25.13 MPa.
0.1 0.2 0.3 0.4 0.5 0.6 0.7 0.8 0.9-2
0
2
4
6
8
10
12
Electric field, E (MV/m)
Ele
ctri
c di
spla
cem
ent,
D (
C/c
m2 )
f=1 HzTH=130°C
=33.56 MPaPD=41.34 0.44 W/l
Fig. 12. D–E path of five consecutive cycles of the highest experimentally measuredpower density generated with PMN-28PT with TC = 22 �C, TH = 130 �C, f = 1 Hz,EL = 0.2 MV/m, EH = 0.95 MV/m, and rH = 33.56 MPa.
I.M. McKinley et al. / Applied Energy 126 (2014) 78–89 87
5.7. Maximum power density
Fig. 12 shows five consecutive new cycles performed onPMN-28PT in the D–E diagram corresponding to the maximumgenerated power density. The heat sink and heat source tempera-tures TC and TH were set at 22 and 130 �C, respectively. Thehigh compressive stress rH was 33.56 MPa. The low and highelectric fields were 0.2 and 0.95 MV/m, respectively. The cyclefrequency was 1 Hz and the resulting sample temperature wasThot’Tcold = 85 �C, corresponding to the phase boundary betweenthe monoclinic phase and the highly polarized tetragonal phase.The consecutive cycles nearly overlapped indicating that the cyclewas highly repeatable resulting in power density of 41.3 � 0.4 W/L.
5.8. Material efficiency
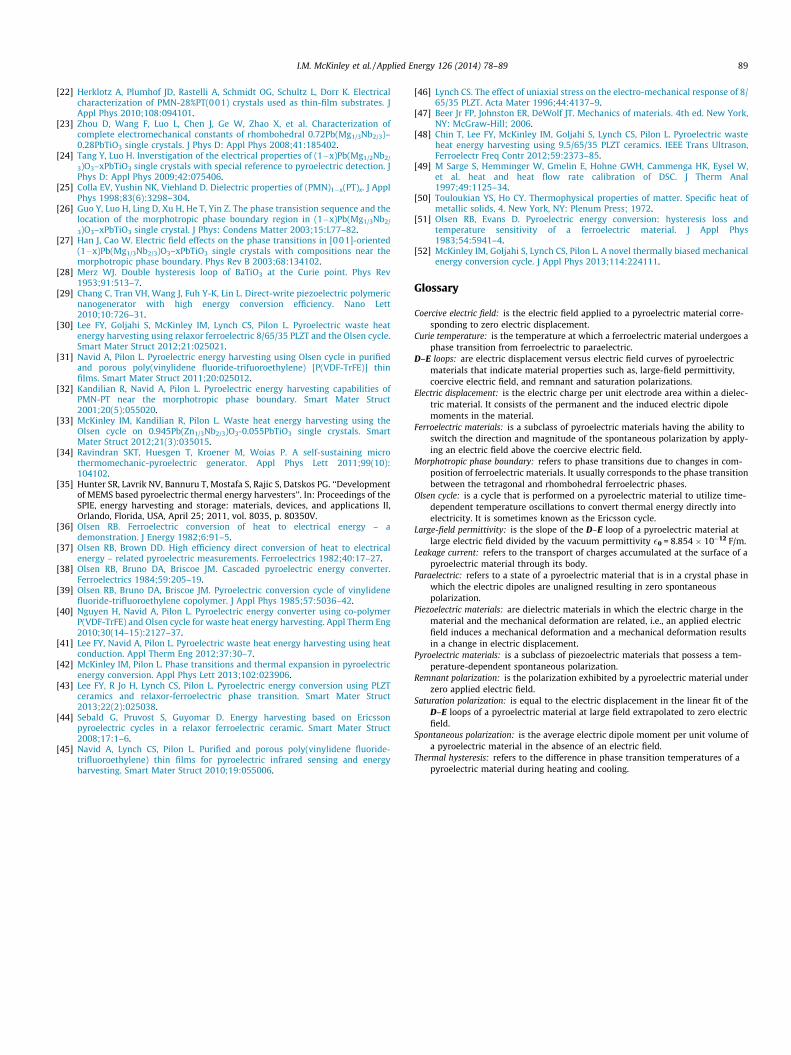
Table 1 summarizes the operating conditions, energy inputs Q in
and Win, generated energy density ND, and the material efficiency gobtained experimentally for various conditions of the new powercycle performed on PMN-28PT. It also gives conditions correspond-ing to the maximum material efficiency of the Olsen cycle. The
material efficiency of the thermomechanical power cycle and ofthe Olsen cycle was estimated using Eq. (3). The thermal energyQin was estimated according to Eq. (4) using the measured densityand specific heat cp presented in Fig. 4. The mechanical energyinput Win was computed from Eq. (5) using the area enclosed bythe stress–strain curves at 85 �C measured at 0.2 and 0.95 MV/mfor [001] PMN-28PT single crystals [52]. When the new cyclewas performed at low frequency, the large heat input resulted insmall efficiencies. These results illustrate the importance of operat-ing under small temperature swings and heat input to improve thecycle efficiency.
Moreover, for a given temperature swing, the efficiency washighly dependent on the operating temperatures. For example,the two cycle performed at 0.5 Hz in Table 1 both had similarenergy density ND, the same Win, and a temperature swingThot � Tcold = 1 �C, but their efficiencies differed by nearly a factorof two. This difference can be attributed to the operating tempera-tures. One cycle was performed between 82.3 and 83.2 �C wherecpðTÞ exhibited a phase transition peak and a large thermal hyster-esis (Fig. 4) while the other was performed between 99.9 and100.9 �C, where no phase transition occurred. This emphasizesthe importance of choosing the operating temperatures such thatthe heat input is minimized and the energy density is maximizedin order to maximize the material efficiency g. This can be achievedby operating under adiabatic conditions at a bias temperature nearthe Curie temperature [52]. In fact, the maximum power densitycycle performed at 1 Hz (Fig. 12) achieved an efficiency larger than64%. In this case, the heat input was Q in = 9 kJ/m3 and the mechan-ical work performed was Win = 55 kJ/m3. Although the sampleunderwent small temperature fluctuations Thot � Tcold ’0.1 �C dur-ing the cycle, the corresponding thermal energy input Q in wascomparable to the mechanical energy Win.
In addition, at low frequencies, it is important to choose Tcold
such that heating and applying compressive stress have a similareffect on the electric displacement. The two cycles performed at0.125 Hz in Table 1 illustrate this fact. The cycle performedbetween 90.4 and 103.1 �C had a material efficiency of 9.4%. In thiscase, the material was in the highly polarized tetragonal phase atTcold = 90.4 �C and EH = 0.75 MV/m [22]. Then, both heating andthe addition of compressive stress during process 2-3 decreasedthe electric displacement of the material. On the other hand, forthe cycle performed between 74.4 and 85.1 �C, the sample was
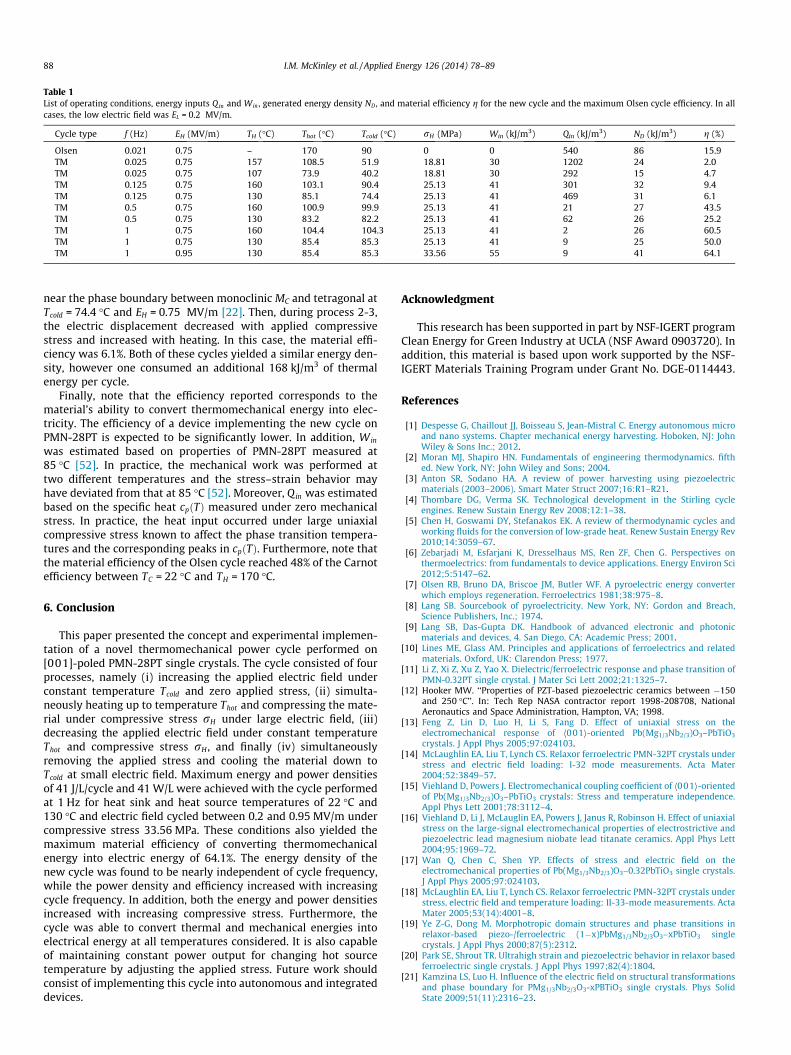
Table 1List of operating conditions, energy inputs Q in and Win , generated energy density ND , and material efficiency g for the new cycle and the maximum Olsen cycle efficiency. In allcases, the low electric field was EL = 0.2 MV/m.
Cycle type f (Hz) EH (MV/m) TH (�C) Thot (�C) Tcold (�C) rH (MPa) Win (kJ/m3) Qin (kJ/m3) ND (kJ/m3) g (%)
Olsen 0.021 0.75 – 170 90 0 0 540 86 15.9TM 0.025 0.75 157 108.5 51.9 18.81 30 1202 24 2.0TM 0.025 0.75 107 73.9 40.2 18.81 30 292 15 4.7TM 0.125 0.75 160 103.1 90.4 25.13 41 301 32 9.4TM 0.125 0.75 130 85.1 74.4 25.13 41 469 31 6.1TM 0.5 0.75 160 100.9 99.9 25.13 41 21 27 43.5TM 0.5 0.75 130 83.2 82.2 25.13 41 62 26 25.2TM 1 0.75 160 104.4 104.3 25.13 41 2 26 60.5TM 1 0.75 130 85.4 85.3 25.13 41 9 25 50.0TM 1 0.95 130 85.4 85.3 33.56 55 9 41 64.1
88 I.M. McKinley et al. / Applied Energy 126 (2014) 78–89
near the phase boundary between monoclinic MC and tetragonal atTcold = 74.4 �C and EH = 0.75 MV/m [22]. Then, during process 2-3,the electric displacement decreased with applied compressivestress and increased with heating. In this case, the material effi-ciency was 6.1%. Both of these cycles yielded a similar energy den-sity, however one consumed an additional 168 kJ/m3 of thermalenergy per cycle.
Finally, note that the efficiency reported corresponds to thematerial’s ability to convert thermomechanical energy into elec-tricity. The efficiency of a device implementing the new cycle onPMN-28PT is expected to be significantly lower. In addition, Win
was estimated based on properties of PMN-28PT measured at85 �C [52]. In practice, the mechanical work was performed attwo different temperatures and the stress–strain behavior mayhave deviated from that at 85 �C [52]. Moreover, Qin was estimatedbased on the specific heat cpðTÞ measured under zero mechanicalstress. In practice, the heat input occurred under large uniaxialcompressive stress known to affect the phase transition tempera-tures and the corresponding peaks in cpðTÞ. Furthermore, note thatthe material efficiency of the Olsen cycle reached 48% of the Carnotefficiency between TC = 22 �C and TH = 170 �C.
6. Conclusion
This paper presented the concept and experimental implemen-tation of a novel thermomechanical power cycle performed on[001]-poled PMN-28PT single crystals. The cycle consisted of fourprocesses, namely (i) increasing the applied electric field underconstant temperature Tcold and zero applied stress, (ii) simulta-neously heating up to temperature Thot and compressing the mate-rial under compressive stress rH under large electric field, (iii)decreasing the applied electric field under constant temperatureThot and compressive stress rH , and finally (iv) simultaneouslyremoving the applied stress and cooling the material down toTcold at small electric field. Maximum energy and power densitiesof 41 J/L/cycle and 41 W/L were achieved with the cycle performedat 1 Hz for heat sink and heat source temperatures of 22 �C and130 �C and electric field cycled between 0.2 and 0.95 MV/m undercompressive stress 33.56 MPa. These conditions also yielded themaximum material efficiency of converting thermomechanicalenergy into electric energy of 64.1%. The energy density of thenew cycle was found to be nearly independent of cycle frequency,while the power density and efficiency increased with increasingcycle frequency. In addition, both the energy and power densitiesincreased with increasing compressive stress. Furthermore, thecycle was able to convert thermal and mechanical energies intoelectrical energy at all temperatures considered. It is also capableof maintaining constant power output for changing hot sourcetemperature by adjusting the applied stress. Future work shouldconsist of implementing this cycle into autonomous and integrateddevices.
Acknowledgment
This research has been supported in part by NSF-IGERT programClean Energy for Green Industry at UCLA (NSF Award 0903720). Inaddition, this material is based upon work supported by the NSF-IGERT Materials Training Program under Grant No. DGE-0114443.
References
[1] Despesse G, Chaillout JJ, Boisseau S, Jean-Mistral C. Energy autonomous microand nano systems. Chapter mechanical energy harvesting. Hoboken, NJ: JohnWiley & Sons Inc.; 2012.
[2] Moran MJ, Shapiro HN. Fundamentals of engineering thermodynamics. fifthed. New York, NY: John Wiley and Sons; 2004.
[3] Anton SR, Sodano HA. A review of power harvesting using piezoelectricmaterials (2003–2006). Smart Mater Struct 2007;16:R1–R21.
[4] Thombare DG, Verma SK. Technological development in the Stirling cycleengines. Renew Sustain Energy Rev 2008;12:1–38.
[5] Chen H, Goswami DY, Stefanakos EK. A review of thermodynamic cycles andworking fluids for the conversion of low-grade heat. Renew Sustain Energy Rev2010;14:3059–67.
[6] Zebarjadi M, Esfarjani K, Dresselhaus MS, Ren ZF, Chen G. Perspectives onthermoelectrics: from fundamentals to device applications. Energy Environ Sci2012;5:5147–62.
[7] Olsen RB, Bruno DA, Briscoe JM, Butler WF. A pyroelectric energy converterwhich employs regeneration. Ferroelectrics 1981;38:975–8.
[8] Lang SB. Sourcebook of pyroelectricity. New York, NY: Gordon and Breach,Science Publishers, Inc.; 1974.
[9] Lang SB, Das-Gupta DK. Handbook of advanced electronic and photonicmaterials and devices, 4. San Diego, CA: Academic Press; 2001.
[10] Lines ME, Glass AM. Principles and applications of ferroelectrics and relatedmaterials. Oxford, UK: Clarendon Press; 1977.
[11] Li Z, Xi Z, Xu Z, Yao X. Dielectric/ferroelectric response and phase transition ofPMN-0.32PT single crystal. J Mater Sci Lett 2002;21:1325–7.
[12] Hooker MW. ‘‘Properties of PZT-based piezoelectric ceramics between �150and 250 �C’’. In: Tech Rep NASA contractor report 1998-208708, NationalAeronautics and Space Administration, Hampton, VA; 1998.
[13] Feng Z, Lin D, Luo H, Li S, Fang D. Effect of uniaxial stress on theelectromechanical response of h001i-oriented Pb(Mg1/3Nb2/3)O3–PbTiO3
crystals. J Appl Phys 2005;97:024103.[14] McLaughlin EA, Liu T, Lynch CS. Relaxor ferroelectric PMN-32PT crystals under
stress and electric field loading: I-32 mode measurements. Acta Mater2004;52:3849–57.
[15] Viehland D, Powers J. Electromechanical coupling coefficient of h001i-orientedof Pb(Mg1/3Nb2/3)O3–PbTiO3 crystals: Stress and temperature independence.Appl Phys Lett 2001;78:3112–4.
[16] Viehland D, Li J, McLauglin EA, Powers J, Janus R, Robinson H. Effect of uniaxialstress on the large-signal electromechanical properties of electrostrictive andpiezoelectric lead magnesium niobate lead titanate ceramics. Appl Phys Lett2004;95:1969–72.
[17] Wan Q, Chen C, Shen YP. Effects of stress and electric field on theelectromechanical properties of Pb(Mg1/3Nb2/3)O3–0.32PbTiO3 single crystals.J Appl Phys 2005;97:024103.
[18] McLaughlin EA, Liu T, Lynch CS. Relaxor ferroelectric PMN-32PT crystals understress, electric field and temperature loading: II-33-mode measurements. ActaMater 2005;53(14):4001–8.
[19] Ye Z-G, Dong M. Morphotropic domain structures and phase transitions inrelaxor-based piezo-/ferroelectric (1�x)PbMg1/3Nb2/3O3–xPbTiO3 singlecrystals. J Appl Phys 2000;87(5):2312.
[20] Park SE, Shrout TR. Ultrahigh strain and piezoelectric behavior in relaxor basedferroelectric single crystals. J Appl Phys 1997;82(4):1804.
[21] Kamzina LS, Luo H. Influence of the electric field on structural transformationsand phase boundary for PMg1/3Nb2/3O3-xPBTiO3 single crystals. Phys SolidState 2009;51(11):2316–23.
I.M. McKinley et al. / Applied Energy 126 (2014) 78–89 89
[22] Herklotz A, Plumhof JD, Rastelli A, Schmidt OG, Schultz L, Dorr K. Electricalcharacterization of PMN-28%PT(0 01) crystals used as thin-film substrates. JAppl Phys 2010;108:094101.
[23] Zhou D, Wang F, Luo L, Chen J, Ge W, Zhao X, et al. Characterization ofcomplete electromechanical constants of rhombohedral 0.72Pb(Mg1/3Nb2/3)–0.28PbTiO3 single crystals. J Phys D: Appl Phys 2008;41:185402.
[24] Tang Y, Luo H. Inverstigation of the electrical properties of (1�x)Pb(Mg1/2Nb2/
3)O3–xPbTiO3 single crystals with special reference to pyroelectric detection. JPhys D: Appl Phys 2009;42:075406.
[25] Colla EV, Yushin NK, Viehland D. Dielectric properties of (PMN)1�x(PT)x. J ApplPhys 1998;83(6):3298–304.
[26] Guo Y, Luo H, Ling D, Xu H, He T, Yin Z. The phase transistion sequence and thelocation of the morphotropic phase boundary region in (1�x)Pb(Mg1/3Nb2/
3)O3–xPbTiO3 single crystal. J Phys: Condens Matter 2003;15:L77–82.[27] Han J, Cao W. Electric field effects on the phase transitions in [001]-oriented
(1�x)Pb(Mg1/3Nb2/3)O3–xPbTiO3 single crystals with compositions near themorphotropic phase boundary. Phys Rev B 2003;68:134102.
[28] Merz WJ. Double hysteresis loop of BaTiO3 at the Curie point. Phys Rev1953;91:513–7.
[29] Chang C, Tran VH, Wang J, Fuh Y-K, Lin L. Direct-write piezoelectric polymericnanogenerator with high energy conversion efficiency. Nano Lett2010;10:726–31.
[30] Lee FY, Goljahi S, McKinley IM, Lynch CS, Pilon L. Pyroelectric waste heatenergy harvesting using relaxor ferroelectric 8/65/35 PLZT and the Olsen cycle.Smart Mater Struct 2012;21:025021.
[31] Navid A, Pilon L. Pyroelectric energy harvesting using Olsen cycle in purifiedand porous poly(vinylidene fluoride-trifuoroethylene) [P(VDF-TrFE)] thinfilms. Smart Mater Struct 2011;20:025012.
[32] Kandilian R, Navid A, Pilon L. Pyroelectric energy harvesting capabilities ofPMN-PT near the morphotropic phase boundary. Smart Mater Struct2001;20(5):055020.
[33] McKinley IM, Kandilian R, Pilon L. Waste heat energy harvesting using theOlsen cycle on 0.945Pb(Zn1/3Nb2/3)O3-0.055PbTiO3 single crystals. SmartMater Struct 2012;21(3):035015.
[34] Ravindran SKT, Huesgen T, Kroener M, Woias P. A self-sustaining microthermomechanic-pyroelectric generator. Appl Phys Lett 2011;99(10):104102.
[35] Hunter SR, Lavrik NV, Bannuru T, Mostafa S, Rajic S, Datskos PG. ‘‘Developmentof MEMS based pyroelectric thermal energy harvesters’’. In: Proceedings of theSPIE, energy harvesting and storage: materials, devices, and applications II,Orlando, Florida, USA, April 25; 2011, vol. 8035, p. 80350V.
[36] Olsen RB. Ferroelectric conversion of heat to electrical energy – ademonstration. J Energy 1982;6:91–5.
[37] Olsen RB, Brown DD. High efficiency direct conversion of heat to electricalenergy – related pyroelectric measurements. Ferroelectrics 1982;40:17–27.
[38] Olsen RB, Bruno DA, Briscoe JM. Cascaded pyroelectric energy converter.Ferroelectrics 1984;59:205–19.
[39] Olsen RB, Bruno DA, Briscoe JM. Pyroelectric conversion cycle of vinylidenefluoride-trifluoroethylene copolymer. J Appl Phys 1985;57:5036–42.
[40] Nguyen H, Navid A, Pilon L. Pyroelectric energy converter using co-polymerP(VDF-TrFE) and Olsen cycle for waste heat energy harvesting. Appl Therm Eng2010;30(14–15):2127–37.
[41] Lee FY, Navid A, Pilon L. Pyroelectric waste heat energy harvesting using heatconduction. Appl Therm Eng 2012;37:30–7.
[42] McKinley IM, Pilon L. Phase transitions and thermal expansion in pyroelectricenergy conversion. Appl Phys Lett 2013;102:023906.
[43] Lee FY, R Jo H, Lynch CS, Pilon L. Pyroelectric energy conversion using PLZTceramics and relaxor-ferroelectric phase transition. Smart Mater Struct2013;22(2):025038.
[44] Sebald G, Pruvost S, Guyomar D. Energy harvesting based on Ericssonpyroelectric cycles in a relaxor ferroelectric ceramic. Smart Mater Struct2008;17:1–6.
[45] Navid A, Lynch CS, Pilon L. Purified and porous poly(vinylidene fluoride-trifluoroethylene) thin films for pyroelectric infrared sensing and energyharvesting. Smart Mater Struct 2010;19:055006.
[46] Lynch CS. The effect of uniaxial stress on the electro-mechanical response of 8/65/35 PLZT. Acta Mater 1996;44:4137–9.
[47] Beer Jr FP, Johnston ER, DeWolf JT. Mechanics of materials. 4th ed. New York,NY: McGraw-Hill; 2006.
[48] Chin T, Lee FY, McKinley IM, Goljahi S, Lynch CS, Pilon L. Pyroelectric wasteheat energy harvesting using 9.5/65/35 PLZT ceramics. IEEE Trans Ultrason,Ferroelectr Freq Contr 2012;59:2373–85.
[49] M Sarge S, Hemminger W, Gmelin E, Hohne GWH, Cammenga HK, Eysel W,et al. heat and heat flow rate calibration of DSC. J Therm Anal1997;49:1125–34.
[50] Touloukian YS, Ho CY. Thermophysical properties of matter. Specific heat ofmetallic solids, 4. New York, NY: Plenum Press; 1972.
[51] Olsen RB, Evans D. Pyroelectric energy conversion: hysteresis loss andtemperature sensitivity of a ferroelectric material. J Appl Phys1983;54:5941–4.
[52] McKinley IM, Goljahi S, Lynch CS, Pilon L. A novel thermally biased mechanicalenergy conversion cycle. J Appl Phys 2013;114:224111.
Glossary
Coercive electric field: is the electric field applied to a pyroelectric material corre-sponding to zero electric displacement.
Curie temperature: is the temperature at which a ferroelectric material undergoes aphase transition from ferroelectric to paraelectric.
D–E loops: are electric displacement versus electric field curves of pyroelectricmaterials that indicate material properties such as, large-field permittivity,coercive electric field, and remnant and saturation polarizations.
Electric displacement: is the electric charge per unit electrode area within a dielec-tric material. It consists of the permanent and the induced electric dipolemoments in the material.
Ferroelectric materials: is a subclass of pyroelectric materials having the ability toswitch the direction and magnitude of the spontaneous polarization by apply-ing an electric field above the coercive electric field.
Morphotropic phase boundary: refers to phase transitions due to changes in com-position of ferroelectric materials. It usually corresponds to the phase transitionbetween the tetragonal and rhombohedral ferroelectric phases.
Olsen cycle: is a cycle that is performed on a pyroelectric material to utilize time-dependent temperature oscillations to convert thermal energy directly intoelectricity. It is sometimes known as the Ericsson cycle.
Large-field permittivity: is the slope of the D–E loop of a pyroelectric material atlarge electric field divided by the vacuum permittivity �0 = 8.854 � 10�12 F/m.
Leakage current: refers to the transport of charges accumulated at the surface of apyroelectric material through its body.
Paraelectric: refers to a state of a pyroelectric material that is in a crystal phase inwhich the electric dipoles are unaligned resulting in zero spontaneouspolarization.
Piezoelectric materials: are dielectric materials in which the electric charge in thematerial and the mechanical deformation are related, i.e., an applied electricfield induces a mechanical deformation and a mechanical deformation resultsin a change in electric displacement.
Pyroelectric materials: is a subclass of piezoelectric materials that possess a tem-perature-dependent spontaneous polarization.
Remnant polarization: is the polarization exhibited by a pyroelectric material underzero applied electric field.
Saturation polarization: is equal to the electric displacement in the linear fit of theD–E loops of a pyroelectric material at large field extrapolated to zero electricfield.
Spontaneous polarization: is the average electric dipole moment per unit volume ofa pyroelectric material in the absence of an electric field.
Thermal hysteresis: refers to the difference in phase transition temperatures of apyroelectric material during heating and cooling.