Embed Size (px)
Citation preview

A Pareto And A Plan Will Change Your Career How To Use Data To Build Sustainable Sourcing Teams
@Tombecker VP, Recruiting ManpowerGroup

Manpower | Sept 3, 2014 2
ManpowerGroupTM is the world leader in innovative workforce solutions. We leverage our global reach and local expertise of tens of thousands of people across more than 80 countries, making it possible for businesses to access the talent they need when they need it.
ManpowerGroupTM Solutions provides clients with human resources outsourcing services primarily in the areas of large-scale recruiting and outcome-based workforce-intensive initiatives, thereby sharing in the risk and reward with our clients.
ExperisTM is the global leader in professional resourcing and project-based workforce solutions. With operations in more than 50 countries, we deliver 53 million hours of professional talent specializing in IT, Finance and Engineering to accelerate clients’ businesses each year.
Right Management® is the global leader in talent and career management workforce solutions. Through our innovative and proprietary process, we leverage our expertise to successfully increase productivity and optimize business performance.
Manpower® is the global leader in contingent and permanent recruitment workforce solutions. We provide the personal flexibility and agility businesses need with a continuum of staffing solutions.

Manpower | Sept 3, 2014 3

Manpower | Sept 3, 2014 4
Source: h*p://www.harpercollege.edu/mhealy/eco212i/lectures/ch9-‐18.htm

Manpower | Sept 3, 2014 5
1948 2014

Manpower | Sept 3, 2014 6

Manpower | Sept 3, 2014 7
Watts and Strogatz model Six Degrees:
The Science of a Connected

Manpower | Sept 3, 2014 8
• 4% of organizations surveyed believe they have the predictive talent analytics capabilities today.
• Only 14% of companies have any form of talent analytics program in place,
• yet more than 60% want to build a plan this year.

Manpower | Sept 3, 2014 9
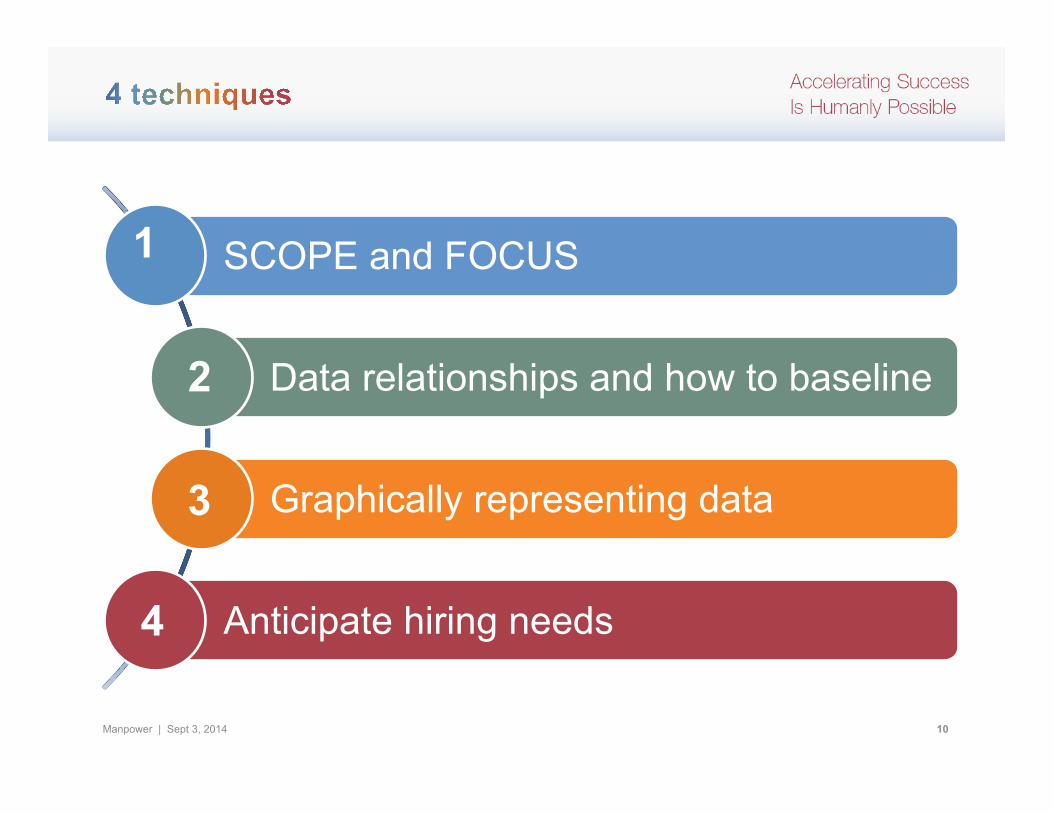
Manpower | Sept 3, 2014 10
SCOPE and FOCUS
Data relationships and how to baseline
Graphically representing data
Anticipate hiring needs
1
2
3
4

1SCOPE and FOCUS

Manpower | Sept 3, 2014 12

Manpower | Sept 3, 2014 13
• 80% of a company's profits come from 20% of its customers
• 80% of a company's complaints come from 20% of its customers
• 80% of a company's profits come from 20% of the time its staff spend
• 80% of a company's sales come from 20% of its products
• 80% of a company's sales are made by 20% of its sales staff

Manpower | Sept 3, 2014 14

Manpower | Sept 3, 2014 15
Pareto chart of sourcing issues
Res
pons
es in
#
Perc
enta
ges
Don’t understand
ROI
Sourcing wrong skills
Lack of CRM
Training Wrong people
Other
count of issue 98 67 47 28 17 28Percent 34.4 23.5 16.5 9.8 6.0 9.8Cum % 34.4 57.9 74.4 84.2 90.2 100.0
Sourcing issuesOt
her
Wron
g peo
ple
Train
ing
Lack
of CR
M
Sourc
ing w
rong s
kills
Don't
unde
rstan
d ROI
300
250
200
150
100
50
0
100
80
60
40
20
0
coun
t of
issu
e
Perc
ent
Pareto Chart of Sourcing issues
50
100
150
200
250
300
0%
20%
40%
60%
80%
100%

Manpower | Sept 3, 2014 16
Difficulty in filling – fill ratio
Volu
me
of p
ositi
ons
0 5
0
1
00
1
50
20
0
25
0
0% 10% 20% 30% 40% 50% 60% 70% 80% 90% 100%
• Java Developer
• Call Center
• Software developer
• Adm assistance
• Project Manager
• Service technicians
• Tellers
• General labor

Manpower | Sept 3, 2014 17
The survey revealed more than 1 in 3 U.S. employers report they are experiencing difficulty filling jobs due to a lack of available talent.
17
14% 19%
22%
41%
31% 30% 31% 34% 34%
40%
Global U.S.
44% 41%
52% 49%
39%
60%
40%
20%
0% 2006 2007 2008 2009 2010 2011 2012 2013 2014
Percentage of U.S. Employers Having Difficulty Filling Jobs
35%
40%
36%

Manpower | Sept 3, 2014 18
10 Hardest Jobs to Fill
Source: ManpowerGroup 2014 U.S. Talent Shortage Survey
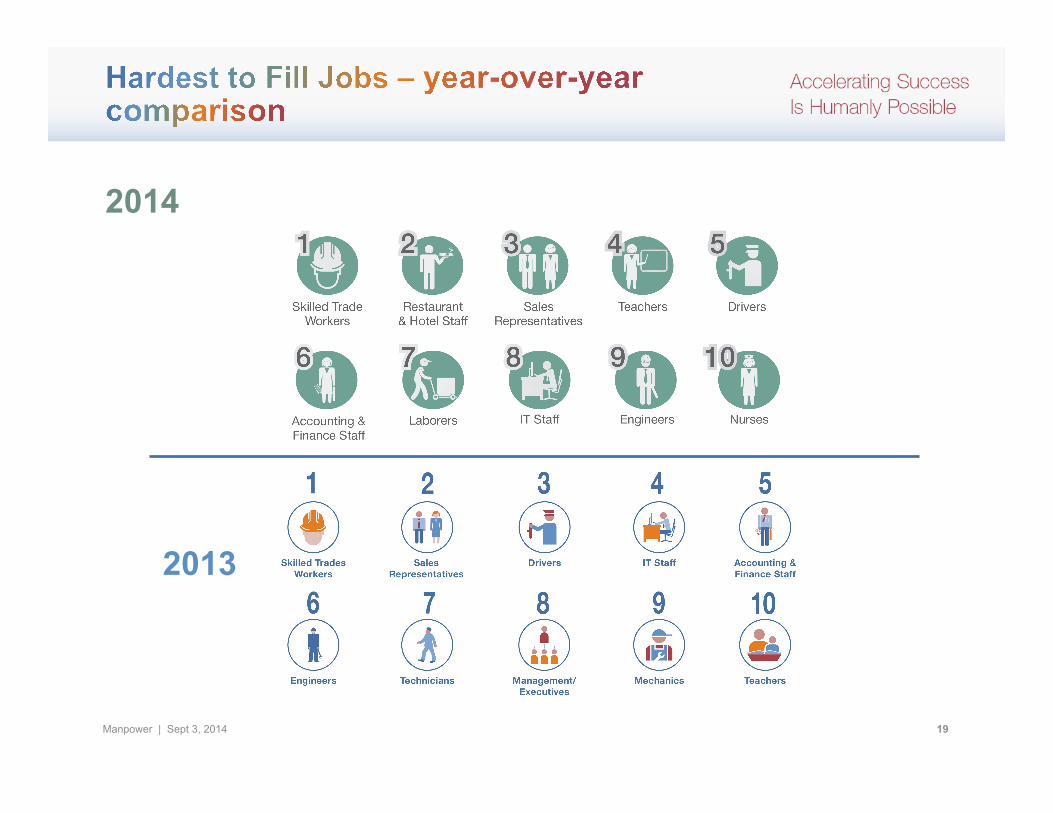
Manpower | Sept 3, 2014 19
2014
Source: ManpowerGroup 2014 U.S. Talent Shortage Survey
2013

2data relationships and how to baseline

Manpower | Sept 3, 2014 21
We offer 3 kinds of service:
1. GOOD 2. CHEAP 3. FAST

Manpower | Sept 3, 2014 22
You pick any two:
GOOD recruiting CHEAP won’t be FAST GOOD recruiting FAST won’t be CHEAP FAST recruiting CHEAP won’t be GOOD

Manpower | Sept 3, 2014 23
0.90
0.84
0.78
0.960.880.80
642 4.03.53.0
6
4
25.6
4.8
4.04.0
3.5
3.0
0.900.840.78
0.96
0.88
0.80
5.64.84.0
Fill Ratio
Time to first submit days
S2I
I2H
Percent completed intake
Matrix Plot of Fill Ratio, Time to firs, S2I, I2H, Percent comp

Manpower | Sept 3, 2014 24
0.950.900.850.800.75
0.95
0.90
0.85
0.80
0.75
Percent completed intake
Fill
Rat
io
Scatterplot of Fill Ratio vs Percent completed intake

Manpower | Sept 3, 2014 25
Fill Ratio by month
0%10%20%30%40%50%60%70%80%90%100%
Jan08Feb08
March08
April08
May08
June08July08Aug08
Sept08Oct08Nov08Dec08Jan09Feb09
March09
April09
May09
June09July09Aug09
Sept09Oct09Nov09Dec09

Manpower | Sept 3, 2014 26
Average
NovSepJulMayMarJanNovSepJulMayMarJan
0.95
0.90
0.85
0.80
0.75
Fil
l R
ati
o
_X=0.8579
UC L=0.9620
LC L=0.7538
NovSepJulMayMarJanNovSepJulMayMarJan
0.12
0.09
0.06
0.03
0.00
Mo
vin
g R
an
ge
__MR=0.0391
UC L=0.1279
LC L=0
1
1
Fill Ratio CONTROL CHART with MOVING RANGEUpper Control
Limit
Lower Control
Limit
Out of control point

3Understand how to graphically represent data
Manpower | Sept 3, 2014 28

Manpower | Sept 3, 2014 29
Fill Ratios
The data represents all of September fill ratios based on closed job activity. Data source: Taleo.
September fill ratios by line of business.
96% 71% 94% 82%
Marketing Finance IT High Volume
$12,729
$5,610
$4,298
$3,193
$941
Executive
Marketing
Finance
IT
High volume
Cost per hire
81.5% NPS Net promoter score is an index score which measures the number of people who would would refer (9-10) our services minus the numnber of hirinh managers who would not. (1-3). The number excludes thos who are neither a promoter or a detracter. (4-8)
Hiring Satisfaction
Opening Volume (2014 YTD)
Marketing Finance IT High
Volume
67% 89% 92% 78%
September enterprise opening volume per month. Source: Taleo

Manpower | Sept 3, 2014 30
0
10
20
30
40
50
60
70
80
Executive Marketing Sales Manufacturing Technology
Time to fill
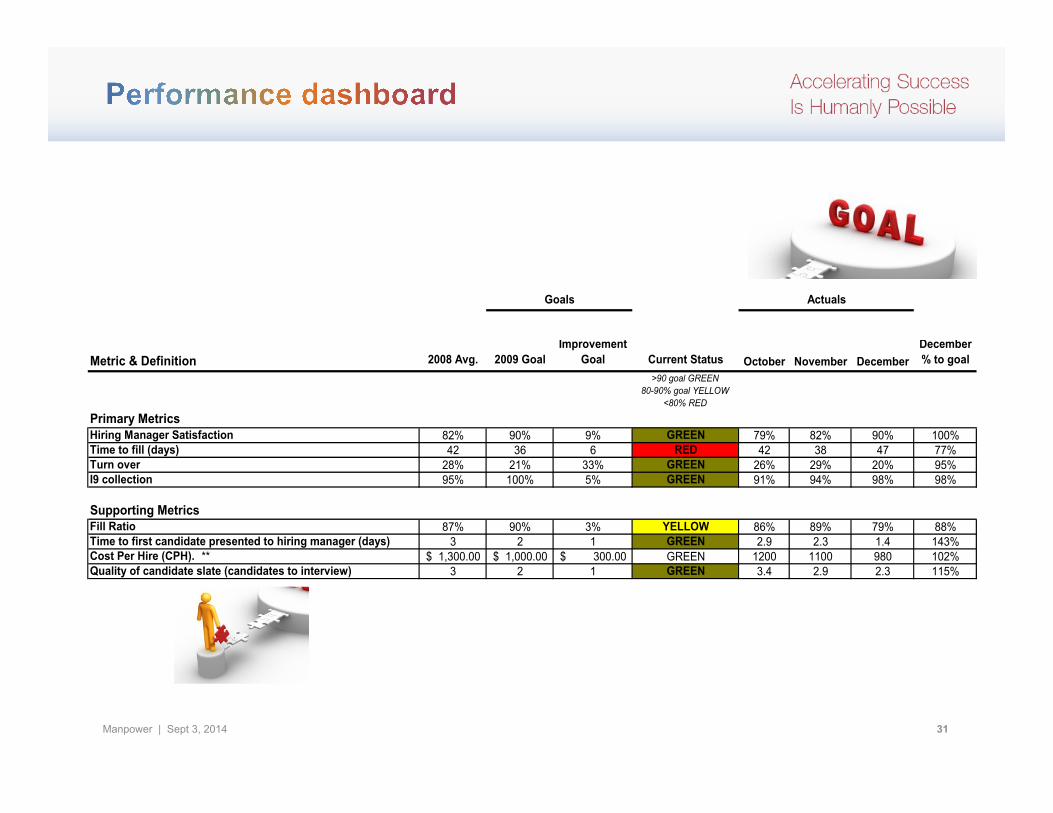
Manpower | Sept 3, 2014 31
Goals Actuals
Metric & Definition 2008 Avg. 2009 GoalImprovement
Goal Current Status October November DecemberDecember% to goal
>90 goal GREEN80-90% goal YELLOW
<80% RED
Primary MetricsHiring Manager Satisfaction 82% 90% 9% GREEN 79% 82% 90% 100%Time to fill (days) 42 36 6 RED 42 38 47 77%Turn over 28% 21% 33% GREEN 26% 29% 20% 95%I9 collection 95% 100% 5% GREEN 91% 94% 98% 98%
Supporting Metrics Fill Ratio 87% 90% 3% YELLOW 86% 89% 79% 88%Time to first candidate presented to hiring manager (days) 3 2 1 GREEN 2.9 2.3 1.4 143%Cost Per Hire (CPH). ** 1,300.00$ 1,000.00$ 300.00$ GREEN 1200 1100 980 102%Quality of candidate slate (candidates to interview) 3 2 1 GREEN 3.4 2.9 2.3 115%
SAMPLE Recruiting Performance Dashboard

4Understand how to anticipate hiring needs
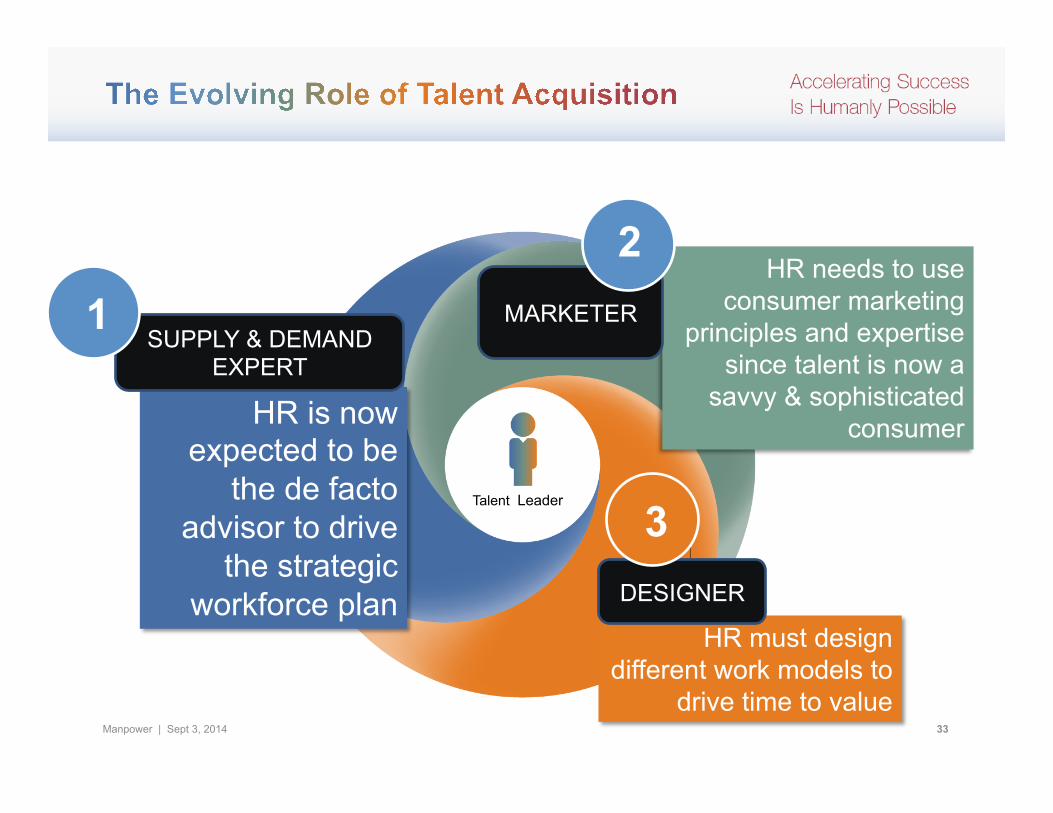
Manpower | Sept 3, 2014 33
HR is now expected to be
the de facto advisor to drive
the strategic workforce plan
SUPPLY & DEMAND EXPERT
1
HR must design different work models to
drive time to value
DESIGNER
3
HR needs to use consumer marketing
principles and expertise since talent is now a
savvy & sophisticated consumer
MARKETER
2
Talent Leader
Manpower | Sept 3, 2014 34
The Allure of BIG DATA in sourcing & recruiting

Manpower | Sept 3, 2014 35
Byte of data
Megabyte of data
Terabyte One terabyte is one trillion bytes
The byte was the number of bits used to encode a single character of text in a computer
One million bytes of information

Manpower | Sept 3, 2014 36

Manpower | Sept 3, 2014 37
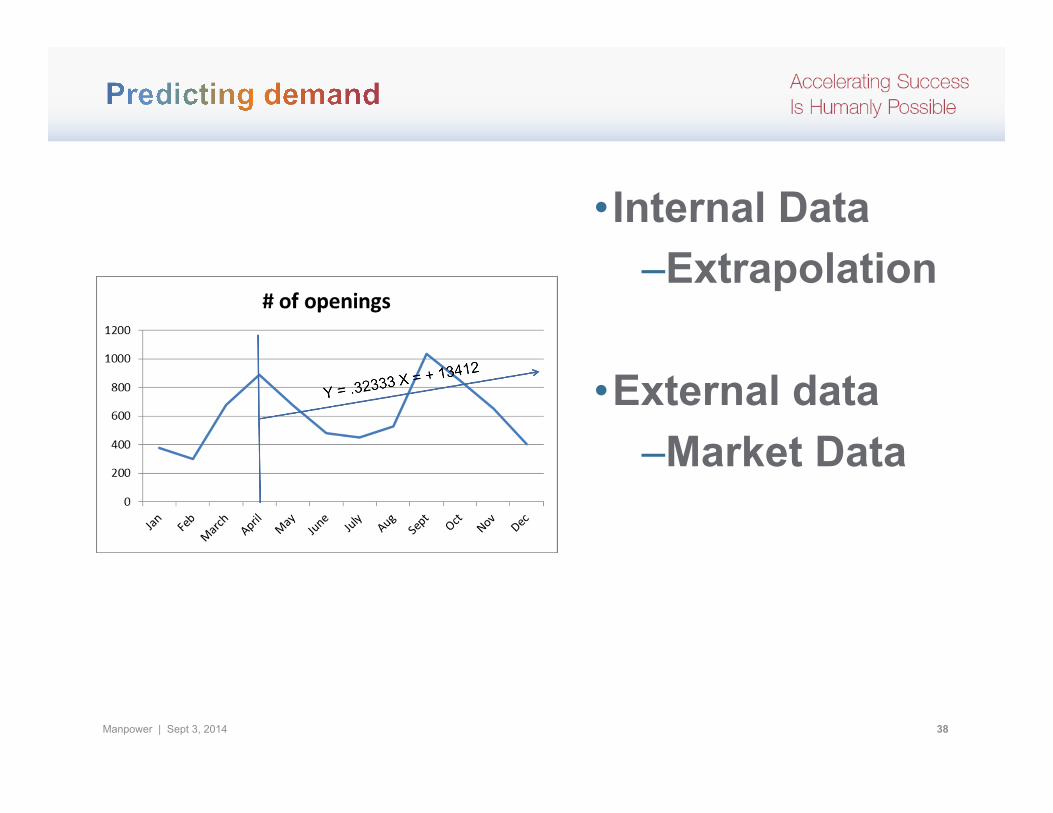
Y = .32333 X = + 13412
Manpower | Sept 3, 2014 38
• Internal Data – Extrapolation
• External data – Market Data

Manpower | Sept 3, 2014 39
• U.S. employers are taking longer—25 working days, on average—to fill vacant positions.
• That is a 13-year high, according to the Dice-DFH Vacancy Duration Measure, an index created by University of Chicago economist Steven Davis.
• At companies with 5,000 or more workers, the time to hire is even longer, at 58.1 working days

Manpower | Sept 3, 2014 40
June:4.8 million
Sourced: http://online.wsj.com/articles/job-openings-hit-13-year-high-1407874551
Manpower | Sept 3, 2014 41
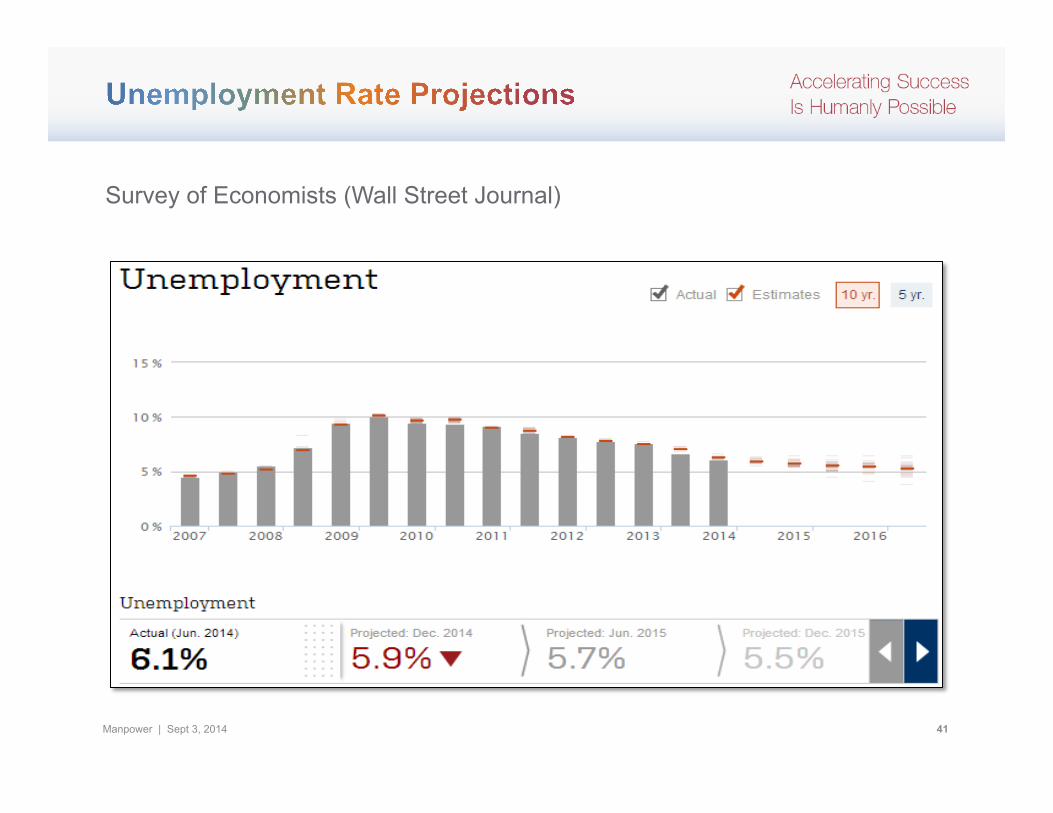
Survey of Economists (Wall Street Journal)

Manpower | Sept 3, 2014 42
Understand how to focus & SCOPE
Understand data relationships and how to baseline
Understand how to graphically represent data
Understand how to anticipate hiring needs
1
2
3
4

Manpower | Sept 3, 2014 43

Manpower | Sept 3, 2014 44
Data Driven
Understand how to manage a processManage change, complexity and chaosFLEXIBLE
Leverage network capital

THANK YOU!
@Tombecker