Embed Size (px)
Citation preview
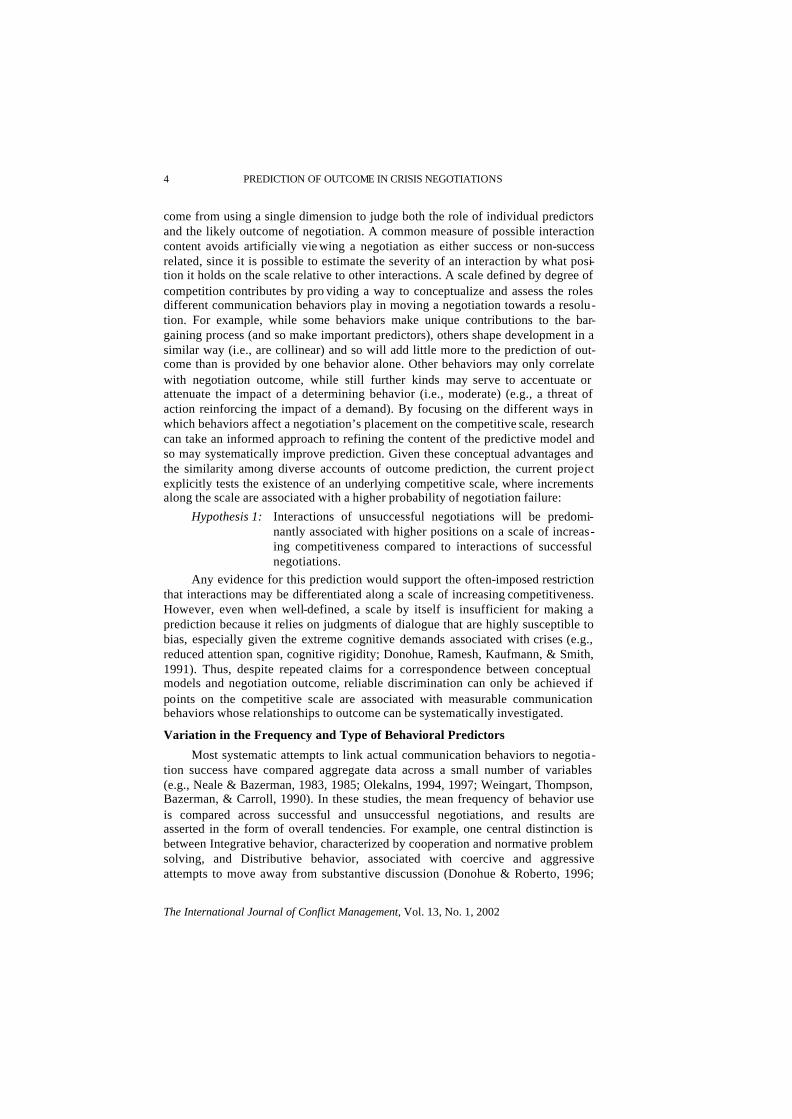
The International Journal of Conflict Management 2002, Vol. 13, No. 1, pp. 4–37
A PARTIAL ORDER SCALOGRAM ANALYSIS OF COMMUNICATION BEHAVIOR IN
CRISIS NEGOTIATION WITH THE PREDICTION OF OUTCOME
Paul J. Taylor? University of Liverpool, U.K.
This paper examines whether patterns in communication behavior over time can predict the outcome of crisis negotiations. A sample of 189 interaction episodes was transcribed from 9 resolved negotiations and coded according to differences in the degree and type of behavior. Par-tial order scalogram analysis (POSAC) was used to produce a graphical representation of the similarities and differences among episodes while simultaneously uncovering the role of each behavior in shaping the negotiation process. Results showed that episodes could be represented along a partially ordered scale of competitiveness, which was structured by the occurrence of two types of behavior: Distributive–Expressive and Integrative–Instrumental. The likelihood of negotiation success reduced with movement up the competitive scale, and negotiations involving episodes that passed a threshold of extreme competition on the scale inevitably ended unsuccessfully regardless of future developments. As negotiations developed over time, behavior alternated bet ween periods of increasing cooperation and periods of increasing competition, with unsuccessful negotiations associated with a concluding trend of increasing competitive behavior.
One of the most compelling difficulties for hostage incident commanders is to make a decision about the appropriateness of continuing negotiations relative to implementing a tactical solution. This decision relies on using current dialogue to predict whether further interaction will lead to agreement, and so exemplifies research that attempts to discriminate high-risk cases based on information about a set of behavioral predictors (Taylor, Bennell, & Snook, 2002). The problem of pre- ? Note: I thank Malamatenia Giannakaki, Marion Lloyd, Marianne Saether, and Brent Snook for assistance in coding, and William Donohue for providing the original transcripts. This research is based in part on work towards the author’s thesis, supervised by Ian Donald.

2 PREDICTION OF OUTCOME IN CRISIS NEGOTIATIONS
The International Journal of Conflict Management, Vol. 13, No. 1, 2002
dicting negotiation outcome has been tackled by various authors using a variety of criteria (Holmes, 1991), but little consensus seems to have been reached as to what may be the most fruitful way. For example, studies that relate differences in the frequency of behavior use to outcomes are often criticized for not paying sufficient attention to how the order of issue consideration over time affects progress. Simi-larly, decision rules developed by practitioners often have a form and output that is easier to apply and respond to than parametric statistics and probability values, but predictions from these rules are rarely linked to measurable units of behavior, and so may lack accuracy and reliability. Since each approach highlights a distinct but important aspect of the prediction problem, a major goal for research is to bring together the different features in a way that allows their relative predictive value to be assessed.
The current paper views the lack of previous attempts to integrate criteria of different perspectives as having both conceptual and methodological roots: that is, conceptual understanding appears to have suffered from researchers using pre-ferred methods that restrict possible analyses, while at the same time researchers fail to select other methods because the various facets of the negotiation process have not been clearly conceptualized. Since conceptual requisites should drive any methodological choice, the current paper begins by outlining three features that are central to previous solutions to the problem of predicting outcome. The three ideas combine to posit a measure of negotiation dynamics that is structured by differ-ences in the occurrence of actual behaviors and predicts the likelihood of negotia-tion success based on positions and patterns of change along its length. The need to consider methodology is a consequence of this conceptual framework, since simultaneously testing many aspects of the negotiation process requires a multidi-mensional coding of dialogue that is not easily handled by traditional methods of analysis. The predictions of the framework will instead be shown to fit neatly into a partial order of competitiveness along which outcome may be discriminated according to both immediate and long-term patterns in the degree and type of dia-logue.
Conceptualizing the Problem of Predicting Negotiation Outcome
A Scale of Competitive Behavior One important family of prognostic models comes from efforts to formalize
personal experiences into a set of coherent, integrated principles or decision rules (Bormann, 1980). The emphasis of this conceptual approach is to provide a clear yet brief set of criteria that can be employed at any point of time to help structure a decision-maker’s judgment about the degree of “success” in the current interaction. Discrimination of outcome in these frameworks typically takes the form of an additive scale, with the occurrence of more criteria implying increasing levels of antagonism and an increased likelihood of negotiation failure. For example, Noe-sier (1999) provides eleven indicators that relate to the dialogue and direct actions of perpetrators, where the absence of such features implies an increased risk to the hostages. A more dynamic actuarial system, described by Sarna (1997), involves tracking development over time by categorizing current communication issues as

P. J. TAYLOR 3
The International Journal of Conflict Management, Vol. 13, No. 1, 2002
“red” (signs of trouble to be avoided) or “green” (signs of progress to be pursued). The preponderance of red or green issues during interactions is proposed as an important indicator of progress and is considered a direct predictor of outcome.
The attractive and often overlooked feature of the experienced-driven approach is that differences among interactions can be meaningfully understood as points along a partially ordered scale of increasing competition. Competition on such a scale is gauged by the extent to which negotiators attempt to maximize indi-vidual gain through dialogue that either attacks the other party or promotes a per-sonally beneficial position (Sarna, 1997). The scale is partially ordered because negotiators consider only the amount of competition and do not judge different kinds of issues as inherently more or less competitive than other issues. Interac-tions placed at the same position on the scale, while considered to involve the same degree of competitiveness, may be comprised of different types of competitiveness. Since these qualitative variations are not differentiated, the scale gives only a par-tial ordering of the interactions.
As an interaction unfolds, so the probability of negotiation success may be measured and tracked as movement along the competitive scale. Particular atten-tion is given to a pre-defined threshold on the scale that gives an optimal prediction of outcome. Dialogue falling above this point is believed to affect the relationship between parties in such a way that it causes future interaction to move towards inevitable failure. Although practitioners usually derive this threshold from experi-ence, research on a range of high-risk problems has accumulated support for the idea of empirically deriving a “cut point” or “prognostic threshold” on a scale of increasing likelihood (Swets, Dawes, & Monahan, 2000). For example, experi-mental research has long recognized the importance of reference points (Blount, Thomas -Hunt, & Neale, 1996; Van Poucke & Buelens, 2002), where transition across a point has been shown to significantly predict future bargaining and nego-tiation outcome. Similarly, studies developing scale -based questionnaires have identified a number of communicative acts that are predictive of interpersonal con-flicts such as future marital failure (Gottman & Notarius, 2000) or physical vio-lence (Bilsky, Borg, & Wetzels, 1995). These acts arguably mark the point in con-flict where negotiation fails and individuals resort to using physical actions (against self or another) to bring about a resolution (Synder & Diesing, 1977). In terms of hostage crises, Abbott (1986) highlighted this danger point as a suicide phase of interaction, where the level of negotiated interdependence between the parties determines whether interactions move the hostage taker towards either surrender-ing or inflicting self-harm. Although Abbott’s argument is for a specific threshold, Rogan and Hammer (1995) have since shown that neutral message affect, as meas-ured on a single intensity scale, provides a more general cut-point in the sense that deviation away from this midpoint is related to negotiation outcome. In this sense, increments along a competitive scale relate to increasingly conservative decision thresholds, which require more extreme levels of behavior to be present before the negotiation is considered irreconcilable.
A partially ordered scale is a remarkably simple account of the negotiation process that has nevertheless attracted a great deal of attention and use. At least part of the scale’s attractiveness is the result of several conceptual properties that
4 PREDICTION OF OUTCOME IN CRISIS NEGOTIATIONS
The International Journal of Conflict Management, Vol. 13, No. 1, 2002
come from using a single dimension to judge both the role of individual predictors and the likely outcome of negotiation. A common measure of possible interaction content avoids artificially vie wing a negotiation as either success or non-success related, since it is possible to estimate the severity of an interaction by what posi-tion it holds on the scale relative to other interactions. A scale defined by degree of competition contributes by pro viding a way to conceptualize and assess the roles different communication behaviors play in moving a negotiation towards a resolu-tion. For example, while some behaviors make unique contributions to the bar-gaining process (and so make important predictors), others shape development in a similar way (i.e., are collinear) and so will add little more to the prediction of out-come than is provided by one behavior alone. Other behaviors may only correlate with negotiation outcome, while still further kinds may serve to accentuate or attenuate the impact of a determining behavior (i.e., moderate) (e.g., a threat of action reinforcing the impact of a demand). By focusing on the different ways in which behaviors affect a negotiation’s placement on the competitive scale, research can take an informed approach to refining the content of the predictive model and so may systematically improve prediction. Given these conceptual advantages and the similarity among diverse accounts of outcome prediction, the current project explicitly tests the existence of an underlying competitive scale, where increments along the scale are associated with a higher probability of negotiation failure:
Hypothesis 1: Interactions of unsuccessful negotiations will be predomi-nantly associated with higher positions on a scale of increas-ing competitiveness compared to interactions of successful negotiations.
Any evidence for this prediction would support the often-imposed restriction that interactions may be differentiated along a scale of increasing competitiveness. However, even when well-defined, a scale by itself is insufficient for making a prediction because it relies on judgments of dialogue that are highly susceptible to bias, especially given the extreme cognitive demands associated with crises (e.g., reduced attention span, cognitive rigidity; Donohue, Ramesh, Kaufmann, & Smith, 1991). Thus, despite repeated claims for a correspondence between conceptual models and negotiation outcome, reliable discrimination can only be achieved if points on the competitive scale are associated with measurable communication behaviors whose relationships to outcome can be systematically investigated.
Variation in the Frequency and Type of Behavioral Predictors
Most systematic attempts to link actual communication behaviors to negotia-tion success have compared aggregate data across a small number of variables (e.g., Neale & Bazerman, 1983, 1985; Olekalns, 1994, 1997; Weingart, Thompson, Bazerman, & Carroll, 1990). In these studies, the mean frequency of behavior use is compared across successful and unsuccessful negotiations, and results are asserted in the form of overall tendencies. For example, one central distinction is between Integrative behavior, characterized by cooperation and normative problem solving, and Distributive behavior, associated with coercive and aggressive attempts to move away from substantive discussion (Donohue & Roberto, 1996;

P. J. TAYLOR 5
The International Journal of Conflict Management, Vol. 13, No. 1, 2002
Miron & Goldstein, 1979; Weingart et al., 1990). These behaviors are frequently posited as interdependent orientations that produce a continuum of increasing competition (Donohue & Roberto, 1996; Putnam, 1990), and empirical evidence supports this conceptualization (Donohue, Diez, & Hamilton, 1984; Taylor 2002). Research has shown that successful negotiations are associated with more frequent use of Integrative behaviors such as a willingness to make concessions, exchange information, and support the other’s emotional needs (Donohue & Roberto, 1996; Olekalns & Smith, 2000; Putnam & Wilson, 1989). In contrast, frequent use of Distributive behaviors such as argumentative expressions, personal attacks, and unrealistic demands, reflect a contentious attitude towards interaction that is more likely to result in negotiation failure (Folger, Poole, & Stutman, 1993; Putnam & Wilson, 1989).
Research has also shown that negotiators use different kinds of Integrative or Distributive behavior to pursue a variety of different concerns or goals (Taylor, 2002; Wilson & Putnam, 1990). For example, messages about Expressive issues such as trust and affiliation are equally as important to the progress of negotiation as communication about more Instrumental task-related issues (Donohue, Lyles, & Rogan, 1989; Natslandsmyr & Rognes, 1995; Putnam, 1994). Negotiators may pursue an Integrative approach to Instrumental goals by communicating agreement and suggesting win–win solutions, but they may also adopt a Distributive approach to Instrumental issues through rejecting offers, making demands and suggesting unreasonable alternatives. Similarly, at other times, negotiators may address Expressive issues by emphasizing behaviors that manipulate relational develop-ment (e.g., criticism, humor) or show concern for the other party’s or personal identity (e.g., insult, empathy). Such qualitative differences in communication are likely to be particularly evident in hostage crises, since the majority of cases encountered by law enforcement occur as a result of hostage takers’ mental or emotional inability to cope with life stressors (Rogan, Hammer, & Van Zandt, 1994).
The implication of these studies is that degree and type of communication behavior affects how a negotiation unfolds and so both aspects must be incorpo-rated into the observable units of the predictive framework. The continuum inter-pretation of Integrative and Distributive behaviors fits nicely within the current approach by aligning with the cooperative and competitive ends of the hypothe-sized scale. Successful negotiations (associated with low regions of the competitive scale) would be predicted to involve more frequent use of Integrative behaviors, while unsuccessful negotiations (associated with the upper portion of the scale) would be expected to be predominantly associated with the occurrence of Distribu-tive behaviors. Different qualities of Integrative and Distributive behavior may moderate these predicted associations, but only to the point of affecting the degree of the relationship between behavioral occurrence and scale placement and not the actual direction of this relationship (Taylor, 2002). Following this line of argument:
6 PREDICTION OF OUTCOME IN CRISIS NEGOTIATIONS
The International Journal of Conflict Management, Vol. 13, No. 1, 2002
Hypothesis 2a: Movement up the competitive scale will be associated with increasing frequency of Instrumental and Expressive types of Distributive behaviors.
Hypothesis 2b: Movement down the competitive scale will be associated with increasing frequency of Instrumental and Expressive types of Integrative behaviors.
However, while support for these predictions will indicate the role behavioral frequency plays in determining outcome, it does not speak to the changing impor-tance of these behaviors over the longitudinal structure of negotiation (Holmes & Sykes, 1993). Consequently, the possibility remains that highly predictive behav-iors may become less useful over time, or that trends of behavior across episodes, rather than absolute values within episodes, are a better criterion for predicting outcome.
Changing Patterns of Behavior Over Time
The affect of message order on the progress of a negotiation is the central focus of phase analyses (Holmes & Sykes, 1993), prescriptive models of negotia-tion development (Donohue et al., 1991), and a wealth of research on persuasion (Erwin, 2001). One approach to examining temporal differences has continued to study the relationship between outcome and variance in behavior use, but done so over a small number of time stages. These designs, when analyzed “within-sub-jects,” can give some indication of how changes in the aggregate use of behaviors over time relate to negotiation outcome. Studies have shown that the final stage of successful negotiations is typically associated with increased creativity and reduced levels of positional arguing, whereas poor outcomes result from ineffective rela -tionship management in the first half of negotiations and excessive co mpetitive bargaining in the final stages (Jones, 1988; Putnam, Wilson, & Turner, 1990; Simons, 1993). More recent studies have associated outcome with the degree negotiators reciprocate the other party’s use of Integrative or Distributive behavior, with sequences of Distributive behavior typically moving interactions toward less successful outcomes (Olekalns & Smith, 2000; Weingart, Prietula, Hyder, & Genovese, 1999). Such findings are consistent with stage models of negotiation (Putnam, 1990), which view both Integrative and Distributive tactics as surfacing in dialogue during all stages of a negotiation, but associate unsuccessful negotia-tions with a final stage of high Distributive behavior.
The results of within-subjects studies have led researchers to associate the prediction of outcome with broad trends in communication that culminate (and so can be best observed) in the final stages of interaction. However, pointing to the high levels of within-subject variance in such studies, several authors have argued that simply incorporating a time factor is not sufficient to capture the complex dynamics of the negotiation process (Holmes, 1991). Evidence supporting this claim is orientated towards mapping out phases or episodes of activity over time, where an episode is a discrete period of dialogue focused on a single issue. Studies using phase analysis have demonstrated that quite complex changes in the focus of interaction underpin the larger trends towards problem-solving identified in within-
P. J. TAYLOR 7
The International Journal of Conflict Management, Vol. 13, No. 1, 2002
subject studies (Donohue & Roberto, 1993; Holmes & Sykes, 1993). Negotiators may rapidly switch between cooperation and competition to deal with multiple concerns, return to previous phases of interaction as additional information sur-faces, or skip phases entirely to avoid impasse. The implication of such dynamics is a more fluid pattern of change over time as negotiators use periods of increasing (and decreasing) competition and cooperation to move through their various con-cerns. Yet even in the phase perspective, it is the extent to which negotiators coop-erate during a final resolution stage of interaction that determines the eventual out-come of a negotiation. The phase studies, therefore, concur with the findings of within-subject studies, suggesting that localized complex patterns of behavior give rise to larger-scale, global trends that may be equally important predictors of nego-tiation outcome, particularly during the final stages of interaction.
Given a sufficient number of time periods, previous research would lead to the expectation that negotiation dialogue will produce several gradual movements up and down the competitive scale (Donohue & Roberto, 1996; Putnam, 1990). However, if the underlying scale accurately discriminates outcomes based on the global patterns in behavior, then it follows that successful and unsuccessful out-comes will be associated with final trends towards cooperative and competitive ends of the scale respectively. Thus, it is predicted:
Hypothesis 3a : Unsuccessful negotiations will be characterized by episodes that show a final upward trend of movement along the com-petitive scale.
Hypothesis 3b : Successful negotiations will be characterized by episodes that show a final downward trend of movement along the com-petitive scale.
Method
Transcription Data The data were a convenience sample of chronological transcripts from nine
actual hostage crises. The accounts were produced from audiotape recordings of negotiations collected from the archives of various U.S. police departments, and have been used effectively in previous research (e.g., Donohue & Roberto, 1996; Taylor, 2002). The final transcripts represented a diverse set of negotiations, from “criminal” incidents in which an individual negotiates to gain some material bene-fit, to “psychological” or “domestic” incidents, where the hostage taker’s focus is on attracting sympathy for a personal need. This range of incidents was sufficiently diverse to embody what previous research has shown reflects police officers’ per-ceptions regarding the distinguishing goals and orientations of hostage takers (Donohue & Roberto, 1993).
Classification of Outcome. In order to test the hypotheses concerned with negotiation outcome, it was necessary to generate a criterion for classifying each negotiation as successful or unsuccessful. Although any such categorization remains impressionistic and open to criticism, the criterion for unsuccessful inci-dents was that law enforcement officials were forced to employ some form of tacti-cal intervention (see also Holmes, 1991). It is important to emphasize that this cri-
8 PREDICTION OF OUTCOME IN CRISIS NEGOTIATIONS
The International Journal of Conflict Management, Vol. 13, No. 1, 2002
terion focuses only on the effectiveness of negotiation as a strategy for concluding an incident, and not on whether the outcome itself was successful (i.e., tactical resolutions may also yield successful outcomes). This exclusion criterion, there-fore, possesses some validity because it only assumes that law enforcement opera-tions will seek a negotiated surrender prior to being forced to resort to any form of tactical intervention. This assumption is supported by previous research (Butler, Leitenberg, & Fuselier, 1993; Fuselier, 1988).
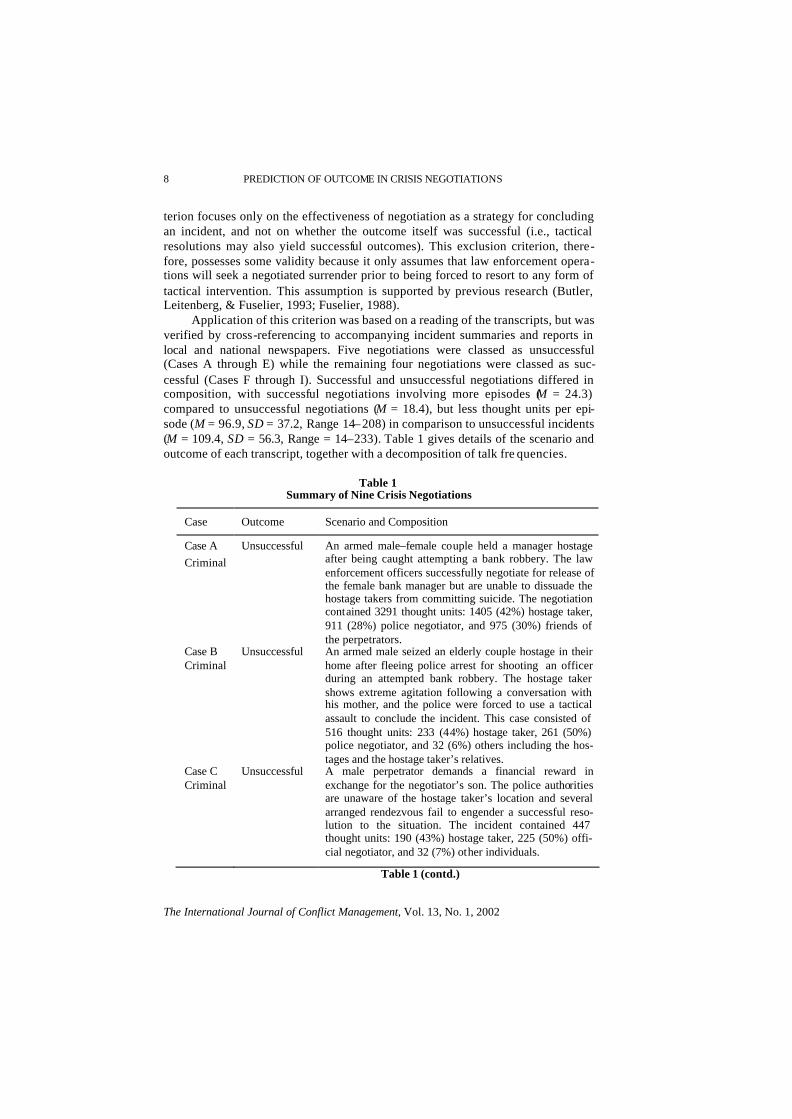
Application of this criterion was based on a reading of the transcripts, but was verified by cross-referencing to accompanying incident summaries and reports in local and national newspapers. Five negotiations were classed as unsuccessful (Cases A through E) while the remaining four negotiations were classed as suc-cessful (Cases F through I). Successful and unsuccessful negotiations differed in composition, with successful negotiations involving more episodes (M = 24.3) compared to unsuccessful negotiations (M = 18.4), but less thought units per epi-sode (M = 96.9, SD = 37.2, Range 14– 208) in comparison to unsuccessful incidents (M = 109.4, SD = 56.3, Range = 14–233). Table 1 gives details of the scenario and outcome of each transcript, together with a decomposition of talk fre quencies.
Table 1 Summary of Nine Crisis Negotiations
Case Outcome Scenario and Composition
Case A Criminal
Unsuccessful An armed male–female couple held a manager hostage after being caught attempting a bank robbery. The law enforcement officers successfully negotiate for release of the female bank manager but are unable to dissuade the hostage takers from committing suicide. The negotiation contained 3291 thought units: 1405 (42%) hostage taker, 911 (28%) police negotiator, and 975 (30%) friends of the perpetrators.
Case B Criminal
Unsuccessful An armed male seized an elderly couple hostage in their home after fleeing police arrest for shooting an officer during an attempted bank robbery. The hostage taker shows extreme agitation following a conversation with his mother, and the police were forced to use a tactical assault to conclude the incident. This case consisted of 516 thought units: 233 (44%) hostage taker, 261 (50%) police negotiator, and 32 (6%) others including the hos-tages and the hostage taker’s relatives.
Case C Criminal
Unsuccessful A male perpetrator demands a financial reward in exchange for the negotiator’s son. The police authorities are unaware of the hostage taker’s location and several arranged rendezvous fail to engender a successful reso-lution to the situation. The incident contained 447 thought units: 190 (43%) hostage taker, 225 (50%) offi-cial negotiator, and 32 (7%) other individuals.
Table 1 (contd.)

P. J. TAYLOR 9
The International Journal of Conflict Management, Vol. 13, No. 1, 2002
Case D
Criminal
Unsuccessful An armed, emotionally unstable individual barricaded himself at home after shooting and critically injuring a family member. The interactions oscillate between the local senior negotiating officer and a second police offi-cer, who is a friend of the hostage taker, but neither is able to convince him to surrender. The transcription con-sisted of 5441 thought units: 2421 (44%) hostage taker, (49%) police officer, and 357 (7%) other individuals.
Case E Political
Unsuccessful An armed male–female couple hijacked a local bus to publicize a religious cult and commit suicide in accor-dance with prophecy. Although the interactions pro-gressed as negotiators promised television coverage in return for release of the hostages, subsequent interactions failed to dissuade the couple from committing suicide. The incident contained 336 thought units: 217 (64%) hostage taker, 47 (14%) police negotiator, and 72 (22%) other individuals.
Case F Criminal
Successful A single armed individual negotiating with two law enforcement officers after taking a female bank clerk hostage to mitigate an unsuccessful robbery. The police negotiators initially acted to secure the release of the female hostage, but when this proved unfruitful they refo-cused efforts on convincing the hostage taker to com-pletely surrender. The incident contained 1102 thought units: 437 (40%) hostage taker, 652 (59%) police nego-tiator, and 13 (1%) other individuals.
Case G Domestic
Successful A single male held his six-month old daughter hostage in an attempt to persuade the child’s mother to retry life as a family. The hostage taker releases the child to his mother and then shortly afterwards surrenders himself to police authorities. The negotiation contains 2261 thought units: 911 (40%) hostage taker, 889 (39%) police negotiator, and 461 (21%) hostage taker’s mother and girlfriend.
Case H Political
Successful A plane hijacking in which an unarmed male held two pilots hostage in order to speak with his girlfriend and get adequate help for drug rehabilitation. As the negotiations progressed, the hostage taker released one of the pilots in exchange for a conversation with his girlfriend, following which he surrendered to law enforcement authorities. The incident lasted for 1500 thought units: 667 (45%) hostage taker, 635 (42%) police negotiator, and 198 (13%) other individuals.
Case I Prison
Successful A prison incident in which inmates took hostage several guards to negotiate for improved living standards. The negotiation progresses slowly until a mutually trusted third-party formulated an agreement that persuaded the prisoners to return peacefully to their cells. The transcript reports 4508 thought units: 2142 (48%) hostage taker and 2366 (52%) police negotiator.
10 PREDICTION OF OUTCOME IN CRISIS NEGOTIATIONS
The International Journal of Conflict Management, Vol. 13, No. 1, 2002
Transcript Coding Procedure
The nine transcripts were subjected to a coding procedure that consisted of three sequential stages: a rhetorical structure analysis, unitization, and content coding.
Rhetorical Structure Analysis. A rhetorical structure analysis was used to divide the transcripts into episodes of dialogue so that analysis would capture some of the changing patterns of behavioral occurrences over time. Episodes were defined as non-overlapping segments of dialogue during which negotiators com-municated about a single, clearly distinguishable issue, without significant devia-tion (dialogue movement, Mann & Thompson, 1988) away from that issue. Each episode therefore consisted of a discrete constellation of communication behaviors that differed in their type and their degree of occurrence. By examining the behav-ioral make-up of each constellation, it is possible to identify the behaviors that characterize the various episodes of interaction and track changes in these behav-ioral emphases across the complete negotiation process. In the current interactions, dialogue movement often emerged at changes in the person or object of focus (e.g., “How’s the kid doing?”), or when the scope of interactions shifted between general discussion and specific issues (e.g., “Ok, let’s talk in detail about the car”). Simi-larly, a large amount of episode movement occurred following a break in contact between the parties, especially if a different negotiator or a third party initiated the subsequent interaction.
The rhetorical structure analysis identified 189 episodes across the 9 tran-scripts (M = 24.0, SD = 12.7, Range = 8–41), with a mean frequency of 103.0 thought units in each episode (SD = 47.8, Range = 14–233). Although variation in the number of units per episode may influence analysis by restricting the potential occurrences of behavior, it was considered important to include this factor because it reflects the natural variation in dialogue across the negotiations. Moreover, any attempt to equalize the content of each episode by using more precise divisions than nuclear spans would have reduced the number of behaviors occurring to an unacceptably low level. Indeed, parsing the negotiations into episodes is a useful alternative to the arbitrary time -based divisions used in previous research (e.g., Donohue & Roberto, 1996; Putnam et al., 1990), because it establishes boundaries at shifts in the substantive focus of an interaction. Episode partitions may also enhance the operational value of the analysis since significant changes in the focus of dialogue are likely to represent the only periods during which law enforcement officers have sufficient time to evaluate progress and tactics.
Reliability of the episode partitions was tested by an independent coder who was trained in rhetorical structure analysis through practice with unused materials. The coder applied rhetorical structure analysis to all nine transcripts and achieved a unitizing reliability of .07 (Guetzkow, 1950), indicating discordance in about 7% of the episodes. Of the episodes boundaries identified by the coder, 98% were matched in position to those in the original coding, suggesting that discordance was mainly due to disagreements about the number rather than the placement of boundaries. All disagreements were resolved through discussion and mutual agreement prior to partitioning into thought units.
P. J. TAYLOR 11
The International Journal of Conflict Management, Vol. 13, No. 1, 2002
Partitioning Into Thought Units. The 189 interaction segments were further divided into thought units (Gottman, 1979) to allow the coding of single communi-cation behaviors. At a conceptual level, a thought unit depicts a complete idea that an individual wishes to express, while in actual speech the unit occurs as an inde-pendent clause with a subject and an object (e.g., “Get your men away from there”). Coding at this level, therefore, comes closest to isolating single communi-cation acts and so minimizes the possibility of analysis overlooking smaller, but psychologically meaningful components of negotiators’ dialogue. The unitizing reliability was assessed by having a second independent coder parse a subset of 477 speaking turns into thought units. The coder agreed on the placement of 95% of the thought units, and achieved a unitizing reliability of .04 (Guetzkow, 1950), indicating that about 4% of the unitizing divisions were in error. All errors in unit-izing were addressed before the transcripts were coded.
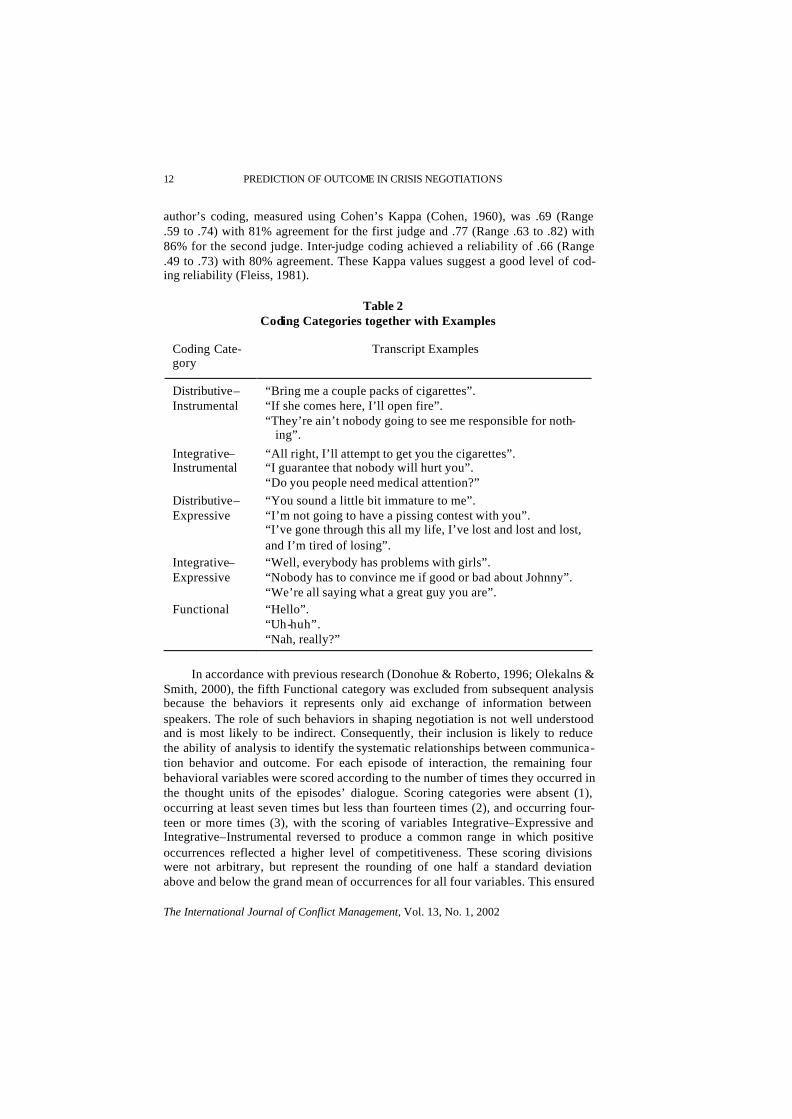
Coding of Communication Behaviors. The coding scheme consisted of four main categories that were formed by joining two widely accepted classifications of communication behavior from previous negotiation research (see Table 2). The objective of this coding scheme was not to provide an exhaustive categorization of behavioral strategies, but to capture well-defined differences that are known to both researchers and practitioners. The first distinction, central to a wide range of classification schemes, was between Integrative (cooperative) and Distributive (competitive) behavior (Donohue & Roberto, 1996; Weingart et al., 1999). This division is a particularly useful starting point for the current study because previous evidence has shown that these orientations form the opposite ends of a continuum running from cooperation to competition. In order to capture the different kinds of issues that emerge during a crisis negotiation, a second distinction was made between Instrumental and Expressive behaviors. Substantive (Instrumental) and emotional (Expressive) issues reflect two dominant motivational goals whose varying patterns of occurrences are likely to significantly affect the development of a negotiation (Hammer & Rogan, 1997; Miron & Goldstein, 1979). Since negotia-tors can potentially communicate about Instrumental and Expressive issues using both Integrative and Distributive approaches, these distinctions were combined to form four coding categories, namely, Distributive–Instrumental, Integrative–Instrumental, Distributive– Expressive and Integrative–Expressive. A fifth Func-tional category was also used during coding to capture those aspects of dialogue that contain no objective psychological information and act as the simple building blocks of interaction. The five behavioral categories together with examples are shown in Table 2.
The coding scheme was applied by the author to each thought unit within the 189 interaction episodes, as they occurred in the sequential flow of dialogue. In applying the scheme to the content of each thought unit, it was not necessary to apply categories exclusively (more than one category could be applied to each thought unit) since analysis intended to focus on relative differences in behavior. However, the restricted nature of the thought unit yielded a one-code to one-unit correspondence without exception. Reliability of the transcript coding was assessed by having two judges, experienced in content analysis but blind to the research hypotheses, independently code each thought unit in Case B. Agreement with the
12 PREDICTION OF OUTCOME IN CRISIS NEGOTIATIONS
The International Journal of Conflict Management, Vol. 13, No. 1, 2002
author’s coding, measured using Cohen’s Kappa (Cohen, 1960), was .69 (Range .59 to .74) with 81% agreement for the first judge and .77 (Range .63 to .82) with 86% for the second judge. Inter-judge coding achieved a reliability of .66 (Range .49 to .73) with 80% agreement. These Kappa values suggest a good level of cod-ing reliability (Fleiss, 1981).
Table 2 Coding Categories together with Examples
Coding Cate-gory
Transcript Examples
Distributive– Instrumental
“Bring me a couple packs of cigarettes”. “If she comes here, I’ll open fire”. “They’re ain’t nobody going to see me responsible for noth-
ing”.
Integrative– Instrumental
“All right, I’ll attempt to get you the cigarettes”. “I guarantee that nobody will hurt you”. “Do you people need medical attention?”
Distributive– Expressive
“You sound a little bit immature to me”. “I’m not going to have a pissing contest with you”. “I’ve gone through this all my life, I’ve lost and lost and lost, and I’m tired of losing”.
Integrative– Expressive
“Well, everybody has problems with girls”. “Nobody has to convince me if good or bad about Johnny”. “We’re all saying what a great guy you are”.
Functional “Hello”. “Uh-huh”. “Nah, really?”
In accordance with previous research (Donohue & Roberto, 1996; Olekalns & Smith, 2000), the fifth Functional category was excluded from subsequent analysis because the behaviors it represents only aid exchange of information between speakers. The role of such behaviors in shaping negotiation is not well understood and is most likely to be indirect. Consequently, their inclusion is likely to reduce the ability of analysis to identify the systematic relationships between communica-tion behavior and outcome. For each episode of interaction, the remaining four behavioral variables were scored according to the number of times they occurred in the thought units of the episodes’ dialogue. Scoring categories were absent (1), occurring at least seven times but less than fourteen times (2), and occurring four-teen or more times (3), with the scoring of variables Integrative–Expressive and Integrative–Instrumental reversed to produce a common range in which positive occurrences reflected a higher level of competitiveness. These scoring divisions were not arbitrary, but represent the rounding of one half a standard deviation above and below the grand mean of occurrences for all four variables. This ensured
P. J. TAYLOR 13
The International Journal of Conflict Management, Vol. 13, No. 1, 2002
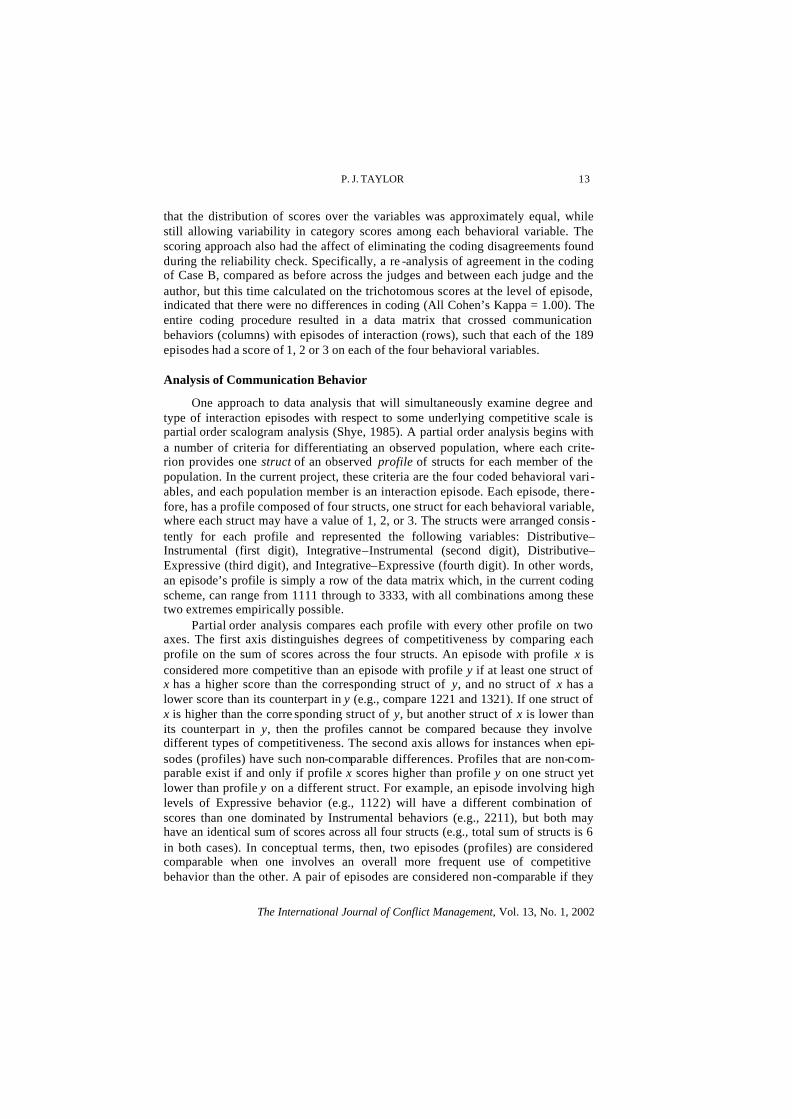
that the distribution of scores over the variables was approximately equal, while still allowing variability in category scores among each behavioral variable. The scoring approach also had the affect of eliminating the coding disagreements found during the reliability check. Specifically, a re -analysis of agreement in the coding of Case B, compared as before across the judges and between each judge and the author, but this time calculated on the trichotomous scores at the level of episode, indicated that there were no differences in coding (All Cohen’s Kappa = 1.00). The entire coding procedure resulted in a data matrix that crossed communication behaviors (columns) with episodes of interaction (rows), such that each of the 189 episodes had a score of 1, 2 or 3 on each of the four behavioral variables.
Analysis of Communication Behavior
One approach to data analysis that will simultaneously examine degree and type of interaction episodes with respect to some underlying competitive scale is partial order scalogram analysis (Shye, 1985). A partial order analysis begins with a number of criteria for differentiating an observed population, where each crite-rion provides one struct of an observed profile of structs for each member of the population. In the current project, these criteria are the four coded behavioral vari-ables, and each population member is an interaction episode. Each episode, there-fore, has a profile composed of four structs, one struct for each behavioral variable, where each struct may have a value of 1, 2, or 3. The structs were arranged consis -tently for each profile and represented the following variables: Distributive–Instrumental (first digit), Integrative–Instrumental (second digit), Distributive–Expressive (third digit), and Integrative–Expressive (fourth digit). In other words, an episode’s profile is simply a row of the data matrix which, in the current coding scheme, can range from 1111 through to 3333, with all combinations among these two extremes empirically possible.
Partial order analysis compares each profile with every other profile on two axes. The first axis distinguishes degrees of competitiveness by comparing each profile on the sum of scores across the four structs. An episode with profile x is considered more competitive than an episode with profile y if at least one struct of x has a higher score than the corresponding struct of y, and no struct of x has a lower score than its counterpart in y (e.g., compare 1221 and 1321). If one struct of x is higher than the corre sponding struct of y, but another struct of x is lower than its counterpart in y, then the profiles cannot be compared because they involve different types of competitiveness. The second axis allows for instances when epi-sodes (profiles) have such non-comparable differences. Profiles that are non-com-parable exist if and only if profile x scores higher than profile y on one struct yet lower than profile y on a different struct. For example, an episode involving high levels of Expressive behavior (e.g., 1122) will have a different combination of scores than one dominated by Instrumental behaviors (e.g., 2211), but both may have an identical sum of scores across all four structs (e.g., total sum of structs is 6 in both cases). In conceptual terms, then, two episodes (profiles) are considered comparable when one involves an overall more frequent use of competitive behavior than the other. A pair of episodes are considered non-comparable if they
14 PREDICTION OF OUTCOME IN CRISIS NEGOTIATIONS
The International Journal of Conflict Management, Vol. 13, No. 1, 2002
involve the same frequency of competitive behavior but differ in the extent this behavior addresses Expressive and Instrumental concerns.
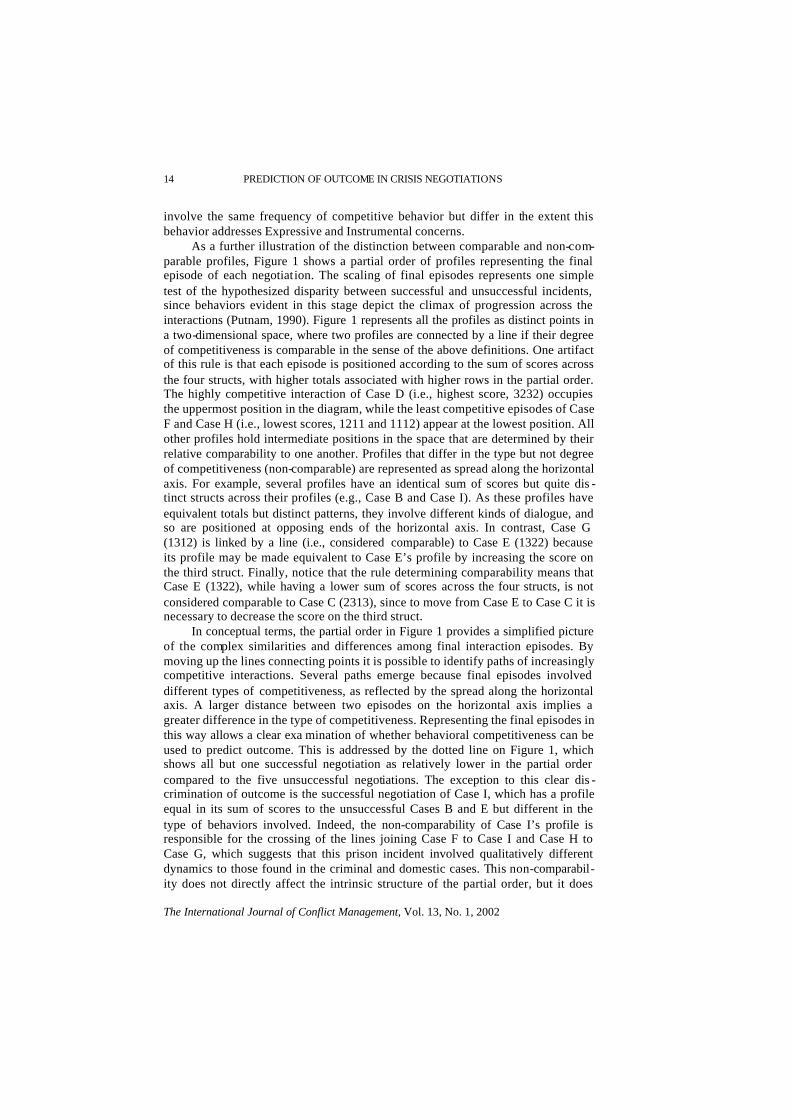
As a further illustration of the distinction between comparable and non-com-parable profiles, Figure 1 shows a partial order of profiles representing the final episode of each negotiation. The scaling of final episodes represents one simple test of the hypothesized disparity between successful and unsuccessful incidents, since behaviors evident in this stage depict the climax of progression across the interactions (Putnam, 1990). Figure 1 represents all the profiles as distinct points in a two-dimensional space, where two profiles are connected by a line if their degree of competitiveness is comparable in the sense of the above definitions. One artifact of this rule is that each episode is positioned according to the sum of scores across the four structs, with higher totals associated with higher rows in the partial order. The highly competitive interaction of Case D (i.e., highest score, 3232) occupies the uppermost position in the diagram, while the least competitive episodes of Case F and Case H (i.e., lowest scores, 1211 and 1112) appear at the lowest position. All other profiles hold intermediate positions in the space that are determined by their relative comparability to one another. Profiles that differ in the type but not degree of competitiveness (non-comparable) are represented as spread along the horizontal axis. For example, several profiles have an identical sum of scores but quite dis -tinct structs across their profiles (e.g., Case B and Case I). As these profiles have equivalent totals but distinct patterns, they involve different kinds of dialogue, and so are positioned at opposing ends of the horizontal axis. In contrast, Case G (1312) is linked by a line (i.e., considered comparable) to Case E (1322) because its profile may be made equivalent to Case E’s profile by increasing the score on the third struct. Finally, notice that the rule determining comparability means that Case E (1322), while having a lower sum of scores across the four structs, is not considered comparable to Case C (2313), since to move from Case E to Case C it is necessary to decrease the score on the third struct.
In conceptual terms, the partial order in Figure 1 provides a simplified picture of the complex similarities and differences among final interaction episodes. By moving up the lines connecting points it is possible to identify paths of increasingly competitive interactions. Several paths emerge because final episodes involved different types of competitiveness, as reflected by the spread along the horizontal axis. A larger distance between two episodes on the horizontal axis implies a greater difference in the type of competitiveness. Representing the final episodes in this way allows a clear exa mination of whether behavioral competitiveness can be used to predict outcome. This is addressed by the dotted line on Figure 1, which shows all but one successful negotiation as relatively lower in the partial order compared to the five unsuccessful negotiations. The exception to this clear dis -crimination of outcome is the successful negotiation of Case I, which has a profile equal in its sum of scores to the unsuccessful Cases B and E but different in the type of behaviors involved. Indeed, the non-comparability of Case I’s profile is responsible for the crossing of the lines joining Case F to Case I and Case H to Case G, which suggests that this prison incident involved qualitatively different dynamics to those found in the criminal and domestic cases. This non-comparabil-ity does not directly affect the intrinsic structure of the partial order, but it does

P. J. TAYLOR 15
The International Journal of Conflict Management, Vol. 13, No. 1, 2002
Figure 1 A Two-Dimensional Partial Order Diagram Showing Profiles of
Communication Behavior from the Final Episode of 9 Crisis Negotiations as a Function of Success
Degree of Communication Behavior (sum of structs)
10 Case D
(3232)
9
Case A (2331)
Case C (2313)
8
Case I (2222)
Case E (1322)
Case B (1313)
7
Case G (1312)
6
5
Case F (1211)
Case H (1112)
Type of Communication Behavior (pattern across structs)
Note: Cases underlined were the final episodes of unsuccessful negotiations. Each code includes a measure of Distributive–Instrumental (first digit), Integrative–Instrumental (second digit), Distributive–Expressive (third digit), and Integrative–Expressive (fourth digit) behavior. A score of 1 is low, 2 is medium, and 3 is high occurrence.
Unsuccessful Negotiations
Successful Negotiations
16 PREDICTION OF OUTCOME IN CRISIS NEGOTIATIONS
The International Journal of Conflict Management, Vol. 13, No. 1, 2002
substantiate examining timing as well as degree of occurrence of behavior to gain a clearer discrimination of outcome.
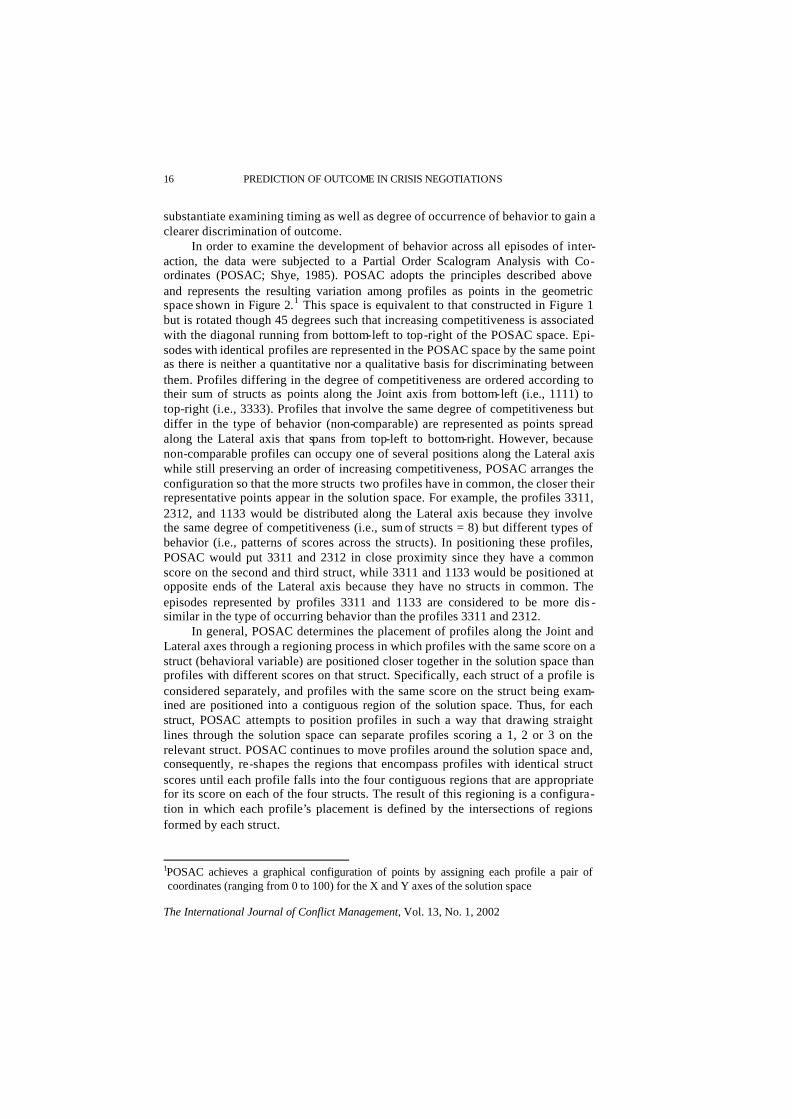
In order to examine the development of behavior across all episodes of inter-action, the data were subjected to a Partial Order Scalogram Analysis with Co-ordinates (POSAC; Shye, 1985). POSAC adopts the principles described above and represents the resulting variation among profiles as points in the geometric space shown in Figure 2.1 This space is equivalent to that constructed in Figure 1 but is rotated though 45 degrees such that increasing competitiveness is associated with the diagonal running from bottom-left to top-right of the POSAC space. Epi-sodes with identical profiles are represented in the POSAC space by the same point as there is neither a quantitative nor a qualitative basis for discriminating between them. Profiles differing in the degree of competitiveness are ordered according to their sum of structs as points along the Joint axis from bottom-left (i.e., 1111) to top-right (i.e., 3333). Profiles that involve the same degree of competitiveness but differ in the type of behavior (non-comparable) are represented as points spread along the Lateral axis that spans from top-left to bottom-right. However, because non-comparable profiles can occupy one of several positions along the Lateral axis while still preserving an order of increasing competitiveness, POSAC arranges the configuration so that the more structs two profiles have in common, the closer their representative points appear in the solution space. For example, the profiles 3311, 2312, and 1133 would be distributed along the Lateral axis because they involve the same degree of competitiveness (i.e., sum of structs = 8) but different types of behavior (i.e., patterns of scores across the structs). In positioning these profiles, POSAC would put 3311 and 2312 in close proximity since they have a common score on the second and third struct, while 3311 and 1133 would be positioned at opposite ends of the Lateral axis because they have no structs in common. The episodes represented by profiles 3311 and 1133 are considered to be more dis -similar in the type of occurring behavior than the profiles 3311 and 2312.
In general, POSAC determines the placement of profiles along the Joint and Lateral axes through a regioning process in which profiles with the same score on a struct (behavioral variable) are positioned closer together in the solution space than profiles with different scores on that struct. Specifically, each struct of a profile is considered separately, and profiles with the same score on the struct being exam-ined are positioned into a contiguous region of the solution space. Thus, for each struct, POSAC attempts to position profiles in such a way that drawing straight lines through the solution space can separate profiles scoring a 1, 2 or 3 on the relevant struct. POSAC continues to move profiles around the solution space and, consequently, re-shapes the regions that encompass profiles with identical struct scores until each profile falls into the four contiguous regions that are appropriate for its score on each of the four structs. The result of this regioning is a configura-tion in which each profile’s placement is defined by the intersections of regions formed by each struct.
1POSAC achieves a graphical configuration of points by assigning each profile a pair of coordinates (ranging from 0 to 100) for the X and Y axes of the solution space
P. J. TAYLOR 17
The International Journal of Conflict Management, Vol. 13, No. 1, 2002
Figure 2 The positioning of Joint and Lateral Axes in POSAC
As the shape of the regions’ encompassing scores on one struct are dependent on the scores that occur on the remaining structs, the relationship between regions created by one struct and regions formed by another struct may be examined to understand the role of each behavior in shaping the variations among profiles. For example, some structs may generate regions whose boundaries form parallel divi-sions across the solution space. Since movement across the regions formed by one of these structs is related to movement across the regions formed by the second struct, these structs (behaviors) play a similar role in differentiating the interactions (i.e., are collinear). Other behavioral variables may create regions that are perpen-dicular to one another. In this case, movement across the regions of one struct may be achieved without moving across a region of the second struct, implying that these aspects of dialogue play very different roles in shaping the similarities and differences among episodes. POSAC enables the role of each behavior to be sys-tematically assessed by providing a set of identical geometric plots, one for each struct, in which the profiles are labeled with their score (i.e., 1, 2, or 3) on the struct being examined. These item plots may be examined for contiguous regions of scores, a process that is facilitated by POSAC providing a set of partitioning load-ing coefficients. These coefficients range between 0.00 and 1.00, with a score of 1.00 indicating that all episodes with a particular struct score may be partitioned into a region of the solution space without exception. In general, a coefficient above .80 is regarded as indicating that scores on a particular struct vary systemati-cally across the partial order and that, as a result, the configuration of regions for that struct is likely to be unique and meaningful (Shye, 1985).
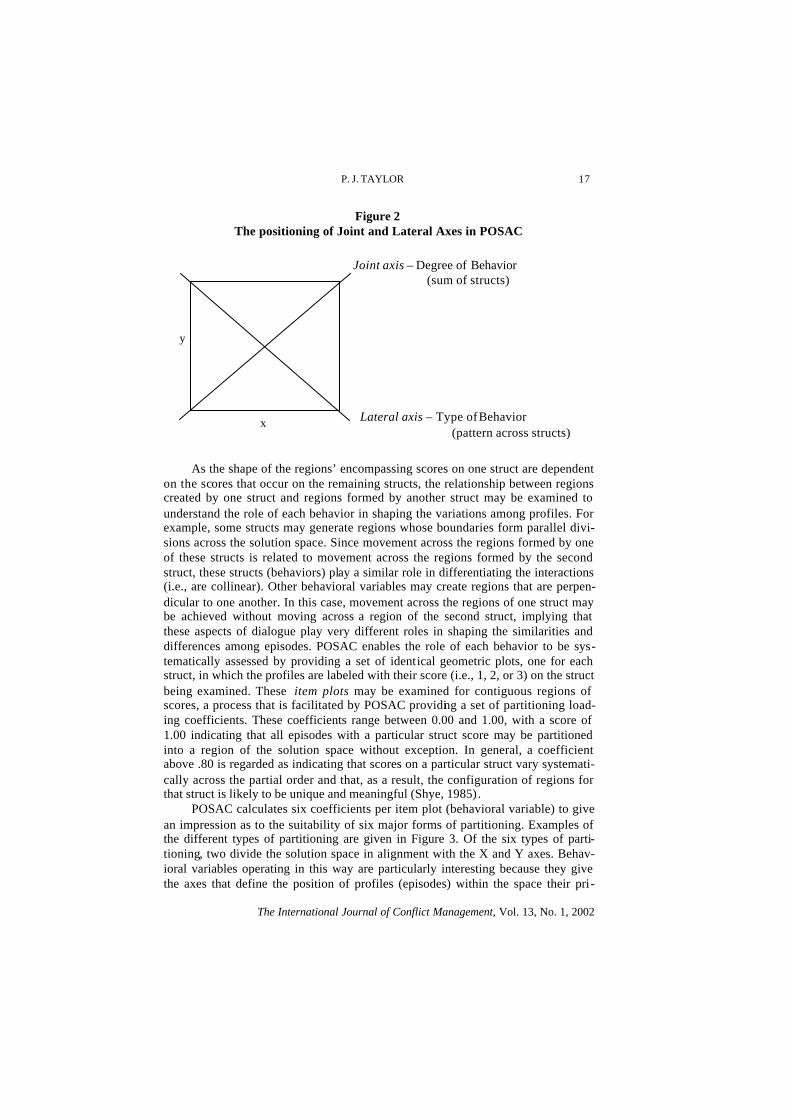
POSAC calculates six coefficients per item plot (behavioral variable) to give an impression as to the suitability of six major forms of partitioning. Examples of the different types of partitioning are given in Figure 3. Of the six types of parti-tioning, two divide the solution space in alignment with the X and Y axes. Behav-ioral variables operating in this way are particularly interesting because they give the axes that define the position of profiles (episodes) within the space their pri-
Joint axis – Degree of Behavior (sum of structs)
Lateral axis – Type of Behavior (pattern across structs)
x
y
18 PREDICTION OF OUTCOME IN CRISIS NEGOTIATIONS
The International Journal of Conflict Management, Vol. 13, No. 1, 2002
mary meaning. These behavioral variables are therefore the two basic types of competitiveness that shape the differences among interaction episodes. A further two types of division align themselves with the diagonal axes, either forming regions along the competitive scale (J) or along the qualitative axis (L). Behavioral variables dividing the space along the Joint axis relate exclusively to the degree of competitiveness in interactions, such that changes in the occurrence of this behav-ior will be matched by correspond ing changes in the degree of competition. Behaviors aligned with the Lateral axis influence only the type of competitiveness involved and so influence only the concern or issue that is the focus of interaction. Finally, a struct may also adopt one of two secondary roles in partitioning the POSAC space, either accentuating (Q) or attenuating (P) the possibilities to dis -criminate between points that are high on X or Y. Behavioral variables that accentuate the space increase the amount of qualitative variation in episodes at higher points on the scale, while attenuating variables increase the homogeneity of interactions such that profiles high on X will also be high on Y. The interpretation of POSAC output is illustrated further in the Results section, but for additional explanation and examples see Borg and Shye (1995), Dancer (1990), Porter and Alison (2001), and Shye (1985).
Figure 3 Illustrations of the Six Major Types of Regions Formed by
Variables (structs) in POSAC.
Benefits of POSAC. Although the question of predicting outcome in the cur-rent data may be addressed through a number of methodologies, POSAC’s treat-ment of the data offers a complementary alternative that has some attractive fea-tures. First, POSAC is one of the few techniques available that allows researchers to address the problem of discriminating outcome from behavior. The question POSAC asks is: Suppose an episode has a known behavioral content but the out-
X
1 2 3
J
3 2
1
Q
3
2 1
Y
3 2 1
L
1 2
3
P
3
2 1

P. J. TAYLOR 19
The International Journal of Conflict Management, Vol. 13, No. 1, 2002
come is unknown, what outcome should the episode be assigned, with minimal expected error? This question is actually the reverse of that tackled by traditional techniques such as analysis of variance (ANOVA), which ask: Suppose the out-come of an episode is known but the frequencies of occurrence of its constituent behaviors are unknown, what are the best predicted values of occurrence for these behaviors? Unfortunately, insights into the problem of prediction are not generally forthcoming from studies analyzing variance, since these works have typically relied on classical statistical measures (e.g., F, t, and ?) that give no indication of the efficacy of discriminating outcome. Perfect discrimination of outcome can hold no matter what the size of these statistics (e.g., F, t and ? can approach unity, see Guttman, 1988).
A second difference is that POSAC looks for regularities in the data without making any simplifying mathematical assumptions (e.g., linearity), since it com-pares observations through inherent variations in composition rather than indirectly using some extrinsic probability framework. By staying close to the original multi-variate structure of the data, POSAC avoids omitting features of the data that may be of theoretical importance or may reduce the explanatory power of any predictive model. Moreover, by not making any extrinsic assumptions of the data (e.g., nor-mality of distribution) POSAC can access the many types of real-world data that interest conflict scholars but remain elusive because they violate traditional assumptions. Finally, rather than treat variables directly as the object of study, POSAC offers a different scientific imagery that views observations as representa-tives of a domain space shaped by constructs in different ways. By focusing on regional differences within a content space, it is possible to gain an understanding of the “quality” or type of interrelationships among predictors that is not possible from a set of significance probabilities. More generally, comparing the mutual ori-entation of regions within the space can enable systematic comparisons of concepts or theories that are difficult to operationalize and test in quantitative terms. This imagery and the associated clarity brought by examining regions of the space have proven a fruitful basis for cumulative research in other areas of social science (e.g., Dancer, 1990).
Results
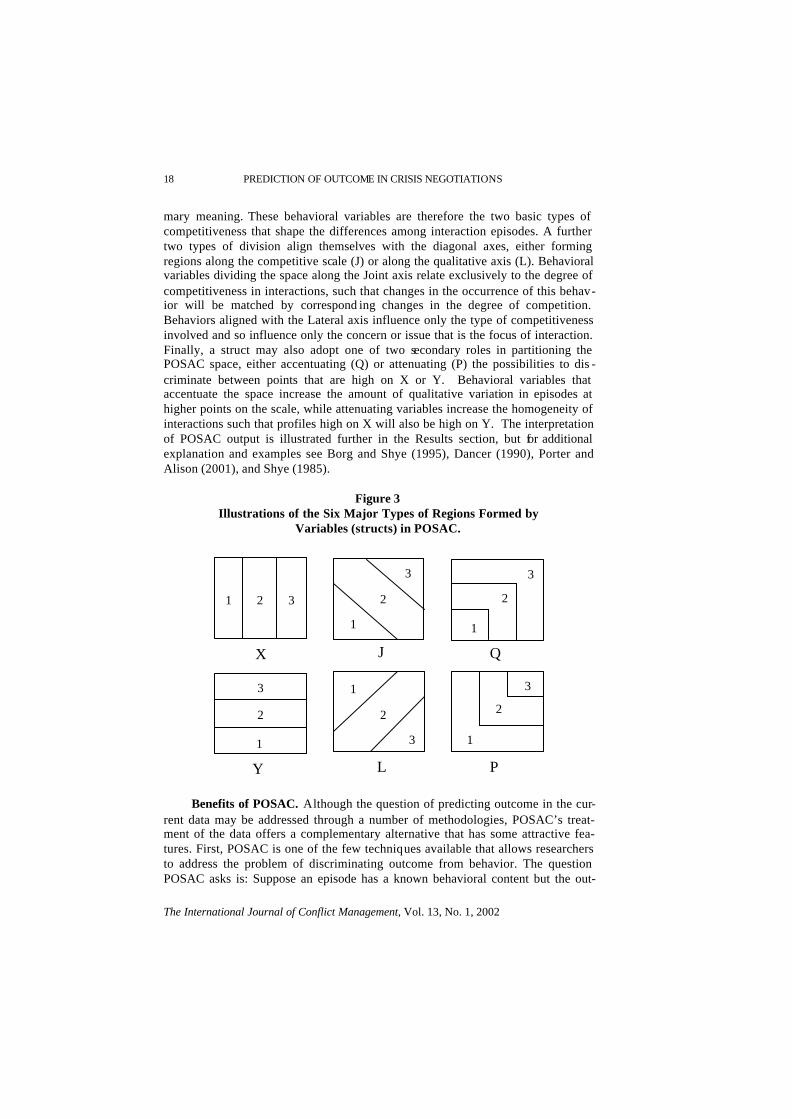
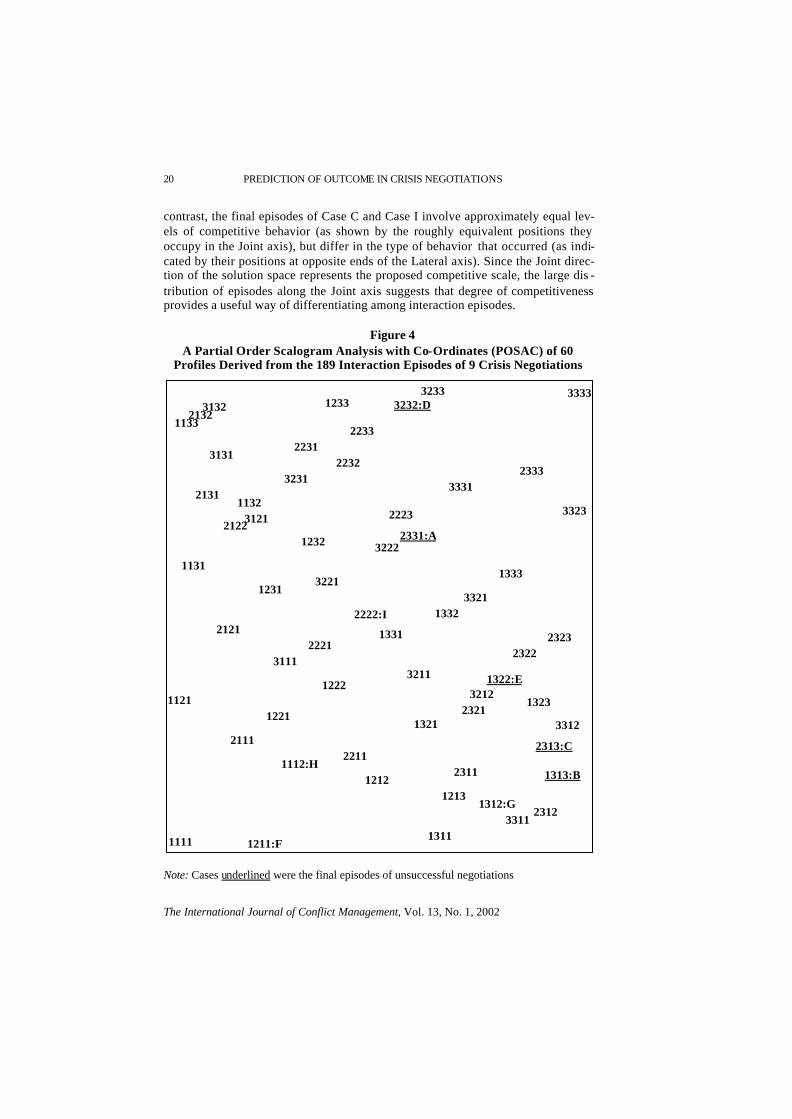
The 189 interaction episodes were represented by 60 distinct profiles (out of a possible 3 x 3 x 3 x 3 = 81). A two-dimensional solution represented these profiles with a coefficient of correct representation (CORREP) of .832, indicating that approximately 92% of profiles are placed in the correct regions of the configura-tion. Figure 4 shows a projection of the derived configuration in which each profile is denoted by its structs, and profiles suffixe d by a letter are the final episode of the case with the corresponding letter in Table 1. An initial examination of the partially ordered structure revealed a substantial amount of quantitative and qualitative spread in negotiation behavior, as shown by the even spatial distribution of points across the configuration. For example, the final episode of interaction for Case D is located towards the top-right corner of the space as profile 3232, and concludes with a higher degree of competitive behavior relative to the other negotiations. In
20 PREDICTION OF OUTCOME IN CRISIS NEGOTIATIONS
The International Journal of Conflict Management, Vol. 13, No. 1, 2002
contrast, the final episodes of Case C and Case I involve approximately equal lev-els of competitive behavior (as shown by the roughly equivalent positions they occupy in the Joint axis), but differ in the type of behavior that occurred (as indi-cated by their positions at opposite ends of the Lateral axis). Since the Joint direc-tion of the solution space represents the proposed competitive scale, the large dis -tribution of episodes along the Joint axis suggests that degree of competitiveness provides a useful way of differentiating among interaction episodes.
Figure 4 A Partial Order Scalogram Analysis with Co-Ordinates (POSAC) of 60
Profiles Derived from the 189 Interaction Episodes of 9 Crisis Negotiations
Note: Cases underlined were the final episodes of unsuccessful negotiations
3333
3323
2333
3233
2323
2233
1333
3232:D
3331
2331:A
2223
3321
3312
1313:B
1323
1332
2322
2232
3132
3222
1233
3231
3212
3311
1331
2321
2312
1322:E
2313:C
3131
1133
2231
2222:I
1232
3221
2132
2221
1312:G
3121
21311132
2311
2122
1222
1321
1213
3211
1231
1221
1131
3111
1311
2121
1212
2211
1211:F
1112:H
1121
2111
1111
P. J. TAYLOR 21
The International Journal of Conflict Management, Vol. 13, No. 1, 2002
Behavioral Structure of the Competitive Scale
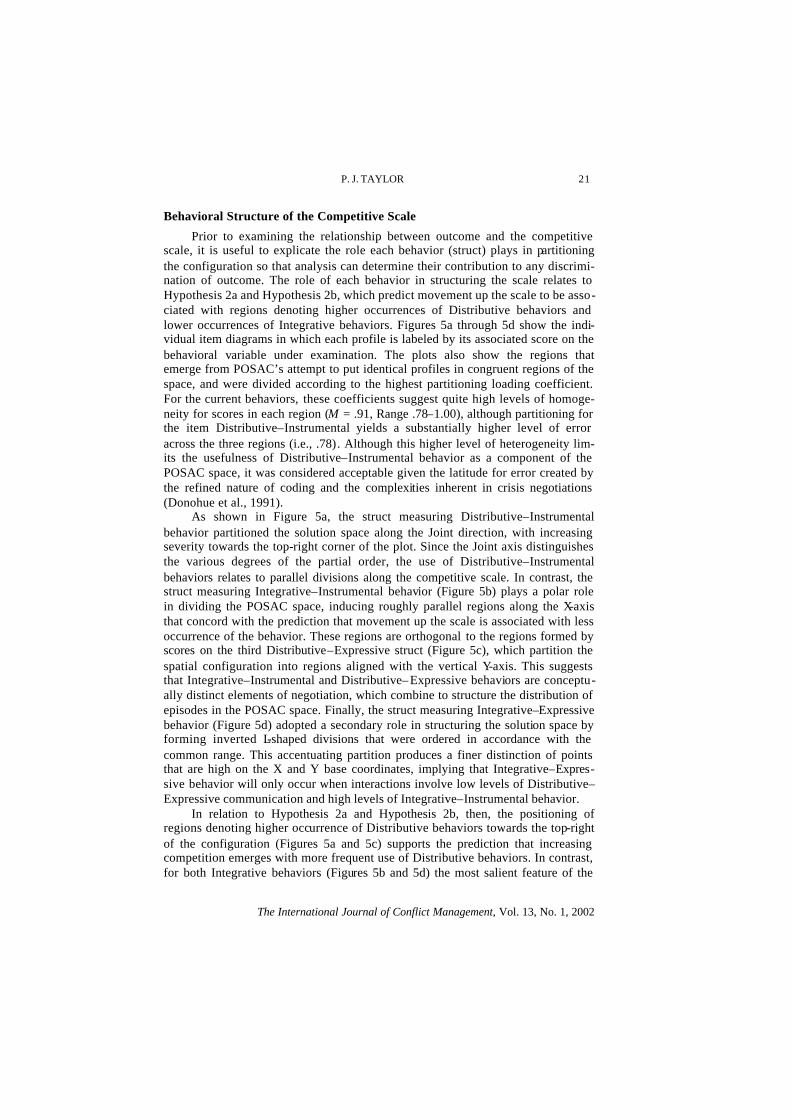
Prior to examining the relationship between outcome and the competitive scale, it is useful to explicate the role each behavior (struct) plays in partitioning the configuration so that analysis can determine their contribution to any discrimi-nation of outcome. The role of each behavior in structuring the scale relates to Hypothesis 2a and Hypothesis 2b, which predict movement up the scale to be asso-ciated with regions denoting higher occurrences of Distributive behaviors and lower occurrences of Integrative behaviors. Figures 5a through 5d show the indi-vidual item diagrams in which each profile is labeled by its associated score on the behavioral variable under examination. The plots also show the regions that emerge from POSAC’s attempt to put identical profiles in congruent regions of the space, and were divided according to the highest partitioning loading coefficient. For the current behaviors, these coefficients suggest quite high levels of homoge-neity for scores in each region (M = .91, Range .78–1.00), although partitioning for the item Distributive–Instrumental yields a substantially higher level of error across the three regions (i.e., .78). Although this higher level of heterogeneity lim-its the usefulness of Distributive–Instrumental behavior as a component of the POSAC space, it was considered acceptable given the latitude for error created by the refined nature of coding and the complexities inherent in crisis negotiations (Donohue et al., 1991).
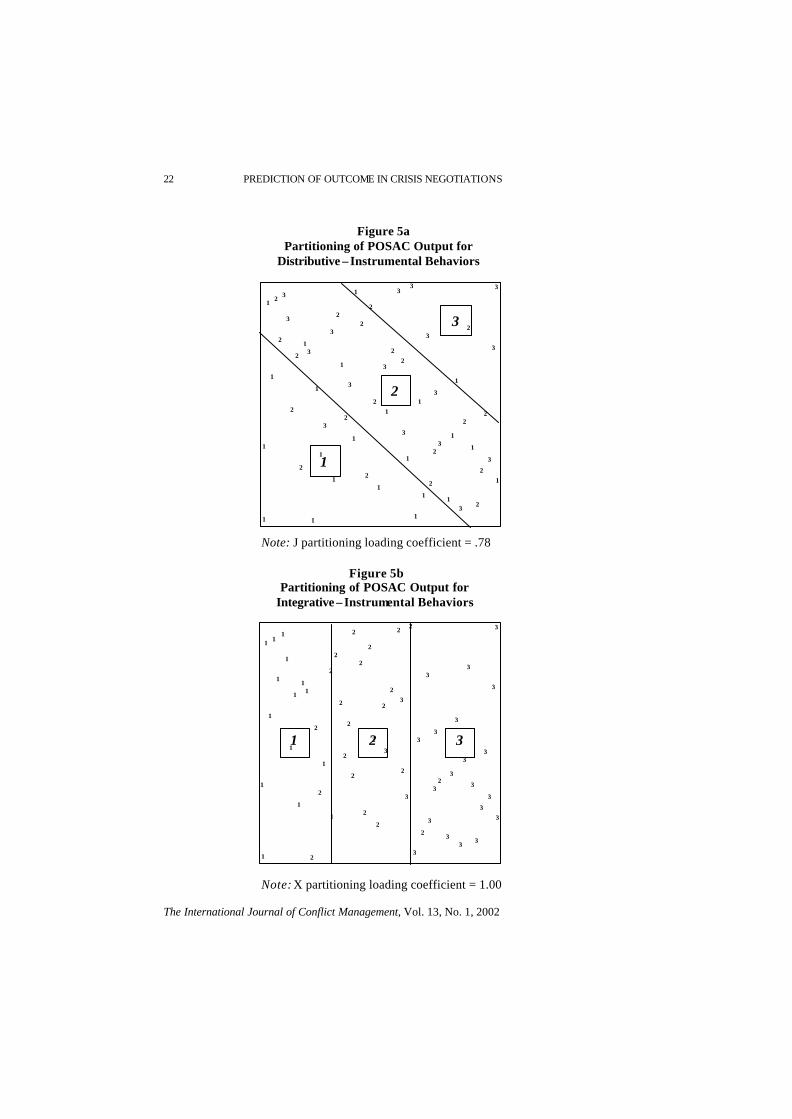
As shown in Figure 5a, the struct measuring Distributive–Instrumental behavior partitioned the solution space along the Joint direction, with increasing severity towards the top-right corner of the plot. Since the Joint axis distinguishes the various degrees of the partial order, the use of Distributive–Instrumental behaviors relates to parallel divisions along the competitive scale. In contrast, the struct measuring Integrative–Instrumental behavior (Figure 5b) plays a polar role in dividing the POSAC space, inducing roughly parallel regions along the X-axis that concord with the prediction that movement up the scale is associated with less occurrence of the behavior. These regions are orthogonal to the regions formed by scores on the third Distributive–Expressive struct (Figure 5c), which partition the spatial configuration into regions aligned with the vertical Y-axis. This suggests that Integrative–Instrumental and Distributive– Expressive behaviors are conceptu-ally distinct elements of negotiation, which combine to structure the distribution of episodes in the POSAC space. Finally, the struct measuring Integrative–Expressive behavior (Figure 5d) adopted a secondary role in structuring the solution space by forming inverted L-shaped divisions that were ordered in accordance with the common range. This accentuating partition produces a finer distinction of points that are high on the X and Y base coordinates, implying that Integrative–Expres-sive behavior will only occur when interactions involve low levels of Distributive–Expressive communication and high levels of Integrative–Instrumental behavior.
In relation to Hypothesis 2a and Hypothesis 2b, then, the positioning of regions denoting higher occurrence of Distributive behaviors towards the top-right of the configuration (Figures 5a and 5c) supports the prediction that increasing competition emerges with more frequent use of Distributive behaviors. In contrast, for both Integrative behaviors (Figures 5b and 5d) the most salient feature of the
22 PREDICTION OF OUTCOME IN CRISIS NEGOTIATIONS
The International Journal of Conflict Management, Vol. 13, No. 1, 2002
Figure 5a
Partitioning of POSAC Output for Distributive – Instrumental Behaviors
Note: J partitioning loading coefficient = .78
Figure 5b Partitioning of POSAC Output for
Integrative – Instrumental Behaviors
Note: X partitioning loading coefficient = 1.00
3
3
2
3
2
2
1
3
3
22
3
3
1
1
1
2
2
3
3
1
3
3
3
1
2
2
1
2
3
1
2
2
1
3
2
2
1
3
2 1
2
2
1
1
1
3
1
1
1
3
1
2
1
2
1
1
1
2
1
1
2
3
3
3
3
2
3
2
3
2
3
32
3
3
3
3
3
3
2
1
2
2
2
2
3
3
3
3
3
3
1
1
2
2
2
2
1
2
3
1
1 1
3
1
2
3
2
2
2
2
1
1
3
1
2
2
2
1
1
1
1
1 2 3

P. J. TAYLOR 23
The International Journal of Conflict Management, Vol. 13, No. 1, 2002
Figure 5c Partitioning of POSAC Output for Distributive –Expressive Behaviors
Note: Y partitioning loading coefficient = .99
Figure 5d Partitioning of POSAC Output for Integrative –Expressive Behaviors
Note: Q partitioning loading coefficient = .86
3
3
3
3
3
3
3
2
1
13
1
2
3
3
2
2
2
2
2
3
1
2
1
1
1
2
2
3
1
3
1
2
2
1
2
1
2
1
1 2
1
2
2
1
3
1
1
1
1
1
1
1
2
1
1
2
1
1
1
1
2
3
3
2
3
3
2
3
3
3
3
3
2
2
1
1
2
3
2
3
3
2
3
3
1
1
3
2
1
2
1
3
3
3
2
3
2
3
2
1
2
3 3
1
2
2
2
1
1
3
2
3
1
1
2
1
1
1
1
2
1
1
3
2
1

24 PREDICTION OF OUTCOME IN CRISIS NEGOTIATIONS
The International Journal of Conflict Management, Vol. 13, No. 1, 2002
structural partitioning is the reversed common order, with higher occurrences of behavior positioned towards the bottom-left of the solution space. The opposite direction of these occurrences supports the hypothesized conceptualization of Inte-grative and Distributive behavior as the antipodal points of a single partially ordered scale.
Discriminating Successful and Unsuccessful Negotiations If the competitive scale is useful for outcome prognosis, then the majority of
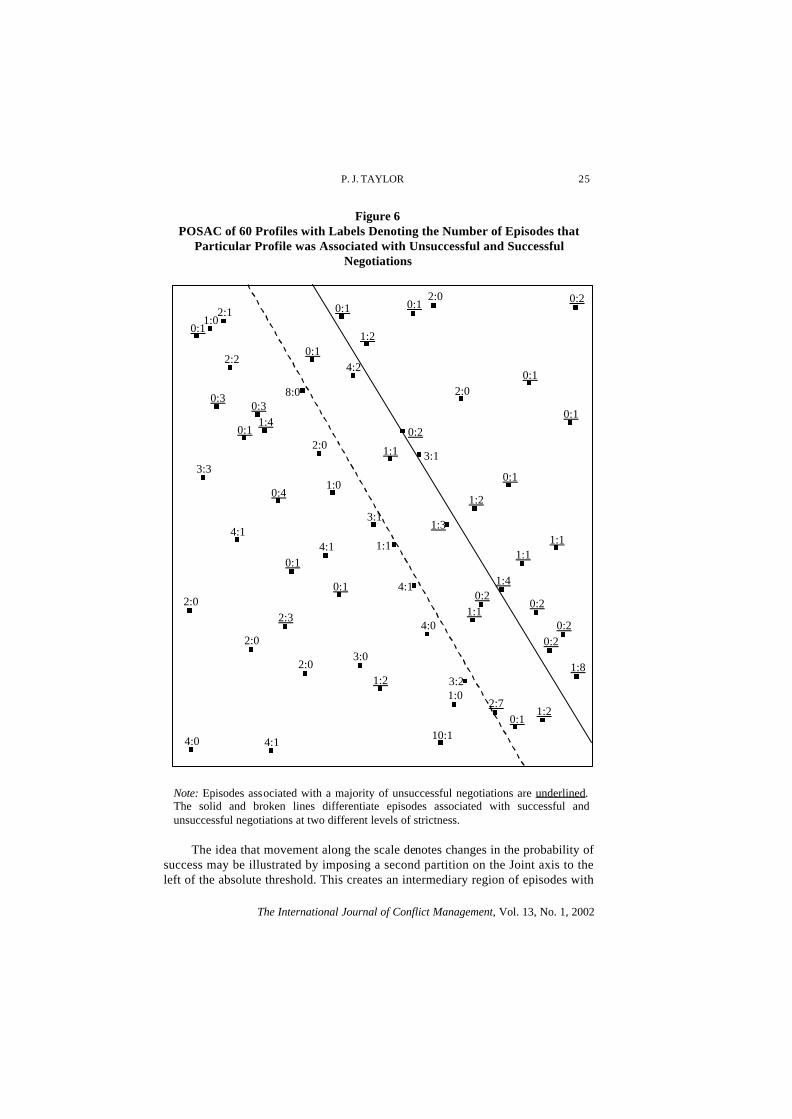
episodes associated with unsuccessful negotiations should be situated towards the top-right of the configuration (i.e., higher on the scale) in comparison to episodes from successful negotiations (Hypothesis 1). To examine this prediction, Figure 6 shows the same POSAC configuration in which each profiles is labeled according to the number of success and non-success related episodes it represents. A profile is underlined if the majority of these episodes are associated with unsuccessful incidents. An examination of the partially ordered structure indicated that the final episodes of unsuccessful incidents formed a region quite distinct from that occu-pied by concluding episodes of successful incidents. These regions are divided by a solid line on Figure 6. The differentiation between the two groups is so distinct that the region that encapsulated the concluding episodes of unsuccessful incidents contained only 13 incorrect predictions (6.9% of total episodes), isolated episodes from negotiations that ended successfully. Thus, an episode involving behavior whose profile is located to the right of the discriminating level would be prognosed as almost certainly ending unsuccessfully, even when subsequent interactions fall below this critical threshold.
Although the division could have appeared in any direction of the POSAC space, its approximately perpendicular relation to the Joint axis indicates that a threshold on the competitive scale provides an almost perfect function for the prognosis of outcome. A corollary of this finding is that the best discrimination is given by the linear sum of the X and Y coordinates, since these coordinates define where an episode is placed on the Joint axis . In other words, the relationship between outcome and the partial order is through the Joint direction of the POSAC space, which is essentially a refinement of the sum frequency of occurrence of the two behaviors that divide the X and Y axis: Distributive–Expressive and Integra-tive–Instrumental. The sum of these two base coordinates produces a Joint score (which ranges from 0 to 200), according to which a final episode of interaction scoring over 98.31 is associated with an unsuccessful negotiation.
Furthermore, because in the current case the partition between successful and unsuccessful episodes runs perpendicular to the Joint axis, the rank sum of scores across the structs gives the same ranking as the Joint score. This means that the sum of scores across the structs of a profile turns out to give an equally good dis -crimination of negotiation outcome as the Joint score. In the current project, a final episode whose sum of scores across the structs is equal to or greater than 8 (12 is the highest score according to the present classification) will end in failure, regardless of the position of these scores in the profile. In other words, the progno-sis of outcome relates directly to the degree of competitiveness in interaction and is not particularly influenced by the kind of behavior that occurs.
P. J. TAYLOR 25
The International Journal of Conflict Management, Vol. 13, No. 1, 2002
Figure 6 POSAC of 60 Profiles with Labels Denoting the Number of Episodes that
Particular Profile was Associated with Unsuccessful and Successful Negotiations
Note: Episodes associated with a majority of unsuccessful negotiations are underlined. The solid and broken lines differentiate episodes associated with successful and unsuccessful negotiations at two different levels of strictness.
The idea that movement along the scale denotes changes in the probability of success may be illustrated by imposing a second partition on the Joint axis to the left of the absolute threshold. This creates an intermediary region of episodes with
0:2
0:1
0:1
2:0
1:1
1:2
0:1
0:1
2:0
3:1
0:2
1:2
0:2
1:8
0:2
1:3
1:1
4:2
2:1
1:1
0:1
8:0
0:2
0:1
1:1
1:1
1:2
1:4
0:2
2:2
0:1
0:1
3:1
2:0
1:0
1:0
4:1
2:7
1:4
0:30:3
3:2
0:1
0:1
4:0
1:0
4:1
0:4
2:3
3:3
0:1
10:1
4:1
1:2
3:0
4:1
2:0
2:0
2:0
4:0
26 PREDICTION OF OUTCOME IN CRISIS NEGOTIATIONS
The International Journal of Conflict Management, Vol. 13, No. 1, 2002
a high probability of ending unsuccessfully. For instance, the broken line overlaid in Figure 6 produces a region containing 54 (59%) of the interactions relating to unsuccessful negotiations while only incorrectly partitioning 23 (24%) of the suc-cess-related interactions. This leaves only 41% of unsuccess ful episodes, but over 76% of successful episodes in the broad lower region. More generally, the prob-ability of encompassing episodes related to successful negotiations within a region increases with perpendicular movement down the Joint axis. This can be shown by calculating odds ratios for the various thresholds along the scale. For example, epi-sodes falling above the solid line are 2.62 times more likely to be associated with unsuccessful rather than successful negotiations. In contrast, episodes falling between the solid line and the broken line are 2.00 times more likely to be unsuc-cessful, while episodes falling below the broken line are 1.95 times more likely to end in success.
Longitudinal Trend along the Distributive Partial-Order The possibility of a refined discrimination illustrates the potential for identi-
fying the hypothesized long-term trends in negotiators’ behavior across the epi-sodes. In order to examine movement along the scale as a negotiation unfolds, the Joint score of episodes from each case were analyzed as a function of time. The development was modeled by fitting successive trend lines (polytonic curves) until reaching an acceptable approximation of the change in the degree of competitive-ness over the negotiation. Although the number of curve intervals required to ade-quately capture the developments over time is of interest, a test of the hypotheses is given by the slope of the final interval of the fitted curve. A positive or negative trend in the Joint score at this stage denotes increasing competitive or cooperative behavior respectively, and so allows a test of whether this global aspect of behavior can differentiate outcome (Hypothesis 3a and Hypothesis 3b).
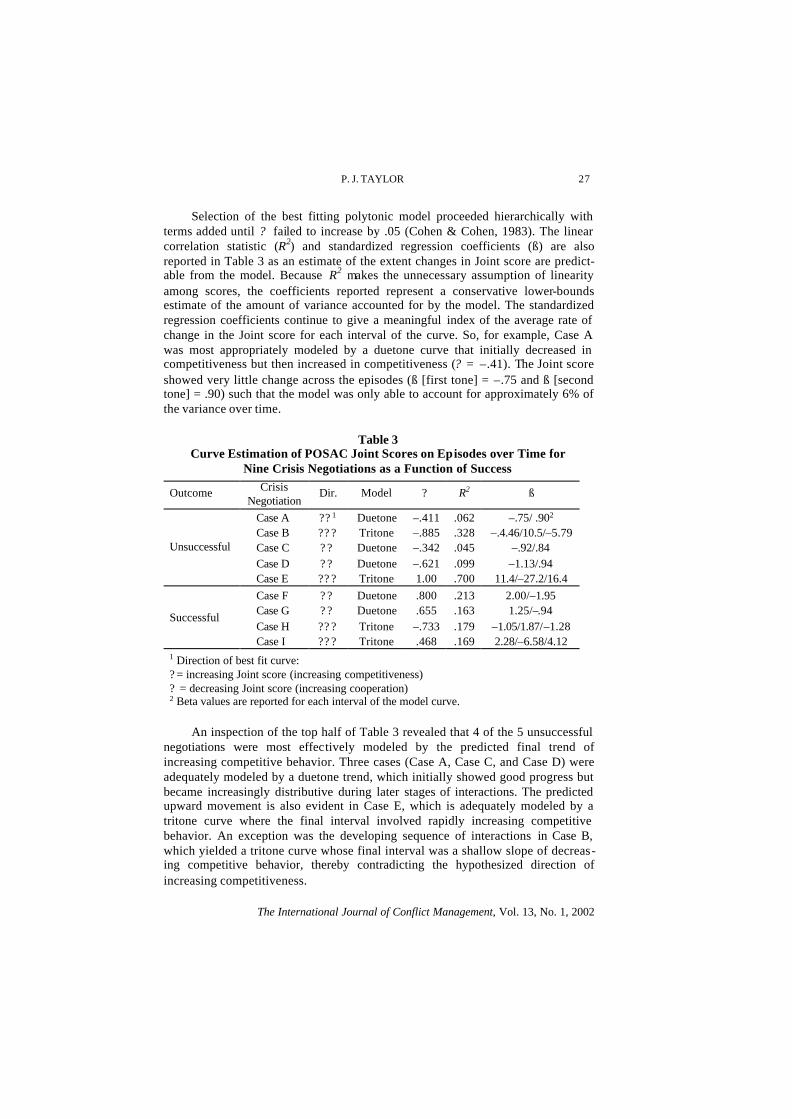
For each case, Table 3 gives the coefficient of weak polytonicity (? , Gutt-man, 1986) for the best fitting model of change in Joint score. The polytonicity coefficient indicates the extent to which change in a sequence of numbers (e.g., Joint scores) has an upward or downward trend that corresponds with the model under consideration. The polytonicity coefficient is actually a generalization of the Pearson’s correlation coefficient that considers only inequalities across scores and is not restricted to considering linear (quantitatively equivalent) changes over time. The coefficient, therefore, considers the extent to which data have increasing and decreasing trends or “tones” over time, where the number of tones denotes the number of allowed changes in direction. For example, a monotone trend measures the extent to which the Joint score increases (or decreases) over time, while a due-tone trend has two intervals, and so measures the extent changes follow a “U” (? ? ) or “inverted U” (?? ) pattern over time. The polytonicity coefficient ranges from –1.00 to 1.00, where unity represents a perfect fit between the data and the consid-ered model, and the sign of the coefficient indicates whether the initial trend is positive or negative. This more general notion of trend aligns itself nicely with the hypothesized changes in competitiveness over time (Hypothesis 3a and Hypothesis 3b) without imposing the extrinsic, unnecessary assumption that change from epi-sode to episode is constant.
P. J. TAYLOR 27
The International Journal of Conflict Management, Vol. 13, No. 1, 2002
Selection of the best fitting polytonic model proceeded hierarchically with terms added until ? failed to increase by .05 (Cohen & Cohen, 1983). The linear correlation statistic (R2) and standardized regression coefficients (ß) are also reported in Table 3 as an estimate of the extent changes in Joint score are predict-able from the model. Because R2 makes the unnecessary assumption of linearity among scores, the coefficients reported represent a conservative lower-bounds estimate of the amount of variance accounted for by the model. The standardized regression coefficients continue to give a meaningful index of the average rate of change in the Joint score for each interval of the curve. So, for example, Case A was most appropriately modeled by a duetone curve that initially decreased in competitiveness but then increased in competitiveness (? = –.41). The Joint score showed very little change across the episodes (ß [first tone] = –.75 and ß [second tone] = .90) such that the model was only able to account for approximately 6% of the variance over time.
Table 3 Curve Estimation of POSAC Joint Scores on Episodes over Time for
Nine Crisis Negotiations as a Function of Success
Outcome Crisis Negotiation
Dir. Model ? R2 ß
Case A ?? 1 Duetone –.411 .062 –.75/ .902
Case B ?? ? Tritone –.885 .328 –.4.46/10.5/–5.79 Case C ? ? Duetone –.342 .045 –.92/.84 Case D ? ? Duetone –.621 .099 –1.13/.94
Unsuccessful
Case E ?? ? Tritone 1.00 .700 11.4/–27.2/16.4 Case F ? ? Duetone .800 .213 2.00/–1.95 Case G ? ? Duetone .655 .163 1.25/–.94
Case H ?? ? Tritone –.733 .179 –1.05/1.87/–1.28 Successful
Case I ?? ? Tritone .468 .169 2.28/–6.58/4.12 1 Direction of best fit curve: ? = increasing Joint score (increasing competitiveness) ? = decreasing Joint score (increasing cooperation) 2 Beta values are reported for each interval of the model curve.
An inspection of the top half of Table 3 revealed that 4 of the 5 unsuccessful negotiations were most effectively modeled by the predicted final trend of increasing competitive behavior. Three cases (Case A, Case C, and Case D) were adequately modeled by a duetone trend, which initially showed good progress but became increasingly distributive during later stages of interactions. The predicted upward movement is also evident in Case E, which is adequately modeled by a tritone curve where the final interval involved rapidly increasing competitive behavior. An exception was the developing sequence of interactions in Case B, which yielded a tritone curve whose final interval was a shallow slope of decreas-ing competitive behavior, thereby contradicting the hypothesized direction of increasing competitiveness.
28 PREDICTION OF OUTCOME IN CRISIS NEGOTIATIONS
The International Journal of Conflict Management, Vol. 13, No. 1, 2002
The lower half of Table 3 shows that all but one of the successful incidents were best modeled by an overall decrease in competitiveness (Joint score). Specifi-cally, the analysis indicated that a duetone curve provided a good approximation of development in Case F and Case G, while Case H required a more comple x tritone model that concluded with decreasing competition. In contrast, Case I did not fit the hypothesized pattern of development and was characterized by increasing com-petitive behavior during the final episodes of interaction.
An examination of the linear regression data for each incident provides a further test of the third set of hypotheses because it gives an indication of how well the simple trend models account for actual variation in behavior over time. The regression models accounted for approxi mately 25% of change in Joint score for unsuccessful incidents (Mean R2 = .25) and at least 18% of development in successful negotiations (Mean R2 = .18). These statistics are impressive since they suggest that more than one fifth of change in negotiators’ behavior may be accounted for by trends along a partially ordered scale of competitiveness. This significance is particularly true given the conservative assumptions adopted in calculating the R2 statistic and the tremendous number of environmental contingencies that are likely to affect negotiators’ behavior.
Discussion
One major goal of negotiation research has been to derive a model of com-munication behavior that may be used to inform inferences about the progress and probable outcome of interactions (Abbott, 1986; Sarna, 1997). The current approach differs from previous attempts to model the relationship between behav-iors and outcomes in several important ways. One distinction is that differences among interactions are conceptualized as points along a competitive scale where they were associated with varying probabilities of success rather than simply dichotomized as success or non-success related. Examining interactions in relation to a measurement scale allowed POSAC to demonstrate that every episode could be summarized by a single score whose relative value corresponded to the prob-ability of negotiation success. A second difference is the focus on understanding the way in which interrelationships among the different degrees and types of com-municat ion behavior structure the competitive scale. This moves beyond examin-ing the relationships between single behaviors and outcomes, and towards explic -itly tracking how negotiators use constellations of behaviors to pursue their com-plex and often contradictory goals. A third methodological distinction is the pro-ject’s focus on determining how well similarities and differences in communication behavior enable accurate discrimination of negotiation outcome. This is in contrast to “partitioning of variance” (e.g., ANOVA) which can tell very little about effi-cacy of discriminating outcome, and is often misunderstood in this regard.
The project showed that differences in communication behavior across 189 interaction episodes may be adequately modeled using a two-dimensional space defined by a partially ordered scale of increasing competitiveness. Furthermore, a threshold on this competitive dimension was shown to provide an optimal dis -crimination of outcome, with episodes associated with unsuccessful negotiations

P. J. TAYLOR 29
The International Journal of Conflict Management, Vol. 13, No. 1, 2002
falling, on average, at higher points on the scale than episodes related to successful incidents. These findings provide empirical justification for viewing hostage nego-tiations as “crisis bargaining” (Donohue et al., 1991), in which progress may be judged by the extent a competitive crisis response is supplanted by a more coop-erative problem-solving approach to interactions. However, while a one-dimen-sional competitive scale, backed by theory, illustrates that very simple patterns underlie what is traditionally viewed as a complex process, the true importance of showing that negotiation can be modeled in this way lies elsewhere. If a scale is consistently found over replications with different samples of variables (and across different transcripts), then it might be inferred, by way of generalization, that the negotiation process itself is scalable. In other words, it may be possible to identify patterns in communication that are independent of the behaviors or coding scheme examined, thereby identifying regularities that form the basis of a general theory of the negotiation process. Revealing regularities in communication that transcend the variety of possible coding schemes is likely to be particularly important to cumula-tive progress in communication research.
In order to understand the dynamics that cause different levels of competition among episodes, the current paper identified the roles each behavior played in structuring the two -dimensional space. Of particular importance in defining this prognostic scale were the behavioral groups Distributive–Expressive and Integra-tive–Instrumental, which adopted orthogonal (base) roles in structuring the repre-sentative axes of the POSAC space. The content of these base items show empiri-cally what practitioners have long observed, namely, that negotiation success is dependent on the reduction of mistrust and psychological distance between parties and the development of a cooperative problem-solving environment. In other words, a failure to either generate interest in substantive problem solving or control the level of expressive hostility in dialogue is the principle reason negotiations move beyond the threshold and towards inevitable failure. The POSAC analysis therefore moves beyond many previous results to identify two qualitatively differ-ent types of risk behavior; an extreme level of one of these types or a high level of both types was found suggestive of future negotiation failure. Thus, occurrence of an episode that involves behavior located by the prognosis items as above the dis -criminant level may be used to alert negotiators to possible impending trouble. A preponderance of interactions above this level should prompt the decision-maker to consider resorting to tactical intervention. This final decision should take into account a number of other external factors (e.g., type of hostage taker, number of hostages), since such factors may influence the extent to which interactions orien-tate around changes in the base dimensions of Distributive–Expressive and Inte-grative–Instrumental behavior.
However, interestingly, the fact that the interrelationships among the commu -nication behaviors could be well-represented in a two -dimensional space means that discrimination of any such outside factor (e.g., types of hostage taker) from these behaviors should be at most two -dimensional. For example, a researcher pre-dicting that negotiators’ gender leads to difference in communication behavior would need to show that episodes involving male negotiators and episodes involv-ing female negotiators fall into distinct regions of the current POSAC space. If no
30 PREDICTION OF OUTCOME IN CRISIS NEGOTIATIONS
The International Journal of Conflict Management, Vol. 13, No. 1, 2002
systematic pattern emerges, then the difference, if any, between male and female negotiators is focused on a “third dimension” of the negotiation process that is not encapsulated in the variables studied in the current POSAC. Thus, the question of whether two dimensions are a sufficient representation of the structure of commu -nication is an important avenue of replication in future research. Studies may build on the current framework by exploring additional facets of behavior to determine whether they refine the current interrelations or require an additional independent dimension for representation. Also interesting in this regard would be to determine whether comparable structures in communication behavior emerge from dialogue in other dyadic and group interactions. Such direct comparisons are possible using POSAC because hypothesis testing is based on the intrinsic structure of the data and does not arise from omitting components or imposing an extrinsic statistical framework.
The conceptualization of behavior along a partially ordered competitive scale enabled analysis to simultaneously show that successful and unsuccessful negotia-tions may be differentiated in terms of long-term developmental trends in behavior. Specifically, findings indicated that unsuccessful negotiations are characterized by the occurrence of a final trend of increasing competitive behavior across interac-tions, whereas incidents associated with successful negotiation showed a gradual decrease in competitive behavior. These trends show that larger, more progressive patterns of relational development can emerge from the dynamic local exploration of individuals’ concerns (Gulliver, 1979). Indeed, because it was possible to simultaneously examine global trends and local dynamics of behavior, the findings lend credence to Donohue and Roberto’s (1996) suggestion that the dominant process accounts of negotiation are not competing models but rather frameworks which capture interaction dynamics at different levels of analysis. In the current negotiations, progression over time was satisfactorily represented by several (at most three) long-term trends in behavior, which is a pattern that closely resembles the Stage account (Putnam, 1990). Yet, the distribution of interaction in the POSAC space is dependent on the juxtaposition of Distributive and Integrative behaviors along the two base axes, implying that the Interdependence account is central to any conceptualization of local level dynamics. In the current framework, this interdependence is structured in the form of a single dimension (i.e., the Lat-eral axis), but further work is required to define the exact content underlying this dimension.
Indeed, one useful feature of POSAC is the ability to examine sequences of behavior by connecting episodes from a single case in temporal order, whereby changes in behavior are shown as movement across the regions of the solution space. A more detailed examination of this kind may provide insights into the rela-tionship between broad trends and local interdependence in generating negotiation outcome. However, what it cannot do is give information about the actual topic of interaction, which would require a more in-depth qualitative analysis of the tran-scripts. Future work of this kind would do well to focus on the dynamics that cause a transition in development between increasing Integrative behavior and increasing Distributive behavior.
P. J. TAYLOR 31
The International Journal of Conflict Management, Vol. 13, No. 1, 2002
Conclusions
Overall, the results of this study provide empirical evidence of the usefulness of POSAC for examining the intrinsic structure of differences among episodes of communication and for classifying negotiation success relative to basic behavioral components of interaction. The analysis demonstrated the usefulness of conceptu-alizing behavior as having various roles on a single scale of competitiveness, along which the evolving sequences of interactions can be mapped. These findings not only support the relationships proposed by previous studies, but also emphasize the need for future work to clearly specify the interrelationships among the behavioral predictors under investigation.
References
Abbott, T. E. (1986). Time phase model for hostage negotiation. The Police Chief, 6, 169–186.
Bilsky, W., Borg, I., & Wetzels, P. (1995). Assessing conflict tactics in close relationships: A reanalysis of a research instrument. In J. J. Hox, G. J. Mellenbergh, & P. G. Swanborn (Eds.), Facet theory: Analysis and design (pp. 39-46). Amsterdam: Setos.
Blount, S., Thomas-Hunt, M. C., & Neale, M. A. (1996). The price is right – or is it? A ref-erence point model of two-party price negotiations. Organizational Behavior and Human Decision Processes, 68, 1–12.
Borg, I., & Shye, S. (1995). Facet theory: Form and content. Thousand Oaks, CA: Sage. Bormann, E. G. (1980). Communication theory. New York: Holt, Reinhart, and Winston. Butler, W. M., Leitenberg, H., & Fuselier, G. D. (1993). The use of mental health profes-
sional consultants to police hostage negotiation teams. Behavioral Sciences and the Law, 11, 213–221.
Cohen, J. A. (1960). A coefficient of agreement for nominal scales. Educational and Psy-chological Measurement, 20, 37–46.
Cohen, J., & Cohen, P. (1983). Applied multiple regression/correlation analysis for the behavioral sciences. Hillsdale, NJ: Lawrence Erlbaum.
Dancer, L. S. (1990). Suicide prediction and the partial order scalogram analysis of psycho-logical adjustment. Applied Psychology: An International Review, 39, 479–497.
Donohue, W. A ., Diez, M. E., & Hamilton, M. (1984). Coding naturalistic negotiation inter-action. Human Communication Research, 10, 403–425.
Donohue, W. A., Lyles, J., & Rogan, R. G. (1989). Issue development in divorce mediation. Empirical Research in Divorce and Family Mediation, 24, 19–28.
Donohue, W. A., Ramesh, C., Kaufmann, G., & Smith, R. (1991). Crisis bargaining in intense conflict situations. International Journal of Group Tensions, 21, 133–145.
Donohue, W. A., & Roberto, A. J. (1993). Relational development as negotiated order in hostage negotiation. Human Communication Research, 20, 175–198.
Donohue W. A., & Roberto, A. J. (1996). An empirical examination of three models of inte-grative and distributive bargaining. International Journal of Conflict Management, 7, 209–229.
Erwin, P. (2001). Attitudes and persuasion. Philadelphia, PA: Psychology Press.

32 PREDICTION OF OUTCOME IN CRISIS NEGOTIATIONS
The International Journal of Conflict Management, Vol. 13, No. 1, 2002
Fleiss, J. L. (1981). Statistical methods for rates and proportions. New York: Wiley. Folger, J. P., Poole, M. S., & Stutman, R. K. (1993). Working through conflict. New York:
HarperCollins. Fuselier, G. D. (1988). Hostage negotiation consultant: Emerging role for the clinical psy-
chologist. Professional Psychology: Research and Practice, 19, 175–179. Gottman, J. M. (1979). Marital interaction: Experimental investigations. New York: Aca-
demic Press. Gottman, J. M., & Notarius, C. I. (2000). Decade review: Observing marital interaction.
Journal of Marriage and the Family, 62, 927–947. Guetzkow, H. (1950). Unitizing and categorizing problems in coding qualitative data. Jour-
nal of Clinical Psychology, 6, 47–58. Gulliver, P. H. (1979). Disputes and negotiations: A cross-cultural perspective. Orlando,
FL: Academic Press. Guttman, L. (1986). Coefficients of polytonicity and monotonicity. Encyclopedia of statisti-
cal sciences (pp. 80–87). New York: Wiley. Guttman, L. (1988). Eta, Disco, Odisco, and F. Psychometrika, 53, 393–405. Hammer, M. R., & Rogan, R. G. (1997). Negotiation models in crisis situations: The value
of a communication-based approach. In R. G. Rogan, M. R. Hammer, & C. R. Van Zandt (Eds.), Dynamic processes of crisis negotiation: Theory, research and practice (pp. 9–24). Westport, CT: Praeger.
Holmes, M. E. (1991). An interaction analysis of developmental phases in authentic and simulated negotiation between police and hostage-takers and barricade suspects. Unpublished doctoral dissertation, University of Minnesota, Minneapolis.
Holmes, M. E., & Sykes, R. E. (1993). A test of the fit of Gulliver’s phase model to hostage negotiations. Communication Studies, 44, 38– 55.
Jones, T. S. (1988). Phase structures in agreement and no-agreement mediation. Communi-cation Research, 15, 470–495.
Mann, W. C., & Thompson, S. A. (1988). Rhetorical structure theory: Towards a functional theory of text organization. Text, 8, 243–281.
Miron, M. S., & Goldstein, A. P. (1979). Hostage. New York: Pergamon Press. Natslandsmyr, J. H., & Rognes, J. (1995). Culture, behavior, and negotiation outcomes: A
comparative and cross-cultural study of Mexican and Norwegian negotiators. Interna-tional Journal of Conflict Management, 6, 5–29.
Neale, M. A., & Bazerman, M. H. (1983). The role of perspective-taking ability in negoti-ating under different forms of arbitration. Industrial and Labor Relations Review, 36, 378–388.
Neale, M. A., & Bazerman, M. H. (1985). The effects of framing and negotiator overconfi-dence on bargaining behaviors and outcomes. Academy of Management Journal, 28, 34–49.
Noesier, G. W. (1999). Negotiation concepts for commanders. FBI Law Enforcement Bulle-tin, 68, 6–14.
Olekalns, M. (1994). Context, issues and frame as determinates of negotiated outcome. British Journal of Social Psychology, 33, 197–210.

P. J. TAYLOR 33
The International Journal of Conflict Management, Vol. 13, No. 1, 2002
Olekalns, M. (1997). Situational cues as moderators of the frame-outcome relationship. British Journal of Social Psychology, 36, 191–209.
Olekalns, M., & Smith, P. L. (2000). Understanding optimal outcomes: The role of strategy sequences in competitive negotiations. Human Communication Research, 26, 527–557.
Porter, L. E., & Alison, L. J. (2001). A partially ordered scale of influence in violent group behavior: An example from gang rape. Small Group Research, 32, 475–497.
Putnam, L. L. (1990). Reframing integrative and distributive bargaining: A process perspec-tive. In B. H. Sheppard, M. H. Bazerman, & R. J. Lewicki (Eds.), Research on negotia-tion in organizations (Vol. 2, pp. 3–30) Greenwich, CT: JAI Press.
Putnam, L. L. (1994). Challenging the assumptions of traditional approaches to negotiation. Negotiation Journal, 10, 337–346.
Putnam, L. L., & Wilson, S. R. (1989). Argumentation and bargaining strategies as dis-criminators of integrative outcomes. In M. A. Rahim (Ed.), Managing conflict: An inter-disciplinary approach (pp. 121–141). New York: Praeger.
Putnam, L. L., Wilson, S. R., & Turner, D. B. (1990). The evolution of policy arguments in teacher’s negotiations. Argumentation, 4, 129–152.
Rogan, R. G., & Hammer, M. R. (1995). Assessing message affect in crisis negotiations: An exploratory study. Human Communication Research, 21, 553–574.
Rogan, R. G., Hammer M. R., & Van Zandt, C. R. (1994). Profiling crisis negotiation teams. The Police Chief, 61, 14–18.
Sarna, P. (1997). Models for managing hostage negotiations: Pathways or straitjackets?. In R. G. Rogan, M. R. Hammer, & C. R. Van Zandt (Eds.), Dynamic processes of crisis negotiation: Theory, research and practice (pp. 95–104). Westport, CT: Praeger.
Shye, S. (1985). Multiple scaling. Amsterdam: Elsevier. Simons, T. (1993). Speech patterns and the concept of utility in cognitive maps: The case of
integrative bargaining. Academy of Management Journal, 36, 139–156. Swets, J. A., Dawes, R. M., & Monahan, J. (2000, October). Better decisions through sci-
ence. Scientific America, pp. 82–87. Synder, G. H., & Diesing, P. (1977). Conflict among nations: Bargaining, decision making,
and system structure in international crises. Princeton, NJ: Princeton University Press. Taylor, P. J. (2002). A cylindrical model of communication behavior in crisis negotiations.
Human Communication Research, 28, 7–48. Taylor, P. J., Bennell, C., & Snook, B. (2002). Problems of classification in investigative
psychology. In K. Jajuga, A. Sokolowski, and H. H. Bock (Eds.), Classification, clus-tering, and data analysis: Recent Advances and applications (pp. 479–487). Heidelberg: Springer.
Van Poucke, D., & Buelens, M. (2002). Predicting the outcome of two-party price negotia-tion: Contribution of reservation price, aspiration price and opening offer. Journal of Economic Psychology, 23, 67–76.
Weingart, L. R., Thompson, L. L., Bazerman, M. H., & Carroll, J. S. (1990). Tactical behavior and negotiation outcomes. International Journal of Conflict Management, 1, 7–31.
34 PREDICTION OF OUTCOME IN CRISIS NEGOTIATIONS
The International Journal of Conflict Management, Vol. 13, No. 1, 2002
Weingart, L. R., Prietula, M. J., Hyder, E. B., & Genovese, C. R. (1999). Knowledge and the sequential processes of negotiation: A Markov chain analysis of response-in-kind. Jour-nal of Experimental Social Psychology, 35, 366–393.
Wilson, S. R., & Putnam, L. L. (1990). Interaction goals in negotiation. In J. Anderson (Ed.), Communication Yearbook 13 (pp. 374–406). Newbury Park, CA: Sage.
Biographical Note
Paul J. Taylor Department of Psychology Eleanor Rathbone Building University of Liverpool, Liverpool, L69 7ZA United Kingdom Phone/Fax: +44–151–794–3933/–3938 E-mail: [email protected].
Mr. Taylor is a Ph.D. student in the Department of Psychology at the University of Liver-pool, where he teaches on courses in applied psychology and research methodology. He holds a B.Sc. in Psychology from the University of Essex and a M.Sc. in Investigative Psychology from the University of Liverpool. His research interests focus on the structure and processes of communication behavior in “crisis” environments, particularly within the negotiation context, where his work addresses issues including effective strategy use, individual differences, and the prediction of future behavior.
Received: January 26, 2002 Accepted by Raymond Friedman after two revisions: September 10, 2002
?