Embed Size (px)
Citation preview
Institute of Nuclear and New Energy Technology(INET), Tsinghua University
A performance comparison of two kinds of liquid scintillation counters (LSCs)
from PerkinElmer, Inc.
Xiao-gui FENG 1), Guo-hua JIANG 2), Jian-hua HUANG 2), Jian-yu DU 3),
Qian-ge HE 1), Jian-chen WANG 1), Jing CHEN 1)
1) Institute of Nuclear and New Energy Technology, Collaborative Innovation Center ofAdvanced Nuclear Energy Technology, Tsinghua University, Beijing 100084, PR China
2) Analytical and Testing Center, Beijing Normal University, Beijing 100875, PR China
3) PerkinElmer, Beijing 100015, PR China
2
Outline
Introduction Experimental methods Results and discussion
Background count rate and counting efficiency α/β discrimination The instrument stability
Conclusions
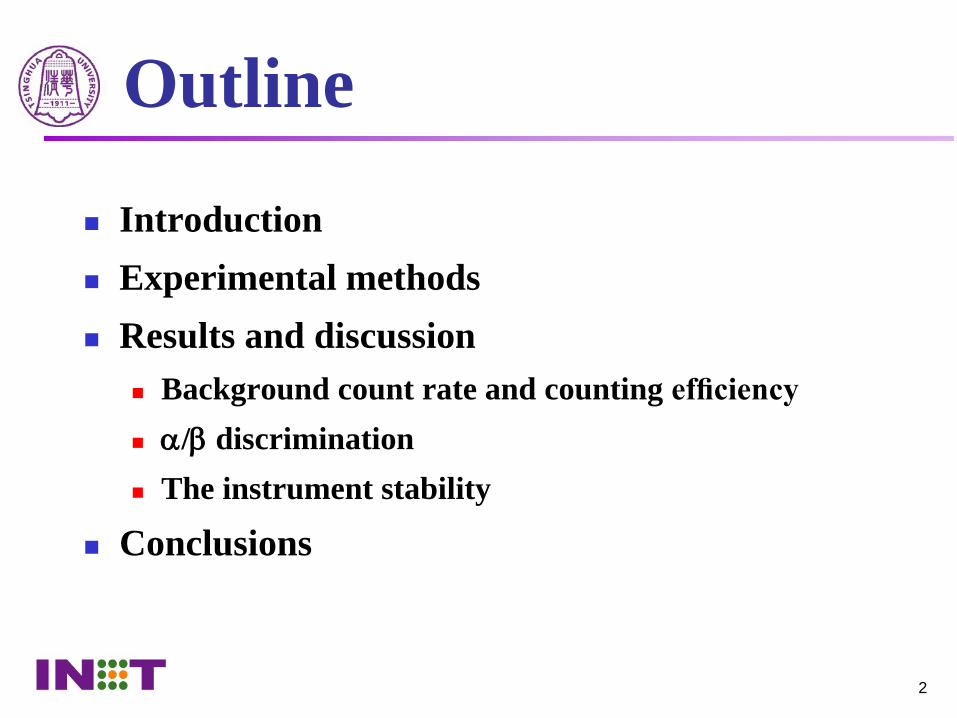
Schematic diagram of lead shield and guard
Key features of Quantulus 1220
1 23 45
1,2: Guard PMT
3,4: Sample PMT
5: Sample
PMT: photomultiplier tubesAsymmetric lead shield
Liquid scintillation
guard
3
4
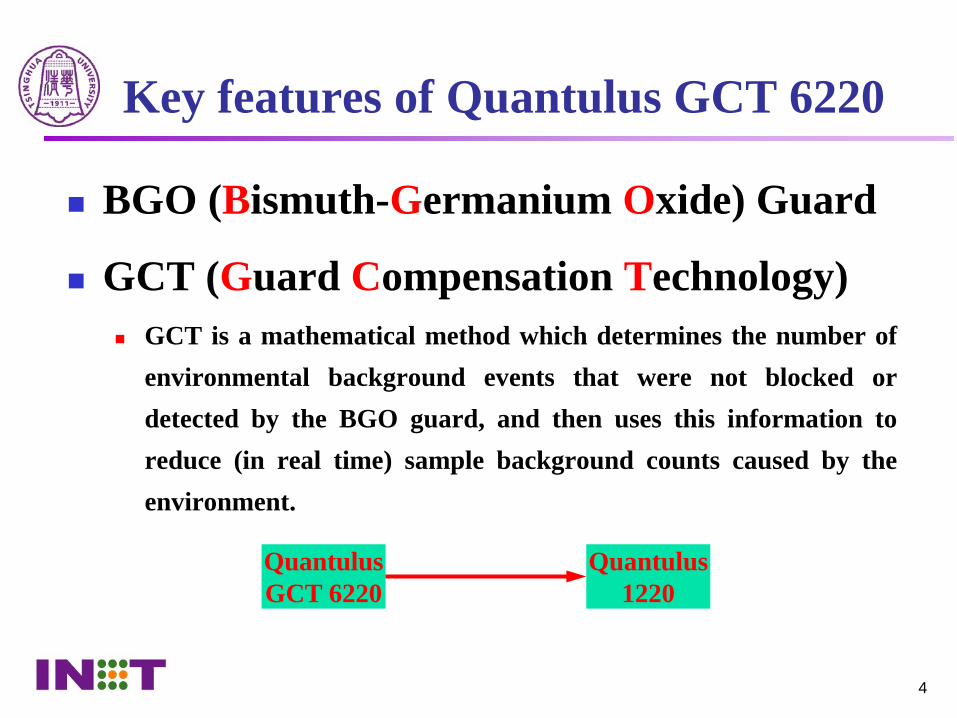
Key features of Quantulus GCT 6220
BGO (Bismuth-Germanium Oxide) Guard
GCT (Guard Compensation Technology) GCT is a mathematical method which determines the number of
environmental background events that were not blocked ordetected by the BGO guard, and then uses this information toreduce (in real time) sample background counts caused by theenvironment.
Quantulus1220
QuantulusGCT 6220
5
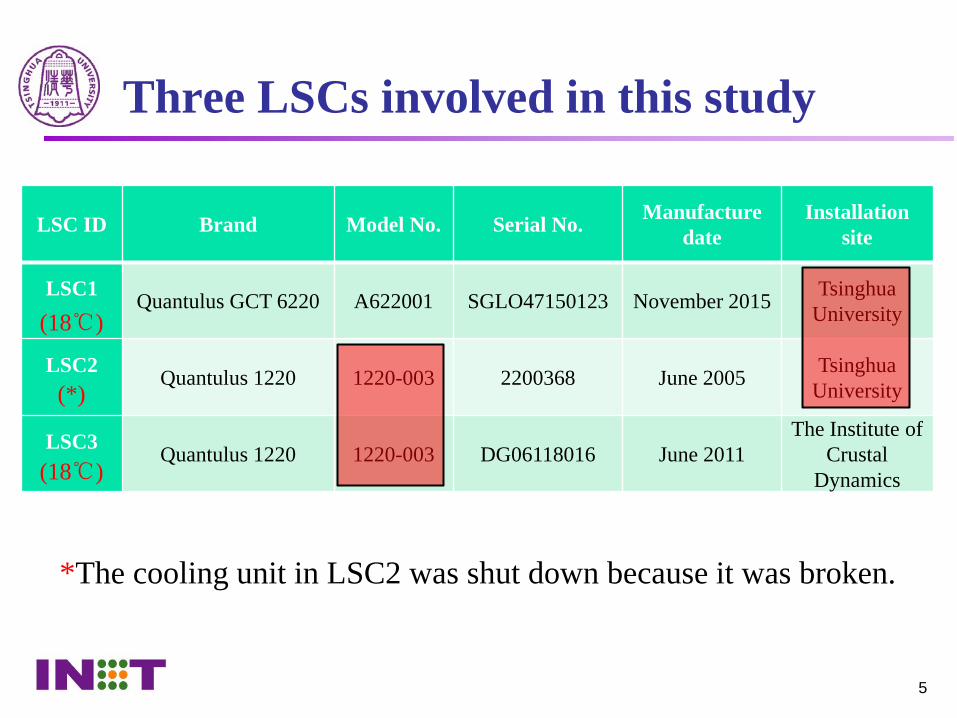
Three LSCs involved in this study
LSC ID Brand Model No. Serial No. Manufacture date
Installation site
LSC1 Quantulus GCT 6220 A622001 SGLO47150123 November 2015 Tsinghua University
LSC2 Quantulus 1220 1220-003 2200368 June 2005 Tsinghua University
LSC3 Quantulus 1220 1220-003 DG06118016 June 2011The Institute of
Crustal Dynamics
*The cooling unit in LSC2 was shut down because it was broken.
(*)
(18℃)
(18℃)
6
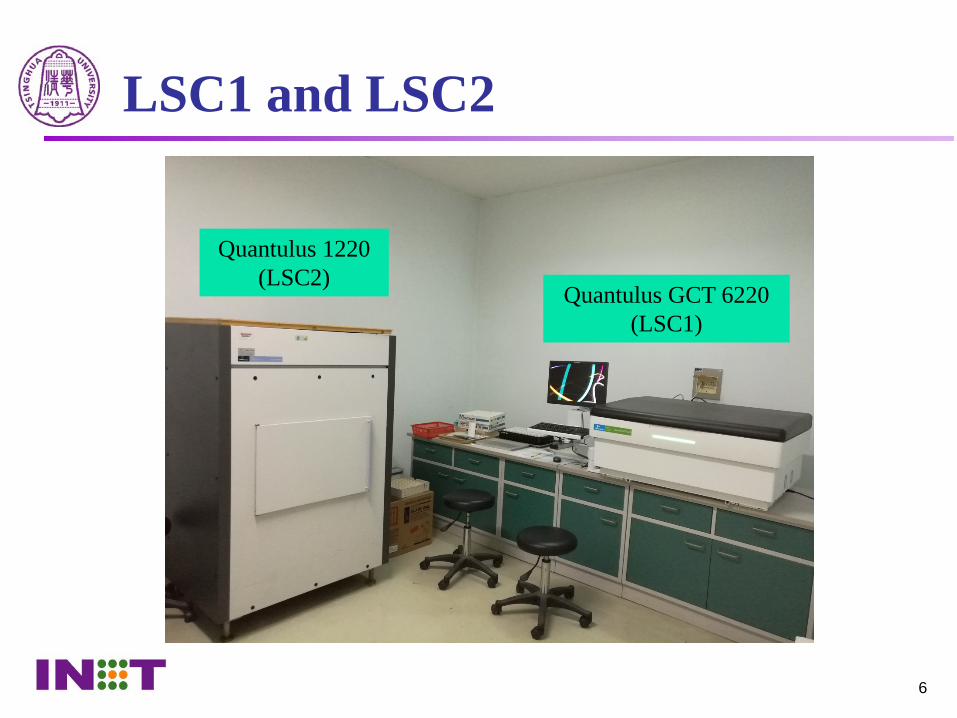
LSC1 and LSC2
Quantulus 1220(LSC2)
Quantulus GCT 6220(LSC1)
7
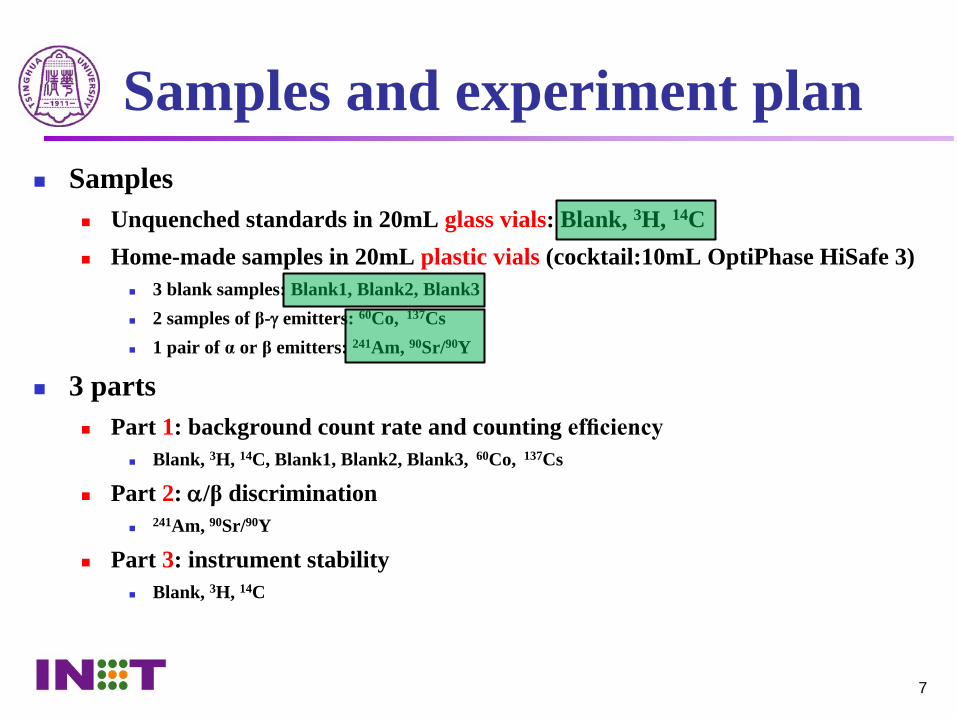
Samples and experiment plan Samples
Unquenched standards in 20mL glass vials: Blank, 3H, 14C Home-made samples in 20mL plastic vials (cocktail:10mL OptiPhase HiSafe 3)
3 blank samples: Blank1, Blank2, Blank3 2 samples of β-γ emitters: 60Co, 137Cs 1 pair of α or β emitters: 241Am, 90Sr/90Y
3 parts Part 1: background count rate and counting efficiency
Blank, 3H, 14C, Blank1, Blank2, Blank3, 60Co, 137Cs
Part 2: α/β discrimination
241Am, 90Sr/90Y
Part 3: instrument stability Blank, 3H, 14C
8
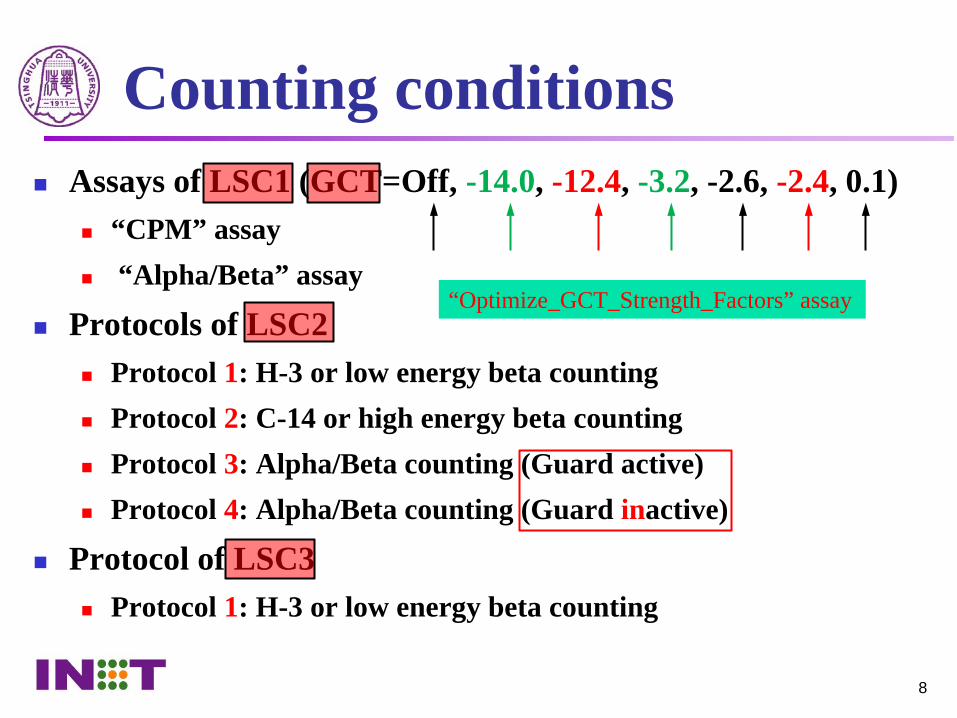
Counting conditions Assays of LSC1 (GCT=Off, -14.0, -12.4, -3.2, -2.6, -2.4, 0.1)
“CPM” assay “Alpha/Beta” assay
Protocols of LSC2 Protocol 1: H-3 or low energy beta counting Protocol 2: C-14 or high energy beta counting Protocol 3: Alpha/Beta counting (Guard active) Protocol 4: Alpha/Beta counting (Guard inactive)
Protocol of LSC3 Protocol 1: H-3 or low energy beta counting
“Optimize_GCT_Strength_Factors” assay
9
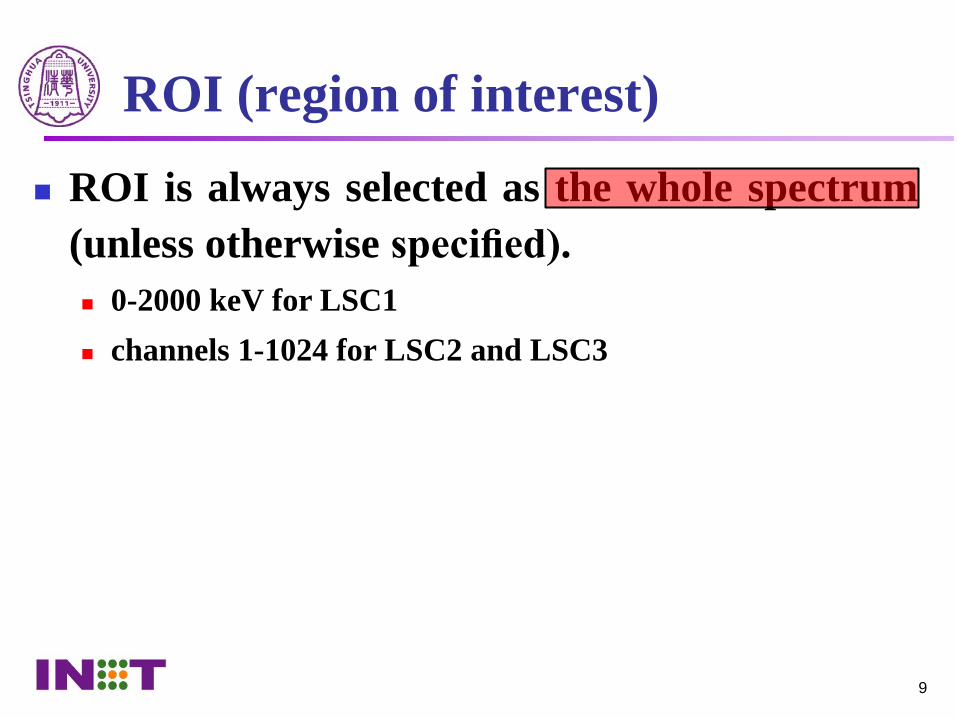
ROI (region of interest)
ROI is always selected as the whole spectrum(unless otherwise specified). 0-2000 keV for LSC1 channels 1-1024 for LSC2 and LSC3
10
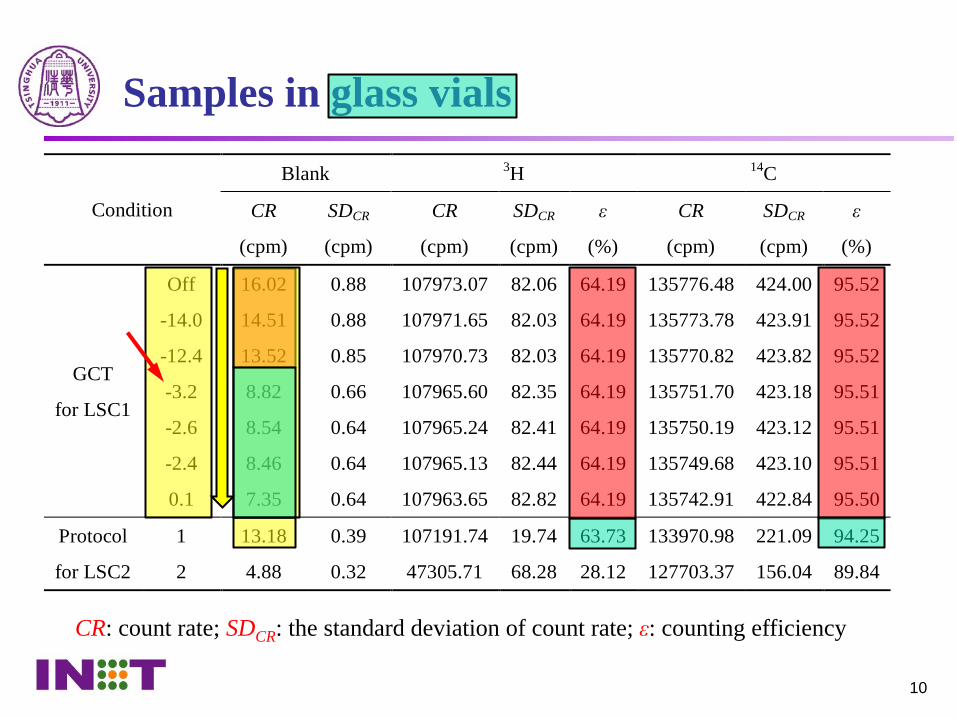
Samples in glass vials
Condition
Blank 3H 14C
CR
(cpm)
SDCR
(cpm)
CR
(cpm)
SDCR
(cpm)
ε
(%)
CR
(cpm)
SDCR
(cpm)
ε
(%)
GCT
for LSC1
Off 16.02 0.88 107973.07 82.06 64.19 135776.48 424.00 95.52
-14.0 14.51 0.88 107971.65 82.03 64.19 135773.78 423.91 95.52
-12.4 13.52 0.85 107970.73 82.03 64.19 135770.82 423.82 95.52
-3.2 8.82 0.66 107965.60 82.35 64.19 135751.70 423.18 95.51
-2.6 8.54 0.64 107965.24 82.41 64.19 135750.19 423.12 95.51
-2.4 8.46 0.64 107965.13 82.44 64.19 135749.68 423.10 95.51
0.1 7.35 0.64 107963.65 82.82 64.19 135742.91 422.84 95.50
Protocol
for LSC2
1 13.18 0.39 107191.74 19.74 63.73 133970.98 221.09 94.25
2 4.88 0.32 47305.71 68.28 28.12 127703.37 156.04 89.84
CR: count rate; SDCR: the standard deviation of count rate; ε: counting efficiency
11
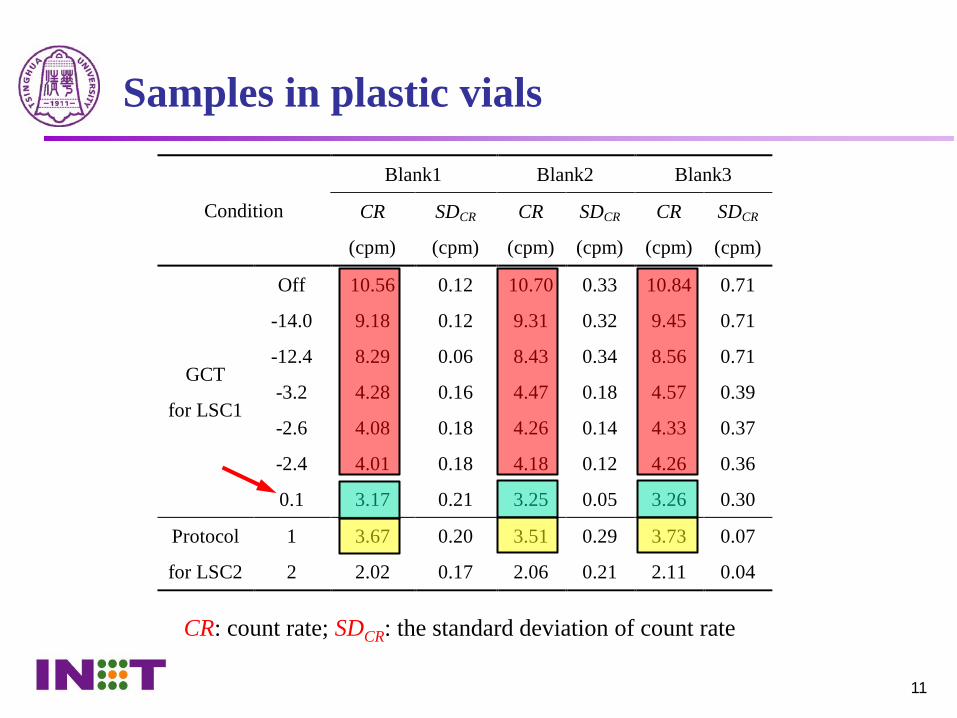
Samples in plastic vials
CR: count rate; SDCR: the standard deviation of count rate
Condition
Blank1 Blank2 Blank3
CR
(cpm)
SDCR
(cpm)
CR
(cpm)
SDCR
(cpm)
CR
(cpm)
SDCR
(cpm)
GCT
for LSC1
Off 10.56 0.12 10.70 0.33 10.84 0.71
-14.0 9.18 0.12 9.31 0.32 9.45 0.71
-12.4 8.29 0.06 8.43 0.34 8.56 0.71
-3.2 4.28 0.16 4.47 0.18 4.57 0.39
-2.6 4.08 0.18 4.26 0.14 4.33 0.37
-2.4 4.01 0.18 4.18 0.12 4.26 0.36
0.1 3.17 0.21 3.25 0.05 3.26 0.30
Protocol
for LSC2
1 3.67 0.20 3.51 0.29 3.73 0.07
2 2.02 0.17 2.06 0.21 2.11 0.04
12
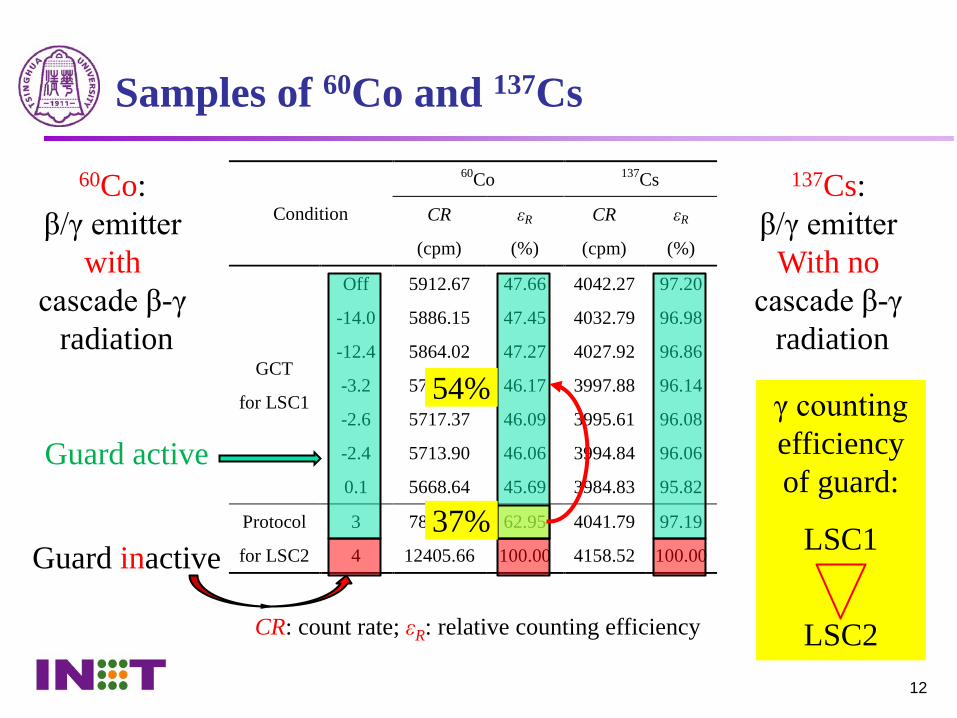
Samples of 60Co and 137Cs
CR: count rate; εR: relative counting efficiency
Condition
60Co 137Cs
CR
(cpm)
εR
(%)
CR
(cpm)
εR
(%)
GCT
for LSC1
Off 5912.67 47.66 4042.27 97.20
-14.0 5886.15 47.45 4032.79 96.98
-12.4 5864.02 47.27 4027.92 96.86
-3.2 5727.65 46.17 3997.88 96.14
-2.6 5717.37 46.09 3995.61 96.08
-2.4 5713.90 46.06 3994.84 96.06
0.1 5668.64 45.69 3984.83 95.82
Protocol
for LSC2
3 7809.39 62.95 4041.79 97.19
4 12405.66 100.00 4158.52 100.00
60Co:β/γ emitter
withcascade β-γ
radiation
137Cs:β/γ emitter
With nocascade β-γ
radiation
Guard inactive
Guard activeγ counting efficiency of guard:
LSC1
LSC2
54%
37%
13
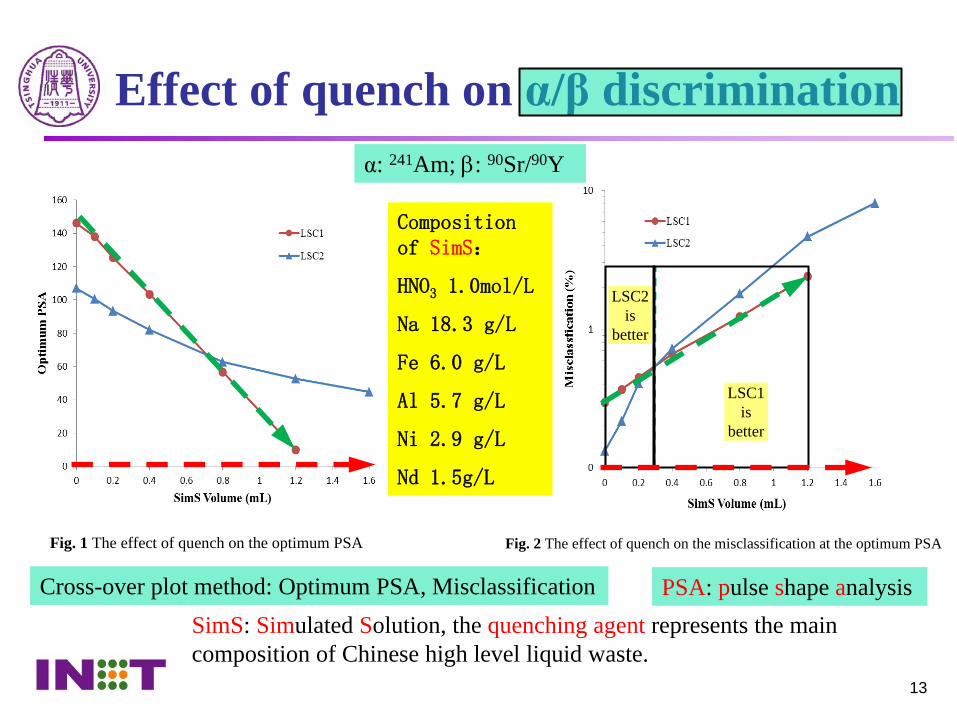
Effect of quench on α/β discrimination
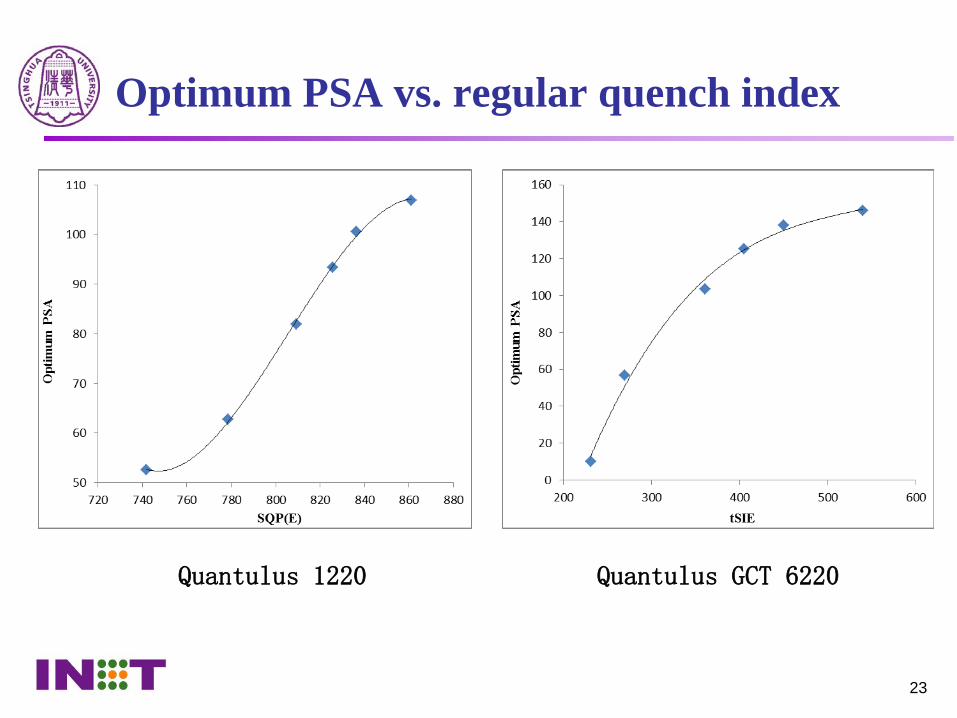
Fig. 1 The effect of quench on the optimum PSA
Fig. 2 The effect of quench on the misclassification at the optimum PSA
Composition of SimS:
HNO3 1.0mol/L
Na 18.3 g/L
Fe 6.0 g/L
Al 5.7 g/L
Ni 2.9 g/L
Nd 1.5g/L
SimS: Simulated Solution, the quenching agent represents the main composition of Chinese high level liquid waste.
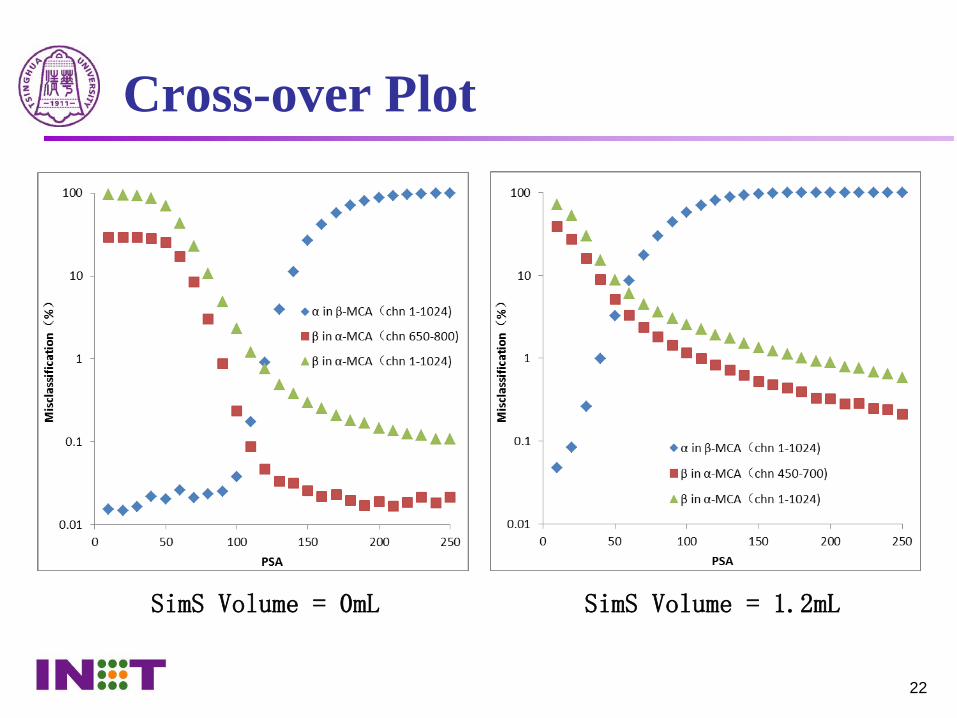
Cross-over plot method: Optimum PSA, Misclassification
LSC2is
better
LSC1is
better
α: 241Am; β: 90Sr/90Y
PSA: pulse shape analysis
14
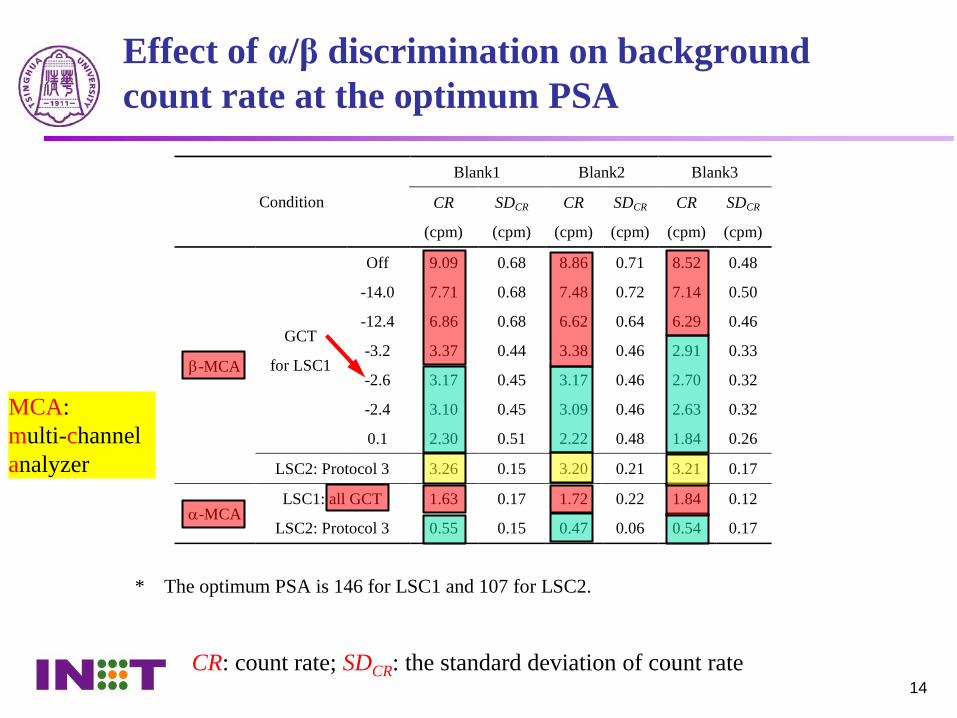
Effect of α/β discrimination on background count rate at the optimum PSA
CR: count rate; SDCR: the standard deviation of count rate
Condition
Blank1 Blank2 Blank3
CR
(cpm)
SDCR
(cpm)
CR
(cpm)
SDCR
(cpm)
CR
(cpm)
SDCR
(cpm)
β-MCA
GCT
for LSC1
Off 9.09 0.68 8.86 0.71 8.52 0.48
-14.0 7.71 0.68 7.48 0.72 7.14 0.50
-12.4 6.86 0.68 6.62 0.64 6.29 0.46
-3.2 3.37 0.44 3.38 0.46 2.91 0.33
-2.6 3.17 0.45 3.17 0.46 2.70 0.32
-2.4 3.10 0.45 3.09 0.46 2.63 0.32
0.1 2.30 0.51 2.22 0.48 1.84 0.26
LSC2: Protocol 3 3.26 0.15 3.20 0.21 3.21 0.17
α-MCA LSC1: all GCT 1.63 0.17 1.72 0.22 1.84 0.12
LSC2: Protocol 3 0.55 0.15 0.47 0.06 0.54 0.17
* The optimum PSA is 146 for LSC1 and 107 for LSC2.
MCA:multi-channel analyzer
15
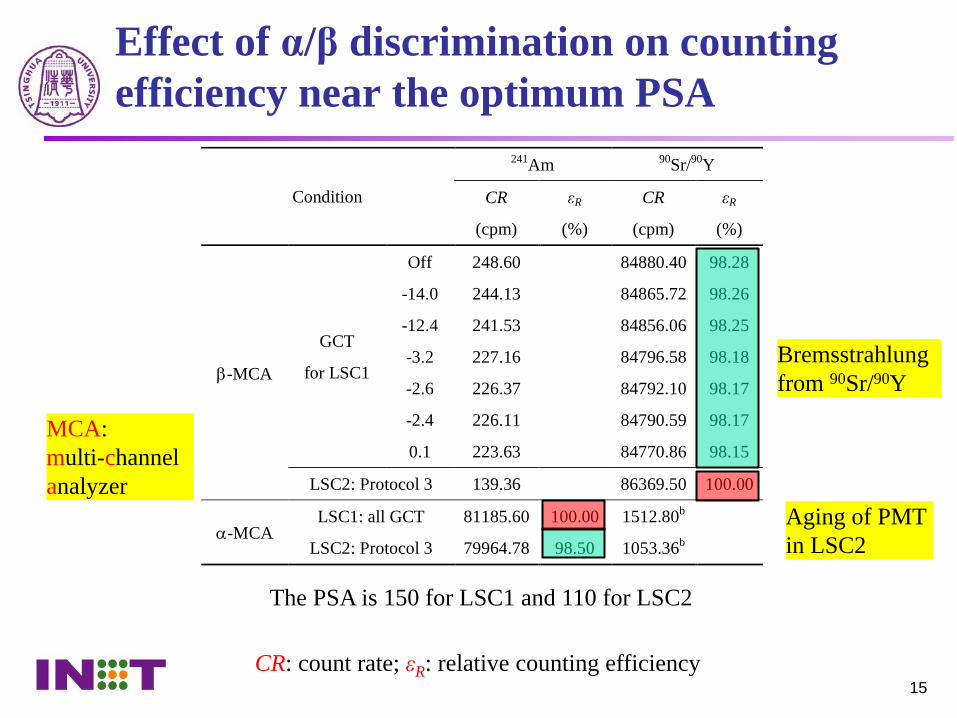
Effect of α/β discrimination on counting efficiency near the optimum PSA
CR: count rate; εR: relative counting efficiency
Condition
241Am 90Sr/90Y
CR
(cpm)
εR
(%)
CR
(cpm)
εR
(%)
β-MCA
GCT
for LSC1
Off 248.60 84880.40 98.28
-14.0 244.13 84865.72 98.26
-12.4 241.53 84856.06 98.25
-3.2 227.16 84796.58 98.18
-2.6 226.37 84792.10 98.17
-2.4 226.11 84790.59 98.17
0.1 223.63 84770.86 98.15
LSC2: Protocol 3 139.36 86369.50 100.00
α-MCA LSC1: all GCT 81185.60 100.00 1512.80b
LSC2: Protocol 3 79964.78 98.50 1053.36b
The PSA is 150 for LSC1 and 110 for LSC2
Aging of PMTin LSC2
Bremsstrahlungfrom 90Sr/90Y
MCA:multi-channel analyzer
16
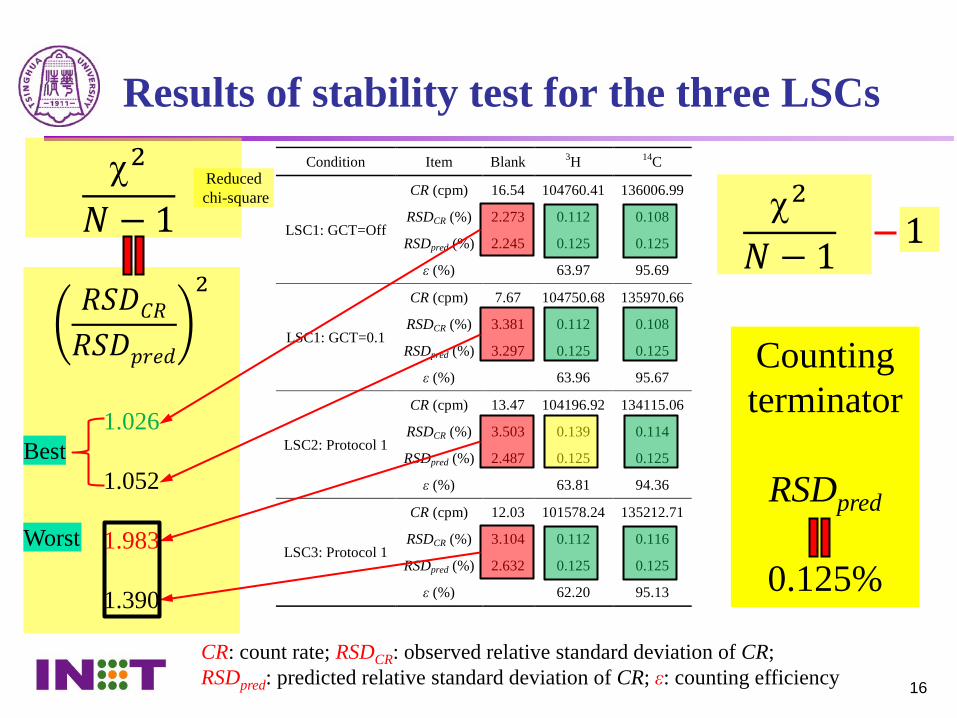
Results of stability test for the three LSCs
CR: count rate; RSDCR: observed relative standard deviation of CR;RSDpred: predicted relative standard deviation of CR; ε: counting efficiency
Condition Item Blank 3H 14C
LSC1: GCT=Off
CR (cpm) 16.54 104760.41 136006.99
RSDCR (%) 2.273 0.112 0.108
RSDpred (%) 2.245 0.125 0.125
ε (%) 63.97 95.69
LSC1: GCT=0.1
CR (cpm) 7.67 104750.68 135970.66
RSDCR (%) 3.381 0.112 0.108
RSDpred (%) 3.297 0.125 0.125
ε (%) 63.96 95.67
LSC2: Protocol 1
CR (cpm) 13.47 104196.92 134115.06
RSDCR (%) 3.503 0.139 0.114
RSDpred (%) 2.487 0.125 0.125
ε (%) 63.81 94.36
LSC3: Protocol 1
CR (cpm) 12.03 101578.24 135212.71
RSDCR (%) 3.104 0.112 0.116
RSDpred (%) 2.632 0.125 0.125
ε (%) 62.20 95.13
𝑅𝑅𝑅𝑅𝑅𝑅𝐶𝐶𝑅𝑅
𝑅𝑅𝑅𝑅𝑅𝑅𝑝𝑝𝑝𝑝𝑝𝑝𝑝𝑝
2
1.026
1.052
1.983
1.390
Counting terminator
RSDpred
0.125%
χ2
𝑁𝑁 − 1
Best
Worst
χ2
𝑁𝑁 − 11
Reducedchi-square
17
Conclusions If proper GCT is applied, the background count rate in β-MCA for
Quantulus GCT 6220 can be lower than that for Quantulus 1220,but the background count rate in α-MCA for Quantulus GCT 6220is always higher.
For the counting efficiency, which LSC is higher depends not onlyon the LSC setting (including the aging of PMTs), but also on thedecay properties of the radionuclide to-be-determined.
The results of α/β discrimination vary with the quench level of thesamples: Quantulus GCT 6220 is better for high quenched samples,while Quantulus 1220 is better for low quenched samples.
It seems that Quantulus GCT 6220 exhibits better stability thanQuantulus 1220.
18
References1. PerkinElmer (2002) Wallac 1220 Quantulus™ ultra low level liquid scintillation spectrometer(instrument manual, 1220-931-06)2. PerkinElmer (2015) QuantaSmart™ for the Tri-Carb® liquid scintillation analyzer (Models4810TR, 4910TR, 5110TR, and QuantulusTM GCT 6220) (reference manual, manual reordernumber 8860101 Rev. A)3. Zhao HP, Feng XG (2011) The influences of anticoincidence shield on liquid scintillation countrates for various kinds of radionuclides. J Nucl Radiochem 33(6):353-357 (in Chinese)4. Pujol L, Sanchez-Cabeza J-A (1997) Role of quenching on alpha-beta separation in liquidscintillation counting for several high capacity cocktails. Analyst 122: 383-3855. Pates JM, Cook GT, MacKenzie AB, Passo CJ (1998) Implications of beta energy and quenchlevel for alpha-beta liquid scintillation spectrometry calibration. Analyst 123: 2201-22076. Feng XG, He QG (2009) Simultaneous determination of 237Np, 238–240Pu and 241Am in HNO3solution by combining extraction, liquid scintillation counting, and α spectrometry. Nucl InstrumMethods Phys Res A 609: 165-17127. Feng XG, He QG, Wang JC, Chen J (2016) The effect of incidental radiations on thedetermination of α or β particles by liquid scintillation counting for low quenched samples. JRadioanal Nucl Chem 308: 67-798. Knoll GF (1999) radiation detection and measurement (3rd Edition). John Wiley & Sons, Inc.,New York/Chichester/Weinheim/Brisbane/Toronto/Singapore
19
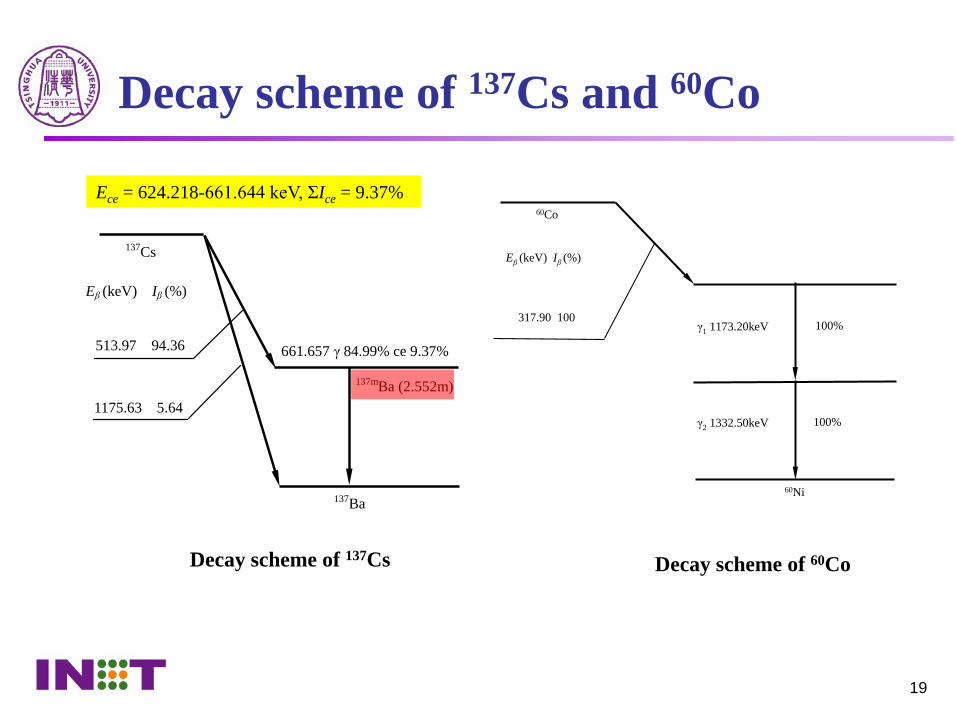
Decay scheme of 137Cs and 60Co
137mBa (2.552m)
137Cs
513.97 94.36
Eβ (keV) Iβ (%)
1175.63 5.64
137Ba
661.657 γ 84.99% ce 9.37%
100%
60Co
317.90 100
Eβ (keV) Iβ (%)
γ1 1173.20keV
60Ni
100%
γ2 1332.50keV
Decay scheme of 60CoDecay scheme of 137Cs
Ece = 624.218-661.644 keV, ΣIce = 9.37%
20
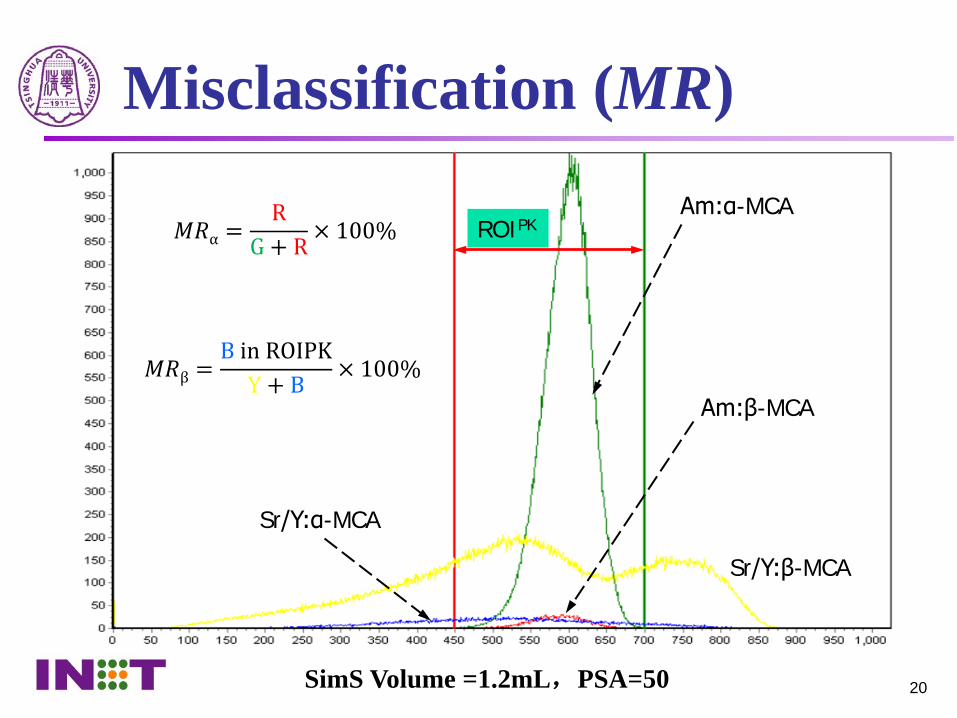
Misclassification (MR)
SimS Volume =1.2mL,PSA=50
Am:α-MCA
Am:β-MCA
Sr/Y:α-MCA
Sr/Y:β-MCA
ROIPK𝑀𝑀𝑅𝑅α =R
G + R× 100%
𝑀𝑀𝑅𝑅β =B in ROIPK
Y + B× 100%
21
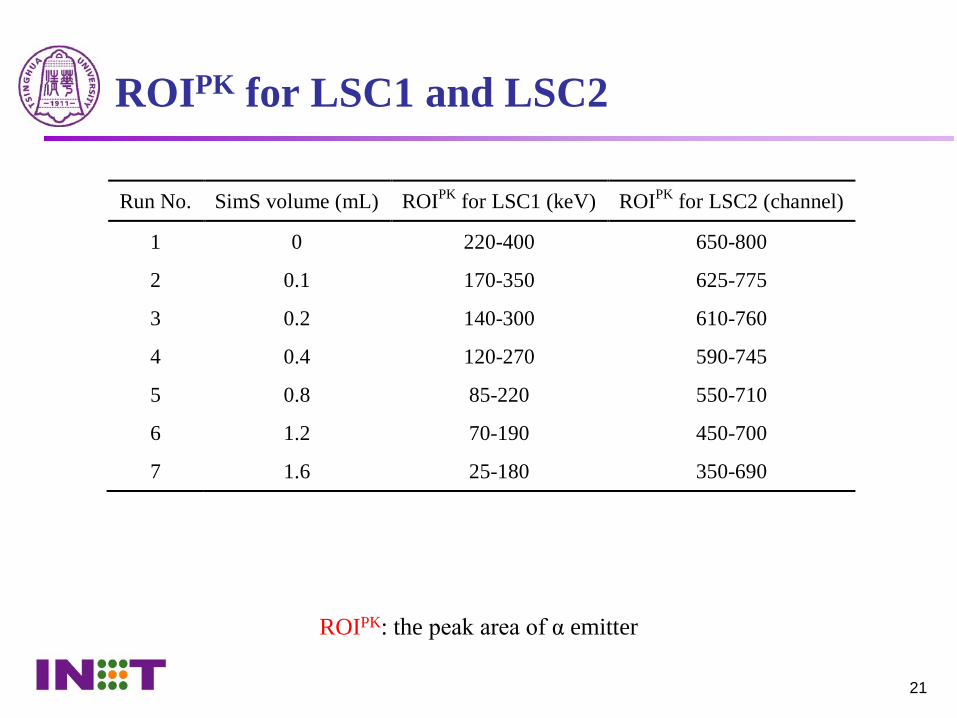
ROIPK for LSC1 and LSC2
ROIPK: the peak area of α emitter
Run No. SimS volume (mL) ROIPK for LSC1 (keV) ROIPK for LSC2 (channel)
1 0 220-400 650-800
2 0.1 170-350 625-775
3 0.2 140-300 610-760
4 0.4 120-270 590-745
5 0.8 85-220 550-710
6 1.2 70-190 450-700
7 1.6 25-180 350-690
22
Cross-over Plot
SimS Volume = 0mL SimS Volume = 1.2mL
23
Optimum PSA vs. regular quench index
Quantulus 1220 Quantulus GCT 6220
24
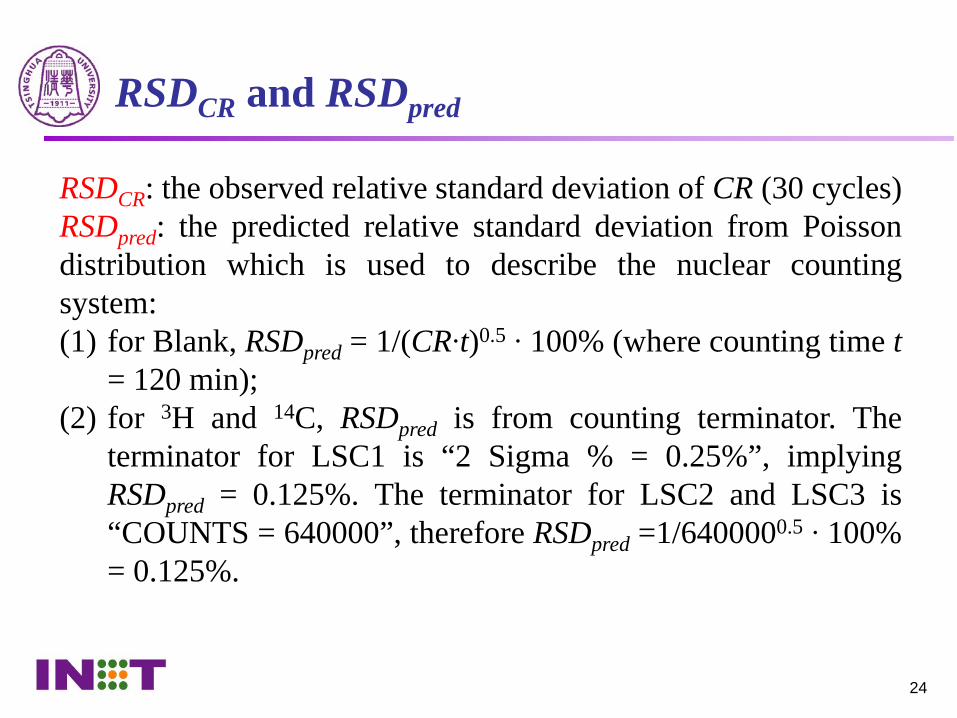
RSDCR and RSDpred
RSDCR: the observed relative standard deviation of CR (30 cycles)RSDpred: the predicted relative standard deviation from Poissondistribution which is used to describe the nuclear countingsystem:(1) for Blank, RSDpred = 1/(CR∙t)0.5 ∙ 100% (where counting time t
= 120 min);(2) for 3H and 14C, RSDpred is from counting terminator. The
terminator for LSC1 is “2 Sigma % = 0.25%”, implyingRSDpred = 0.125%. The terminator for LSC2 and LSC3 is“COUNTS = 640000”, therefore RSDpred =1/6400000.5 ∙ 100%= 0.125%.
25
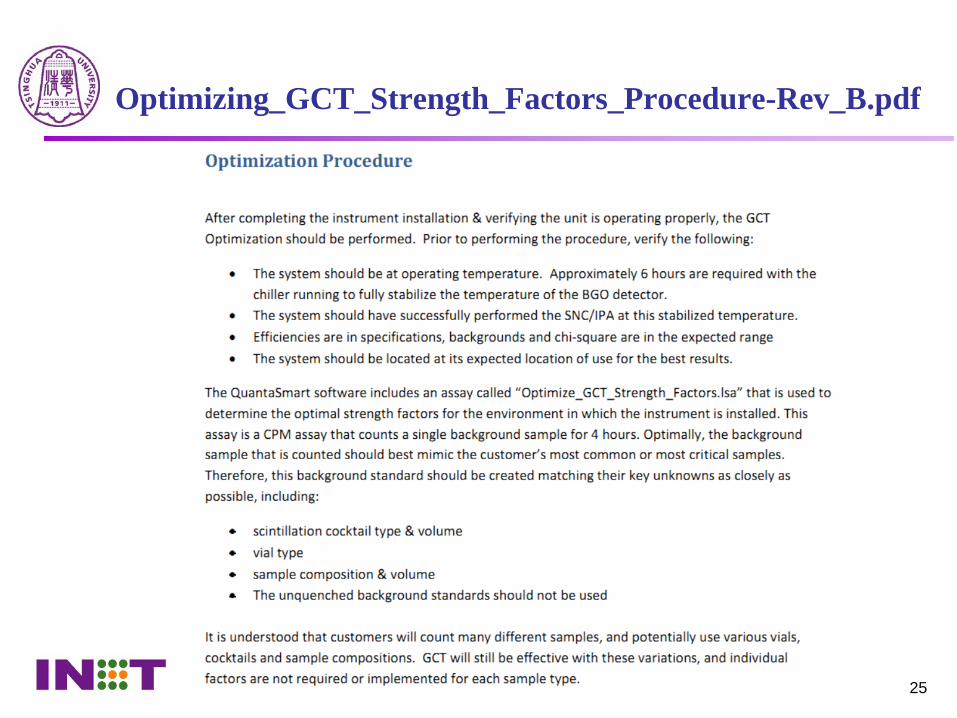
Optimizing_GCT_Strength_Factors_Procedure-Rev_B.pdf
26
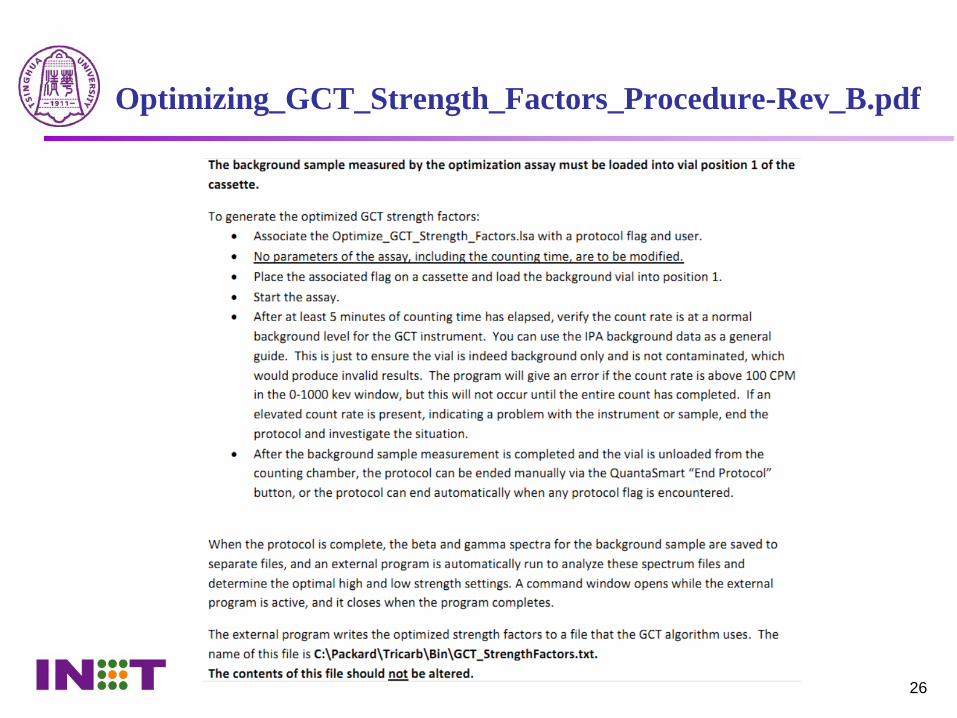
Optimizing_GCT_Strength_Factors_Procedure-Rev_B.pdf