Embed Size (px)
Citation preview

1
A phantom study comparing technical image quality of five breast tomosynthesis sys-
tems
Veli-Matti Sundell1,2, Mikko Jousi3, Katja Hukkinen1, Roberto Blanco4, Teemu Mäkelä1,2, Touko Kaasalainen1,2
1 HUS Medical Imaging Center, Radiology, University of Helsinki and Helsinki University Hospital, Finland
2 Department of Physics, University of Helsinki, Finland
3 Päijät-Hämeen Sosiaali- ja Terveysyhtymä, Central Hospital, Radiology, Finland
4 Medical Imaging Centre of Southwest Finland, Turku University Hospital
Corresponding author:
Veli-Matti Sundell
HUS Medical Imaging Center, Radiology, University of Helsinki and Helsinki University Hospital
P.O. Box 340 (Haartmaninkatu 4),
00290 Helsinki, Finland
Conflict of interest: Mr. Mikko Jousi is a medical advisor for Planmed Oy.
2
A phantom study comparing technical image quality of five breast tomosynthesis sys-
tems
Abstract
Background: Digital breast tomosynthesis (DBT) is a three-dimensional breast imaging method. DBT vendors
employ various approaches in both image acquisition and data processing, which may affect image quality and
radiation exposure to patients.
Objective: This study aimed to evaluate the performance of five DBT systems: Fujifilm Amulet Innovality (using
both a standard mode and high-resolution mode), GE Senographe Essential, Hologic Selenia Dimensions, Planmed
Clarity 3D, and Siemens Mammomat Inspiration.
Materials and methods: The performance of each device and imaging technique was evaluated and compared by
phantom measurements performed with four quality assurance phantoms. Technical image quality assessments
consisted of measuring artefact extent, in-plane resolution, relative noise power spectrum, and geometric accu-
racy.
Results: Artefact spreading varied remarkably between the devices, and the full width at half maximum values of
artefact spread functions varied from 3.5 mm to 10.7 mm. Noticeable in-plane resolution anisotropy, determined
using modulation transfer function (MTF) analysis, was typically observed between tube travel direction and chest
wall-nipple direction. The MTF50 varied from 1.1 mm-1 to 1.6 mm-1 and from 1.5 mm-1 to 4.1 mm-1 in the tube
travel and chest wall-nipple directions, respectively. Moreover, distinctly different noise power spectra were ob-
served between the systems. The geometric accuracy in every system was within 0.5%.
Conclusion: Technical image quality assessments with image quality phantoms revealed remarkable differences in
artefact spread, in-plane resolution, and noise properties between the DBT systems and imaging methods.
Keywords: Digital breast tomosynthesis; Image quality; Quality control

3
1. INTRODUCTION
Digital breast tomosynthesis (DBT) is a novel three-dimensional imaging technique that is used to detect malig-
nancies in breast tissue. Recently, the use of DBT has increased due to higher accuracy compared to conventional
mammography in detecting breast-tissue malignancies [1]. By using DBT, the interference from an overlapping
fibroglandular breast tissue can be reduced, improving the differentiation between malignant and non-malignant
tissue features. The use of DBT in breast cancer screening has been shown to increase cancer detection rate when
used together with digital mammography [2-6], and to reduce the need for recalls [3,5,7,8]. There are, however,
varying results considering DBT’s sensitivity for detecting microcalcifications typically seen in breast cancer [9-
13]. This may partly stem from the differences in scanning and image reconstruction techniques [14].
In DBT, several projection images are acquired while rotating the x-ray tube and, in some systems, the detector
about the breast. . Exposures are made at predetermined intervals and angles. The angular range and scan geometry
vary from one manufacturer to another. The acquired projection images are processed with image reconstruction
algorithms, either filtered back projection (FBP) or iterative reconstruction algorithms. Generally, the tissues in the
in-focus plane are reproduced sharply while the details of higher and lower image planes become blurred. The
image quality is highly dependent on the DBT systems’ geometry, image acquisition method, reconstruction algo-
rithm, and scanning parameters.
Each DBT vendor offers unique technical approaches. The main differences between the systems are the ways of
controlling the x-ray tube motion (continuous or step-and-shoot), detector motion (stationary, rotating, or sync-
and-shoot), the angular range of the x-ray tube rotation in a single acquisition (15–50°), image reconstruction (FBP
or iterative reconstruction algorithms), and other image post-processing features [15,16]. Additionally, the x-ray
tube target material, filter material, detector material, pixel size, and pixel binning vary. Whether and how the
differences in the technical implementations affect the detection and characterization of breast cancer is still under
research. Until now, a few studies have investigated the performance of different DBT systems [17-23]. These
studies and works by Sechopoulos [15] and Mainprize et al. [24] have, for example, indicated that a wide scan
angle range would provide improved depth resolution while a narrow range would improve the in-plane resolution.
Quality control procedures for DBT systems are under active research. European Reference Organisation for Qual-
ity Assured Breast Screening and Diagnostic Services (EUREF) has published quality control protocols for DBT
4
systems [16], and European Federation of Organisations for Medical Physics (EFOMP) has recently approved a
new Working Group on DBT QA procedures [25].
Due to ethical reasons, it is difficult and impractical to compare the performance of several DBT systems for the
same patient. Our phantom study aimed to explore objective and comparable technical image quality in five DBT
systems. We examined artefact spread in z-direction (using artefact spread function, ASF), image resolution in x-
and y-directions (using modulation transfer function, MTF), relative noise power spectra (NPS), and geometric
accuracy. The comparability between different systems requires standardized imaging setups and concise analysis.
The novelty of our work is in that no previous studies have compared all of the presented DBT systems.
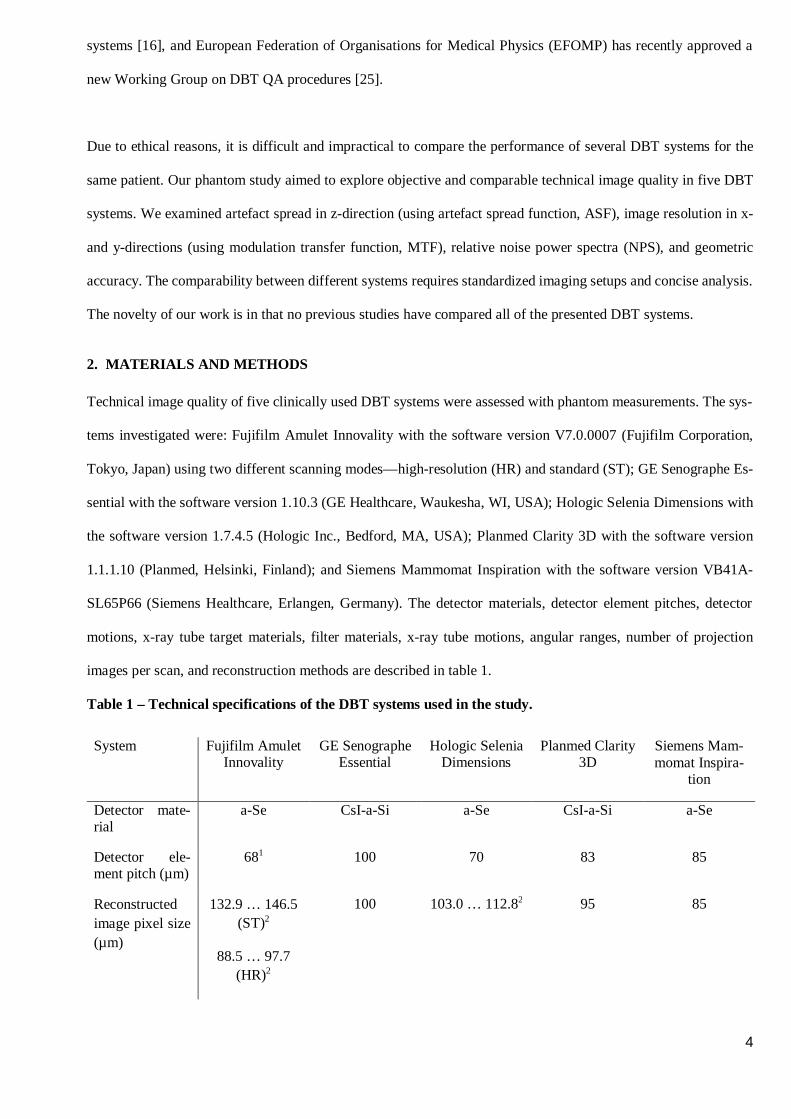
2. MATERIALS AND METHODS
Technical image quality of five clinically used DBT systems were assessed with phantom measurements. The sys-
tems investigated were: Fujifilm Amulet Innovality with the software version V7.0.0007 (Fujifilm Corporation,
Tokyo, Japan) using two different scanning modes—high-resolution (HR) and standard (ST); GE Senographe Es-
sential with the software version 1.10.3 (GE Healthcare, Waukesha, WI, USA); Hologic Selenia Dimensions with
the software version 1.7.4.5 (Hologic Inc., Bedford, MA, USA); Planmed Clarity 3D with the software version
1.1.1.10 (Planmed, Helsinki, Finland); and Siemens Mammomat Inspiration with the software version VB41A-
SL65P66 (Siemens Healthcare, Erlangen, Germany). The detector materials, detector element pitches, detector
motions, x-ray tube target materials, filter materials, x-ray tube motions, angular ranges, number of projection
images per scan, and reconstruction methods are described in table 1.
Table 1 – Technical specifications of the DBT systems used in the study.
System Fujifilm AmuletInnovality
GE SenographeEssential
Hologic SeleniaDimensions
Planmed Clarity3D
Siemens Mam-momat Inspira-
tion
Detector mate-rial
a-Se CsI-a-Si a-Se CsI-a-Si a-Se
Detector ele-ment pitch (µm)
681 100 70 83 85
Reconstructedimage pixel size(µm)
132.9 … 146.5(ST)2
88.5 … 97.7(HR)2
100 103.0 … 112.82 95 85

5
Detector motion Static Static Rotating Rotating duringexposure (Sync-
and-shoot)
Static
X-ray tube tar-get
W Mo/Rh W W W
X-ray filter Al: 700 µm Mo: 30 µm
Rh: 25 µm
Al: 700 µm Rh: 75 µm
Ag: 60 µm
Rh: 50 µm
X-ray tube mo-tion
Continuous Step-and-shoot Continuous Continuous Continuous
Angular range(°)
15 (ST)
40 (HR)
25 15 30 50
Number of pro-jection images
15 9 15 15 25
Reconstructionmethod
FBP Iterative FBP Iterative FBP
1 Detector elements are hexagonally shaped.
2 In Fujifilm and Hologic systems reconstructed pixel size varies along z-axis. Values for this table are taken from
the image planes used in the geometric accuracy measurements.
Dose display accuracies were measured using a RaySafe Xi R/F dosimeter (Unfors RaySafe AB, Billdal, Sweden).
A 45-mm-thick polymethyl methacrylate (PMMA) phantom, simulating a “standard” 50 mm breast with 50% of
adipose tissue and 50% of glandular tissue, was imaged with automatic exposure control. The resulting imaging
parameters (kVp, mAs, and filter/anode) were then applied for the dose measurements performed in air. After
verifying that the DBT systems’ dose display accuracies were within ±12%, we explored system performances
using custom-made image quality phantoms (Figure 1). We measured the ASF in z-direction, in-plane resolutions
in tube travel direction (x-direction) and chest wall-nipple direction (y-direction), relative noise power spectrum,
and geometric accuracy of each system. The phantom configurations, phantom thicknesses, and phantom position-
ing were identical among the systems. Each scan was performed with a 5 daN compression force. Moreover, we
used processed images for evaluating image quality. The reconstructed slices were parallel to the detector plane
and the slice spacing was set to 1 mm. Most of the devices showed pixel size information of each reconstructed
slice in the DICOM (Digital Imaging and Communications in Medicine) header. However, the DICOM metadata
of the Hologic DBT system showed only one pixel size value for the whole image stack. This was determined to
be for the plane in the middle of the imaged object. The pixel size for other image slices was calculated as

6
= ∙
, (1)
where the source-to-image distance was the distance between the x-ray source and the phantom middle. Automatic
exposure control was used in the measurements. Mean glandular doses are given in Appendix 1.
2.1. Artefact extent in z-direction
Small structures can manifest themselves in multiple adjacent slices. This effect is enhanced due to incomplete
angular sampling. To measure the artefact extent, we scanned four bead phantoms and determined the ASF from
the reconstructed images. The PMMA phantoms were 6 cm thick and contained 31 steel beads that each had a
diameter of 1 mm. A phantom image and bead indexing used in the study are shown in figure 2. The ASF meas-
urements were performed at four different depths (all beads positioned to 12 mm, 24 mm, 36 mm, and 48 mm from
the bottom of the phantom). The investigation was limited to the 15 most central beads that were in the useful field
of view of all the DBT systems.
To analyze images, we first made a background gradient subtraction by fitting a first-order two-dimensional poly-
nomial function to the image and subtracting it from the original image. We then calculated individual raw ASFs
for the 15 beads as
( ) =( ) ( )
( ) ( )∙
( )( ) , (2)
where the z represents the z-coordinate of a certain slice, z0 is the in-focus plane of the bead, PVmax is the maximum
pixel value of the bead or artefact in that plane, PVbg is the mean pixel value of the background, and SDbg is the
corresponding standard deviation of the background [21, 26, 27]. The background area was selected to be 100 x
100 pixels and the area to calculate the maximum values of artefacts 150 x 30 pixels.
After calculating the raw ASF, we subtracted the baseline and normalized the ASF with its maximum value. Fur-
thermore, we calculated the full width at half maximum (FWHM) value for each ASF and determined the mean
ASF-FWHM values for each DBT system at four different bead depths. ASF describes the extent of high contrast
object intensity intrusion from the actual location to adjacent slices. Therefore, a small ASF-FWHM is desired and
indicates well localized details without extensive spreading in the z-direction.
7
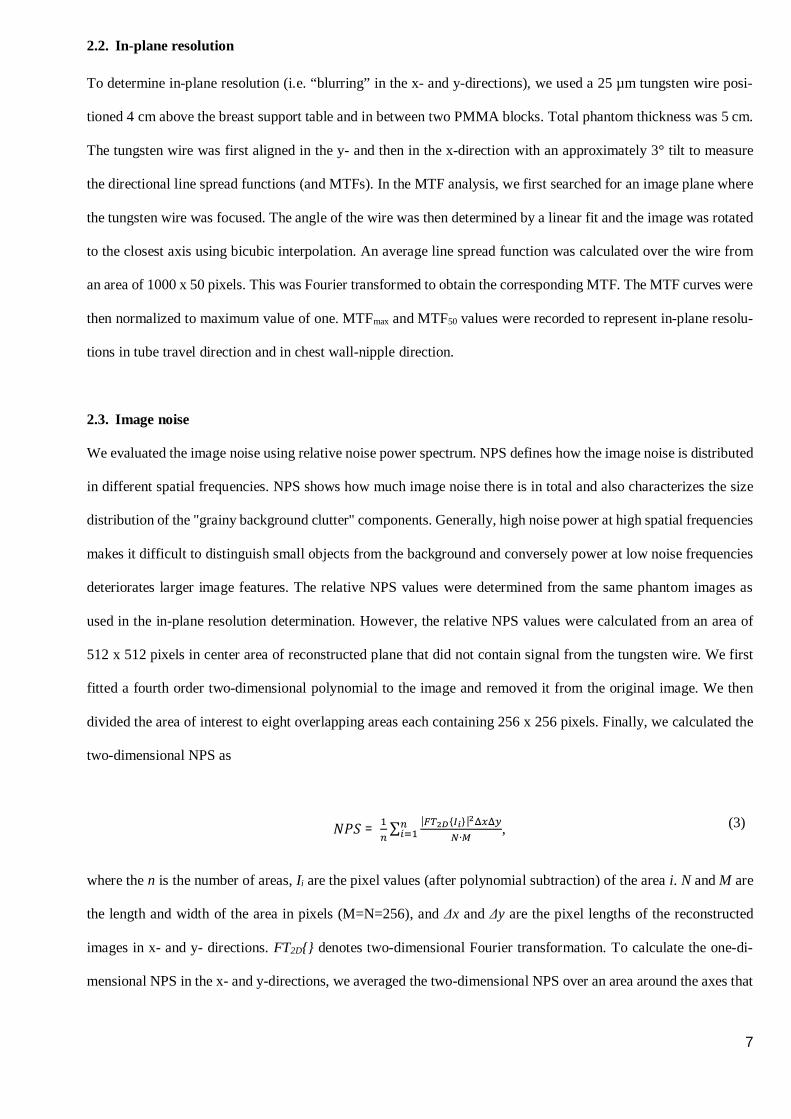
2.2. In-plane resolution
To determine in-plane resolution (i.e. “blurring” in the x- and y-directions), we used a 25 µm tungsten wire posi-
tioned 4 cm above the breast support table and in between two PMMA blocks. Total phantom thickness was 5 cm.
The tungsten wire was first aligned in the y- and then in the x-direction with an approximately 3° tilt to measure
the directional line spread functions (and MTFs). In the MTF analysis, we first searched for an image plane where
the tungsten wire was focused. The angle of the wire was then determined by a linear fit and the image was rotated
to the closest axis using bicubic interpolation. An average line spread function was calculated over the wire from
an area of 1000 x 50 pixels. This was Fourier transformed to obtain the corresponding MTF. The MTF curves were
then normalized to maximum value of one. MTFmax and MTF50 values were recorded to represent in-plane resolu-
tions in tube travel direction and in chest wall-nipple direction.
2.3. Image noise
We evaluated the image noise using relative noise power spectrum. NPS defines how the image noise is distributed
in different spatial frequencies. NPS shows how much image noise there is in total and also characterizes the size
distribution of the "grainy background clutter" components. Generally, high noise power at high spatial frequencies
makes it difficult to distinguish small objects from the background and conversely power at low noise frequencies
deteriorates larger image features. The relative NPS values were determined from the same phantom images as
used in the in-plane resolution determination. However, the relative NPS values were calculated from an area of
512 x 512 pixels in center area of reconstructed plane that did not contain signal from the tungsten wire. We first
fitted a fourth order two-dimensional polynomial to the image and removed it from the original image. We then
divided the area of interest to eight overlapping areas each containing 256 x 256 pixels. Finally, we calculated the
two-dimensional NPS as
= ∑ | { }|∙
, (3)
where the n is the number of areas, Ii are the pixel values (after polynomial subtraction) of the area i. N and M are
the length and width of the area in pixels (M=N=256), and Δx and Δy are the pixel lengths of the reconstructed
images in x- and y- directions. FT2D{} denotes two-dimensional Fourier transformation. To calculate the one-di-
mensional NPS in the x- and y-directions, we averaged the two-dimensional NPS over an area around the axes that

8
was ±7 pixels wide excluding the axes themselves. Finally, the one-dimensional NPS curve was divided by its
maximum value to obtain the relative NPS curve.
2.4. Geometric accuracy
The geometric accuracy phantom contained two 3-cm-thick PMMA plates and one thin metallic plate with en-
graved marks. Engraved marks were at a known distance from each other. The plate was imaged at three different
heights: beneath 6 cm of homogeneous PMMA plates (denoted henceforth as height 0 cm), in between the PMMA
plates (3 cm), and on top of the PMMA plates (6 cm). The measured distances between the marked points in the
phantom were compared to the known values (120 mm and 100 mm). Additionally, the artefacts produced by the
objects in the phantom were evaluated visually.
3. RESULTS
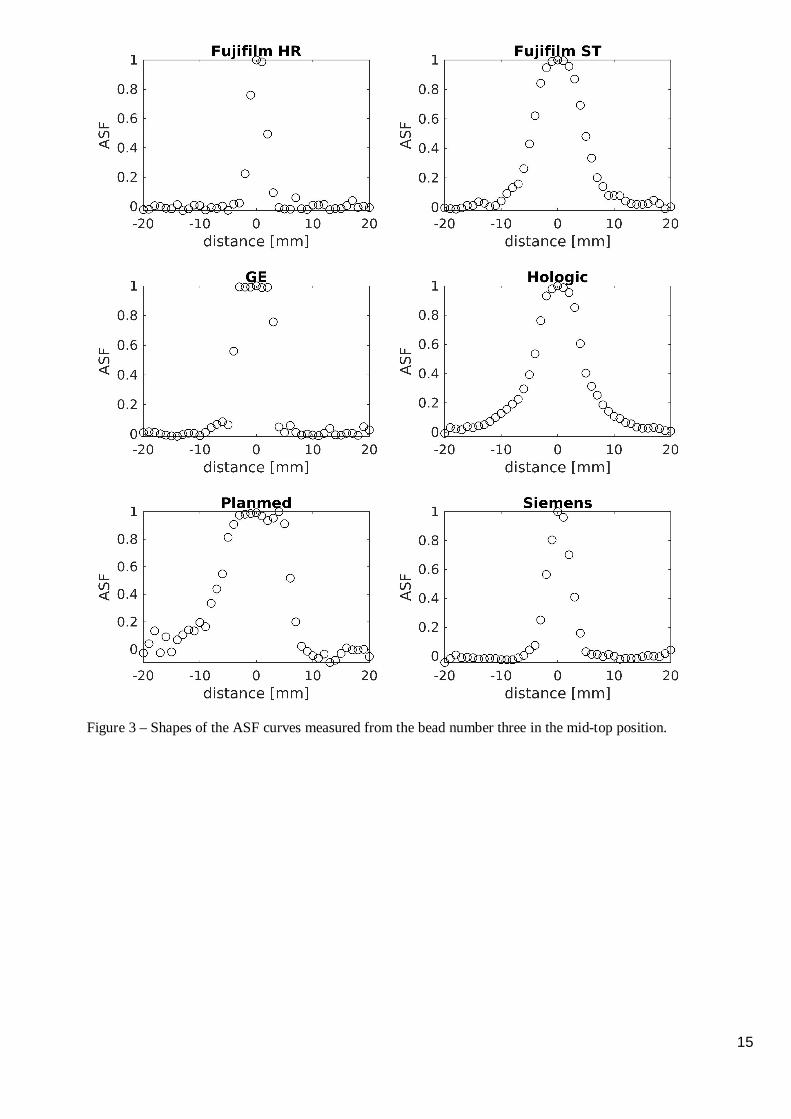
3.1. Artefact spread function
Table 2 shows the mean (± standard deviation) ASF-FWHM values measured for each DBT system at four bead
heights. Noticeable differences in the ASF values were observed between the systems. Additionally, a small de-
pendency on the bead depth was also observed. In most systems, ASF-FWHM values decreased when beads were
closer to the top position (exception being Fujifilm HR and Planmed systems). The highest ASF-FWHM values
were observed for the Planmed system, whereas the Fujifilm DBT system using HR imaging technique produced
the lowest ASF values. In addition to FWHM, differing ASF shapes were also observed. This can be seen in figure
3 for the bead number three in the mid-top position.
Table 2 – ASF-FWHM values (mean ± std) measured for different DBT systems in four different beadheights (measured from the bottom).
ASF-FWHM
DBT systemBottom (12 mm)
[mm]
Mid-bottom (24 mm)
[mm]
Mid-top (36 mm)
[mm]
Top (48 mm)
[mm]
Fujifilm HR 3.5 ± 0.1 3.6 ± 0.1 3.5 ± 0.1 3.5 ± 0.1
Fujifilm ST 9.8 ± 0.1 9.5 ± 0.1 9.4 ± 0.1 9.1 ± 0.2
GE 7.7 ± 0.3 7.5 ± 0.3 7.4 ± 0.1 7.1 ± 0.1
Hologic 9.1 ± 0.1 9.0 ± 0.4 8.7 ± 0.1 8.6 ± 0.2
Planmed 10.3 ± 1.9 10.2 ± 2.2 10.7 ± 1.9 10.6 ± 1.7

9
Siemens 5.1 ± 0.1 4.9 ± 0.7 4.7 ± 0.5 4.5 ± 0.1
3.2. In-plane resolution
Table 3 shows the MTFmax and MTF50% values in the tube travel and chest wall-nipple directions. The MTF curves
shown in figure 4 show noticeable differences in the resolutions between the DBT systems. The resolution was
higher in the y-direction than in the x-direction in all systems: the MTF50 values in the tube travel direction were
14-69% lower compared to the chest wall-nipple direction. The Planmed DBT system had an almost isotropic
resolution whereas other DBT systems had highly anisotropic resolution. Moreover, the corresponding shifts in the
MTFmax positions can also be seen.
Table 3 – Spatial frequencies of MTFmax and MTF50 in the tube travel direction (x) and chest wall-nippledirection (y).
DBT systemFrequency in tube travel direction [1/mm] Frequency in chest wall-nipple direction [1/mm]
MTFmax MTF50 MTFmax MTF50
Fujifilm HR 0.6 1.3 1.9 4.1
Fujifilm ST 0.6 1.3 1.2 2.8
GE 0.3 1.3 1.4 3.5
Hologic 0.4 1.6 1.0 3.0
Planmed 0.3 1.4 0.5 1.5
Siemens 0.4 1.1 1.6 3.0
3.3. Image noise
Figure 5 shows the two-dimensional noise power spectra for the DBT systems. These are unique for all the studied
systems. Figure 6 presents the corresponding relative NPS curves in the tube travel direction and chest wall-nipple
direction. Hologic, GE and Planmed demonstrated similar noise textures between the directions whereas Fujifilm
system showed the largest directional dependence as can be seen in the relative NPS curve shapes. Fujifilm HR
deviated from the ST mode especially at higher frequencies in the tube travel direction.

10
3.4. Geometric accuracy
Measured distances in the tube travel and chest wall-nipple directions are shown in table 4. The mean distances
were mostly within 0.2 mm from the ground truth with the exceptions of Siemens and Hologic. In the Siemens
DBT system, the reproduced distances were within 0.1 mm in the tube travel and within 0.5 mm in the chest wall-
nipple direction. Conversely, in the Hologic system, the measured distances were within 0.4 mm from the ground
truth in the tube travel and within 0.2 mm in the chest wall-nipple direction. The clinical significance of these
accuracies was not evaluated.
Table 4 – Measured distances (± error) in the tube travel and chest wall-nipple directions. Propagation ofuncertainty was used to estimate error. Measurement accuracy was ±1 pixel and pixel size was assumed tobe accurate. The true lengths were 120 mm and 100 mm, respectively.
Measured distances in tube travel direction[mm]
Measured distances in chest wall-nipple direction[mm]
DBT system Bottom Center Top Bottom Center Top
Fujifilm HR 120.1 ± 0.1 119.8 ± 0.1 120.0 ± 0.1 100.1 ± 0.1 99.9 ± 0.1 100.0 ± 0.1
Fujifilm ST 120.1 ± 0.2 120.2 ± 0.2 120.1 ± 0.2 100.1 ± 0.2 100.2 ± 0.2 100.2 ± 0.2
GE 120.0 ± 0.1 119.9 ± 0.1 120.0 ± 0.1 100.0 ± 0.1 99.9 ± 0.1 99.9 ± 0.1
Hologic 120.3 ± 0.2 120.2 ± 0.2 120.4 ± 0.1 100.1 ± 0.2 100.1 ± 0.2 100.2 ± 0.1
Planmed 120.1 ± 0.1 120.0 ± 0.1 120.1 ± 0.1 99.9 ± 0.1 99.8 ± 0.1 100.0 ± 0.1
Siemens 119.9 ± 0.1 120.1 ± 0.1 119.9 ± 0.1 100.3 ± 0.1 100.4 ± 0.1 100.5 ± 0.1
4. DISCUSSION
In this study, we compared the technical image quality of five DBT systems. The added value of DBT in breast
cancer screening has been shown in several publications. Large clinical trials employing Selenia Dimension DBT
equipment have been reported: OTST trial (n = 12 621 patients [2-3]); Storm trial (n = 7 292 patients [4]); Rose et
al. (n = 9 499 patients [7]); Haas et al. (n = 6100 patients [8]); and Friedewald et al. (n = 173 663 patients [5]). The
Malmö Breast tomosynthesis screening trial (n = 7500 patients) was done with a Siemens Mammomat Inspiration
DBT system [6]. Inter-comparison between different manufacturers’ DBT units has been limited. The proper use
of DBT is also under debate. Furthermore, it is unclear whether the acquisition technique, scanning geometry, and
reconstruction method affect lesion detectability. According to the current knowledge, DBT should be used in
adjunct to two-dimensional mammography. Our phantom study with five DBT systems aimed to investigate

11
whether there are differences in the technical image quality between the systems. One vendor had two scanning
options for DBT imaging, and thus, we compared altogether six different setups.
Previously, a few publications have investigated the performance of different DBT systems [17-23]. These studies
have compared, for example, the detector performance, automatic exposure control (AEC) performance, and image
quality. Strudley et al. [17-19] compared the performance of Siemens Mammomat Inspiration and Hologic Selenia
Dimensions DBT systems. Additionally, Strudley et al. [20] examined the performance of GE SenoClaire in a
similar manner. Moreover, Rodríguez-Ruiz et al. [21] examined the performance of three different systems (Sie-
mens Mammomat Inspiration, Hologic Selenia Dimensions, and Fujifilm Amulet Innovality), whereas in a study
by Maldera et al. [22] four different DBT systems (Siemens Mammomat Inspiration, Hologic Selenia Dimensions,
Fujifilm Amulet Innovality, and GE Senographe Essential) were investigated. Complementing the previous studies,
we included Planmed Clarity in the comparisons. Similar to the current study, the aforementioned studies focused
on technical imaging parameters and none of the studies investigated how a human observer can detect different
objects in DBT images. Comparing previously published results may also be difficult as, for example, the software
versions and reconstruction algorithms may vary. For example, in a study of Rodríguez-Ruiz et al. [21], the quality
control mode was used for the Fujifilm system, resulting in a different pixel binning compared to our study. The
reconstructed pixel size in their study was 100 µm / 50 µm for the ST and HR modes whereas 150 µm / 100 µm
was used in our study due to the clinical operation modes used in our investigations. Additionally, the phantoms
and analyzing method implementations may differ from study to study.
We found noticeable differences in technical image quality between the DBT systems. The ASF curve shapes vary
considerably between the systems. The smallest ASF-FWHM values were found in the Fujifilm HR system and
the highest in the Planmed DBT system. The ASF-FWHM values also varied in the Planmed system more than the
other DBT systems. The x-ray tube rotation range seemingly affected the ASF-FWHM values: in most cases, the
ASF-FWHM decreased when increasing the angular range of x-ray tube rotation. This supports the findings made
by Rodríguez-Ruiz et al. [21] and Hu et al. [27]. However, the Planmed DBT system resulted in higher ASF-
FWHM values compared to Hologic and Fujifilm ST systems, although the Planmed DBT system used a higher
angular range for x-ray tube rotation. We assume this to be related to different reconstruction methods and differ-
ences in the acquisition processes. The Planmed system uses a continuous sync-and-shoot image acquisition
method, where the detector (and the breast or the phantom) rotates during the projection image acquisitions and

12
always returns to its home position between the projections. Planmed also uses an iterative reconstruction algo-
rithm. Furthermore, we also found lower ASF-FWHM values in the Fujifilm HR system compared to the Siemens
system even though the angular range of the x-ray tube rotation was smaller in the Fujifilm HR. Moreover, the
ASF-FWHM values seemed to increase in most of the DBT systems when the bead depths in the PMMA phantom
were reduced in the z-direction. Exceptions to this rule were found in Planmed and Fujifilm HR systems. The ASF-
FWHM differences between the bead depths are mostly in accordance with Rodríguez-Ruiz et al. [21]. Moreover,
when comparing our ASF measurement results in the mid-top bead position to those of Rodríguez-Ruiz et al. [21],
the mean ASF-FWHM values measured in the Siemens system were 1.0 mm higher than in their measurements. In
our study, we measured ASF-FWHM values to be 2.0 mm and 0.5 mm smaller than they measured for Fujifilm
DBT system using ST-mode and HR-mode, respectively. In the case of the Hologic system, our measurements
yielded similar results to Rodríguez-Ruiz et al. [21]
Similar to ASF measurements, we also noticed differences in in-plane resolutions between the systems in our MTF
measurements performed both in tube travel direction and chest wall-nipple direction. The image resolution was
particularly higher in the chest wall-nipple direction compared to tube travel direction in each equipment except
the Planmed DBT system. The Planmed system resulted in the most comparable MTF values between the two
directions. The variation in MTF values between the DBT systems was notably smaller in tube travel direction
compared to chest wall-nipple direction. Compared to the Rodríguez-Ruiz et al. [21] study, we observed lower (-
0.6 to 0.0 mm-1) MTF50 values in the tube travel direction, with 25 µm tungsten wire for the Siemens, Hologic, and
Fujifilm systems. However, we measured slightly higher (0.2 to 0.4 mm-1) MTF50 values in the chest wall-nipple
direction compared to their study, except in the case of the Siemens system, with which we measured lower (-0.3
mm-1) MTF50 values.
Our image-noise analysis showed clear differences between the studied DBT systems. Both resolution and noise
were directionally dependent, but the extent of anisotropicity was unique to each system. This may lead to vastly
differing clinical image textures but also differences in malignancy conspicuity. The low noise power in the x-axis
may result from ramp-like filters applied to the projection images [26]. The Planmed system NPS curves differed
from the other systems probably due to different image reconstruction algorithms and reconstructed image pixel
size. The Planmed system also had highly isotropic resolution (see the MTF curves in Figure 4) when compared to
the others, and the noise can be seen at these same (in the y-direction relatively low) frequencies. This causes the

13
image noise to appear larger (“grainier”). Geometric accuracy was good overall, although small deviations were
found in the Siemens and Hologic systems.
Our study has certain limitations. First and foremost, the phantom images are never a complete substitute for patient
acquisitions. Metallic high-contrast targets, both beads and wires, have greater attenuation than the microcalcifica-
tions seen in real breast tissue. We also failed to assess the low-contrast detectability in our study. Noise and reso-
lution may have various non-linear contrast and dose dependencies due to differences in the reconstruction algo-
rithms. In addition, we did not harmonize the dose levels between the systems, but instead used an automatic
exposure control in our measurements. This choice may introduce limitations to the inter-device comparability.
The rapid development of the imaging techniques and reconstruction algorithms (also in the form of software up-
dates to existing setups) complicates the definite comparison between the systems.
5. CONCLUSION
This phantom study evaluated the technical image quality of five digital breast tomosynthesis devices. The systems
have different technical and data processing solutions, leading to notable differences in the obtained results. The
in-plane resolution was higher in the chest wall-nipple direction than in the tube travel direction in all the systems.
The ASF-FWHM values varied remarkably between the systems, for which the angular range of the system seemed
to be a contributing factor. A wider angular range tended to reduce artefact spreading in the z-direction. Further-
more, differences in the noise properties of the devices were observed. The geometric accuracy of all the systems
was within 0.5%.
ACKNOWLEDGEMENTS
The authors are grateful to Planmed Oy for borrowing phantoms.
Funding: This study was supported by Helsinki University Hospital research funding.

14
FIGURE CAPTIONS
Figure 1 – Image quality phantoms that were used in this study: A) a wire phantom was used to measure MTF, B)a bead phantom was used to measure artefact spread function, and C) a geometric accuracy phantom was usedtogether with PMMA plates to determine the geometric accuracy at different heights.
Figure 2 – A reconstructed phantom image of the bead plane from Fujifilm Amulet Innovality (HR mode) system.Bead numbers 1-15 were used in the comparison. A grey square indicates the background area and white squaresthe maximum artefact search areas used to calculate the ASF. The 5 cm long line in top right corner is to give ascale to image.
15
Figure 3 – Shapes of the ASF curves measured from the bead number three in the mid-top position.

16
Figure 4 – MTF curves in the tube travel direction (left) and in the chest wall-nipple direction (right).
Figure 5 – The logarithm of two-dimensional noise power spectra, calculated from the center area of the recon-structed plane, are distinctly unique for all the studied DBT systems.

17
Figure 6 – Relative NPS curves in the tube travel direction (left) and in the chest wall-nipple direction (right).
REFERENCES
[1] Clark CR, Tosteson TD, Tosteson ANA, Onega T, Weiss JE, Harris KA, et al. Diffusion of digital breast
tomosynthesis among women in primary care: associations with insurance type, Cancer Medicine 2017;
6(5):1102–1107
[2] Skaane P, Bandos AI, Gullien R, Eben EB, Ekseth U, Haakenaasen U, et al. Prospective trial comparing
full-field digital mammography (FFDM) versus combined FFDM and tomosynthesis in a population-
based screening programme using independent double reading with arbitration. Eur Radiol 2013;23:2061-
71.
[3] Skaane P, Bandos AI, Gullien R, Eben EB, Ekseth U, Haakenaasen U, et al. Comparison of digital
mammography alone and digital mammography plus tomosynthesis in a population-based screening
program. Radiology 2013;267:47–56.
[4] Ciatto S, Houssami N, Bernardi D, Caumo F, Pellegrini M, Brunelli S, et al. Integration of 3D digital
mammography with tomosynthesis for population breast-cancer screening (STORM): A prospective
comparison study. Lancet Oncol 2013;14:583–9.
[5] Friedewald SM, Rafferty EA, Rose SL, Durand MA, Plecha DM, Greenberg JS, et al. Breast Cancer
Screening Using Tomosynthesis in Combination With Digital Mammography. Jama 2014;311:2499.
[6] Lång K, Andersson I, Rosso A, Tingberg A, Timberg P, Zackrisson S. Performance of one-view breast
tomosynthesis as a stand-alone breast cancer screening modality: results from the Malmö Breast

18
Tomosynthesis Screening Trial, a population-based study. Eur Radiol 2016;26:184–90.
[7] Rose SL, Tidwell AL, Bujnoch LJ, Kushvaha AC, Nordmann AS, Sexton R. Implementation of breast
tomosynthesis in a routine screening practice: An observational study. Am J Roentgenol 2013;200:1401-
8.
[8] Haas BM, Kalra V, Geisel J, Raghu M, Durand M, Philpotts LE. Comparison of tomosynthesis plus
digital mammography and digital mammography alone for breast cancer screening. Radiology
2013;269:694–700.
[9] Spangler ML, Zuley ML, Sumkin JH, Abrams G, Ganott MA, Hakim C, et al. Detection and classification
of calcifications on digital breast tomosynthesis and 2D digital mammography: A comparison. Am J
Roentgenol 2011;196:320–4.
[10] Tagliafico A, Mariscotti G, Durando M, Stevanin C, Tagliafico G, Martino L, et al. Characterisation of
microcalcification clusters on 2D digital mammography (FFDM) and digital breast tomosynthesis (DBT):
does DBT underestimate microcalcification clusters? Results of a multicentre study. Eur Radiol
2014;25:9–14.
[11] Kopans D, Gavenonis S, Halpern E, Moore R. Calcifications in the breast and digital breast
tomosynthesis. Breast J 2011;17:638–44.
[12] Michell MJ, Iqbal A, Wasan RK, Evans DR, Peacock C, Lawinski, et al. A comparison of the accuracy of
film-screen mammography, full-field digital mammography, and digitalbreast tomosynthesis. Clin Radiol
2012;67:976-81.
[13] Poplack SP, Tosteson TD, Kogel CA, Nagy HM. Digital breast tomosynthesis:initial experience in 98
women with abnormal digital screeningmammography. AJR Am J Roentgenol 2007;189:616-23.
[14] Gilbert FJ, Tucker L, Young KC. Digital breast tomosynthesis (DBT): a review of the evidence for use as
a screening tool. Clin Radiol 2016;71:141-150.
[15] Sechopoulos I. A review of breast tomosynthesis. Part I. The image acquisition process. Med Phys
2013;40(1):014301.
[16] EUREF, Protocol for the Quality Control of the Physical and Technical Aspects of Digital Breast Tomo-
synthesis Systems version 1.01, 2016.
[17] Strudley CJ, Looney P, Young KC. Technical evaluation of Hologic Selenia Dimensions digital breast
tomosynthesis system v2, National Health Services Breast Screening Program Equipment Report 1307,
2014.

19
[18] Strudley CJ, Warren LM, Young KC. Technical evaluation of Siemens Mammomat Inspiration digital
breast tomosynthesis system v2. National Health Services Breast Screening Program Equipment Report
1306, 2015.
[19] Strudley CJ, Young KC, Looney P, Gilbert FJ. Development and experience of quality control methods
for digital breast tomosynthesis systems. Br J Radiol 2015;88:20150324.
[20] Strudley CJ, Oduko JM, Young KC. Technical evaluation of GE Healthcare SenoClaire digital breast
tomosynthesis system, National Health Services Breast Screening Program Equipment Report 1404, 2016.
[21] Rodríguez-Ruiz A, Castillo M, Garayoa J, Chevalier M. Evaluation of the technical performance of three
different commercial digital breast tomosynthesis systems in the clinical environment. Phys Med
2016;32:767–77.
[22] Maldera A, De Marco P, Colombo PE, Origgi D, Torresin A, Digital breast tomosynthesis: Dose and im-
age quality assessment, Physica Medica 2017;33:56-67.
[23] Marshall NW, Bosmans H. Measurements of system sharpness for two digital breast tomosynthesis sys-
tems. Phys Med Biol 2012;57:7629-50.
[24] Mainprize JG, Bloomquist A, Wang X, Martin JY. Dependence of image quality on geometric factors in
breast tomosynthesis. Med Phys 2011;38:3090-103.
[25] https://www.efomp.org/ (accessed 17th April 2019).
[26] Wu T, Moore RH, Rafferty EA, Kopans DB. A comparison of reconstruction algorithms for breast tomo-
synthesis. Med Phys 2004;31:2636–47.
[27] Hu YH, Zhao B, Zhao W. Image artifacts in digital breast tomosynthesis: Investigation of the effects of
system geometry and reconstruction parameters using a linear system approach. Med Phys
2008;35(12):5242–52.
20
Appendix 1: Mean glandular doses in the phantom measurements
Table 5 – Mean glandular doses in the MTF measurements.DBT system Mean glandular dose
Y-MTF [mGy] X-MTF [mGy]
Fujifilm HR 3.34 3.34
Fujifilm ST 3.35 3.35
GE 0.76 0.76
Hologic 1.50 1.47
Planmed 1.61 1.61
Siemens 0.63 0.62
Table 6 – Mean glandular doses in the ASF measurements.
Mean glandular dose
DBT systemBottom (12 mm)
[mGy]
Mid-bottom (24 mm)
[mGy]
Mid-top (36 mm)
[mGy]
Top (48 mm)
[mGy]
Fujifilm HR 3.47 3.35 3.35 3.47
Fujifilm ST 2.07 2.07 2.07 2.27
GE 1.76 1.74 1.70 1.74
Hologic 2.00 1.95 2.00 1.96
Planmed 1.84 1.84 1.89 1.88
Siemens 2.12 2.07 2.07 2.12
Table 7 – Mean glandular doses in the geometric accuracy measurements.
Mean glandular dose
DBT system Bottom [mGy] Center [mGy] Top [mGy]
Fujifilm HR 2.33 2.33 2.33
Fujifilm ST 2.33 2.33 2.33
GE 2.38 2.38 2.41
Hologic 3.11 3.08 3.11
Planmed 1.94 2.26 1.95
Siemens 2.21 2.21 2.21

![933 dji phantom-4 spec-sheet-rev[1] - PLASTICASE · 2019. 10. 23. · 933 DJI™ PHANTOM 4 For all DJI™ Phantom 4 models Phantom 4 Phantom 4 Pro Phantom 4 Pro + 2.0 Phantom 4 RTK](https://img.pdfslide.net/doc/110x75/60c827405a7e465133218fc4/933-dji-phantom-4-spec-sheet-rev1-plasticase-2019-10-23-933-djia-phantom.jpg)