Embed Size (px)
Citation preview

10
A Power Quality Monitoring System
Via the Ethernet Network Based on the Embedded System
Krisda Yingkayun1 and Suttichai Premrudeepreechacharn2 1Rajamangala University of Technology Lanna,
2Chiang Mai University
Thailand
1. Introduction
The problems about power quality have increasingly caused a failure or a malfunction of the
end user equipment for the past few years up to now. The problems have concerned with
either voltage or current frequency deviation. To have the power quality monitoring done
flowingly and completely, the measurement takes an important role on voltage, current,
frequency, harmonic distortion and waveforms. Many researchers have used methods of
power quality measurement (Dugan et al., 2002; Baggini, 2008) while other researchers have
used various protocols to control the system (Auler & d’Amore, 2002). Others have
presented the data acquisition based on PC (Batista et al., 2003) or Power Line
Communication (Hong et al., 2005) or TMS320CV5416 DSP Processor (Rahim bin Abdullah
& Zuri bin Sha’ameri, 2005). Another researcher has applied ARM and DSP processor (Yang
& Wen, 2006) or has only applied DSP processor (Salem et al., 2006) to monitoring power
quality in real time. In the meantime, the detecting fault signals of power fluctuation in real
time and a power quality monitoring for real-time fault detection using real-time operating
system (RTOS) are proposed (Yingkayun & Premrudeepreechacharn, 2008,2009) and the
low cost power quality monitoring system is suggested (So et al., 2000; Auler & d’Amore,
2009), for example.
This chapter has developed the idea of power quality monitoring system via the Ethernet
network based on the embedded system with the two selected ARM7 microcontrollers:
ADUC7024 and LPC2368. On account of ADUC7024, it has a function of sampling
waveforms and of writing the sampling signals to the external memory. Meanwhile,
LPC2368 can execute the main tasks: detecting the fault signals; storing fault data in SD-
CARD up to 2 GB; and communicating with PC or laptop via the Ethernet network. The
power quality monitoring on the embedded system suggested can acquire the voltage, the
status and the frequency. It can send them via network at real time, can operate as stand
alone equipment and can display the fault signals in real time of power fluctuation. But
anyhow, when being absent, we can download the fault data from the site place, depending
on the program configuration. In this case the fault signals can be displayed on the screen of
the PC or laptop at real time or can be done after as desired. Moreover, there can be a single
www.intechopen.com
Electrical Generation and Distribution Systems and Power Quality Disturbances
232
phase or a 3-phase voltage measurement supported by the power quality monitoring
hardware. When working in different places, we can establish the network in various sites
and connect via the Ethernet network from a single PC or laptop. The network has the
capability to send from the board site to the PC or laptop with high speed up to 100 megabit
per second (Mb/ s). Nevertheless, it is easy to monitor the power quality monitoring system
via the Ethernet network from PC or laptop.
This chapter is organized as follow: Section 2 is the architecture of the power quality
monitoring being composed of 2 sets of ARM7 microcontroller boards, 3 signal conditioning
modules, external memory board and energy measurement board. Section 3 is the
embedded software design with the details of sampling concept, power quality monitoring
concept, data frames, configuration data and Ethernet packet structures. Section 4 is the
application software to interface the power quality monitoring hardware. Section 5 is the
experimental results which are displaying the fault signals from AC lines while being on
operation or being done after. Section 6 is the conclusion from the research with the future
work suggestion.
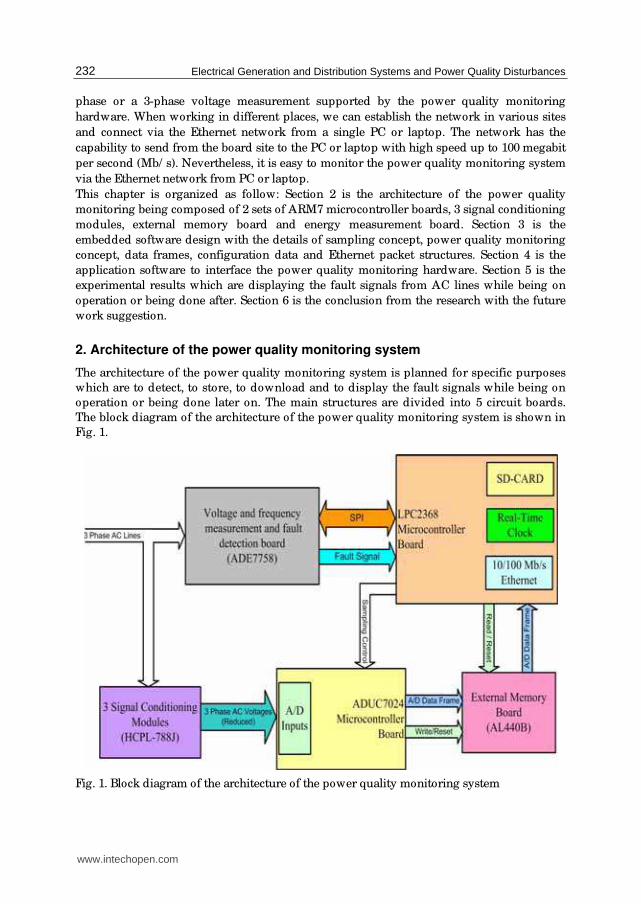
2. Architecture of the power quality monitoring system
The architecture of the power quality monitoring system is planned for specific purposes
which are to detect, to store, to download and to display the fault signals while being on
operation or being done later on. The main structures are divided into 5 circuit boards.
The block diagram of the architecture of the power quality monitoring system is shown in
Fig. 1.
Fig. 1. Block diagram of the architecture of the power quality monitoring system
www.intechopen.com

A Power Quality Monitoring System Via the Ethernet Network Based on the Embedded System
233
2.1 Signal conditioning modules (HCPL-788J) There are actually 3 signal conditioning modules with 3 HCPL-788J integrated circuits for
measuring the voltage of the three-phase AC lines in order to send the attenuated AC
voltage to the waveform sampling board which the ADUC7024 microcontroller is
embedded in. The 3 signal conditioning modules have used the same electronic circuit. The
signal conditioning circuit is shown in Fig. 2.
Fig. 2. The circuit of the signal conditioning module
2.2 The voltage and frequency measurement and fault detection board (ADE7758) This board is the key part of monitoring system of fault detection which refers to sags and
overvoltages. In this chapter, ADE7758 integrated circuit has been chosen to operate because
of its suitable qualification to detect the fault signals in time. The circuit of the board is
shown in Fig. 3.
2.3 Microcontroller boards (ADUC7024 and LPC2368) As it is known that the embedded system with the two selected ARM7 microcontrollers
which are ADUC7024 and LPC2368 are the developed microcontroller boards, using in this
chapter. The first board is used for sampling waveforms and for writing the sampling
signals to the external memory and the latter is used for various purposes: (1) reading
voltage, frequency and fault detection from ADE7758; (2) storing fault data in SD-CARD up
to 2 GB, for communicating with PC or laptop via the Ethernet Network and; (3) controlling
the sampling process of the ADUC7024 board. The picture of the two microcontroller boards
are shown in Fig. 4 and Fig. 5.
www.intechopen.com

Electrical Generation and Distribution Systems and Power Quality Disturbances
234
Fig. 3. The circuit of the voltage and frequency measurement and fault detection board
www.intechopen.com

A Power Quality Monitoring System Via the Ethernet Network Based on the Embedded System
235
Fig. 4. The development board of ADUC7024 microcontroller
Fig. 5. The development board of LPC2368 microcontroller
2.4 External memory board (AL440B) This external memory board is one device of this power quality monitoring architecture to
collect the fault data from ADUC7024 microcontroller into its memory in series. The data
will be read by the LPC2368 microcontroller board and will be stored in SD-CARD for
recalling or downloading later via the Ethernet network when of necessity needed. The
circuit of the external memory board is shown in Fig. 6.
www.intechopen.com

Electrical Generation and Distribution Systems and Power Quality Disturbances
236
Fig. 6. The circuit of the external memory board
2.5 The process of the power quality monitoring system The picture of the power quality monitoring system hardware is shown in Fig. 7, consisting
of five parts as the followings:
1. The voltage and frequency measurement and fault detection board (ADE7758)
2. Signal conditioning module board (HCPL-788J)
3. ADUC7024 microcontroller board
4. LPC2368 microcontroller board
5. External memory board (AL440B)
From the architecture planned, the 3-phase AC lines connect to ADE7758 and to HCPL-788J
for being measured of their voltages and frequencies by the ADE7758 board which is
interfaced with the LPC2368 microcontroller board in order to acquire the voltage and
frequency values and also to initialize the ADE7758 for detecting fault signal at one time.
Then the HCPL-788J attenuates the voltage inputs and isolates the output signals. After that,
the output signal is sent to become the signal inputs to the ADUC7024 microcontroller board
for sampling waveforms and writing the sampling signals to the external memory board. In
the ordinary state, the ADUC7024 microcontroller board will do the sampling and will write
www.intechopen.com

A Power Quality Monitoring System Via the Ethernet Network Based on the Embedded System
237
the data frames continuously, and in the same time, the LPC2368 microcontroller board will
attain the voltage and frequency data from ADE7758, as well.
Fig. 7. The power quality monitoring system hardware
If the fault signal which is detected , in case, is an uncommon state, LPC2368 microcontroller
board will control the ADUC7024 board to stop sampling and writing process temporarily,
will read the sampling signal from the external memory board and will store the signal into
SD-CARD. When it comes to the normal condition, both the microcontroller board will go
back to their usual tasks as before.
In case of the network that has the connection with Transmission Control Protocol/ Internet
Protocol (TCP/ IP) and User Datagram Protocol (UDP) is established between the LPC2368
and the PC or laptop, we can monitor the status of power quality monitoring system
hardware via the network in real time. In addition, the fault data can be downloaded from
the SD-CARD and displayed later when it is necessarily needed.
3. Embedded software design
The embedded software design is a flowchart of the two selected microcontrollers:
ADUC7024 and LPC2368 used in this chapter. It is to explain the process of the power
quality monitoring system based on the embedded system. For this embedded software
design, there are the sampling concept, the power quality monitoring concept, data frame
and the Ethernet packet structures.
www.intechopen.com

Electrical Generation and Distribution Systems and Power Quality Disturbances
238
3.1 Sampling concept The flowchart of the sampling concept shown below is to illustrate how the concept
direction works according to the objectives of this chapter.
Fig. 8. Flowchart of the sampling concept
To explain the process of the sampling concept flowchart in Fig. 8., it is supposed to follow
as the picture shown. After the used registers and utilized variables have been initialized,
the procedures will work according to the conditions. That is, if the sampling condition is on
operation, the procedure will do the sampling from the analog signals to the digital ones of
the 3 channels. And the next procedure is to write the digital sampling data which are
packed in the form of data frames to the external memory board. But if the counted data
packet from the frame count value is excessive over the maximum limit, it will seek to the
beginning of the first address in the external memory. Meanwhile, the data packet which is
www.intechopen.com

A Power Quality Monitoring System Via the Ethernet Network Based on the Embedded System
239
counted will be cleared. And if the counted data packet does not reach to the limit value, it
will return to the sampling condition for rechecking. In case, the sampling condition is off-operation, it will change the content of the data frame,
will write it to the external memory and will return to the sampling condition to be
rechecked. The procedures with the two sampling conditions mentioned above are done
repeatedly time after time.
3.2 Power quality monitoring concept It is generally a conceptual method to monitor power quality used with the embedded
system of LPC2368 microcontroller board as shown in the flowchart of Fig. 9.
Fig. 9. Flowchart of the power quality monitoring concept
www.intechopen.com

Electrical Generation and Distribution Systems and Power Quality Disturbances
240
To run the flowchart in order, it must initialize the network chip on LPC2368
microcontroller board, SD-CARD, real-time clock, the RTOS tasks that are modified from A
Power Quality Monitoring System for Real-Time Detection of Power Fluctuations
(Yingkayun & Premrudeepreechacharn, 2008) and ADE7758 board to get ready for
operating its functions. Next, LPC2368 microcontroller sends a control signal to ADUC7024
microcontroller board in order to start doing the sampling process. It reads the voltage and
frequency data from ADE7758 board. In case, there is no any fault signals, which are read by
LPC2368 microcontroller, the display information of the following values: the data of
voltage; frequency; date; time; status and so on, will be sent via network to PC or laptop
when it is connected. The LPC2368 microcontroller will take turn to operate its function
repeatedly from the start once more. But if ADE7758 board detects the fault signals, it will
send the fault signal to LPC2368 microcontroller which stops the sampling process, then,
reads the fault data from the external memory board and writes the fault data in SD-CARD
for storing. The fault data will be sent to PC or laptop via network when it is connected.
LPC2368 microcontroller will start doing the process once more after receiving the next fault
signals.
3.3 Data frame The data frame, sending to the external memory board, is defined with the head byte, the
samples of the 3-phase voltages with 12-bits A/ D resolution and the tail byte. The data
frame content is shown in Fig. 10.
Fig. 10. Data frame
The example of data frame structure which is written in C structure format is shown
below:
struct adc_info { /* Frame structure */ unsigned char head; /* defined as 0x00 when sampling ON and 0x55 when sampling OFF */
unsigned int samples[3];/* 12 bits Analog to Digital Signal from AC lines */
unsigned char tail; /* defined as 0xAA */ };
To calculate the floating point voltages from a raw A/ D sample, it can be expressed
by
www.intechopen.com

A Power Quality Monitoring System Via the Ethernet Network Based on the Embedded System
241
12(2 1)
nn n
XV Offset= −
−
(1)
Where V is the floating point voltage, X is the 12-bits raw data from an A/ D sample, n is
each A/ D channel number which varies from 0 to 2, and Offset is the zero crossing voltage
offset.
3.4 Configuration data To initialize the power quality monitoring system hardware, board configuration file stored
on SD-CARD is needed. The board configuration file is a text file named “board.cfg” and the
contents of the configuration file are shown below:
ip = 192.168.0.200 //Hardware IP id = 1 //Hardware Number port= 2000 // UDP Port offset0 = 1.246 //Channel 0 Offset offset1 = 1.242 //Channel 1 Offset offset2 = 1.251 //Channel 2 Offset phase = 3 //Select 1 or 3 Phase System
The advantage of using the configuration file from the SD-CARD is convenient to
apply by setting its contents when more power quality monitoring boards are used at
each node.
3.5 Ethernet packet stream structure To define the Ethernet packet stream structure sending over the Ethernet network, it is
consisted of fault data and electrical measurement information, which is in the place of the
TCP packet and will be packed to the UDP packets, then it is transmitted to PC or laptop.
The structure of Ethernet packet stream is shown below:
struct display_info { /* Display structure type*/ char type; /* Type of information defined as 0 */
char line1 [42]; /* Data buffer for the 3-phase voltages */ char line2 [42]; /* Data buffer for the status of the AC Lines */ char line3 [42]; /*Data buffer for the frequency values for the 3-phase system. */
char line4 [42]; /* Data buffer for current date and time */ }; struct fault_info {
char type; /* Type of information defined as 1 */ char buffer[200]; /* Data buffer for fault data */ char status; /* Status of the data buffer */
};
The LPC2368 microcontroller board uses UDP protocol packet to transmit data to a
remote computer. UDP protocol is one of protocols in the TCP/ IP protocol suite that is
used in the place of TCP when a reliable delivery is not required. There is less processing
of UDP packets than the one of TCP. UDP protocol is widely used for streaming audio
and video, voice over IP (VoIP) and video conferences, because there is no time to
retransmit erroneous or dropped packets. The UDP packet which is in Ethernet frame is
shown in Fig. 11.
www.intechopen.com

Electrical Generation and Distribution Systems and Power Quality Disturbances
242
Fig. 11. UDP within Ethernet frame
The structures of the Ethernet stream can be illustrated in C programming language are as
followings:
struct Frame_Header { char Dest_MAC[6]; char Src_MAC[6];
char Ethernet_Type[2];
}; struct IP_Header { char IP_Version; char TypeOfService;
unsigned int DataSize;
unsigned int Identification;
unsigned int Flag;
char TimeToLive;
char Protocol; //UDP=0x11
unsigned int CheckSum;
char SrcAddr[4];
char DestAddr[4];
}; struct UDP_Header { unsigned int SrcPort;
unsigned int DestPort;
unsigned int DataGramLength;
unsigned int CheckSum;
}; struct Ethernet_Stream0 { struct Frame_Header frame; struct IP_Header ip; struct UDP_Header udp;
struct display_info dp; char ZeroByte;
}; struct Ethernet_Stream1 {
struct Frame_Header frame; struct IP_Header ip; struct UDP_Header udp;
struct fault_info fault; char ZeroByte;
};
4. Application software
Application software is developed and written in Delphi 7 in order to control and to receive
informational data from power quality monitoring system hardware and to save the data to
www.intechopen.com

A Power Quality Monitoring System Via the Ethernet Network Based on the Embedded System
243
the computer. Actually, this application gets the display information from the hardware
mentioned above and then displays on the PC or laptop screen via the Ethernet network.
The application can set date and time and can also receive the fault data from the referred
hardware via the Ethernet network. The ordinary state and the uncommon one of the power
lines are displayed by application software on PC or laptop shown in Fig. 12 and Fig. 13
respectively.
Fig. 12. Display window in ordinary state
Fig. 13. Display window in uncommon state
And the researchers have developed the application software for displaying the fault signal
which is sent from the monitoring hardware to PC or laptop in order to illustrate the fault
data. This developed application software can either save in picture file or print out to take
www.intechopen.com

Electrical Generation and Distribution Systems and Power Quality Disturbances
244
the data under the considerable analysis of the cause in the faults at later time. The
developed application software is shown in Fig. 14.
Fig. 14. Application software for waveform display
5. Experimental results
In order to communicate to the power quality monitoring hardware, application software is
created to display and to plot the waveform. The application software connects to the
monitoring hardware via the Ethernet network. It both gets the display information and
saves the fault data to PC or laptop. It also shows the fault waveforms on the PC or laptop
screen. The communication procedure connecting between a monitoring hardware to PC or
laptop is to get the necessary information which is executed in the following steps:
1. A user sends a request signal with the application program to the power quality
monitoring hardware.
2. The power quality monitoring hardware receives the request signal and establishes the
connection to PC or laptop.
3. The power quality monitoring hardware sends the information to PC or laptop for
displaying.
4. If any fault occurs, the fault data will be saved into the PC or laptop storage in the
specific path.
5. A user can take the application software to display the fault waveform for investigating
the problem in power lines from the saving path above.
When the connection procedures have been already established between the hardware and
the computer in consequence, the user can monitor the voltage, the frequency and the fault
in power lines on the PC or laptop screen from the remote site. Additionally, the user can
also open the data file which is saved in the computer.
www.intechopen.com

A Power Quality Monitoring System Via the Ethernet Network Based on the Embedded System
245
(a)
(b)
(c)
(d)
Fig. 15. (a) Voltage sags on phase A,B and C, (b) Voltage sag on phase A, (c) voltage sag on
phase B and (d) voltage sag on phase C
For more advantage, the communication of the power quality monitoring hardware and PC
or laptop is not only limited with the only one hardware but also connected to other hard-
www.intechopen.com

Electrical Generation and Distribution Systems and Power Quality Disturbances
246
wares by executing more developed application programs that are shown in Fig. 12 and Fig.
13. The examples of the experimental result, that the data file is saved in the form of bitmap
file (.BMP format) by the application program of Fig. 14, is illustrated in Fig. 15, Fig. 16 and
Fig. 17.
Fig. 16. Zoomed signals of voltage sags from Fig.15(a)
Fig. 17. Interruption on phase A (measured on a single phase system)
www.intechopen.com
A Power Quality Monitoring System Via the Ethernet Network Based on the Embedded System
247
Fig. 15(a) is the picture of sags for all 3 phases. The experimental results appeared in Fig.
15(b), (c) and (d) are the examples of sag in phase A, B and C chronically from Fig. 15(a). It is
to separate the signal for testing each one in each phase that is easily studying.
Fig.16 is the zoomed picture from Fig. 15(a) to show the detail characteristics of the fault
signals in each phase.
Another experiment of this chapter is applied to detect the fault on a single phase system.
From Fig. 17 shown above is an example of the interruption for a short time.
6. Conclusion and future work
A power quality monitoring system via the Ethernet network based on the embedded
system has been proposed in this chapter in order to monitor the power quality in case of
faults detection and also to measure voltage and frequency in power lines. ADUC7024 and
LPC2368 of ARM7 microcontroller are selected to apply in the power quality monitoring
system for not only detecting the fault signals that cause any problems in either the system
or the end user equipment but also reading and writing them in real time of power
fluctuation. Moreover, the fault signal data can be sent and stored in SD-CARD to display
later on the screen of PC or laptop at the site place. However, the users can download and
analyze the fault signal data which have already sent and stored in SD-CARD via the
Ethernet network using TCP/ IP and UPD protocol at some other time when of necessity
needed.
For future work, the researchers tend to substitute ARM7 with ARM9 in order to monitor
power quality and to detect the transient in power lines. In any case, the researchers have
always concerned with the same primitive ideas and objectives.
7. Acknowledgements
The authors gratefully acknowledge to National Science and Technology Development
Agency (NSTDA), Ministry of Science and Technology of Thailand, Thailand Research Fund
(TRF), and Provincial Electricity Authority (PEA) for supports.
8. References
Auler, L.F. & d’Amore, R. (2003). Power Quality Monitoring and Control using Ethernet
Networks, Proceedings of 10th International Conference on Harmonics and Quality of
Power, pp. 208-213, ISBN 0-7803-7671-4, Rio de Janeiro, Brazil, October 6-9, 2002
Auler, L.F. & d’ Amore, R. (2009). Power Quality Monitoring Controlled Through Low-Cost
Modules, IEEE Transactions on Instrumentation and Measurement, Vol.58, No.3,
(March 2009), pp. 557-562, ISSN 0018-9456
Baggini, A. B. (2008). Handbook of POWER QUALITY, WILEY, ISBN 978-0-470-06561-7,
Wiltshire, Great Britain
Batista, J.; Alfonso, J.L. & Martins, J.S. (2004). Low-Cost Power Quality Monitor based on a
PC, Proceeding of ISIE’03 IEEE International Symposium on Industrial Electronics, pp.
323-328, ISBN 0-7803-7912-8, Rio de Janeiro, Brazil, June 9-11, 2003
Dugan, R.C.; McGranaha, M.F.; Santoso, S. & Beaty, H. W. (2002). Electrical Power Systems
Quality, McGraw-Hill, ISBN 0-07-138622-X, New York, USA
www.intechopen.com

Electrical Generation and Distribution Systems and Power Quality Disturbances
248
Hong, D.; Lee J. & Choi, J. (2006). Power Quality Monitoring System using Power Line
Communication, Proceeding of ICICS 2005 Fifth International Conference on
Information, Communications and Signal Processing, pp. 931-935, ISBN 0-7803-9283-3,
Bangkok, Thailand, December 6-9, 2005
Rahim bin Abdullah, A. & Zuri bin Sha’ameri, A. (2005). Real-Time Power Quality
Monitoring System Based on TMS320CV5416 DSP Processor, Proceeding of PEDS
2005 International Conference on Power Electronics and Drives Systems, pp. 1668-
1672, ISBN 0-7803-9296-5, Kuala Lumpur, Malaysia, November 28 – December 1,
2005
Salem, M.E.; Mohamed, A.; Samad, S.A. & Mohamed, R. (2006). Development of a DSP-
Based Power Quality Monitoring Instrument for Real-Time Detection of Power
Disturbances, Proceedings of PEDS 2005 International Conference on Power Electronics
and Drives Systems, pp. 304-307, ISBN 0-7803-9296-5, Kuala Lumpur, Malaysia,
November 28 – December 1, 2005
So A.; Tse, N.; Chan W.L. & Lai, L.L. (2000). A Low-Cost Power Quality Meter for Utility
and Consumer Assessments, Proceeding of IEEE International Conference on Electric
Utility Deregulation and Restructuring and Power Technologies, pp. 96-100, ISBN 0-
7803-5902-X, City University London, UK, April 4-7, 2000
Yang, G.H. & Wen, B.Y. (2006). A Device for Power Quality Monitoring Based on ARM and
DSP, Proceedings of IEIEA 2006 The 1st IEEE Conference on Industrial Electronics and
Applications, pp. 1-5, ISBN 0-7803-9513-1, Marina Mandarin Hotel, Singapore, May
24-26, 2006
Yingkayun, K. & Premrudeepreechacharn S. (2009). A Power Quality Monitoring System for
Real-Time Detection of Power Fluctuations, Proceeding of NAPS’08 The 40th North
American Power Symposium, pp. 1-5, ISBN 978-1-4244-4283-6, Calgary, Canada,
September 28-30, 2008
Yingkayun, K.; Premrudeepreechacharn S. & Oranpiroj, K. (2009). A Power Quality
Monitoring for Real-Time Fault Detection, Proceedings of ISIE 2009 IEEE
International Symposium on Industrial Electronics, pp. 1846-1851, ISBN 978-1-4244-
4347-5, Seoul, Korea, July 5-8, 2009
www.intechopen.com

Electrical Generation and Distribution Systems and Power QualityDisturbancesEdited by Prof. Gregorio Romero
ISBN 978-953-307-329-3Hard cover, 304 pagesPublisher InTechPublished online 21, November, 2011Published in print edition November, 2011
InTech EuropeUniversity Campus STeP Ri Slavka Krautzeka 83/A 51000 Rijeka, Croatia Phone: +385 (51) 770 447 Fax: +385 (51) 686 166www.intechopen.com
InTech ChinaUnit 405, Office Block, Hotel Equatorial Shanghai No.65, Yan An Road (West), Shanghai, 200040, China
Phone: +86-21-62489820 Fax: +86-21-62489821
The utilization of renewable energy sources such as wind energy, or solar energy, among others, is currentlyof greater interest. Nevertheless, since their availability is arbitrary and unstable this can lead to frequencyvariation, to grid instability and to a total or partial loss of load power supply, being not appropriate sources tobe directly connected to the main utility grid. Additionally, the presence of a static converter as output interfaceof the generating plants introduces voltage and current harmonics into the electrical system that negativelyaffect system power quality. By integrating distributed power generation systems closed to the loads in theelectric grid, we can eliminate the need to transfer energy over long distances through the electric grid. In thisbook the reader will be introduced to different power generation and distribution systems with an analysis ofsome types of existing disturbances and a study of different industrial applications such as battery charges.
How to referenceIn order to correctly reference this scholarly work, feel free to copy and paste the following:
Krisda Yingkayun and Suttichai Premrudeepreechacharn (2011). A Power Quality Monitoring System Via theEthernet Network Based on the Embedded System, Electrical Generation and Distribution Systems and PowerQuality Disturbances, Prof. Gregorio Romero (Ed.), ISBN: 978-953-307-329-3, InTech, Available from:http://www.intechopen.com/books/electrical-generation-and-distribution-systems-and-power-quality-disturbances/a-power-quality-monitoring-system-via-the-ethernet-network-based-on-the-embedded-system