Embed Size (px)
Citation preview
A Precise Style for Business Process Modelling:Results from Two Controlled Experiments
Gianna Reggio1, Filippo Ricca1, Giuseppe Scanniello2, Francesco Di Cerbo3,and Gabriella Dodero3
1 DISI, Universita di Genova, Italygianna.reggio|[email protected]
2 Dipartimento di Matematica e Informatica, Universita della Basilicata, [email protected]
3 CASE, Libera Universita di Bolzano-Bozen, Italyfrancesco.dicerbo|[email protected]
Abstract. We present a precise style for the modelling of business pro-cesses based on the UML activity diagrams and two controlled exper-iments to compare this style with a lighter variant. The comparisonhas been performed with respect to the comprehensibility of businessprocesses and the effort to comprehend them. The first experiment hasbeen conducted at the Free University of Bolzano-Bozen, while the sec-ond experiment (i.e., a differentiated replication) at the University ofGenova. The participants to the first experiment were Master studentsand so more experienced than the participants to the replication, whowere Bachelor students. The results indicate that: (a) all the participantsachieved a significantly better comprehension level with the precise style;(b) the used style did not have any significant impact on the effort; and(c) more experienced participants benefited more from the precise style.
Keywords: Business Process Modelling, UML activity diagrams, Controlledexperiment, Precise and Ultra-light styles.
1 Introduction
To be competitive in the global market, many organizations have been changingtheir business processes [11]. In this context, modelling, management, and en-actment of business processes are considered relevant to support organizationsin their daily activities.
The UML activity diagrams represent a natural choice for modelling businessprocesses (see, e.g., [10]) since UML has been conceived for the communicationamong people and then can be easily understood and used by customers, man-agers, and developers. In favour of UML, there is also its flexibility that allowschoosing the preferred degree of precision/abstractiveness to model business pro-cesses. For example, processes may be modelled using lighter variants/styles ofthe activity diagrams, where nodes and arcs are simply decorated by natural
2 Reggio et al.
language text. Lighter styles could be simpler to use, but they could complicatethe communication among stakeholders because of the possible ambiguities theyintroduce. More precise styles, where for example nodes are expressed in a for-mal language, could be more complex to use, but they may reduce ambiguitiesin the modelled processes.
In this paper, we present a precise style for the modelling of business pro-cesses based on the UML activity diagrams and two controlled experiments tocompare it with a lighter style (ultra-light in the following). The participantsto the original experiment were students of the Master program in ComputerScience at the Free University of Bolzano-Bozen. A preliminary analysis of theexperimental data [9] indicated that the participants achieved a significantlybetter comprehension level when business processes were represented using theprecise style, with no significant impact on the effort to accomplish the tasks.
The second experiment was a differentiated replication1 of the first experi-ment. It was conducted at the University of Genova with less experienced par-ticipants, namely Bachelor students in Computer Science. The data analysisconfirmed the results of the original experiment. A further analysis conductedon both the experiments indicated that more experienced participants benefitmore from the use of the precise style in the comprehension of business processes.
The work presented here is based on [9] and with respect to that paper, weprovide the following further new contributions: (1) a deeper presentation ofthe visual formalism used to model business processes; (2) a new experimentwith less experienced participants; (3) a further analysis to assess the effect ofexperience on the comprehension of business process models.
The remainder of the paper is organized as follows: Section 2 presents relevantrelated literature concerning business process modelling with UML and relatedexperiments in comprehension tasks. Section 3 introduces both the precise andthe ultra-light styles for business process modelling. Section 4 presents the designof the controlled experiments, while Section 5 shows and discusses the achievedresults. Final remarks conclude the paper.
2 Related Work
The UML activity diagrams provide an intuitive and easy way to model business[1] and business process [8, 13, 10]. For example, Di Nitto et al. [10] proposean approach to model business processes by using a subset of UML diagrams,including: (1) UML activity diagrams with object flow to model the controland data flow, (2) class diagrams to model structural properties of the process,and (3) state diagrams to model the behaviour of activities. Subsequently, thesemodels can be translated into executable process descriptions by a UML CASEtool. Several are the differences between our approach and theirs. The mostremarkable one is that OCL (Object Constraint Language) is not used.
1 This kind of replication introduces variations (e.g., different kinds of participants)in essential aspects of the experimental conditions [3].

A Precise Style for Business Process Modelling 3
De Lucia et al. [7] present a visual environment, based on an extension ofUML activity diagrams, that allows to graphically design a process and to vi-sually monitor its enactment. The main difference with our approach is thatparticipants and objects are not explicitly considered in their proposal. Further-more, the behavioural conditions are not formally specified.
Differently from us, all the approaches discussed above do not assess thevalidity of the proposed formalism by means of controlled experiments. To ourknowledge, only a few studies perform comparisons among business process for-malisms by using empirical evaluations. For instance, Peixoto et al. [16] compareUML and BPMN (Business Process Modelling Notation) [15], with respect totheir readability in expressing business processes. The authors expected BPMNmodels to be easier to understand than UML 2.0 activity diagrams, as BPMNis a specialized language, designed for modelling business process and with theprimary goal of being understandable by all business stakeholders. However, anexperiment with 35 undergraduate students, unskilled in business process mod-elling, could not confirm their initial hypothesis. A similar result is obtained in[4], where the authors conclude that UML activity diagrams are at least usableas BPMN since neither user effectiveness, efficiency, nor satisfaction differ sig-nificantly. Instead, Gross and Doerr [12] conducted two experiments, comparingthe UML activity diagrams and Event-driven Process Chains (EPCs). The au-thors found evidence that activity diagrams performed better than EPCs from arequirements engineer’s perspective. When considering end users, no significantdifference was identified between the two methods.
3 Business Process Modelling with UML
In this paper, we shall not give a rigorous definition of what a business processis, just assuming the common intuitive meaning, and we shall use the followingterminology:
– basic activities in business processes are called basic tasks of the process;
– business process objects are those entities over which the activities of theprocess are performed, obviously these entities are passive, i.e., they areunable to do any activity by themselves;
– active entities that perform the various tasks are business process partici-pants: whenever relevant, we shall distinguish autonomous participants fromthose corresponding to software and hardware systems.
Behavioural aspects of business processes may be modelled by using UMLactivity diagrams, which offer quite a large set of visual constructs to depictthe flow of activities. We shall restrict ourselves to use: action nodes, initial,final, decision/merge, fork/join control nodes, control flow edges, time and acceptevents, and obviously also the rake construct to modularize the activity diagrams.Object nodes and swimlanes may also be optionally used. This holds also for thestyles considered in the paper.
4 Reggio et al.
Even with such a restricted subset of constructs, a straightforward and uniquemodelling of a business processes with one UML activity does not exist. Indeed,it is possible to produce complex and unreadable activity diagrams, correspond-ing to “spaghetti” business processes, or to make mistakes, e.g., using a businessobject before creating it. To overcome these problems, we proposed a proper dis-cipline for modelling business processes and some notations [17]. The notationsmainly differ in the level “of the precision” in using UML to depict the basicingredients of the activity diagrams (such as actions and guards), or in the waybasic tasks are represented.
In the study presented here, we consider the ultra-light and the precise styles.These styles are described in the following through a running example, namely abusiness process corresponding to order processing in e-commerce systems (EC).More business process examples are available in [17].
The client sends the order. If the client is not already registered, (s)he will beasked to register to the site, if (s)he refuses the order will be cancelled. Then, theorder will be sent to the warehouse, which will prepare the package, and in themeantime, to collect the payment, the handler of the credit card, or Paypal will becontacted (depending on client preferences). Then, the package will be sent, andthe carrier will inform the company that the package has been delivered. Finally,the order will be archived.
3.1 Ultra-light style
In the ultra-light style a business process is modelled by a UML activity diagram,where the action nodes and the guards on the edges leaving the decision nodesare decorated by natural language text; such text does not follow any rules orpatterns. Sentences defining the activities may be either in active or passiveform (e.g., “Clerk fills the form” or “Form is filled by clerk”), and the entityexecuting the activity may be precisely determined or be left undefined (e.g.,“Form is filled”); in other cases nominal sentences might be used instead ofverbal phrases (“Filling the form”). Also the objects over which the businessprocess activities are performed may be described in different ways, for exampleby a substantive (e.g., “Form”, “The form”) or by a qualificative sentence (e.g.,“Client form”, “Filled form”, “Sent form”).
Fig. 1 shows the ultra-light UML model of the EC business process. It isa simple activity diagram, where various basic tasks are denoted by naturallanguage sentences with different structure (e.g., the first one is active and thesubject is explicit, Order archived instead is passive and provides no informationabout who will perform the task, and Client registration is just the name ofan action). Since the model is prepared in a completely unconstrained way, it isvery easy to make mistakes or to introduce ambiguities. For example, the passivesentences in the UML activity diagram do not explicitly mention who will dothe last three basic tasks of the process.

A Precise Style for Business Process Modelling 5
3.2 Precise style
Participants and objects of a business process shall always be explicitly listedand precisely modelled with UML by means of classes; and the behavioural viewof business processes shall be given by activity diagrams, with basic activitiesand conditions written respectively in the language for the actions of UML andOCL, the textual language for boolean expressions, included in UML 2.0. Thusthe UML precise model of a business process consists of: (1) a class diagram, in-troducing the classes needed to type its participants and objects, (2) the list of itsparticipants, (3) the list of its objects, and (4) an activity diagram representingits behaviour. All these parts must satisfy the constraints listed below.
– Classes in the class diagram may be stereotyped by �object� (businessprocess objects), �businessWorker� and �system� (business process par-ticipants distinguished between: autonomous entities, i.e., human beings orcomplex entities run by human beings, and hardware/software systems); forreadability reasons the stereotype�businessWorker� will be omitted. Mutualrelationships among participants and/or objects are expressed by associa-tions and specializations, whereas the dependency (visually depicted by adashed arrow) is used to represent the fact that participants from a givenclass will act over objects from another class.
Fig. 1. EC Specified by the Ultra-light Style

6 Reggio et al.
– Participants are named, and they are typed by a class with stereotype either�businessWorker� or �system�. Objects are named and typed by classesstereotyped by �object�. Notice that participants/objects are roles for en-tities taking part in the business process, and not specific individuals. It ispossible to impose some constraints on participants and objects of a businessprocess.
– Basic tasks involving participants and objects are modelled by operationsof the various participants/objects classes stereotyped by �T� (wheneverall operations of a class have this stereotype, it shall be omitted to simplifythe visual presentation). When defining �T� operations, it is important tokeep in mind that: (1) an operation corresponding to a basic task, part of aclass C stereotyped by �businessWorker� or �system�, describes a task thata participant of type C is responsible to initiate (they should be named usingthe imperative verbal mode); (2) an operation corresponding to a basic task,part of a class C stereotyped by �object�, describes a task that will be doneover an object of type C (they should be named using the past participle).
– Action nodes of an activity diagram are decorated by calls of the the op-erations corresponding to basic tasks, where participants and objects freelyappear as arguments, whereas conditions on edges leaving decision nodes areOCL expressions, where participants and objects shall freely appear.
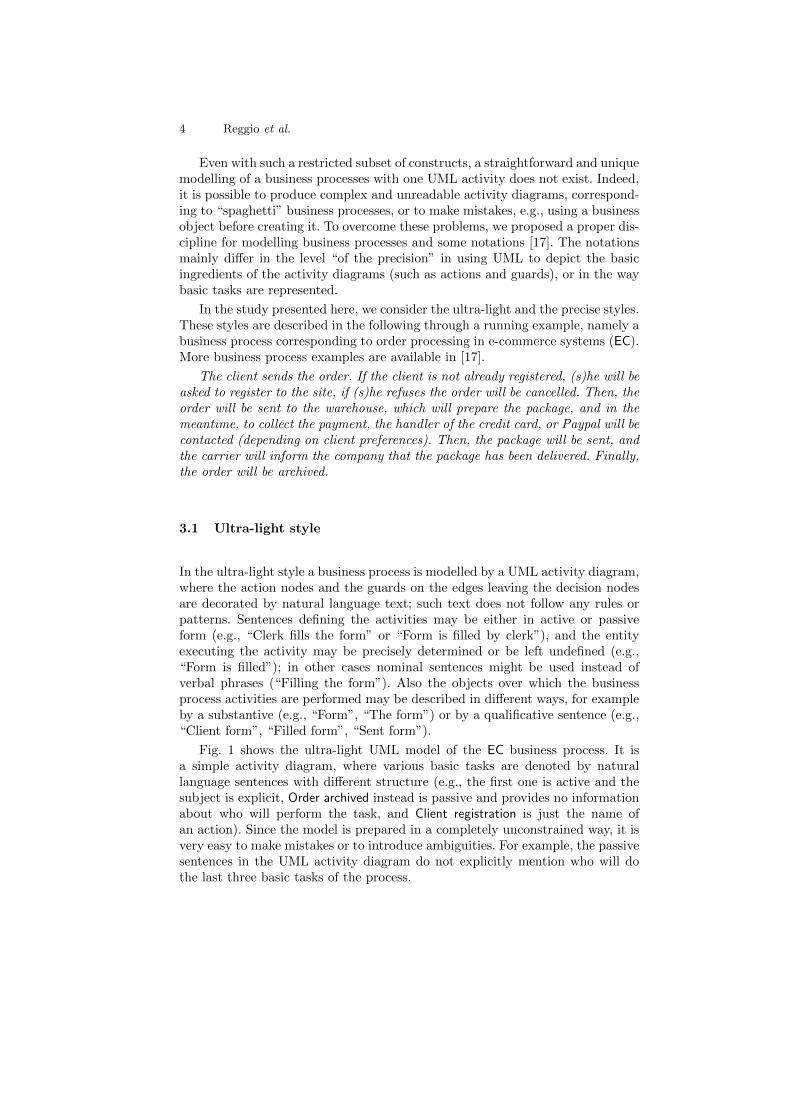
Fig. 2 shows the models of the the EC business process built using the precisestyle. The figure shows a class diagram, an activity diagram, and the lists ofparticipants and objects of the process. The class diagram introduces the classdefining participants and objects, together with some data-type used to describethem (for example ClientInfo). EC, PAYPAL and CREDITCARD are participantsof the process of kind �system� (they correspond respectively to the softwaresystem running the e-commerce site, the Paypal payment service, and the creditcard handling system), whereas CLIENT is an human participant, CARRIER andWAREHOUSE are respectively an external transport company, and a departmentof the e-commerce company. The latter are not classified as systems since theymight not be fully automated. The e-commerce system is responsible for fourbasic tasks, the warehouse for one and the carrier for two.
The model of the process may be made more precise, without modifying theactivity diagram, by adding further details to the class diagram. For example,we could model how the class ECommerce handles the list of registered clients,and the effects on it of its operations, e.g., by means of pre-post conditions. Moredetails on this concern can be found in [17].
4 The Controlled Experiments
In this section we present the design of the two controlled experiments followingthe guidelines proposed by Wohlin et al. in [19]. An experimental package, theraw data, and a draft of our previous paper [9] are available on the Web2.
2 www.scienzemfn.unisa.it/scanniello/BPM
A Precise Style for Business Process Modelling 7
Fig. 2. EC Specified by the Precise Style
8 Reggio et al.
Applying the Goal Question Metric (GQM) paradigm [2], the goal of ourexperiments can be defined as follows: “Analyse the use of the precise style for thepurpose of evaluating it with respect to the ultra-light style in the comprehensionof business processes by two different categories of participants (i.e., High/Lowexperienced) from the point of view of researchers, in the context of studentsin Computer Science, and from the point of view of project managers, in thecontext of novice software engineers”.
4.1 Participants
The two experiments have been conducted with:
– Master students. They are enrolled in a Master program in Computer Scienceat the Free University of Bolzano-Bozen. Some of them are, or were, industryprofessionals. They can be considered close to young software engineers [5],and in the following we will refer to them as UniBZ.
– Bachelor students. They are students of the Bachelor program in ComputerScience at the University of Genova (UniGE in the following). They can beconsidered the next generation of young professional developers [14].
UniGE (62 participants) is a differentiated replication of UniBZ (26 partici-pants). The participants to UniGE are less experienced than UniBZ. For ethicreasons, we informed all the participants that the data of the experiment willbe treated anonymously, used only for research purposes, and revealed only inaggregated form.
4.2 Material and Experimental Objects
The prepared experimental material included: two experimental objects, the doc-umentation for the training, and a post-experiment survey questionnaire. The ex-perimental objects are two business processes from application domains on whichthe participants were familiar with. Process Order, shortly PO, is in charge ofprocessing orders for an on-line shop. It takes as input an order, then: (i) the or-der is accepted; (ii) info is filled; (iii) payment processing and shipment are doneand, finally; (iv) the order is closed. The second business process (i.e., DocumentManagement Process, shortly DPM) manages the on-line review process of anykind of documents. First a document is created by the author, then it is reviewedby a reviewer, and finally it is approved (if its quality satisfies the imposed con-straints). The two business processes are comparable both in complexity and insize. PO comprises 10 nodes (8 activities, 1 decisions and 1 object node) and DPMcomprises 12 nodes (6 activities, 2 decisions and 4 object nodes). Furthermore,they both are small enough to fit the time constraints of the experiment and atthe same time they are realistic for small/medium sized comprehension tasks.It is worth mentioning that we downloaded the models of the process PO andDPM from http://www.uml-diagrams.org/activity-diagrams-examples.html. Inthe experiments we used the same descriptions provided in the Website.
A Precise Style for Business Process Modelling 9
The documentation for the training included: (i) a set of instructional slidesto introduce the precise and the ultra-light style; (ii) a training task not relatedwith experimental objects.
Regarding the post-experiment survey questionnaire, we asked the partici-pants to fill it out, so to gain insight and explain the results. This questionnairecontained questions about: the availability of sufficient time to complete the tasksand the clarity of the experimental material and objects. For space reasons, theanalysis of the post-experiment questionnaires is not presented.
4.3 Hypotheses Formulation
The following null hypotheses have been defined and tested:Hlo: The use of the precise style does not significantly improve the compre-hension level of a business process.Hto: There is no significant difference in terms of effort when using the pre-cise or ultra-light styles to comprehend a business process.
According to the results of the original experiment [9], the null hypothesis Hl0
is one-tailed, while Ht0 is two-tailed. The objective of the statistical analysis is toreject the defined null hypotheses, thus accepting the corresponding alternativeones (i.e., Hla and Hta) that can be easily derived from the null ones.
4.4 Design
In the first experiment, we adopted a counterbalanced design [19] with fourgroups: A, B, C, and D. Each participant within these groups worked on twocomprehension Tasks (i.e., Task 1 and Task 2) on the two experimental Objects:PO and DPM. Each time, participants used the precise or ultra-light styles. Forexample, the participants within the group A started to work in Task 1 on POusing the precise style and then they used the ultra-light style to perform Task2 on DPM. We randomly assigned the participants to A, B, C, and D.
In the replication a completely randomized design [19] was used. This designis simpler than the one used in the first experiment, since each participant usedeither the precise or the ultra-light styles on only one experimental object (i.e.,PO or DPM). We used in the replication a different design for time constraints.
4.5 Dependent and Independent Variables
The control group indicates students working with the ultra-light style, while thetreatment group indicates students working with the precise style. Thus, the onlyindependent variable is Method (also named main factor), which is a nominalvariable that admits two possible values: Precise and Ultra-light. To test the nullhypotheses, we selected the following dependent variables: comprehension leveland comprehension effort.
The comprehension level dependent variable measures the comprehension ofthe participants on each business process. Similar to previous studies (e.g., [18]),

10 Reggio et al.
we asked the participants to answer a comprehension questionnaire (it is thesame for each object) composed of multiple choice questions. Twelve questionswere asked on each business process, each admitting five possible answers, withone or more correct answers. An example of question for the PO object is thefollowing: “Indicate the participants of the PO business process”. The goal ofthis question was to investigate whether the experiment participants (subjects)identified the participants to the business process.
We measured the correctness and completeness of the answers the partici-pants provided to the questions of each comprehension questionnaire through aninformation retrieval based approach [18]. The correctness was measured usingthe precision measure, while we employed the recall for the completeness:
precisions,i =|As,i ∩ Ci||As,i|
recalls,i =|As,i ∩ Ci||Ci|
where As,i is the set of answers provided by the participant s on the questioni and Ci indicates the correct set of answers of the question i. To get a singlevalue representing a balance between correctness and completeness of a givenquestion, we used the harmonic mean between precision and recall:
F−Measures,i =2 · precisions,i · recalls,iprecisions,i + recalls,i
The overall comprehension level achieved by each participant was computedusing the overall average of the F-Measure values on all the questions. Thisaverage assumes a value ranging from 0 to 1. Values close to 1 and 0 indicate avery good and very bad understanding, respectively.
The comprehension effort dependent variable measures the time, expressedin minutes, that each participant spent to accomplish a task. We got this valueusing the start and stop times the participants were asked to record.
5 Results
Because of the sample size and mostly non-normality of the data, we adoptednon-parametric tests to test the null hypotheses. We used the Mann-Whitney(MW) test for unpaired analysis since it is very robust and sensitive [19]. Further,it has been widely used in the past in studies similar to the one presented inthe paper. In all the performed statistical tests, we decided (as it is customary)to accept a probability of 5% of committing Type-I-error [19], i.e., rejecting thenull hypothesis when it is actually true.
While the statistical tests check the presence of significant differences, theydo not provide any information about the magnitude of such a difference. There-fore, we used the Cohen’s “d” standardized difference between two groups [6].Typically, it is considered negligible for |d| < 0.2, small for 0.2 ≤ |d| < 0.5,medium for 0.5 ≤ |d| < 0.8, and large for |d| ≥ 0.8.
A Precise Style for Business Process Modelling 11
5.1 Comparison between the experiments
To compare the results of the two experiments, we considered the overall values ofcomprehension level and effort, without partitioning the observations by Method.For comprehension level we obtained: UniBZ=0.70 and UniGE=0.60. From thispreliminary analysis, we observe that the mean value of comprehension level inthe first experiment (UniBZ) is 10 points (i.e., 16.6%) higher than in the secondexperiment (UniGE). This means that the UniBZ participants comprehendedbetter the business process (both represented with the precise and ultra-lightstyles) than the UniGE participants. The difference is confirmed by the MW test(p − value = 0.0004). As far as Comprehension Effort is concerned, the meaneffort in the first experiment is about 2 minutes (11.2%) higher than in the firstexperiment. For the effort, such a difference is not statistically significant as theresults of the MW test show (p− value = 0.48). Given the observed differencesin the results, we cannot simply merge the data from the two experiments. Asa consequence, the two data sets ought to be analysed separately and then wecan draw joint conclusions from the results.
5.2 Comprehension level and effort
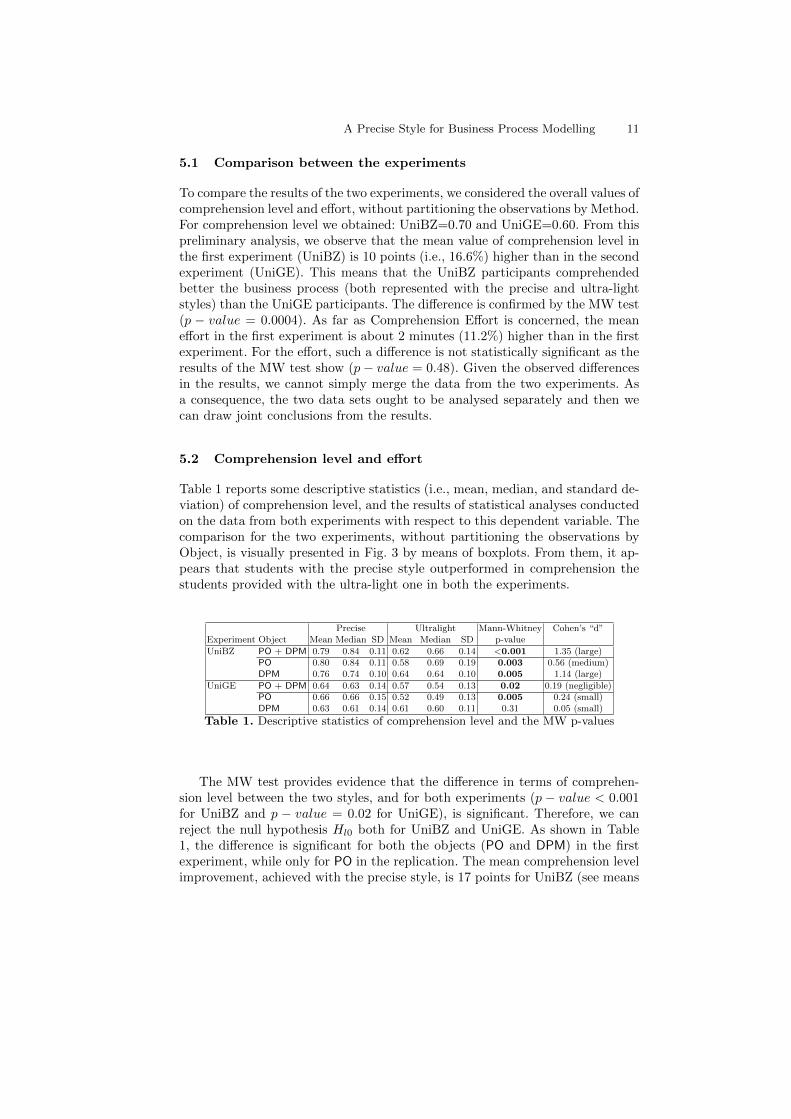
Table 1 reports some descriptive statistics (i.e., mean, median, and standard de-viation) of comprehension level, and the results of statistical analyses conductedon the data from both experiments with respect to this dependent variable. Thecomparison for the two experiments, without partitioning the observations byObject, is visually presented in Fig. 3 by means of boxplots. From them, it ap-pears that students with the precise style outperformed in comprehension thestudents provided with the ultra-light one in both the experiments.
Precise Ultralight Mann-Whitney Cohen’s “d”Experiment Object Mean Median SD Mean Median SD p-value
UniBZ PO + DPM 0.79 0.84 0.11 0.62 0.66 0.14 <0.001 1.35 (large)PO 0.80 0.84 0.11 0.58 0.69 0.19 0.003 0.56 (medium)DPM 0.76 0.74 0.10 0.64 0.64 0.10 0.005 1.14 (large)
UniGE PO + DPM 0.64 0.63 0.14 0.57 0.54 0.13 0.02 0.19 (negligible)PO 0.66 0.66 0.15 0.52 0.49 0.13 0.005 0.24 (small)DPM 0.63 0.61 0.14 0.61 0.60 0.11 0.31 0.05 (small)
Table 1. Descriptive statistics of comprehension level and the MW p-values
The MW test provides evidence that the difference in terms of comprehen-sion level between the two styles, and for both experiments (p − value < 0.001for UniBZ and p − value = 0.02 for UniGE), is significant. Therefore, we canreject the null hypothesis Hl0 both for UniBZ and UniGE. As shown in Table1, the difference is significant for both the objects (PO and DPM) in the firstexperiment, while only for PO in the replication. The mean comprehension levelimprovement, achieved with the precise style, is 17 points for UniBZ (see means
12 Reggio et al.
Fig. 3. Boxplots of Comprehension level grouped by Method and Experiment.
of the “UniBZ PO + DPM” row in Table 1), i.e., 27.41%3 and 7 points for UniGE(see means of the “UniGE PO + DPM” row in Table 1), i.e., 12.28%.
Participants with the precise style employed slightly more time than partic-ipants with the ultra-light style. Means per experiment are respectively: 22’16”and 22’11 minutes for UniBZ; 20’41” and 19’46” minutes for UniGE. The MWtest returned 0.89 for UniBZ and 0.21 for UniGE as p − values, respectively.Therefore, we rejected the null hypothesis Ht0 neither for UniBZ nor for UniGE.
5.3 Effect of Experience
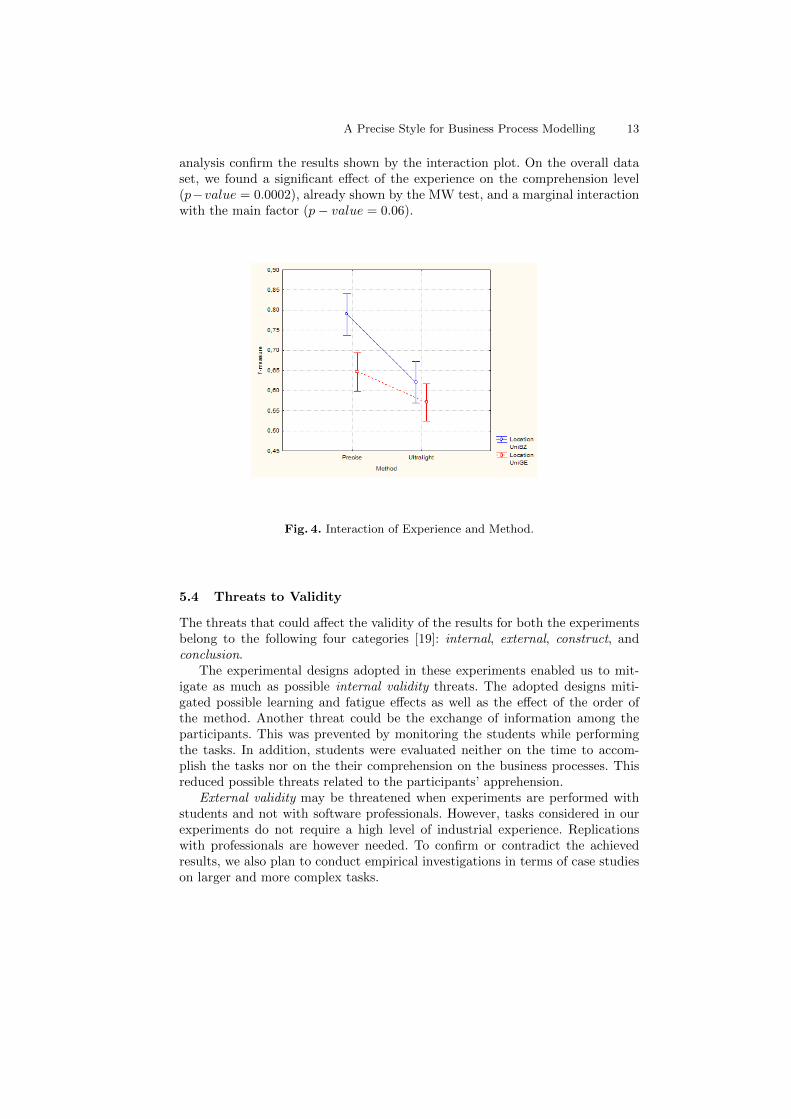
Fig. 4 shows the interaction plot of method and experience vs. comprehensionlevel. Potential benefits gained with the precise style are represented by the slopeof the segments: the slope – and thus the benefit gained with the precise style – ishigher for master students from UniBZ than for bachelor students from UniGE.The plot shows a possible trend (to be verified by further experiments): moreexperienced participants received greater benefits from the precise style thanless experienced participants. This could be due to the expertise and level ofmaturity needed to understand the language for the actions of UML and OCL,used in the precise style.
The effect of experience on the dependent variable has also been analysedusing a two-way Analysis of Variance (ANOVA). The results of this further
3 The value is computed using the equation: 0.62+0.62*x%=0.79
A Precise Style for Business Process Modelling 13
analysis confirm the results shown by the interaction plot. On the overall dataset, we found a significant effect of the experience on the comprehension level(p−value = 0.0002), already shown by the MW test, and a marginal interactionwith the main factor (p− value = 0.06).
Fig. 4. Interaction of Experience and Method.
5.4 Threats to Validity
The threats that could affect the validity of the results for both the experimentsbelong to the following four categories [19]: internal, external, construct, andconclusion.
The experimental designs adopted in these experiments enabled us to mit-igate as much as possible internal validity threats. The adopted designs miti-gated possible learning and fatigue effects as well as the effect of the order ofthe method. Another threat could be the exchange of information among theparticipants. This was prevented by monitoring the students while performingthe tasks. In addition, students were evaluated neither on the time to accom-plish the tasks nor on the their comprehension on the business processes. Thisreduced possible threats related to the participants’ apprehension.
External validity may be threatened when experiments are performed withstudents and not with software professionals. However, tasks considered in ourexperiments do not require a high level of industrial experience. Replicationswith professionals are however needed. To confirm or contradict the achievedresults, we also plan to conduct empirical investigations in terms of case studieson larger and more complex tasks.

14 Reggio et al.
Construct validity threats are related to the metrics used to quantitativelyevaluate the participants’ comprehension and effort. We used questionnaires toassess the comprehension of the business processes and the participants’ answersto these questionnaires were evaluated using an information retrieval based ap-proach. This design choice avoided as much as possible any subjective evalua-tion. Furthermore, the comprehension questionnaires were defined to be complexenough without being too obvious. The comprehension effort was measured bymeans of proper time sheets, and it was validated by researchers. This approachis widely used in the literature.
Conclusion validity concerns data collection, reliability of measurements, andvalidity of statistical tests. We used a conservative statistical non-parametrictest (i.e., Mann-Whitney) to reject the null hypotheses and two-way ANOVA todetect possible effects and interactions between the main factor and the partic-ipants’ experience. Even if all the assumptions/conditions to use ANOVA werenot checked, this test is quite robust and has been extensively used in the pastto conduct analyses similar to ours.
6 Conclusion
We have presented a precise style for the modelling of business processes basedon the UML activity diagrams. An experiment and a differentiated replicationhave been conducted to compare it with a lighter variant. The results of theseexperiments indicate a clear improvement in the comprehension of business mod-els when the precise style is used (UniBZ +27.41% and UniGE +12.26%) withno impact on the effort to accomplish a comprehension task. The analysis ofthe experiments together showed that more experienced subjects benefited morefrom the precise style. This result could be due to the needed expertise and levelof maturity to understand business processes represented with this style.
Future replications have been planned to investigate: (i) the effects of chang-ing the domain of the business processes used in the controlled experiments;(ii) whether the observed benefits of the precise style are preserved or improvedfor subjects with different levels of experience; and (iii) whether the additionaleffort and cost to create models with the precise style is adequately paid backby an improved comprehension of business process models.
Acknowledgements: We would like to thank the participants to the experiments.
References
1. E. Astesiano, G. Reggio, and F. Ricca. Modeling business within a UML-based rig-orous software development approach. In P. Degano, R. DeNicola, and J. Meseguer,editors, Concurrency, Graphs and Models, number 5065 in LNCS, pages 261–277,Berlin, 2008. Springer Verlag.
2. V. Basili, G. Caldiera, and D. H. Rombach. The Goal Question Metric Paradigm,Encyclopedia of Software Engineering. John Wiley and Sons, 1994.

A Precise Style for Business Process Modelling 15
3. V. R. Basili, F. Shull, and F. Lanubile. Building knowledge through families ofexperiments. In IEEE Trans. Softw. Eng., pages 456–473. IEEE, 1999.
4. D. Birkmeier and S. Overhage. Is BPMN really first choice in joint architecturedevelopment? an empirical study on the usability of BPMN and UML activitydiagrams for business users. In Research into Practice Reality and Gaps, number6093 in LNCS, pages 119–134. Springer Verlag, 2010.
5. J. Carver, L. Jaccheri, S. Morasca, and F. Shull. Issues in using students in em-pirical studies in software engineering education. In 9th International Symposiumon Software Metrics, pages 239–, Washington, DC, USA, 2003. IEEE CS.
6. J. Cohen. Statistical power analysis for the behavioral sciences (2nd ed.). LawrenceEarlbaum Associates, Hillsdale, NJ, 1988.
7. A. De Lucia, R. Francese, G. Scanniello, and G. Tortora. Distributed workflowmanagement based on UML and web services. In Encyclopedia of E-Commerce,E-Government, and Mobile Commerce, pages 217–222. IGI Global, 2006.
8. A. De Lucia, R. Francese, and G. Tortora. Deriving workflow enactment rules fromUML activity diagrams: a case study. Symposium on Human-Centric ComputingLanguages and Environments, 0:211–218, 2003.
9. F. Di Cerbo, G. Dodero, G. Reggio, F. Ricca, and G. Scanniello. Precise vs.ultra-light activity diagrams - an experimental assessment in the context of busi-ness process modelling. In International Conference on Product Focused SoftwareDevelopment and Process Improvement (PROFES 2011), pages 291–305, 2011.
10. E. Di Nitto, L. Lavazza, M. Schiavoni, E. Tracanella, and M. Trombetta. Derivingexecutable process descriptions from UML. In 22rd International Conference onSoftware Engineering (ICSE 2002), pages 155–165, 2002.
11. H. E. Eriksson and M. Penker. Business Modelling with UML. Wiley ComputingPublishing, 2000.
12. A. Gross and J. Doerr. EPC vs. UML activity diagram - two experiments examin-ing their usefulness for requirements engineering. In Proceedings of RequirementsEngineering Conference, pages 47–56, Washington, DC, USA, 2009. IEEE CS.
13. S. Jurack, L. Lambers, K. Mehner, G. Taentzer, and G. Wierse. Object flowdefinition for refined activity diagrams. In 12th International Conference on Fun-damental Approaches to Software Engineering (FASE 2009), pages 49–63, Berlin,Heidelberg, 2009. Springer-Verlag.
14. B. Kitchenham, S. Pfleeger, L. Pickard, P. Jones, D. Hoaglin, K. El Emam, andJ. Rosenberg. Preliminary guidelines for empirical research in software engineering.IEEE Trans. Softw. Eng., 28(8):721–734, 2002.
15. OMG. Business process model and notation (BPMN) Version 2.0. OMG FinalAdopted Specification, Object Management Group, 2011.
16. D. Peixoto, V. Batista, A. Atayde, E. Borges, R. Resende, and C. Padua. AComparison of BPMN and UML 2.0 Activity Diagrams. In VII Simposio Brasileirode Qualidade de Software. Florianopolis, 2008.
17. G. Reggio, F. Ricca, E. Astesiano, and M. Leotta. On business processmodelling with the UML: a discipline and four styles. Technical ReportDISI-TR-11-03, DISI - University of Genova, Italy, April 2011. Available athttp://softeng.disi.unige.it/tech-rep/TECDOC.pdf.
18. F. Ricca, M. Di Penta, M. Torchiano, P. Tonella, and M. Ceccato. The role ofexperience and ability in comprehension tasks supported by UML stereotypes. In29th International Conference on Software Engineering (ICSE 2007), Minneapolis,MN, USA, May 20-26, pages 375–384, 2007.
19. C. Wohlin, P. Runeson, M. Host, M. Ohlsson, B. Regnell, and A. Wesslen. Exper-imentation in Software Engineering - An Introduction. Kluwer, 2000.
![Modelling Timed Concurrent Systems Using Activity Diagram ...andre/documents/modelling-timed... · In [ACR13], we introduced so-called \precise" activity diagram patterns to model](https://img.pdfslide.net/doc/110x75/6010cc9b5fe2673e0c0f95fc/modelling-timed-concurrent-systems-using-activity-diagram-andredocumentsmodelling-timed.jpg)