Embed Size (px)
Citation preview
International Journal of Geosciences, 2014, 5, 1080-1087 Published Online September 2014 in SciRes. http://www.scirp.org/journal/ijg http://dx.doi.org/10.4236/ijg.2014.510092
How to cite this paper: Trivedi, P.C., Joshi, H.P. and Parvez, I.A. (2014) A Preliminary Study on Rainfall Pattern before and after the January 26, 2001 Bhuj Earthquake (Mw 7.7) over Kachchh Region of Western Peninsular, India. International Jour-nal of Geosciences, 5, 1080-1087. http://dx.doi.org/10.4236/ijg.2014.510092
A Preliminary Study on Rainfall Pattern before and after the January 26, 2001 Bhuj Earthquake (Mw 7.7) over Kachchh Region of Western Peninsular, India Parul C. Trivedi1,2, H. P. Joshi2, Imtiyaz A. Parvez3 1India Meteorological Department, Ahmedabad, India 2Department of Physics, Saurashtra University, Rajkot, India 3CSIR Centre for Mathematical modeling and Computer Simulation (C-MMACS), Bangalore, India Email: [email protected] Received 27 June 2014; revised 23 July 2014; accepted 21 August 2014
Copyright © 2014 by authors and Scientific Research Publishing Inc. This work is licensed under the Creative Commons Attribution International License (CC BY). http://creativecommons.org/licenses/by/4.0/
Abstract Under the influence of great debate on relation between earthquake and rainfall, some scientists have carried out detailed study and now commonly accepted that heavy rainfall can trigger earth- quake at the faults or fractures depending upon the local geology. Here, an attempt is made to check relation between earthquake and rainfall with different scientific approaches. We have at-tempted to critically examine the relation between the Bhuj earthquake-aftershocks sequence and the rainfall pattern over the region as large earthquake (Mw 7.7) has occurred on January 26, 2001 in Kachchh region of western peninsular shield of India and the aftershocks are being reported till the date. We have analyzed rainfall data for 20 years, i.e. 10 years before and 10 years after the main shock of January 26, 2001, recorded by three meteorological observatories in the Kachchh region. We have studied annual total rainfall for two decades, annual rainfall departures from the climate normals, number of rainy days and number of heavy rainfall days during the period for all the three meteorological observatories of Kachchh region. We have found significant increase in all the measured rainfall parameters i.e. annual total rainfall, number of rainy days and number of heavy rainfall days over the Kachchh region during last decade i.e., from 2001 to 2010 after the main shock. Numbers of negative departures have been decreased during the last decade com-pared to previous decade. Thus rainfall pattern over Kachchh region is being changed. This in-crease in rainfall activity over Kachchh region may have been influenced by large earthquake and continuing aftershock activities over the region.
P. C. Trivedi et al.
1081
Keywords Earthquake, Meteorological Parameters, Rainfall, Kachchh Region
1. Introduction Earthquake and weather have been the topic of much discussion and debate since ancient times from Rig-Veda (1700 BCE to 1100 BCE) to Rajatrangini (12th Century CE) in Indian literature. In Brihat Samhita, the great In-dian scholar Varahmihir (505 CE-587 CE) discussed a number of precursors, including extraordinary clouds occurring a week before a large earthquake. In modern times, some scientists claim to have observed anomalous clouds associated with seismic events; some are even attempting to forecast major earthquakes using the cloud patterns [1] [2]. Earthquakes originate deep into the Earth’s crust, while wind, precipitation, temperature and barometric pressure are the surface manifestation of the weather. A direct relation between earthquakes and weather parameters is yet to be established.
In recent years, some observations are documented where small earthquakes occurred after heavy rainfall in some European countries [3] [4]. It has been suggested that the heavy rainfall can trigger tectonic earthquakes. The rain water percolates into the ground and triggers these small shallow earthquakes. Similar observations are also reported for shallow earthquake swarms in central India after monsoons [5].
In 2006, Sebastian Hainzl [3] from the University of Potsdam in Germany and his colleagues studied two clusters of rain-triggered earthquakes, all below 2.4 on the Richter scale that occurred at Mount Hochstaufen in Germany in 2002. The calculation led Hainzl to the conclusion that the Earth’s crust can be so close to failure that even tiny pressure variations associated with precipitation can trigger earthquakes. The relation between rainfall and earthquake activity can be explained with the help of hydroseismicity theory. The hydroseismicity hypothesis is predicated upon the existence of connected deep fracture permeability from the surface to hypo-central depths. Indeed, the fluid pressure at hypocentral depths is assumed to be hydrostatic and not that of litho static kind. This condition is proposed by many geophysicists and petrologists long ago. It is this same con-nected deep fracture permeability that cradles the groundwater fluids in the area. It has suggested that climate plays a key role in triggering such intraplate seismicity. In a seismogenic crust, stress corrosion and fatigue of rock asperities might be more important than purely mechanical effects due to small changes in hydrostatic fluid pressure; however, because any chemical effects are quasi-static, the temporal characteristics of the triggering process might ultimately be determined by the mechanical process, resulting in a hydraulically induced seismic-ity trigger that acts somewhere along paths of pore pressure diffusion, known as the model of intraplate earth-quake generated “hydroseismicity” [6].
A well-known example of such a process is the energy flow through the lithosphere, including the outermost crust of the Earth. The tectonic plates are driven at a slower rate by currents in the asthenosphere, the liquid part below the lithosphere, which transports heat by currents. The energy transferred to the plates is intermediately stored in the form of tension until it is finally released in an earthquake. Earthquake statistics follow the Guten-berg-Richter power law that relates the seismic moment, a measure of the released energy to the probability of such an earthquake.
Collectively, world-wide reports now provide strong support for the hydro seismicity hypothesis as a viable explanation via pore-fluid-pressure diffusion from the surface of the Earth for the occurrence of intraplate earthquakes. Meteorological forcing (rainfall) on the atmosphere-water-table interface results in diffusion of pore-fluid pressure to hypocentral depths, even in some unstable tectonic regions. In this way, many attempts have made to understand relation between earthquake and rainfall and still continue. All of them are on rainfall triggered earthquake. Very few have tried to check rainfall activity after an earthquake event.
We have adopted different approach for the analysis of rainfall parameter. Earlier workings were more related to rainfall triggered earthquake activity while we have attempted to check whether earthquake has any key role in changing rainfall pattern. Most of natural phenomena, whether normal or abnormal, take place due to energy changes in the nature. When an earthquake occurs, whether light, moderate or large, it changes energy level be-tween earth-surface-atmosphere on a small or large scale and it results in changes in subsurface, surface or at-mospheric conditions and we find fractures at the surface or development of new faults or high tides, cyclones,
P. C. Trivedi et al.
1082
abnormal temperature-pressure behavior or change in rainfall activity. There are some reports that the effect of earthquakes is not limited up to lower atmosphere but large earthquakes are also detected by some ionospheric conditions. After analysis of 119 years annual total rainfall data with occurrence of large (M > 6) earthquakes along the fault and thrust systems in the vicinity of Athens interesting correlations were observed. The possible occurrence of a large earthquake in the region is related to rainfall events [7].
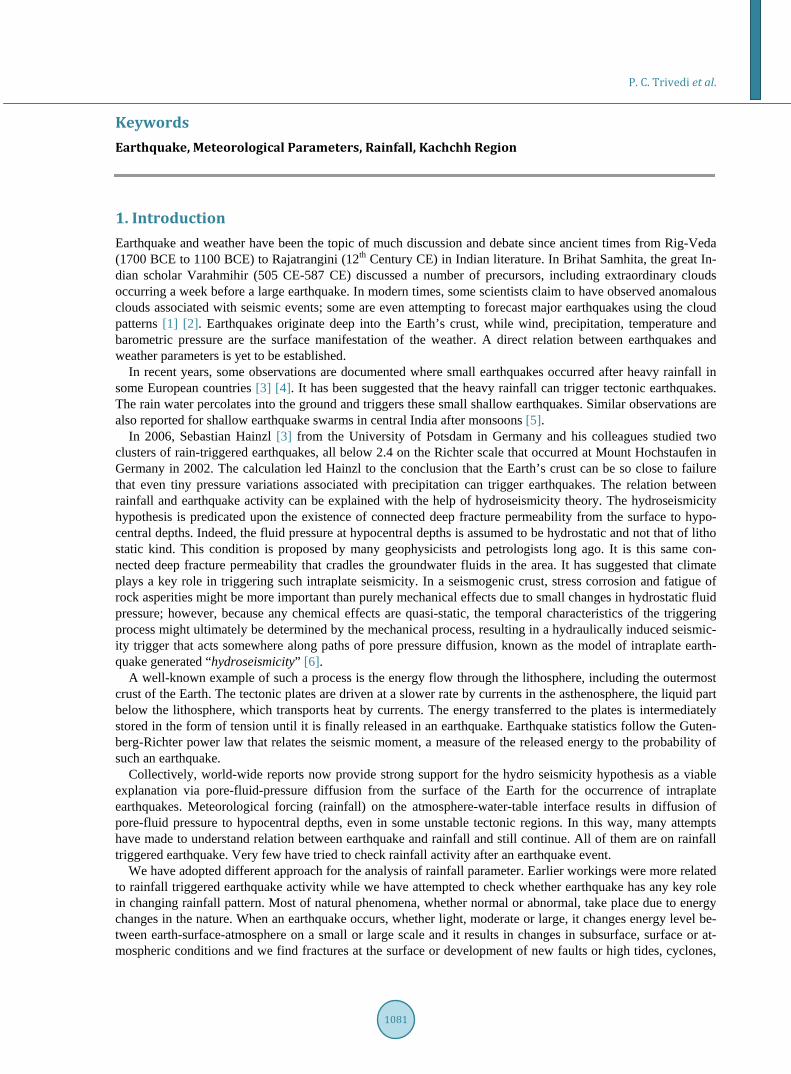
Here, an attempt is made to study rainfall pattern with special reference to the 2001 Bhuj earthquake-after- shock sequence over Kachchh region. Figure 1 shows the study area of the present study. The rainfall data for the period of 20 years i.e. from 1991 to 2010, 10 years before and 10 years after the 2001 Bhuj earthquake are critically analyzed for annual total rainfall, rainfall departures from the climatological normals, number of rainy days and number of heavy rainfall days. The results of these studies are highlighted here.
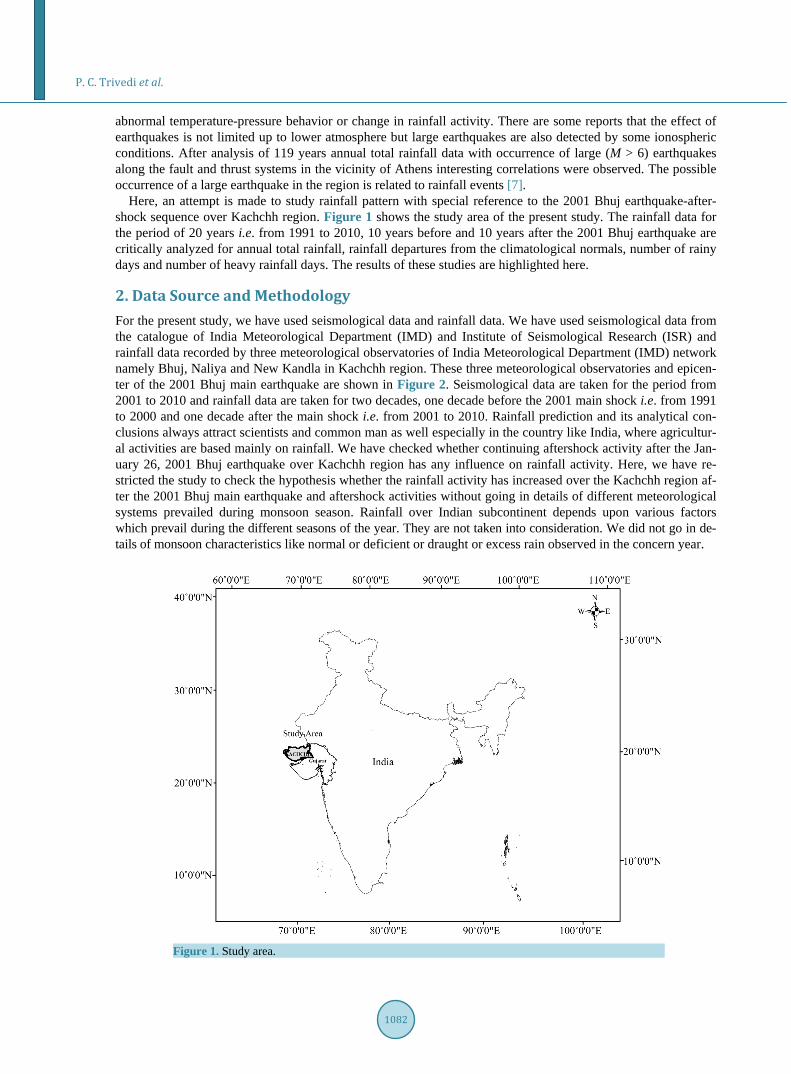
2. Data Source and Methodology For the present study, we have used seismological data and rainfall data. We have used seismological data from the catalogue of India Meteorological Department (IMD) and Institute of Seismological Research (ISR) and rainfall data recorded by three meteorological observatories of India Meteorological Department (IMD) network namely Bhuj, Naliya and New Kandla in Kachchh region. These three meteorological observatories and epicen-ter of the 2001 Bhuj main earthquake are shown in Figure 2. Seismological data are taken for the period from 2001 to 2010 and rainfall data are taken for two decades, one decade before the 2001 main shock i.e. from 1991 to 2000 and one decade after the main shock i.e. from 2001 to 2010. Rainfall prediction and its analytical con-clusions always attract scientists and common man as well especially in the country like India, where agricultur-al activities are based mainly on rainfall. We have checked whether continuing aftershock activity after the Jan-uary 26, 2001 Bhuj earthquake over Kachchh region has any influence on rainfall activity. Here, we have re-stricted the study to check the hypothesis whether the rainfall activity has increased over the Kachchh region af-ter the 2001 Bhuj main earthquake and aftershock activities without going in details of different meteorological systems prevailed during monsoon season. Rainfall over Indian subcontinent depends upon various factors which prevail during the different seasons of the year. They are not taken into consideration. We did not go in de-tails of monsoon characteristics like normal or deficient or draught or excess rain observed in the concern year.
Figure 1. Study area.
P. C. Trivedi et al.
1083
Figure 2. Locations of meteorological stations and epicenter of the January 26, 2001 Bhuj earthquake.
This study includes data analysis of different rainfall parameters. We have adopted a simple analytical method
for present study based on totaling and comparison. First of all, we have studied year wise number of after-shocks after the 2001 Bhuj earthquake from 2001 to 2010 in the vicinity of epicentral area. We then studied year wise rainfall distribution for the same period i.e. from 2001 to 2010 for three meteorological observatories and understood the rainfall tendency. Then we simply compared the trend of both these activities i.e. aftershock ac-tivity and rainfall activity. We have tried to figure out interrelation between these two activities. In the second phase of the study, we have collected daily rainfall data for two decades (1991 to 2010) for all three observato-ries. From such a large dataset we have derived monthly total, seasonal total and annual total rainfall for the pe-riod from 1991 to 2010. We have subsequently derived and studied annual total, biannual total, five yearly total and finally decadal total rainfall for the same observatories and for the same period. Later we resulted out annual total rainfall departures. These rainfall departures are calculated on the basis of normal climate data. The normal climate rainfall data are the 30-years average rainfall data of the given station and considered as a reference against present data and can be treated as a prediction of conditions most likely to be experienced at a given lo-cation. We have derived rainfall departures on the basis of climate normals from 1961-1990 and 1971-2000 and presented the results for rainfall departures on the basis of climate normals of 1971-2000 as it the latest available with IMD. In addition, we carried out a detailed study on “number of rainy days” and “number of heavy rainfall days” by comparison of totaling the data. According to IMD terminology, the day with more than 2.5 mm rain-fall in 24-hours ending at 0300UTC is considered as a rainy day and the day with rainfall more than 64.5 mm in 24-hours ending at 0300UTC is considered as a heavy rainfall day. We have picked out those days with rainfall more than 2.5 mm as a rainy day from daily data and then totaling on annual and decadal basis. Similarly, for heavy rainfall days, we have chosen days with rainfall more than 64.5 mm in 24-hours and totaled it out for an-nual and decadal analysis. Final analysis is conceded out on totaling and comparison basis. The entire analysis is carried out for all three observatories and for 20-years period from 1991 to 2010.
3. Results and Discussion
The analysis and results of the study on rainfall parameters carried out in this paper for all three observatories
P. C. Trivedi et al.
1084
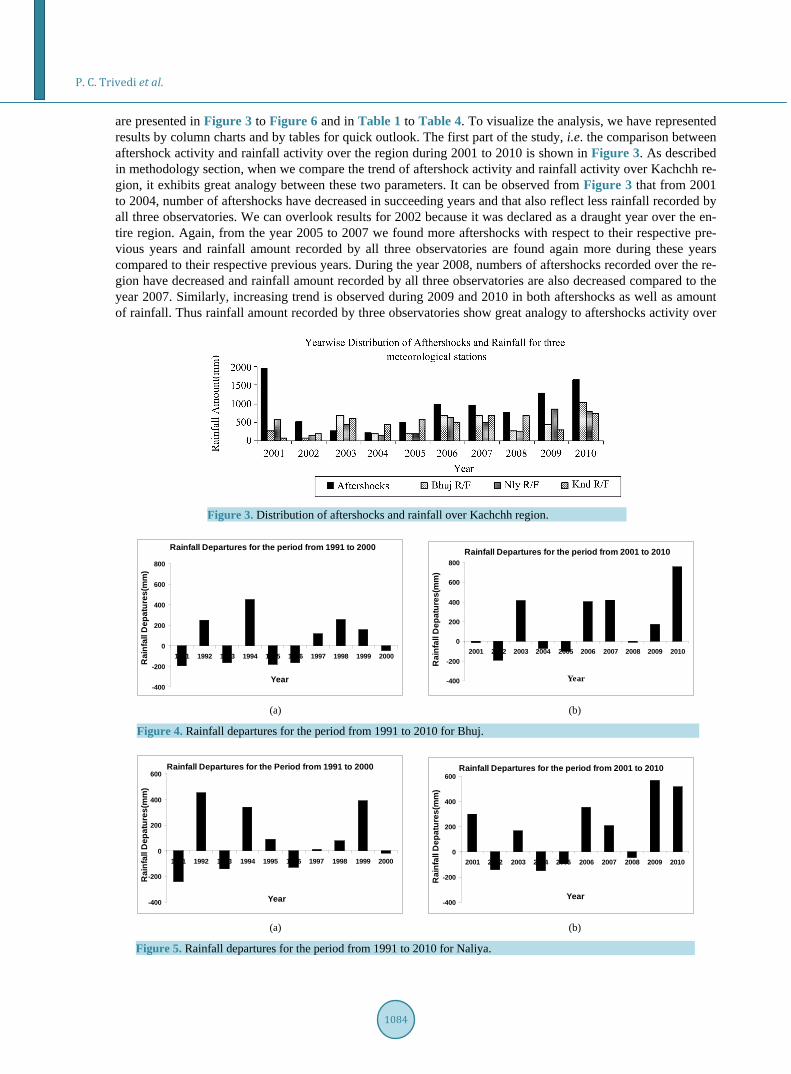
are presented in Figure 3 to Figure 6 and in Table 1 to Table 4. To visualize the analysis, we have represented results by column charts and by tables for quick outlook. The first part of the study, i.e. the comparison between aftershock activity and rainfall activity over the region during 2001 to 2010 is shown in Figure 3. As described in methodology section, when we compare the trend of aftershock activity and rainfall activity over Kachchh re-gion, it exhibits great analogy between these two parameters. It can be observed from Figure 3 that from 2001 to 2004, number of aftershocks have decreased in succeeding years and that also reflect less rainfall recorded by all three observatories. We can overlook results for 2002 because it was declared as a draught year over the en-tire region. Again, from the year 2005 to 2007 we found more aftershocks with respect to their respective pre-vious years and rainfall amount recorded by all three observatories are found again more during these years compared to their respective previous years. During the year 2008, numbers of aftershocks recorded over the re-gion have decreased and rainfall amount recorded by all three observatories are also decreased compared to the year 2007. Similarly, increasing trend is observed during 2009 and 2010 in both aftershocks as well as amount of rainfall. Thus rainfall amount recorded by three observatories show great analogy to aftershocks activity over
Figure 3. Distribution of aftershocks and rainfall over Kachchh region.
(a) (b)
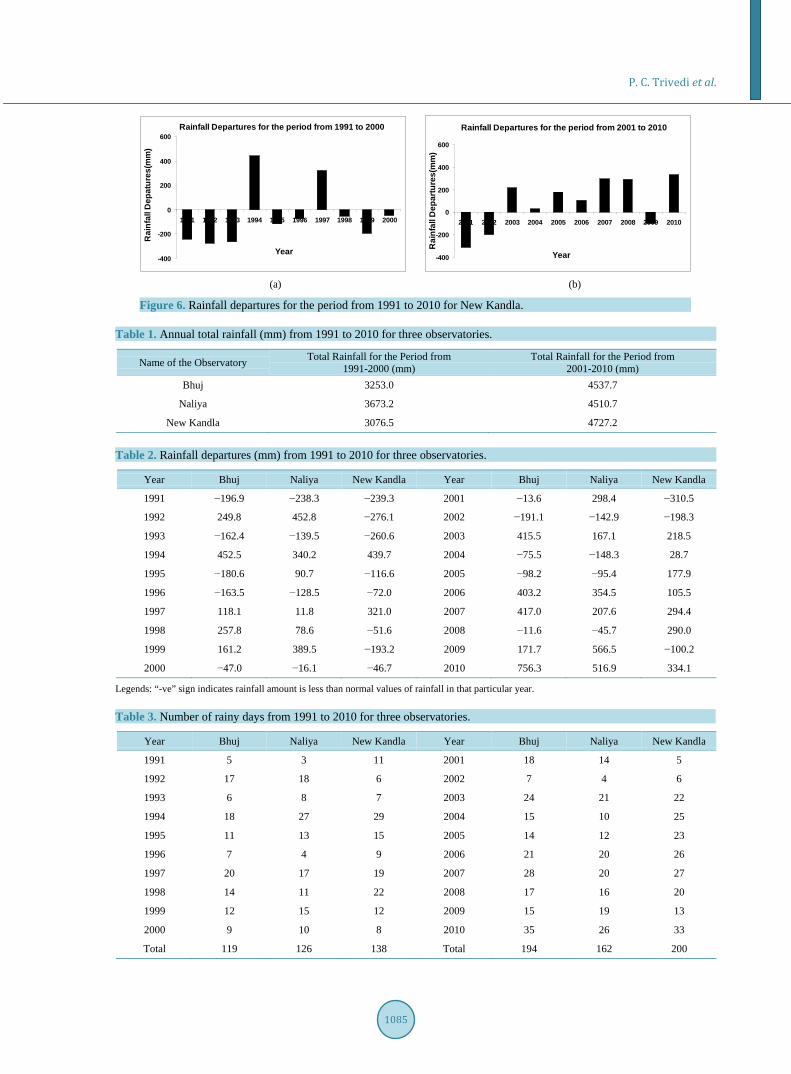
Figure 4. Rainfall departures for the period from 1991 to 2010 for Bhuj.
(a) (b)
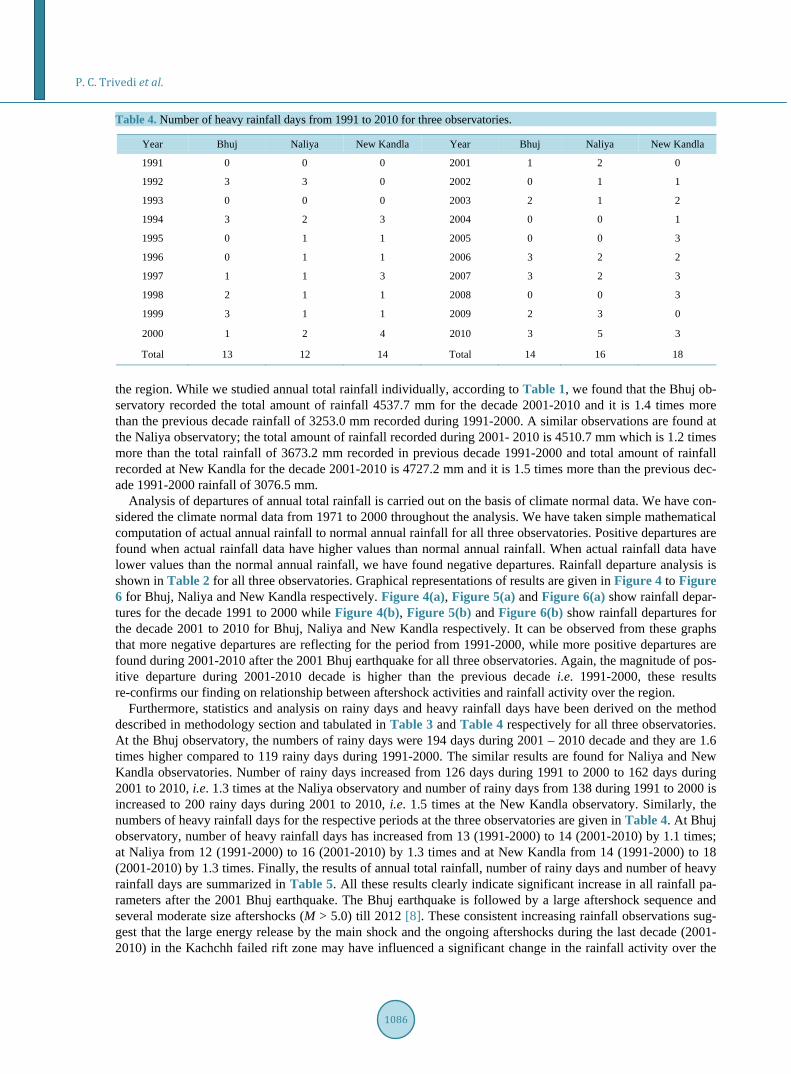
Figure 5. Rainfall departures for the period from 1991 to 2010 for Naliya.
Rainfall Departures for the period from 1991 to 2000
-400
-200
0
200
400
600
800
1991 1992 1993 1994 1995 1996 1997 1998 1999 2000
Year
Rai
nfal
l Dep
atur
es(m
m)
Rainfall Departures for the period from 2001 to 2010
-400
-200
0
200
400
600
800
2001 2002 2003 2004 2005 2006 2007 2008 2009 2010
Year
Rai
nfal
l Dep
atur
es(m
m)
Rainfall Departures for the Period from 1991 to 2000
-400
-200
0
200
400
600
1991 1992 1993 1994 1995 1996 1997 1998 1999 2000
Year
Rai
nfal
l Dep
atur
es(m
m)
Rainfall Departures for the period from 2001 to 2010
-400
-200
0
200
400
600
2001 2002 2003 2004 2005 2006 2007 2008 2009 2010
Year
Rai
nfal
l Dep
atur
es(m
m)
P. C. Trivedi et al.
1085
(a) (b)
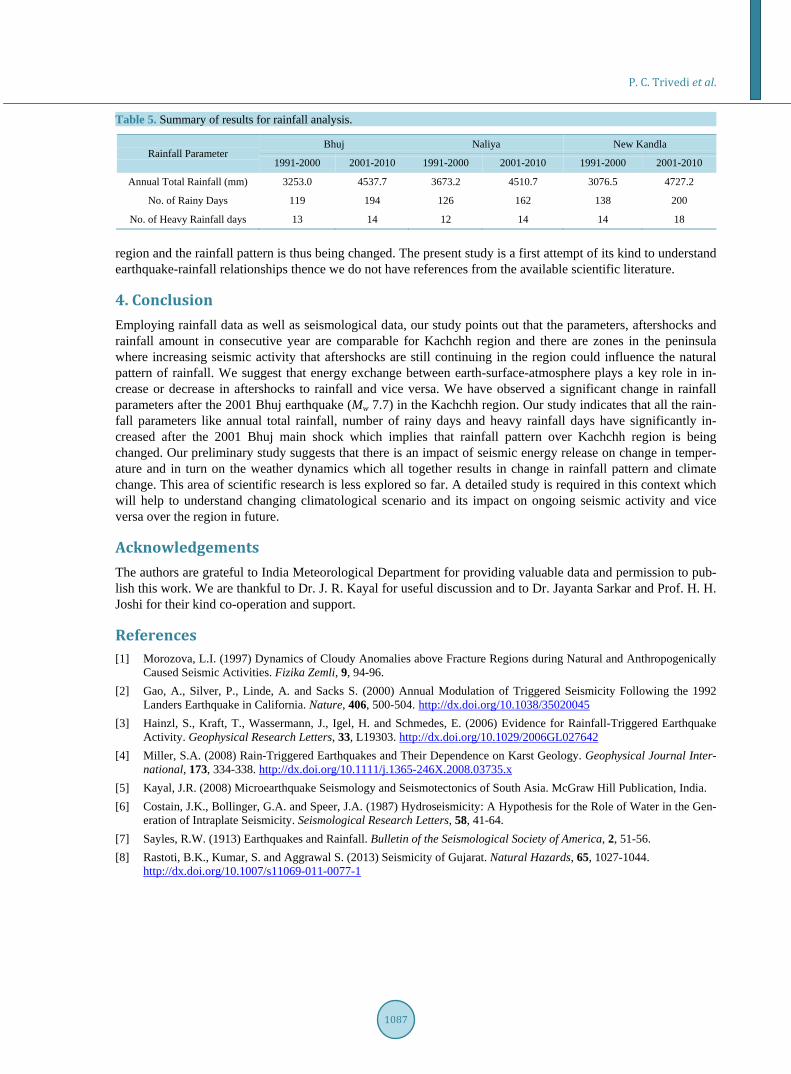
Figure 6. Rainfall departures for the period from 1991 to 2010 for New Kandla. Table 1. Annual total rainfall (mm) from 1991 to 2010 for three observatories.
Name of the Observatory Total Rainfall for the Period from 1991-2000 (mm)
Total Rainfall for the Period from 2001-2010 (mm)
Bhuj 3253.0 4537.7
Naliya 3673.2 4510.7
New Kandla 3076.5 4727.2
Table 2. Rainfall departures (mm) from 1991 to 2010 for three observatories.
Year Bhuj Naliya New Kandla Year Bhuj Naliya New Kandla
1991 −196.9 −238.3 −239.3 2001 −13.6 298.4 −310.5
1992 249.8 452.8 −276.1 2002 −191.1 −142.9 −198.3
1993 −162.4 −139.5 −260.6 2003 415.5 167.1 218.5
1994 452.5 340.2 439.7 2004 −75.5 −148.3 28.7
1995 −180.6 90.7 −116.6 2005 −98.2 −95.4 177.9
1996 −163.5 −128.5 −72.0 2006 403.2 354.5 105.5
1997 118.1 11.8 321.0 2007 417.0 207.6 294.4
1998 257.8 78.6 −51.6 2008 −11.6 −45.7 290.0
1999 161.2 389.5 −193.2 2009 171.7 566.5 −100.2
2000 −47.0 −16.1 −46.7 2010 756.3 516.9 334.1
Legends: “-ve” sign indicates rainfall amount is less than normal values of rainfall in that particular year.
Table 3. Number of rainy days from 1991 to 2010 for three observatories.
Year Bhuj Naliya New Kandla Year Bhuj Naliya New Kandla
1991 5 3 11 2001 18 14 5
1992 17 18 6 2002 7 4 6
1993 6 8 7 2003 24 21 22
1994 18 27 29 2004 15 10 25
1995 11 13 15 2005 14 12 23
1996 7 4 9 2006 21 20 26
1997 20 17 19 2007 28 20 27
1998 14 11 22 2008 17 16 20
1999 12 15 12 2009 15 19 13
2000 9 10 8 2010 35 26 33
Total 119 126 138 Total 194 162 200
Rainfall Departures for the period from 1991 to 2000
-400
-200
0
200
400
600
1991 1992 1993 1994 1995 1996 1997 1998 1999 2000
Year
Rai
nfal
l Dep
atur
es(m
m)
Rainfall Departures for the period from 2001 to 2010
-400
-200
0
200
400
600
2001 2002 2003 2004 2005 2006 2007 2008 2009 2010
Year
Rai
nfal
l Dep
artu
res(
mm
)
P. C. Trivedi et al.
1086
Table 4. Number of heavy rainfall days from 1991 to 2010 for three observatories.
Year Bhuj Naliya New Kandla Year Bhuj Naliya New Kandla
1991 0 0 0 2001 1 2 0
1992 3 3 0 2002 0 1 1
1993 0 0 0 2003 2 1 2
1994 3 2 3 2004 0 0 1
1995 0 1 1 2005 0 0 3
1996 0 1 1 2006 3 2 2
1997 1 1 3 2007 3 2 3
1998 2 1 1 2008 0 0 3
1999 3 1 1 2009 2 3 0
2000 1 2 4 2010 3 5 3
Total 13 12 14 Total 14 16 18
the region. While we studied annual total rainfall individually, according to Table 1, we found that the Bhuj ob-servatory recorded the total amount of rainfall 4537.7 mm for the decade 2001-2010 and it is 1.4 times more than the previous decade rainfall of 3253.0 mm recorded during 1991-2000. A similar observations are found at the Naliya observatory; the total amount of rainfall recorded during 2001- 2010 is 4510.7 mm which is 1.2 times more than the total rainfall of 3673.2 mm recorded in previous decade 1991-2000 and total amount of rainfall recorded at New Kandla for the decade 2001-2010 is 4727.2 mm and it is 1.5 times more than the previous dec-ade 1991-2000 rainfall of 3076.5 mm.
Analysis of departures of annual total rainfall is carried out on the basis of climate normal data. We have con-sidered the climate normal data from 1971 to 2000 throughout the analysis. We have taken simple mathematical computation of actual annual rainfall to normal annual rainfall for all three observatories. Positive departures are found when actual rainfall data have higher values than normal annual rainfall. When actual rainfall data have lower values than the normal annual rainfall, we have found negative departures. Rainfall departure analysis is shown in Table 2 for all three observatories. Graphical representations of results are given in Figure 4 to Figure 6 for Bhuj, Naliya and New Kandla respectively. Figure 4(a), Figure 5(a) and Figure 6(a) show rainfall depar-tures for the decade 1991 to 2000 while Figure 4(b), Figure 5(b) and Figure 6(b) show rainfall departures for the decade 2001 to 2010 for Bhuj, Naliya and New Kandla respectively. It can be observed from these graphs that more negative departures are reflecting for the period from 1991-2000, while more positive departures are found during 2001-2010 after the 2001 Bhuj earthquake for all three observatories. Again, the magnitude of pos-itive departure during 2001-2010 decade is higher than the previous decade i.e. 1991-2000, these results re-confirms our finding on relationship between aftershock activities and rainfall activity over the region.
Furthermore, statistics and analysis on rainy days and heavy rainfall days have been derived on the method described in methodology section and tabulated in Table 3 and Table 4 respectively for all three observatories. At the Bhuj observatory, the numbers of rainy days were 194 days during 2001 – 2010 decade and they are 1.6 times higher compared to 119 rainy days during 1991-2000. The similar results are found for Naliya and New Kandla observatories. Number of rainy days increased from 126 days during 1991 to 2000 to 162 days during 2001 to 2010, i.e. 1.3 times at the Naliya observatory and number of rainy days from 138 during 1991 to 2000 is increased to 200 rainy days during 2001 to 2010, i.e. 1.5 times at the New Kandla observatory. Similarly, the numbers of heavy rainfall days for the respective periods at the three observatories are given in Table 4. At Bhuj observatory, number of heavy rainfall days has increased from 13 (1991-2000) to 14 (2001-2010) by 1.1 times; at Naliya from 12 (1991-2000) to 16 (2001-2010) by 1.3 times and at New Kandla from 14 (1991-2000) to 18 (2001-2010) by 1.3 times. Finally, the results of annual total rainfall, number of rainy days and number of heavy rainfall days are summarized in Table 5. All these results clearly indicate significant increase in all rainfall pa-rameters after the 2001 Bhuj earthquake. The Bhuj earthquake is followed by a large aftershock sequence and several moderate size aftershocks (M > 5.0) till 2012 [8]. These consistent increasing rainfall observations sug-gest that the large energy release by the main shock and the ongoing aftershocks during the last decade (2001- 2010) in the Kachchh failed rift zone may have influenced a significant change in the rainfall activity over the
P. C. Trivedi et al.
1087
Table 5. Summary of results for rainfall analysis.
Rainfall Parameter Bhuj Naliya New Kandla
1991-2000 2001-2010 1991-2000 2001-2010 1991-2000 2001-2010
Annual Total Rainfall (mm) 3253.0 4537.7 3673.2 4510.7 3076.5 4727.2
No. of Rainy Days 119 194 126 162 138 200
No. of Heavy Rainfall days 13 14 12 14 14 18
region and the rainfall pattern is thus being changed. The present study is a first attempt of its kind to understand earthquake-rainfall relationships thence we do not have references from the available scientific literature.
4. Conclusion Employing rainfall data as well as seismological data, our study points out that the parameters, aftershocks and rainfall amount in consecutive year are comparable for Kachchh region and there are zones in the peninsula where increasing seismic activity that aftershocks are still continuing in the region could influence the natural pattern of rainfall. We suggest that energy exchange between earth-surface-atmosphere plays a key role in in-crease or decrease in aftershocks to rainfall and vice versa. We have observed a significant change in rainfall parameters after the 2001 Bhuj earthquake (Mw 7.7) in the Kachchh region. Our study indicates that all the rain-fall parameters like annual total rainfall, number of rainy days and heavy rainfall days have significantly in-creased after the 2001 Bhuj main shock which implies that rainfall pattern over Kachchh region is being changed. Our preliminary study suggests that there is an impact of seismic energy release on change in temper-ature and in turn on the weather dynamics which all together results in change in rainfall pattern and climate change. This area of scientific research is less explored so far. A detailed study is required in this context which will help to understand changing climatological scenario and its impact on ongoing seismic activity and vice versa over the region in future.
Acknowledgements The authors are grateful to India Meteorological Department for providing valuable data and permission to pub-lish this work. We are thankful to Dr. J. R. Kayal for useful discussion and to Dr. Jayanta Sarkar and Prof. H. H. Joshi for their kind co-operation and support.
References [1] Morozova, L.I. (1997) Dynamics of Cloudy Anomalies above Fracture Regions during Natural and Anthropogenically
Caused Seismic Activities. Fizika Zemli, 9, 94-96. [2] Gao, A., Silver, P., Linde, A. and Sacks S. (2000) Annual Modulation of Triggered Seismicity Following the 1992
Landers Earthquake in California. Nature, 406, 500-504. http://dx.doi.org/10.1038/35020045 [3] Hainzl, S., Kraft, T., Wassermann, J., Igel, H. and Schmedes, E. (2006) Evidence for Rainfall-Triggered Earthquake
Activity. Geophysical Research Letters, 33, L19303. http://dx.doi.org/10.1029/2006GL027642 [4] Miller, S.A. (2008) Rain-Triggered Earthquakes and Their Dependence on Karst Geology. Geophysical Journal Inter-
national, 173, 334-338. http://dx.doi.org/10.1111/j.1365-246X.2008.03735.x [5] Kayal, J.R. (2008) Microearthquake Seismology and Seismotectonics of South Asia. McGraw Hill Publication, India. [6] Costain, J.K., Bollinger, G.A. and Speer, J.A. (1987) Hydroseismicity: A Hypothesis for the Role of Water in the Gen-
eration of Intraplate Seismicity. Seismological Research Letters, 58, 41-64. [7] Sayles, R.W. (1913) Earthquakes and Rainfall. Bulletin of the Seismological Society of America, 2, 51-56. [8] Rastoti, B.K., Kumar, S. and Aggrawal S. (2013) Seismicity of Gujarat. Natural Hazards, 65, 1027-1044.
http://dx.doi.org/10.1007/s11069-011-0077-1


![Brihat Samhita [Varah Mihir] (2)](https://img.pdfslide.net/doc/110x75/56d6c0811a28ab30169aa7c8/brihat-samhita-varah-mihir-2.jpg)
