Embed Size (px)
Citation preview

PRESIDENT’S FOREWORD
Preparing the 2017 Budget in the context of the revenue shortfalls experienced in 2015 and
anticipated in 2016 has been challenging. It is therefore particularly pleasing that it has been
possible to produce not only a balanced budget, but one which is also simultaneously
responsible, fair, progressive and realistic.
At its core, is the determination of the Policy & Resources Committee to eliminate the deficit
in the short‐term and return to surplus in the medium‐term. We believe that this is
responsible; but it is also essential to underpin the Policy & Resource Plan, because
sustainable finances are critical to our ability to deliver public services in the long‐term. Our
modelling shows that delivery of savings, with very limited growth in revenues, will produce a
modest budget surplus by 2019. This surplus would enable us to cope with the forecast
growth in demand for services like health and social care; invest in new or improved services;
or replenish our depleted reserves.
In order to achieve a balanced budget in 2017, the burden has been shared fairly between a
reduction in public sector expenditure and revenue raising measures at a ratio of 2:1. The
budget for public expenditure has reduced by some £10million; by comparison, it has been
possible to hold tax and duty increases to half this level at £5.4million.
We are also recommending changes which make the tax system more progressive through:
an above inflation increase in personal allowances which will particularly benefit those on low
and middle incomes; a simultaneous withdrawal of income tax allowances for higher earners;
and reform of the document duty regime which will reduce the cost of purchasing homes of
less than £800,000.
The budget is also realistic and recognises the need to make additional funding available for
health and social care services ahead of their reform and to increase funding for investment
in our capital infrastructure.
The framework for Public Service Reform sets out the vision for future public services and the
need to rethink the way they are delivered in order to meet the current and future needs of
our community. The successful delivery of reform will deliver savings to fund the priorities
identified as part of the Policy & Resource Plan.
It is therefore essential that the priorities of the Plan are taken forward in a co‐ordinated way
with Public Service Reform. It is only by simultaneously delivering reform, an effective policy
planning process and fiscal discipline that we will be able to build a sustainable future for the
islands.
Deputy Gavin St Pier
President, Policy & Resources Committee


CONTENTS
Budget Report Section 1: Strategic Overview 1 Section 2: 2016 Financial Position 5 Section 3: 2017 Budget Estimate 9 Section 4: Income Proposals 13 Section 5: Health and Social Care Services 31 Section 6: Expenditure Proposals 38 Section 7: Capital Reserve 46 Section 8: Forecast 55 Section 9: Other Matters 58 Draft Ordinance: The Excise Duties (Budget) Ordinance, 2016 70
Draft Ordinance: The Taxation of Real Property (Guernsey and Alderney) (Amendment) Ordinance, 2016
73
Draft Ordinance: The Document Duty (Amendment) Ordinance, 2016 80 Appendices Appendix I: Summary of Recent Budget Proposals – Indirect Taxation 85 Appendix II: Budgets Income and Expenditure Account 87 Committee Budgets Policy & Resources Committee 93 Committee for Economic Development 95 Committee for Education, Sport & Culture 97 Committee for Employment & Social Security 99 Committee for the Environment & Infrastructure 101 Committee for Health & Social Care 103 Committee for Home Affairs 105 Scrutiny Management Committee 107 States’ Review Committee 107 Development & Planning Authority 108 Overseas Aid & Development Commission 109 States’ Trading Supervisory Board 110 Royal Court 111 Law Officers 112 States of Alderney 113 Other Budgets Corporate Housing Programme Fund 114 Solid Waste Trading Account 115 Guernsey Registry 116 Ports 117 Guernsey Water 121 States Works 123 Guernsey Dairy 124 States Capital Investment Portfolio – Operating Costs 125 Superannuation Fund Administration 126 Committee for Employment & Social Security ‐ Contributory Funds 127 The Ladies’ College (Senior School) 128
2017 BUDGET REPORT
Section 1: Strategic Overview
Fiscal Policy
1.1 The Fiscal Policy Framework was approved by the States in 2009 (Billet d’État XI, 2009) and is a set of parameters that guides how much money the States can collect from the public; sets out the size and duration of any deficit; and states the maximum amount of borrowing permitted.
1.2 The Treasury and Resources Department historically sought to recommend budgets to the States within the parameters of the framework taking account of the limits on revenue income; the need to seek to balance the budget; and the requirement to invest in capital infrastructure which can, in the short‐term, create pressures and conflicts.
1.3 Overall, the States have been successful in restraining operational expenditure growth over the last two terms of government and have increased the amount of money set aside for investment in infrastructure. Despite this, the overall deficit has run for eight consecutive years with 2016 set to become the ninth other than for the measures now being taken to deliver financial balance.
1.4 The overall deficit reported in the 2015 accounts, equivalent to 1% of Gross Domestic Product (GDP), may be small relative to other jurisdictions but its continued existence is in breach of the framework and therefore must be addressed. It has also become increasingly apparent that there is a structural element to the deficit.
1.5 Tackling this issue and returning to a balanced position is the highest priority for the Policy & Resources Committee since sustainable finances are critical to both Guernsey’s economic success and the States’ ability to provide public services in the long‐term.
1.6 Once the first objective to balance the budget has been achieved, it is important to return to the delivery of surpluses in order to restore the reserves depleted in supporting the deficit over the last eight years. This will enhance our ability to be resilient in the face of future economic changes and deliver on the requirement for long‐run permanent balance.
1.7 In order to achieve this objective, the Policy & Resources Committee is recommending in its policy letter entitled “Phase 1 of the Policy & Resource Plan” that the States commit to operating within the parameters of an updated Fiscal Policy Framework over this political term, which will require us to:
Adhere to the fiscal rules contained within the updated Fiscal Policy Framework;
Present a credible fiscal strategy as part of phase two of the Policy & Resource Plan in June 2017;
Achieve and maintain a balanced budget in the short‐term and surplus in the medium‐term;
1

2017 BUDGET REPORT
Continue expenditure restraint and ensure no real‐terms’ growth in expenditure while the budget remains in deficit;
Provide leadership of the transformation agenda and support Public Service Reform in order to manage both short‐ and long‐term spending pressures;
Ensure that the States’ commercial and semi‐commercial entities and other States’ assets are maximised, making an appropriate return to the States; and
Prioritise capital investment aligned with the Policy & Resource Plan.
1.8 This budget has been compiled in the context of these objectives and has at its core the need to deliver a sustainably balanced budget in the short‐term but reconciling this with the requirement to fund capital investment in our island infrastructure.
Policy & Resource Plan 1.9 The Policy & Resources Committee is confident that in integrating policy and resource
planning in the short‐term, significant benefits will be realised which should ensure that better informed decisions are made in future. Those strategies and plans that are developed should deliver on agreed policy objectives, be affordable and, therefore, sustainable for the Guernsey economy.
1.10 However there is, and will continue to be, only so much time, money and people to deliver the services government is obliged to provide. Inevitably, it will not be possible to provide everything put forward by the Principal Committees as part of the Policy & Resource Plan and it may not be possible or desirable to continue to deliver all of the public services currently provided.
1.11 During the second phase of the Policy & Resource Plan it will be necessary to consider
which proposals to take forward and which will have to wait or, perhaps, not be taken forward at all. This process can be complex and difficult. It will involve dealing with uncertainty and ambiguity and will inevitably involve making difficult or unpopular decisions.
2

2017 BUDGET REPORT
Public Service Reform
1.12 In September 2015, the States considered a policy letter on Public Service Reform (Billet d’État XVI, 2015) and endorsed the accompanying document, “A Framework for Public Service Reform”. This ten‐year plan sets out the vision for the future of public services in Guernsey which will be achieved by transforming the organisation, management, and delivery of services to customers.
1.13 In order to achieve this vision and meet the current and future challenges faced by our community, it will be necessary to rethink the way that public services are delivered. Significant work has already commenced on the Public Service Reform agenda and the transformation programmes within it.
1.14 The successful implementation of transformation will bring a return on investment known as the reform dividend, where cost savings can be used to eradicate the deficit; fund demand in services like health and social care; be invested in new or improved services; generate funding to invest in capital assets; or replenish depleted reserves.
1.15 The Policy & Resources Committee has previously announced its intention to recommend targets for delivery of this “reform dividend”. A real‐terms’ target of 3% has been set for all non‐formula led cash limits (other than for the Committee for Health & Social Care and the Overseas Aid & Development Commission) for 2017 and budgets have been prepared on this basis.
1.16 The President/Vice‐President of the Committee have met with all Principal Committee Presidents/Vice‐Presidents to discuss the approach being taken to identifying projects capable of delivering this 3% target and any support which might be provided through the corporate functions in particular. The Policy & Resources Committee has sought to emphasise the need for change and transformation to service delivery and delivery models as a means of securing savings rather than applying an indiscriminate ‘salami slicing’ approach to budget reductions. It is the intention of the Committee to continue this dialogue in order to co‐ordinate the successful delivery of the savings.
1.17 In order to deliver a balanced budget and create the possibility of unlocking resources to fund other priorities identified as part of the Policy & Resource Plan, it will be necessary to deliver additional reform dividends in subsequent years. The Policy & Resources Committee is planning on the basis of a further 5% saving in both 2018 and 2019 and is under no illusion that this will be an exceptionally challenging target. It will only be possible to deliver this target through real change and transformation to public services and true joint working across services and the political Committees. However, meeting such a challenging target for the reform of services currently provided will be imperative to deliver the savings required to reinvest in public services – either in meeting increased demand or funding new or enhanced services.
1.18 The Policy & Resources Committee intends to commence work with each Committee early in 2017 to identify the opportunities for such savings, which will not simply be allocated on a Committee by Committee basis but based on areas where greatest opportunity exists.
3

2017 BUDGET REPORT
Economic Context and Assumptions
1.19 There has been improvement in some of Guernsey’s core statistics published in the early part of 2016. Population data for the third quarter of 2015 shows a return to net immigration and the first quarter of 2016 saw both real earnings and employment growth on the previous year being reported. This has led to an expectation that the revenue position will improve in some areas. For example, Document Duty receipts, which have declined materially over recent years through low numbers of transactions and a fall in average prices, are budgeted to show a modest increase in 2017, reflecting an increase in the number of transactions taking place by the middle of 2016. In addition, it is anticipated that the growth in real earnings and employment will feed through into real‐terms’ increases in some income tax receipts, although the Policy & Resources Committee’s estimates remain conservative at this stage.
1.20 The fall in oil prices during 2015 has kept inflation rates in Guernsey low over the last four quarters and RPIX was 0.6% at the end of June 2016. This is the increase applied to calculate total 2017 Cash Limits.
1.21 However, the annual inflation rates, RPIX and RPI, will move beyond the effect of this price drop in the third quarter of 2016 and, barring a negative price shock, it is anticipated that there will be a significant increase in inflation rates over the latter half of the year. The current expectation is that, in line with United Kingdom (UK) Consumer Prices Index (CPI) forecasts, RPIX will return to more typical levels (in the region of 3%) during 2017 and measures recommended in this Budget Report have been based on this assumption.
1.22 While there has been some improvement in the current economic conditions, there are both risks and opportunities in the short‐ and medium‐term. For example, in a referendum held in June 2016, the UK voted to leave the European Union (EU). Whilst the UK have not formally commenced the process, work is underway to effect an exit. However, as yet, it is not certain what ‘Brexit’ will mean in terms of the UK’s future relationship with the EU or any impact on Guernsey.
1.23 Guernsey is fortunate in that it is already considered a third country by the EU in regards to the provision of services and, as such, our position for financial services should remain unchanged and may provide opportunities to capitalise on the strength and relative stability of our position. This places Guernsey in a relatively secure position but, given the strength of trading relationships with the UK, we are not isolated from the impact of the uncertainty of the UK’s position. However, for budgeting purposes, a prudent approach has been taken and the negative risk allowed for in forecasts, particularly corporate tax receipts.
4

2017 BUDGET REPORT
Section 2: 2016 Financial Position
2.1 At the end of the first quarter of 2016, the forecast was for an in‐year deficit of £10‐15million, compared to the budgeted balanced position, as a result of a combination of lower income forecasts and expenditure in excess of budget, particularly in the area of health and social care. Therefore, measures were put in place to reduce in‐year expenditure including controls over recruitment; use of consultants and overtime. In addition, Committeesa were asked to review their routine capital expenditure plans and reprioritise or reschedule projects where appropriate and the States’ Trading Supervisory Board was requested to make a return to General Revenue from the unincorporated trading assets.
2.2 As a result of these measures, a total of £4.1million has been realised this year to date which has reduced the projected shortfall:
Reductions of £1million in revenue expenditure;
Return of £1.6million of routine capital allocation by the Committee for Education, Sport & Culture (paragraphs 6.23‐6.26),
In‐year contributions from Guernsey Water (£1million) and States Works (£500,000).
2.3 In addition, a number of other factors including an upturn in Document Duty receipts, a reduction in the forecast overspend by the Committee for Health & Social Care and lower than estimated formula led expenditure have reduced the projected shortfall to £5.4million.
a For the purposes of this Report, the term ‘Committee’ includes the seven Principal Committees plus the following who are also allocated General Revenue Cash Limits: Development and Planning Authority, Overseas Aid & Development Commission, States’ Trading Supervisory Board, Scrutiny Management Committee, Royal Court, Law Officers and States of Alderney.
5

2017 BUDGET REPORT
2.4 The following table summarises the States’ 2016 financial position:
2016 Probable Outturn £m
2016 Budget Estimate
£m
2015
Actual £m
Revenue Income Income Tax 297 305 290 Other Taxes 76 76 69 Miscellaneous Income 20 19 21
Revenue Income 393 400 380 Revenue Expenditure (372) (372) (365)
Revenue Surplus 21 28 15
Routine Capital Allocations (9) (11) (8) Capital Income 10 10 ‐
Operating Surplus 22 27 7
Transfer to Capital Reserve (including capital income) (23)
(28) (36)
Transfer from General Revenue Account Reserve (timing of delivery of FTP benefits) 1 1 4
Deficit ‐ ‐ (25)
Funded by transfer from: General Revenue Account Reserve ‐ ‐ 25
2.5 Compared to budget, the 2016 projected revenue surplus (i.e. before routine capital
allocations and transfer to the Capital Reserve) has decreased by £7million to £21million. This is primarily due to income tax receipts being £8million lower than anticipated.
2.6 The 2016 budget for income tax receipts was compiled in mid‐2015 based on the best information, indicators and forecasts available at that time. However, at the time, the full extent of the deterioration in income tax revenues was not known. There is an inherent difficulty in forecasting income tax receipts as there is a significant time delay between profits and investment income earned and tax paid for all receipts apart from those relating to employment. This delay can be up to two years and can lead to significant under‐ or over‐payments in future years relating to prior years of charge. This can distort the statistics and lead to inaccuracies in forecasting.
6

2017 BUDGET REPORT
2.7 However, the Policy & Resources Committee recognises the importance of being able to forecast revenues with some degree of accuracy since so many other budget decisions rest on the core income. Therefore, an internal working group has been established which is seeking to better analyse the revenue income position both in‐year and forecasting for the future. It is the intention that external members are invited to sit on this group from 2017 onwards.
2.8 As set out in the 2016 Budget Report, as the General Revenue Account Reserve has been exhausted meaning that funds are no longer available to manage in‐year shortfalls in income, short‐term cyclical variations and other timing issues, the 2016 transfer to the Capital Reserve (excluding capital income) from General Revenue was reduced to £18.3million (instead of £36.8million which would have been transferred in line with the agreed policy). Therefore, the deterioration in the 2016 position means that it is recommended that the 2016 transfer to the Capital Reserve is reduced by a further £5.4million to £12.9million in order to deliver an in‐year balanced position. The following table details the anticipated 2016 Probable Outturn for each Committee compared with budget:
2016
Original (Restated) Budget £’000s
Authorised Budgetb
£’000s
Probable Outturn
£’000s
Anticipated (Over) /
Underspend £’000s
Policy & Resources General 24,815 25,830 25,830 ‐ Formula Led 2,010 2,010 2,010 ‐ Economic Development 6,597 6,580 6,478 102 Education, Sport & Culture 79,410 80,465 80,273 192 Employment & Social Security General 11,592 11,827 11,313 514 Formula Led 60,605 60,605 59,235 1,370 Environment & Infrastructure 12,652 12,591 12,453 138 Health & Social Care 118,187 119,890 123,714 (3,824) Home Affairs 33,024 33,449 33,222 227 Scrutiny Management 570 570 570 ‐ Development & Planning 1,520 1,520 1,324 196 Overseas Aid & Development 2,885 2,885 2,885 ‐ States Trading Supervisory 1,584 1,587 1,543 44 Royal Court 2,540 2,541 2,425 116 Law Officers 4,700 4,736 4,736 ‐ States of Alderney 1,880 1,885 1,885 ‐
364,571 368,971 369,896 (925)
Budget Reserve 7,529 3,129 1,904 1,225
372,100 372,100 371,800 300
b Authorised Budgets include inter‐Committee transfers and £4.4million of funding which has been transferred between the Budget Reserve and Committees including £3million in respect of settled pay awards.
7

2017 BUDGET REPORT
2.9 It is anticipated that there will be sufficient funding in the Budget Reserve and underspends from other Committees to fund the increased expenditure by the Committee for Heath & Social Care within the overall total budget for revenue expenditure.
2.10 In recent years, significant prudence has been exercised in estimating probable outturns. In 2015, the probable outturn for revenue expenditure was £365.6million whereas the actual outturn was just over £1million less at £364.5million after allowing for an additional increase in expenditure of £2million by the Health and Social Services Department. Therefore, all other Departments underspent by £3million more than was projected in the 2016 Budget Report.
2.11 Any further increases in revenues or underspends in 2016 will now result in an in‐year surplus which would enable the General Revenue Account Reserve, which is currently some £3million overdrawn, to be replenished. Any further material deterioration would mean that a resolution would be proposed during 2017 to commensurately reduce that year’s appropriation to the Capital Reserve.
8

2017 BUDGET REPORT
Section 3: 2017 Budget Estimate
3.1 The following table summarises the General Revenue financial position:
2017 Budget Estimate
£m
2016 Forecast Outturn £m
2016 Budget Estimate
£m
2015
Actual £m
Revenue Income Income Tax 303 297 305 290 Other Taxes 79 76 76 69 Miscellaneous Income 21 20 19 21
Revenue Income 403 393 400 380 Revenue Expenditure (362) (372) (372) (365)
Revenue Surplus 41 21 28 15
Routine Capital Allocations (11) (9) (11) (8) Capital Income 5 10 10 ‐
Operating Surplus 35 22 27 7
Transfer to Capital Reserve (including capital income) (35) (23)
(28) (36)
Transfer from General Revenue Account Reserve (timing of delivery of FTP benefits) ‐ 1 1 4
Deficit ‐ ‐ ‐ (25)
Funded by transfer from:
General Revenue Account Reserve ‐ ‐ ‐ 25
3.2 The Policy & Resources Committee is committed to being fiscally prudent by delivering
a balanced budget. Therefore, as there are no reserves to support an in‐year deficit, the appropriation to the Capital Reserve from General Revenue is recommended to be adjusted accordingly in order to meet that objective. In 2016, this means that the appropriation is recommended to be revised to £12.9million (plus the transfer of £10million of capital income).
3.3 In order to deliver a balanced budget for 2017, the Policy & Resources Committee is recommending that the appropriation to the Capital Reserve from General Revenue is £29.8million. In addition, it is recommended that the States’ Trading Supervisory Board is set a target minimum contribution of £5million of capital returns (in addition to any dividend paid in accordance with existing policy) which will be transferred to Capital Reserve (paragraph 7.15).
9

2017 BUDGET REPORT
3.4 The main reasons for the improvement of £17million between the General Revenue appropriations to the Capital Reserve in 2016 and 2017 are:
£6.6million ‐ the real‐terms’ budget reductions of 3% (paragraph 6.9);
£4.7million – suspension in 2017 of the grant from General Revenue to the Health Service Fund (paragraph 5.32);
£5.4million net – arising from responsible tax and duty changes, including £2.7million in accordance with extant States’ resolutions arising from the joint States Report from the Treasury and Resources Department and the Social Security Department entitled “Planning a Sustainable Future – The Personal Tax, Pensions and Benefits Review” (“The Joint Report”) (Billet d’État IV, 2015) and the Guernsey and Alderney Tobacco Control Strategy 2015‐2020 (Billet d’État VII, 2015):
o The withdrawal of Personal Income Tax Allowances for Higher Earners in
order to make the Income Tax system more progressive (£2.4million) (paragraph 4.13) in accordance with The Joint Report;
o A real‐terms’ increase in Personal Income Tax Allowances (excluding the Age
Related Allowances) (net cost of £0.6million) (paragraph 4.7) in accordance with The Joint Report;
o Domestic Tax on Real Property rates to increase by 10.5% (£0.6million
bringing the total to £6.3million) (paragraph 4.54) in accordance with The Joint Report;
o Commercial Tax on Real Property to increase by 5% (£0.7million bringing the
total to £15.1 million) (paragraph 4.54);
o A 5p increase in the duty on a litre of fuel (£1.4million) (paragraph 4.35);
o A 5.6% increase in the duty on cigarettes (8.1% for all other tobacco products) (£0.3million) (paragraph 4.40);
o A 2% real‐terms’ increase in the duty on alcohol (£0.6million) (paragraph
4.44).
3.5 At the aggregate level, measures to reduce expenditure are approximately twice the value of the net increases in tax and duty income, albeit the suspension of the grant from General Revenue to the Health Service Fund is a non‐recurring measure.
10

2017 BUDGET REPORT
3.6 If the 2017 Budget had been prepared on the basis of no changes to taxes and continuing the policy of maintaining the real value of the appropriation to the Capital Reserve, there would have been a deficit of £21million. The following table summarises the financial position before and after the proposed budget measures, including a net additional allocation of £3.5million for health and social care services arising from a delay in the delivery of savings (paragraph 5.35):
2017
‘Base’ £m
2017 Budget
Measures£m
2017 Budget Estimate
£m
Income Tax 301 2 303 Other Taxes 76 3 79 Other Income 21 ‐ 21 Total Revenue Income 398 5 403 Revenue Expenditure (370) 8 (362)
Revenue Surplus 28 13 41
Routine Capital Allocations (11) ‐ (11) Capital Income ‐ 5 5
Operating Surplus 17 18 35
Transfers to Capital Reserve: General Appropriation (38) 8 (30) Capital Income ‐ (5) (5)
Deficit (21) 21 ‐
Fiscal Policies
3.7 The Budget has been prepared with due regard to the Fiscal Framework including that the “upper limit on aggregate government income, incorporating General Revenue, Social Security contributions and fees and charges, such that total government income should not exceed 28% of Gross Domestic Product.” It is estimated that, taking into account the measures proposed in this Budget Report and in the Committee for Employment & Social Security’s November 2016 policy letter entitled “Benefit and Contribution Rates for 2017”, that aggregate government income in 2017 will represent approximately 24% of GDP (calculation based on the 2015 GDP estimate).
11

2017 BUDGET REPORT
3.8 The 2016 Budget Report included “The Treasury and Resources Department considers that the current lack of integration and co‐ordination between the two key revenue raising functions of the States (income tax and social security contributions) means planning for compliance with this limit will prove challenging in the medium‐term. It is also a concern that the States continue to consider, in isolation, changes to non‐contributory benefit rates which consequently affect the resources available to allocate to other Departments through the Budget process. Therefore, it is the firm view of the Department that the next States will need to give serious consideration to reforming the current system and presenting a single Policy Letter incorporating all proposals affecting the States’ financial position.”
3.9 The Policy & Resources Committee agrees with this assessment and has already discussed and agreed with the Committee for Employment & Social Security that the two Committees will work together on fiscal matters and explore ways of integrating fiscal decision making.
12

2017 BUDGET REPORT
Section 4: Income Proposals
Corporate Income Tax 4.1 In April 2015, following consideration of The Joint Report, the States resolved, inter alia:
“To direct the Treasury and Resources Department, having due regard for the need to provide a stable platform, maintain business confidence, support and encourage financial services and to retain an internationally acceptable and competitive tax environment for the islands’ businesses, to continue to closely monitor the appropriateness of the corporate tax regime, and to report back to the States should it consider any changes are necessary.”
4.2 Following consideration of the 2016 Budget Report, the States agreed three extensions to the scope of corporate income tax: to extend the 10% rate to the provision of custody services by banks; extend the 20% rate to the importation and/or supply of hydrocarbon oil or gas in Guernsey; and extend the 20% rate to retail business carried on in Guernsey where the company has a taxable profit of more than £500,000 in a year from such business.
4.3 It was noted that these changes, together with previous decisions to increase commercial TRP and employers’ social insurance contributions as well as the taxation of distributions from companies, mean that government is now receiving a broadly comparable amount from the corporate sector as it was before the adoption of the Zero‐Ten corporate regime.
4.4 The Policy & Resources Committee, in accordance with the above resolution, continues to monitor the appropriateness of the corporate tax regime and will report back to the States as and when it considers any other changes should be made. The matters and initiatives that will be considered as part of the monitoring of emerging and evolving international standards include: the Organisation for Economic Development and Co‐ordination’s Base Erosion and Profit Shifting actions, to which Guernsey has already demonstrated an active commitment; the development of the EU Commission’s criteria for tax good governance, used as the basis for potential Code Group assessment of third country jurisdictions; and the EU Commission’s Anti‐Tax Avoidance Directive.
13

2017 BUDGET REPORT
Personal Income Tax
Update on Progressing The Joint Report resolutions
4.5 In April 2015, following consideration of The Joint Report, the States approved, inter alia:
“To agree between 2015 and 2025, and subject to approval and implementation set out in Propositions 28 to 39 below, to phase in increases in personal tax allowances to no more than £17,500 (at 2015 prices), the level of phasing having regard to other measures introduced as a result of the States of Deliberation’s approval of these Propositions, and direct the Treasury and Resources Department to bring forward proposals to effect this in their annual Budget Reports.
To direct the Treasury and Resources Department, in conjunction with any decision to increase personal allowances along the lines set out in Proposition 27, to report to the States with detailed proposals to remove the universality of personal tax allowances and instead to introduce a scheme which provides for personal tax allowances to be withdrawn gradually as a person’s income increases up to the point where a person whose income exceeds a certain amount receives no personal tax allowance.
To agree to freeze the personal tax allowance provided to those over the age of 64 until such time as the personal tax allowance for those under the age of 65 reaches the same level and thereafter that the personal tax allowance for all tax payers should be the same, and direct the Treasury and Resources Department to bring forward proposals to effect this in its annual Budget Reports.
To direct the Social Security and Treasury and Resources Departments to investigate options to make the tax and social security system as a whole more progressive, through the withdrawal of personal tax allowances (such investigation to include consideration of the interaction with the upper earnings limit on Social Security contributions in order to avoid high marginal rates of taxation) and to report back to the States with their findings no later than June 2017.”
4.6 This Budget Report includes proposals for the following measures to progress these resolutions:
A 3.4% increase in the Single person’s personal allowance (to £10,000) and Married person’s personal allowance (to £20,000) and the supplementary allowances;
No increase in the higher personal allowances available to those aged sixty four or over at the commencement of the Year of Charge (“Age Related Allowances”);
With effect from Year of Charge 2019, no new Age Related Allowances will be given;
With effect from Year of Charge 2018, no new claims will be admitted for Dependent Relative Allowance in respect of children in higher education;
Gradual withdrawal of personal allowances if a person’s income exceeds the annual Upper Earnings Limit (UEL) for Social Security contributions.
14

2017 BUDGET REPORT
2017 Personal Income Tax Allowances
4.7 In order to maintain Guernsey’s personal tax competitiveness with other jurisdictions, such as Jersey, the Isle of Man and the UK, a 3.4% increase in the Single person’s and Married person’s personal allowances for those aged under sixty five (to £10,000 and £20,000 respectively) and the supplementary allowances is proposed.
4.8 It is estimated that each 1% increase in personal allowances above the forecast growth in employment tax income results in a decrease in States’ revenues of approximately £800,000. Therefore, as the employment tax income is forecast to grow by 2%, the further 1.4% increase will result in a reduction in States’ revenues of approximately £1.1million.
4.9 In accordance with the direction set in The Joint Report, there are no increases recommended in the Age Related Allowances. The provision of an extended allowance for people aged over sixty five costs the States an estimated £3million per annum; freezing this allowance in 2017 and allowing the differential to be narrowed will reduce this additional cost by approximately £500,000.
4.10 It is recommended that no Age Related Allowance will be given to anyone turning sixty five from 2019 onwards, instead such individuals will continue to receive the Single person’s or Married person’s Allowance available to those under the age of sixty five. This is consistent with the direction set in the Joint Report that age‐related enhancements to Personal Allowances should end as offering an extended tax allowance on the basis of age is considered to be inequitable, positively discriminating in favour of older people but not targeting those most in need.
4.11 The personal allowances for 2017 are recommended to be as follows:
Single person’s £10,000 Single person’s entitled to age relief £11,450 Married person’s £20,000 Married person’s, one entitled to age relief £21,450 Married person’s, both entitled to age relief £22,900
4.12 The supplementary personal income tax allowances for 2017 are recommended to be
as followsc
Dependent relative £3,225 Housekeeper £3,225 Infirm Persons £3,225 Charge of Children £6,775
c In respect of claims for dependent relatives (other than for children in higher education), housekeepers and infirm persons, as approved as part of the 2008 Budget, no new claims have been admitted for the Year of Charge 2009 or will be admitted for any subsequent year of charge. Existing claims, however, will continue to be allowed, so long as they continue to meet the conditions.
15

2017 BUDGET REPORT
Withdrawal of Personal Allowances for Higher Earners
4.13 As directed in the resolutions of The Joint Report, the Policy & Resources Committee is proposing measures in this Budget Report as Phase 1 of the removal of the universality of personal tax allowances. It is recommending the introduction of a scheme which provides for personal tax allowances to be withdrawn gradually at a rate of £1 for every £3 that a person’s income exceeds the UEL on Social Security contributions (recommended to be £138,684 in 2017) which will be pro‐rated in the year of arrival or permanent departure.
4.14 Withdrawing personal tax allowances in this way increases the maximum marginal rate (the percentage of income tax paid on each additional £1 earned) to 26.7% for those with income above the threshold. This is because an individual must pay tax both on the additional money they earn and the allowance they have lost as a result of the increase in their income. A threshold below the UEL would increase the marginal rate, capturing both income tax and social security contributions, which for self‐employed individuals could exceed 37.2% at a 1:3 ratio. Such high marginal rates could damage Guernsey’s competitive position, particularly when compared to other jurisdictions, making it more difficult to recruit and retain staff.
4.15 The following table illustrates the effect of this proposal on a single individual under the age of sixty who is currently entitled to receive only the personal allowance (£10,000 in 2017):
Income Allowance withdrawn
Allowance received
£138,684 £nil £10,000
£140,000 £439 £9,561
£150,000 £3,772 £6,228
£160,000 £7,105 £2,895
£168,684 £10,000 £nil
4.16 It is estimated that this measure would affect approximately 1,150 individuals (less than
3% of taxpayers) and raise an estimated £2.4million per annum annually. In order to administer this change (including to issue appropriate coding notices, process income tax returns and deal with queries from those impacted), an additional member of staff will be required and this is incorporated in the budget for Income Tax within the Policy & Resources Committee.
4.17 Phase 2 of the removal of the universality of personal tax allowances will consider the threshold at which withdrawal commences and the withdrawal of other allowances and reliefs for higher earners. This work will be carried out in conjunction with the Committee for Employment & Social Security’s review into ensuring that the treatment of social security contributors is equitable, such review having particular regard to the upper earnings limit on contributions, the rates charged for self‐employed and non‐employed contributors and the definition of income used in the assessment of contributions for non‐employed contributors.
16

2017 BUDGET REPORT
Dependent Relative Allowance
4.18 This allowance may be claimed by individuals who have a child aged over nineteen and in full‐time higher education (the allowance is reduced by £1 for every £1 that the child’s income exceeds £6,550). This allowance, which is recommended to be £3,225 for 2017, provides a reduction in income tax payable of a maximum of £645 per annum for each claimant and costs approximately £250,000 per annum. It is considered that specific tax allowances to households in defined circumstances is similar to the provision of a universal benefit and, in many cases, are not well‐targeted and, in some cases, not effective in achieving their original purpose. Therefore, it is recommended that, with effect from the Year of Charge 2018, no new claims are admitted for Dependent Relative Allowance in respect of children in higher education. This will have no effect on parents of children who are currently in full‐time higher education or who start a full‐time higher education course in 2017.
Income Tax on distributions
4.19 Currently, profits made by a non‐Guernsey incorporated company prior to an individual’s arrival in Guernsey (and which could have been distributed prior to arrival) are subject to Guernsey income tax when they are distributed, albeit any liability is limited by the income tax cap. It is understood that this may be dissuading some high net worth individuals from relocating to Guernsey since concessions are available in some competitor jurisdictions.
4.20 It is recommended that the Income Tax Law is amended to exempt from Guernsey tax, distributions from the accumulated profits of a non‐Guernsey incorporated company (which has not prior to the individual’s arrival, carried on business in Guernsey, nor been used to hold Guernsey investments), which arose prior to the date the beneficial member of that company moves to Guernsey, subject to the beneficial member having an interest in the company of 1% or more and this income actually being distributed to the member by the end of the second full year of charge since the individual became resident.
4.21 This will encourage the individual to distribute the profits within two years and thus potentially invest such funds whilst they are resident in Guernsey. This is considered to be a technical change which will ensure that Guernsey’s regime is competitive with other jurisdictions (such as Jersey and the Isle of Man) in order to be attractive to high net worth individuals who are considering relocating to Guernsey; reduce administrative and compliance work by the individuals and Income Tax; and have a minimal effect on income tax collected (due to the effect of existing double tax relief arrangements).
Benefits in Kind
4.22 “Benefits in Kind” are non‐cash benefits, received by an employee from their employer,
commonly consisting of the use of assets (for example, the occupation of a property or use of a motor vehicle) without a transfer of ownership, or from third parties (such as gifts from customers or their employer). Regulations are required to set the amount to be charged to income tax for certain such benefits.
17

2017 BUDGET REPORT
4.23 In order to maintain the real value of Benefits in Kind charges, which were last increased in 2014, it is recommended that they are increased at a fixed percentage of 3% per annum, compounded, for each of the next three years (2017 – 2019 inclusive). By scheduling the proposed charges now, rather than increasing charges annually, employers who provide such benefits will be able to plan for the proposed increases when amending their payroll systems, rather than requiring an amendment each year.
4.24 The Benefit In Kind charges for 2017‐2019 are recommended to be as follows:
Benefit in Kind Charges
Current
2016
Proposed
2017
Proposed
2018
Proposed 2019
Cars:
Limited private use only £1,150 £1,185 £1,220 £1,255
Cost less than £10,000 £3,450 £3,555 £3,660 £3,770
Cost £10,000 ‐ £19,999 £5,750 £5,925 £6,105 £6,290 Where the cost is £20,000 or more, the taxable benefit is 35% of the cost, per annum.
3,4 and 5 star hotel / guesthouse accommodation for proprietary directors, proprietary employees and their dependants:
Single Person £2,180 £2,245 £2,310 £2,380
Married Person £3,645 £3,755 £3,870 £3,985
Children up to age 1 * ‐ ‐ ‐ ‐
Children between 1‐4 years * £345 £355 £365 £375
Children between 5‐16 years * £980 £1,010 £1,040 £1,070
Children age 17+ and still in formal education *
£1,440 £1,485 £1,530 £1,575
1 and 2 star hotel / guesthouse accommodation for proprietary directors, proprietary employees and their dependants:
Single Person £1,895 £1,950 £2,010 £2,070
Married Person £3,170 £3,265 £3,365 £3,465
Children up to age 1 * ‐ ‐ ‐ ‐
Children between 1‐4 years * £345 £355 £365 £375
Children between 5‐16 years * £850 £875 £900 £925
Children age 17+ and still in formal education *
£1,260 £1,300 £1,340 £1,380
Employed managers (other than proprietary managers) and other employees:
Accommodation (per week) £20 £25 £25 £25
Food (per week) £20 £25 £25 £25
At 31 December in the relevant year.
4.25 The following example shows the effect of this change:
An employee is provided with a vehicle that costs £18,000. In 2016, the actual tax due would be £1,150. Under the proposed rates, this would increase to actual tax due of £1,185 (2017), £1,221 (2018) and £1,258 (2019), an increase of £35 in 2017, a further £36 in 2018 and a further £37 in 2019.
18

2017 BUDGET REPORT
Charitable Giving
4.26 The voluntary and charitable sectors make a significant contribution to Guernsey’s community, by supporting the work of the States and, in some circumstances, providing support that the States do not or cannot provide. The Association of Guernsey Charities (“the Association”) has, through the Third Sector Compact and subsequent partnership with government, ensured that the contribution and needs of the voluntary and charitable sectors are now far better understood by government.
4.27 The Policy & Resources Committee has been approached by the Association to consider extending the tax relief available on charitable donations. The Committee wishes to encourage further charitable giving in support of the valuable work undertaken by the third sector. However, as such measures would result in a decrease in income tax receipts, it is not possible to recommend increases in such tax relief in the current fiscal environment.
4.28 However, the Committee will undertake a review of potential measures to support the voluntary and charitable sector including the thresholds of tax relief on charitable donations and the introduction of a payroll giving scheme. This work will be undertaken in partnership with the Association and the Committee will report back in the 2018 Budget Report.
Other Taxes and Duties
Environmental Taxes
4.29 In April 2015, following consideration of The Joint Report, the States resolved, inter alia:
“To direct the Treasury and Resources Department, after consultation with the Environment Department, Social Security Department, Commerce and Employment Department and Policy Council as appropriate, to lay before the States no later than March 2016 proposals to diversify the tax base by introducing or increasing environmental taxes, and to agree that a comprehensive energy efficiency programme to assist in mitigating any possible regressive effects of such taxes on low income households should form an integral part of such diversification.”
4.30 During 2016, a detailed review has been undertaken (available on the States of Guernsey website) that considered different forms of environmental taxation, including references to the approaches taken in Jersey, the UK, the EU and other jurisdictions. The report, which identifies four categories of environmental taxation: energy; transport; pollution and resources, identifies the key benefits of each option and how they could be applied in Guernsey. In general, the report has concluded that the introduction of further environmental taxes in Guernsey presents significant challenges, including substantial evidence that they can be regressive and fall disproportionately on low‐income households.
19

2017 BUDGET REPORT
4.31 There are a number of environmental taxes that are currently charged in Guernsey including excise duty on motor fuel (which has increased substantially in recent years including as a result of the abolition of motor tax) and the recent introduction of a First Registration Duty (which is based on a motor vehicle’s carbon dioxide emission levels).
4.32 In light of the these existing measures, the imminent introduction of volume‐based waste disposal charges and the intention to investigate the extension of excise duty to all other fuels oils (paragraph 4.38), the Committee is not, at this time, intending to consider further the introduction of other environmental taxes.
Excise Duty on Motor Fuel
4.33 As shown in the graph below, the volume of motor fuel used is declining from nearly 34million litres in 2008 by 9% to an expected 31million litres in 2016:
4.34 This is having an adverse effect on excise duty income meaning that percentage
increases in duty rates are not resulting in similar percentage increases in income. It is understood that the reasons for this fall in volume are increased efficiency of engines and changes in driving habits. In order to compensate for the loss of income arising from the 3million litres reduction in volume, a duty increase of nearly 6p per litre would be required.
4.35 Based on the inflation forecast of 3%, an increase of 1.8p per litre would be needed to maintain the real value of excise duty on motor fuel. However, in order to partially compensate for the fall in volumes of motor fuel being consumed, it is recommended that excise duty on motor fuel is increased by 5p per litre to 63.5p per litre as detailed in the table below:
2016 Increase 2017
Maintaining real value of income from ‘Motor Tax’ element 38.5p 1.2p 39.7p
Other 20.0p 3.8p 23.8p
TOTAL 58.5p 5.0p 63.5p
29,000
30,000
31,000
32,000
33,000
34,000
35,000
2008 2009 2010 2011 2012 2013 2014 2015 2016
'000 litres
Year
20

2017 BUDGET REPORT
4.36 The concessionary rate of duty on petrol for marine use will increase by 3.8p (i.e. the non ‘Motor Tax’ element) to 40.4p per litre.
4.37 This would raise an additional £1.4million per annum (£850,000 in real‐terms without any further fall in volumes consumed). A further 2% fall in volumes would reduce the increase in income to £1million (£450,000 in real terms).
4.38 It is apparent that excise duty on motor fuel is a shrinking tax base and, in order to maintain the real value of the income derived from this source, it is likely that, unless the tax base is changed, above inflation rises will be needed in future years to compensate for anticipated falling volumes of fuel consumed. Therefore, having regard to the recognised need to ensure future revenue stability, the Policy & Resources Committee is of the view that it is an appropriate time to consider whether the scope of fuel oils subject to excise duty should be extended. Therefore, it is recommended that the States endorses the Committee investigating the extension of excise duty to other fuels oils, consulting with industry and the public and reporting back with, if appropriate, recommendations in the 2018 Budget Report. This investigation would be carried out in close collaboration with the Committee for Home Affairs.
Excise Duty on Tobacco 4.39 In April 2015, the States considered a States Report from the Health and Social Services
Department entitled “Guernsey and Alderney Tobacco Control Strategy 2015 – 2020” (Billet d’État VII, 2015) and resolved, inter alia:
“To increase the rate of excise duty on cigarettes at a minimum of the Retail Price Index(X) plus 5% annually for the five years 2016 to 2020; and
To increase the rate of excise duty on other tobacco products at a minimum of Retail Price Index (X) plus 7.5% annually for the five years 2016 – 2020, subject to the rate of excise duty on each tobacco product not exceeding the rate of excise duty on cigarettes;”
4.40 Therefore, as the increase in the Guernsey RPIX as at June 2016 is 0.6%, the Policy & Resources Committee is recommending an increase in excise duty in respect of cigarettes of 5.6% and for all other tobacco products of 8.1% as follows:
Description of Goods Present Rate of Duty Per Kilogram
Proposed Rate of Duty Per Kilogram
Cigarettes £298.52 £315.24 £
Cigars £283.72 £306.70
Hand rolling tobacco £264.21 £285.61
Other manufactured tobacco £229.17 £247.73
Tobacco leaf – unstemmed £254.40 £275.01
Tobacco leaf – stemmed £256.96 £277.77
21

2017 BUDGET REPORT
4.41 The excise duty on an average packet of 20 cigarettes would increase from £4.39 to £4.64d There is strong world‐wide evidence that the demand for tobacco products is price‐sensitive. Furthermore, the continuing real‐terms’ increases in the duty on tobacco are considered to be a powerful motivator for smokers to quit and to deter young people from starting smoking. It should be noted, though, that although decreasing import volumes indicate that less tobacco is being consumed, such indication may be countered by an increase in the amount of tobacco products being consumed on which no duty has been paid.
4.42 It is estimated that the income from Excise Duty on Tobacco will be £9.2million (which includes approximately £1million of one‐off receipts due to significant imports anticipated in 2015 actually taking place in in 2016) and £8.5million in 2017. Therefore, it is anticipated that the budget measure will raise an additional £300,000.
Excise Duty on Alcohol
4.43 The “Drug & Alcohol Strategy Action Plan 2010‐2015” which was considered by the States in January 2015 (Billet d’État I, 2015) included the aim “To reduce the availability of cheap and heavily discounted alcohol and irresponsible promotions” which would be addressed, inter alia, through “increases [in] duty on alcohol products year or year”.
4.44 Therefore, it is recommended that the increase in the duties levied on alcohol is 5% ‐ a real‐terms’ increase of 2%, raising an additional £600,000 per annum (£250,000 real‐terms’ increase). The 2017 budgeted income from excise duty on alcohol is £12.6million.
4.45 The Committee is recommending that duties be changed as follows:
Description of Goods
Present
Rate of
Duty Per Litre
Proposed Rate of
Duty Per Litre
Exceeding 1.2% ABV but not exceeding 2.8% ABV 45p 47p
Exceeding 2.8% ABV but not exceeding 4.9% ABV 71p 75p
Exceeding 4.9% ABV but not exceeding 7.5% ABV 89p 94p
Exceeding 7.5% ABV £1.04 £1.09
Exceeding 2.8% ABV but not exceeding 4.9% ABV – small independent brewery/producer 45p 47p
Exceeding 4.9% ABV but not exceeding 7.5% ABV – small independent brewery/producer
57p 60p
Spirits (per litre of pure alcohol) £32.34 £33.96
Wines:
Not exceeding 5.5% ABV 56p 59p
Exceeding 5.5% ABV but not exceeding 15% ABV £2.28 £2.39
Exceeding 15% ABV £3.64 £3.82
d Compared to £5.59 (plus 5% GST) in Jersey and £5.50 (plus 20% VAT) in the UK.
22

2017 BUDGET REPORT
4.46 The effect of these changes on the most popular products is detailed below:
Description of Goods Present 2016 Duty
Increase in Duty
Proposed 2017
Duty
Beer / Cider (2.8% ‐ 4.9% ABV) – small independent brewery – 1 pint
25.56p
1.14p
26.70p
Beer / Cider (2.8% ‐ 4.9% ABV) ‐ 1 pint 40.33p 2.27p 42.60p
Beer / Cider (4.9% ‐ 7.5% ABV) ‐ 1 pint 50.55p 2.84p 53.39p
Spirits (37.5% ABV) – 25mls 30.32p 1.52p 31.84p
Spirits (37.5% ABV) – bottle (1 litre) £12.13 61p £12.74
Light wine (5.5% to 15% volume) – 125mls 28.50p 1.38p 29.88p
Light wine (5.5% to 15% volume) – bottle (750mls) £1.71 8p £1.79
Implementation of Excise Duty Budget Proposals
4.47 Under its existing powers, the Policy & Resources Committee will make an Order bringing the recommended changes in the rates of excise duty into effect on the date of publication of the Billet d’État containing this Report. The Order will cease to have effect at the conclusion of the States’ Budget meeting and the Committee accordingly recommends the States to approve by Ordinance that, from that date, the rates of excise duty shall be varied as set out in this Report. These arrangements are the same as in previous years.
Sugar Tax
4.48 In March 2016 (Billet d’État VI, 2016) the States considered a Policy Letter from the Health and Social Services Department entitled “Guernsey and Alderney Healthy Weight Strategy 2016‐2023” and, inter alia, resolved “To direct the Health and Social Services Department (and its successor Committee) to work with the Home Department (the Guernsey Border Agency) and Treasury and Resources Department (and their successor Committees), to investigate the potential for implementation and administration of a tax on sugar sweetened beverages.”
4.49 The main body of the Policy Letter included: “This is not likely to be a policy that is implemented early, but may be something that is required if sufficient progress is not being made through the other strands of the Strategy. Government should, and will, prioritise educational and behavioural initiatives first, and only look to fiscal measures as a last stop option.”
4.50 In May 2016, a working group at officer level was formed with representatives from Public Health, Guernsey Border Agency and Treasury. The group has since expanded its membership to include relevant officers from the States of Jersey so that the benefits of joint‐working can be achieved.
23

2017 BUDGET REPORT
4.51 The initial focus for the group is monitoring the developments in the United Kingdom in relation to the Soft Drinks Industry Levy which will be introduced from April 2018 and which directly targets UK based producers and importers of soft drinks. In August 2016, the UK government launched a comprehensive eight‐week consultation that will inform the introduction of the levy. The working group will continue to monitor the developments in the UK, including a detailed review of the formal consultation response document which is expected to be published in early 2017. An update on the progress of the working group will be included in the 2018 Budget Report.
Tax on Real Property (TRP)
4.52 In April 2015, following consideration of The Joint Report, the States resolved, inter alia:
“To direct that, as part of the annual Budget Report, the Treasury and Resources Department increases the rates of domestic Tax on Real Property by no more than 7.5% per annum in real‐terms between 2016 and 2025.”
4.53 The 2016 Budget Estimate for income from Tax on Real Property is £20.2million (2015: £19.0million) of which £14.4million relates to commercial TRP (2015: £13.9million) and £5.8million relates to domestic TRP and land (2015: £5.1million) and it is estimated that the outturn in 2016 will be slightly lower at £20.1million.
4.54 It is recommended that domestic and land tariffs are increased by 10.5% (being the inflation projection of 3% plus 7.5% in line with the April 2015 States’ resolution); and commercial tariffs are increased by 5% (being the inflation projection of 3% and a real‐terms’ increase of 2%). It is estimated that this will raise approximately an additional £1.3million per annum (£700,000 in real‐terms) comprising commercial (£700,000) and domestic (£600,000).
24

2017 BUDGET REPORT
4.55 The following table details the 2016 TRP rate per unit, the proposed change and the proposed 2017 TRP rate per unit (commercial rates are rounded to the nearest 5p):
2016
TRP rate per unit
Proposed increase
2017 ProposedTRP rate per unit
Buildings (all zero‐rated for Herm):
Domestic (whole unit) Local Market £1.25 10.5% £1.38 Domestic (flat) Local Market £1.25 10.5% £1.38 Domestic (glasshouse) Local Market 5p ‐ 5p Domestic (outbuildings) Local Market 63p 10.5% 69p Domestic (garaging & parking) (non‐owner‐ occupied) Local Market £1.25 10.5% £1.38 Domestic (whole unit) Open Market £1.25 10.5% £1.38 Domestic (flat) Open Market £1.25 10.5% £1.38 Domestic (glasshouse) Open Market 5p ‐ 5p Domestic (outbuildings) Open Market 63p 10.5% 69p Domestic (garaging & parking) (non‐owner‐ occupied) Open Market £1.25 10.5% £1.38 Domestic (whole unit) Social Housing Zero ‐ Zero Domestic (flat) Social Housing ‐ Zero Domestic (glasshouse) Social Housing ‐ Zero Domestic (outbuildings) Social Housing ‐ Zero Domestic (garaging & parking) (non‐owner‐occupied) Social Housing Zero ‐ Zero
Hostelry and food outlets £5.25 5.0% £5.50
Self‐catering accommodation £3.30 5.0% £3.45
Motor and marine trade £4.45 5.0% £4.65
Retail £9.05 5.0% £9.50
Warehousing £4.80 5.0% £5.05
Industrial and workshop £3.85 5.0% £4.05
Recreational and sporting premises £2.25 5.0% £2.35
Garaging and parking (non‐domestic) £4.80 5.0% £5.05
Utilities providers £37.55 5.0% £39.45
Office and ancillary accommodation (regulated finance industries)
£35.05
5.0%
£36.80
Office and ancillary accommodation (other than regulated finance industries)
£11.70
5.0%
£12.30
Horticulture (building other than a glasshouse) 5p ‐ 5p
Horticulture (glasshouse) 5p ‐ 5p
Agriculture 5p ‐ 5p
Publicly owned non‐domestic Zero ‐ Zero
Exempt (Buildings) Zero ‐ Zero
Buildings – Penal Rate Zero ‐ Zero
Development buildings (domestic) 63p 10.5% 69p
Development buildings (non‐domestic) £5.00 5.0% £5.25
25

2017 BUDGET REPORT
2016
TRP rate per unit
Proposed increase
2017 Proposed TRP rate per unit
Land (all zero‐rated for Alderney and Herm):
Communal (flat) Local Market 17p 10.5% 18p
Communal (flat) Open Market 17p 10.5% 18p
Hostelry and food outlets 33p 10.5% 36p
Self‐catering accommodation 33p 10.5% 36p
Motor and marine trade 33p 10.5% 36p
Retail 33p 10.5% 36p
Warehousing 33p 10.5% 36p
Industrial 33p 10.5% 36p
Recreational and sporting premises 33p 10.5% 36p
Office and ancillary accommodation (regulated finance industries)
£1.09
10.5%
£1.20
Office and ancillary accommodation (other than regulated finance industries)
36p
10.5%
40p
Utilities providers 33p 10.5% 36p
Approved development site £1.09 10.5% £1.20
Domestic Local Market 17p 10.5% 18p
Domestic Open Market 17p 10.5% 18p
Horticulture 17p 10.5% 18p
Agriculture 17p 10.5% 18p
Domestic Social Housing Zero ‐ Zero
Publicly owned non‐domestic Zero ‐ Zero
Exempt (Land) Zero ‐ Zero
Land – Penal Rate Zero ‐ Zero
Garaging and parking (non‐domestic) 33p 10.5% 36p
4.56 The following table illustrates the effect of the increase in TRP rates on different domestic properties:
TRP of Property Current TRP
Annual
Increase in TRP Annual
Proposed TRP
Annual
75 £94.05 £9.45 £103.50
150 £188.10 £18.90 £207.00
225 £282.15 £28.35 £310.50
300 £376.20 £37.80 £414.00
375 £470.25 £47.25 £517.50
26

2017 BUDGET REPORT
Document Duty
4.57 In April 2015, following consideration of The Joint Report, the States resolved, inter alia:
“To direct the Treasury and Resources Department to review the structure of Document Duty as part of the ongoing budgetary process.”
4.58 The current system of Document Duty is applied on what is termed a ‘slab’ system whereby as the property value increases a larger percentage of duty is charged on its entire value. The current rates of Document Duty for domestic dwellings are:
2% of the total value for transactions of £250,000 or less;
2.5% of the total value for transactions between £250,001 and £400,000;
3% of the total value for transactions between £400,000.
For all other transactions (i.e. those not for a domestic dwelling), the Document Duty rate is 3%.
4.59 The main body of The Joint Report included:
“Document duty, the tax paid on the purchase of a property in Guernsey, is one of the most volatile revenue streams in the current budget being dependent on both the number and value of property sales made. As currently structured, for low value sales, document duty is high relative to equivalent charges in the UK and Jersey, and this may represent a barrier to entering the housing market for some people. At higher values, document duty charged in Guernsey is lower than that charged in either the UK or Jersey and there may be some scope for a limited increase in document duty on high value transactions. Furthermore the systems in both the UK and Jersey each apply a more sophisticated, graduated system of charges. Moving to a similar system in Guernsey could have two benefits: it would avoid step changes in the cost of purchasing a property as the property value increases; and it could also ease any distortion to the housing market these step changes may be causing (For example, a property advertised at a value just above the band threshold may be subject to a greater downward pressure on its eventual sale price to bring it in to a lower band than a property advertised at a value just below the band threshold).”
27

2017 BUDGET REPORT
4.60 The following graph details the amount of Document Duty received over the last 12 years and highlights the volatility of this income source which is very sensitive to the health of the property market:
4.61 For 2016, the Budget Estimate was £11.8million. As a result of the marked
improvements in transaction volumes in the second quarter of 2016, this estimate has been revised upwards to £12.3million. This upturn is anticipated to continue into 2017 and, therefore, the 2017 Budget Estimate is £12.8million. In addition, it is estimated that income from Document Duty on the registration of bonds (which is when a lender registers a charge against a property to secure a loan it has made to the property owner) will be £1.9million per annum.
4.62 The Policy & Resources Committee is recommending the introduction, from 1 January 2017, of a graduated system of Document Duty whereby progressively higher rates only apply to the proportion of the property value which falls in each band with the following rates and bands:
2% on up to £250,000 of the transaction value;
3.25% on up to the next £150,000 (i.e. the portion from £250,001 to £400,000);
3.5% on up to the next £350,000 (i.e. the portion from £400,001 to £750,000);
3.75% on up to the next £250,000 (i.e. the portion from £750,001 to £1,000,000);
4% on the remaining amount (i.e. the portion above £1,000,000).
4.63 These rates have been calculated to be ‘revenue neutral’ and, therefore, assuming no change to the number and value of transactions, would raise the same amount of Document Duty income as under the existing ‘slab’ system. Those benefitting most from this revision would be conveyances at or around the value of average house prices ‐ a transaction at the median value of £435,000 would pay £1,950 less in Document Duty (£11,100 compared to £13,050).
‐
2,000
4,000
6,000
8,000
10,000
12,000
14,000
16,000
18,000
20,000
22,000
2004 2005 2006 2007 2008 2009 2010 2011 2012 2013 2014 2015 2016
£'000
Year
28

2017 BUDGET REPORT
4.64 The following table shows examples of the change in Document Duty payable for a range of transaction values:
Transaction
Value £
Current Document Duty
Payable £
Proposed Document Duty
Payable £
Change in Document Duty
Payable £
250,000 5,000 5,000 ‐
300,000 7,500 6,625 (875)
400,000 12,000 9,875 (2,125)
500,000 15,000 13,375 (1,625)
600,000 18,000 16,875 (1,125)
700,000 21,000 20,375 (625)
800,000 24,000 24,000 ‐
900,000 27,000 27,750 750
1,000,000 30,000 31,500 1,500
1,500,000 45,000 51,500 6,500
2,000,000 60,000 71,500 11,500
3,000,000 90,000 111,500 21,500
4,000,000 120,000 151,500 31,500
5,000,000 150,000 191,500 41,500
4.65 The ‘break‐even point’ where the same amount of Document Duty would be paid under the proposed graduated system as under the existing ‘slab’ system is £800,000. All transactions below this value would pay less Document Duty and the Policy & Resources Committee is of the view that this will provide a stimulus to the lower and middle sections of the housing market and further encourage the recovery currently being experienced. After a period of low sales and falling prices, data from the second quarter of 2016 shows a marked increase in the number of local market residential property sales. The house price‐to‐earnings ratio, a measure of housing affordability which peaked at more than 16 in 2012 fell to 13.8 in March 2016, suggesting that the improvement in the market, at least in part, is a result of house prices moving to a more affordable level. In reducing transaction costs for the conveyance of low and middle value properties, the Committee hopes to support the change in the market and strengthen the growth in sales.
4.66 There will be provisions to enable refunds of the additional Document Duty paid if prior to the date of publication of the Budget Report a legally binding agreement has been entered into for a conveyance to be executed and registered on or after 1 January 2017.
4.67 The Committee will monitor the effect of this revision to the Document Duty regime and, if appropriate, will recommend further changes to Document Duty rates and thresholds in future Budget Reports. Furthermore, the Committee will continue to review whether the current structure of Document Duty is appropriate and will monitor changes in other jurisdictions and consider whether they might be appropriate for further investigation for possible introduction in Guernsey.
29

2017 BUDGET REPORT
4.68 In respect of the introduction of a Share Transfer Duty regime in Guernsey which taxes sales of interests in entities that own either commercial or domestic real property in Guernsey at the same rate as applied under the Document Duty Law for standard conveyances, the Committee has continued to consult with the Guernsey Bar Council and other interested parties on the draft legislation and is intending to submit a Policy Letter for consideration shortly.
Increased business contribution
4.69 In order to ensure the Island has world‐class connectivity, including digital and transport links, substantial future investment is likely to be required. The Policy & Resources Committee is of the view that it would be appropriate to consider, in light of the current fiscal position, whether those who would receive the most commercial benefit from this investment should make a financial contribution to the Island for the use of these resources.
4.70 It is of the view that such a measure may be necessary in order to reduce reliance on the existing tax base and to secure an appropriate return on the use of public assets. Therefore, the Policy & Resources Committee is intending to investigate options for the States of Guernsey to receive greater revenue from those businesses that might benefit from such public investment and report back in the 2018 Budget Report. This investigation will include, but not be limited to, consideration of the appropriate level and scope of General Revenue income generated from telecommunications and non‐regulated professional services businesses and partnerships, such as accountants and advocates.
30

2017 BUDGET REPORT
Section 5: Health and Social Care Services
Background
5.1 Health and social care services have suffered significant budgetary challenges in recent years resulting in a number of overspends and substantial increases to budget. In 2015, a major project was undertaken to fully cost the services being provided and analyse the drivers for cost increases in order to establish with some certainty whether the services were over‐ or under‐funded. At the same time a benchmarking exercise was undertaken in order to better understand the cost of the services relative to peers and therefore identify areas where a reduction in cost might be possible.
5.2 As part of the 2016 Budget Report, the findings of that exercise were published (including the Executive Summary of the Report) which recommended a baseline revenue Cash Limit for the Health and Social Services Department of £119.65million which was £8.2million, or 7.6%, higher than the indicative Cash Limit which had been set within the States’ Fiscal Policy.
5.3 In order to ensure that the existing services were appropriately funded, the States decided to make a medium‐term exception to the Fiscal Policy of a real‐terms’ freeze on aggregate States’ revenue expenditure to allow this additional £8.2million of temporary funding to be made available to health and social care services without having seriously to impact the services of all other Departments in the short‐term.
5.4 The Health and Social Services Department requested a 2016 Cash Limit of £118.5million (i.e. £1.15million less than the baseline proposed through the detailed costing work). At the time, the Treasury and Resources Department wrote in the 2016 Budget Report that:
“The Health and Social Services Department has compiled a budget for 2016, excluding any transformational funding, which totals £118.5million (i.e. £7.05million more than the indicative Cash Limit) but incorporates as yet unidentified efficiency savings of £1.9million. The Treasury and Resources Department supports the commitment of the Health and Social Services Department to delivering such efficiencies but considers it even more important that a transformation programme for the services is properly planned and initiated in order to realise the potential savings as identified by BDO ranging between £7.4million (on a prudent risk‐adjusted basis) and whole service savings of up to £24million per annum. The Treasury and Resources Department therefore considers it prudent to request that the full £8.2million additional funding be allowed within the revenue Cash Limit (£7.05million) and as a specific provision within the Budget Reserve (£1.15million). If the Health and Social Services Department is indeed able to deliver all of the £1.9million in 2016, this will result in an underspend on the overall budget. The Treasury and Resources Department considers that this is an appropriate, risk‐adjusted and fiscally prudent response.”
31
2017 BUDGET REPORT
5.5 The main finding from the Costing Benchmarking & Prioritisation Project was that: “Health and care services resident within both Health and Social Services Department and Social Security Department budgets are 17% more expensive than peer group. This translates into a potential annual saving of £24million against health and care costs of £139.0million deliverable over 7 to 10 years. A prudent risk‐adjusted assessment of potential efficiency gains deliverable within the Health and Social Services Department budget alone identified annual savings of £7.4 million deliverable over a 3 to 5 year period against total [baseline] costs of £116.6millione equating to 6%.”
5.6 The additional funding was provided to health and social care services on a temporary basis in order to be able to fund the existing service model while whole system transformation was being designed and tactical, productivity and efficiency savings being planned and delivered. The profile of net changes to the baseline as a result of delivery of these savings was estimated to be a reduction of £3.5million in 2017, a further £0.9million in 2018 and the balance in future years totalling £7.4 million.
Financial Performance in 2016
5.7 Net expenditure in 2016 has been higher than budget throughout the year to date although the rate of expenditure has slowed in recent months. The Committee for Health & Social Care is currently forecasting an overspend against its authorised budget of £3.8million due to pressures on off‐island expenditure and continued reliance on agency staffing.
5.8 The Policy & Resources Committee will be transferring the £1.15million which the Treasury & Resources Department recommended was held in the Budget Reserve to cover such eventuality to the Committee for Health & Social Care which will reduce the forecast overspend to £2.65million in 2016.
Budget for 2017
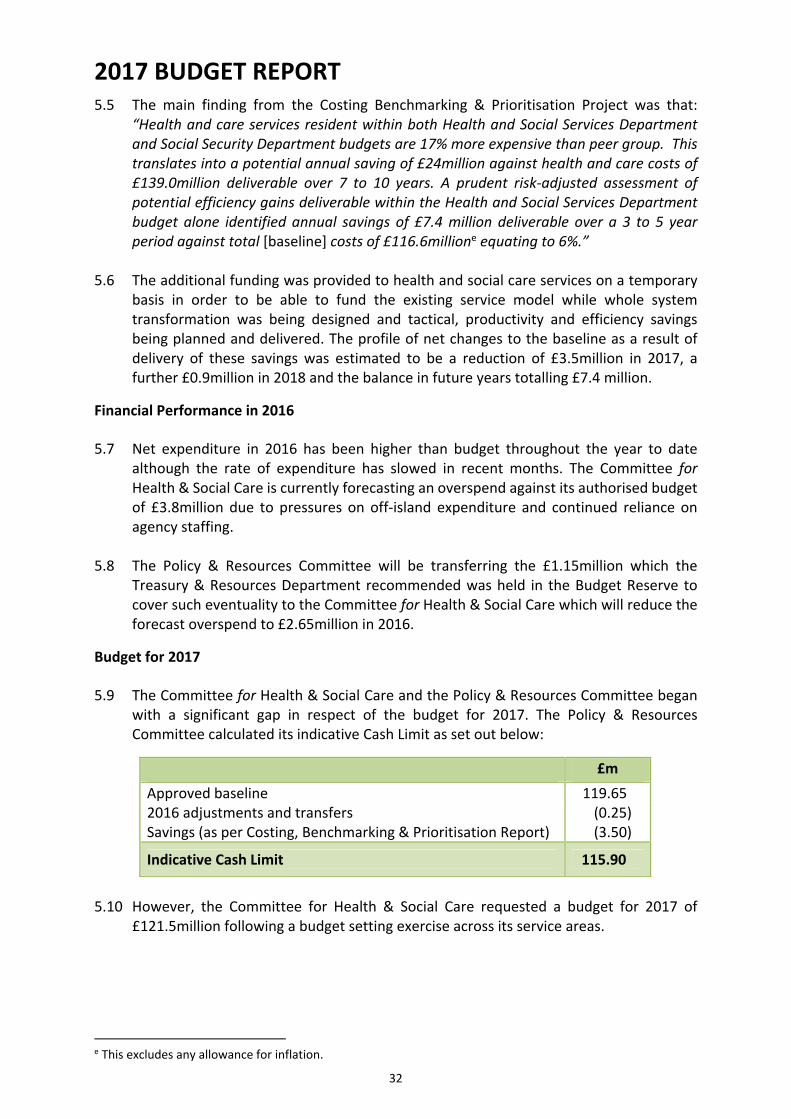
5.9 The Committee for Health & Social Care and the Policy & Resources Committee began with a significant gap in respect of the budget for 2017. The Policy & Resources Committee calculated its indicative Cash Limit as set out below:
£m
Approved baseline 119.65 2016 adjustments and transfers (0.25) Savings (as per Costing, Benchmarking & Prioritisation Report) (3.50)
Indicative Cash Limit 115.90
5.10 However, the Committee for Health & Social Care requested a budget for 2017 of
£121.5million following a budget setting exercise across its service areas.
e This excludes any allowance for inflation.
32

2017 BUDGET REPORT
5.11 Following extensive dialogue between officers and political Members, the Policy & Resources Committee is now recommending a Cash Limit for the Committee for Health & Social Care of £120.1million which includes an uplift on parts of the non‐pay budget in recognition of certain inflationary cost pressures and has been accepted by the Committee for Health & Social Care. The Policy & Resources Committee considers that it would not be appropriate or realistic to set a budgetary target for tactical, productivity and efficiency savings in 2017 given the significant political and civil service changes during 2016; the delay in commencing the transformation programme; and the financial pressures being faced in 2016. Rather, the Committee believes that the 2017 budget should be set at a realistic level to deliver the current service model and to allow further time for planning and commencing delivery of transformation and change activities.
5.12 The Committee for Health & Social Care faces financial risk and uncertainty in relation to off‐island care, and can see large rises in expenditure as a result of increased incidences of high cost procedures. The Policy & Resources Committee has agreed with the Committee for Health & Social Care that it is not practical or affordable for it to budget for all such occasions. Therefore, should in‐year pressures on this budget become apparent due to such events, the Policy & Resources Committee will use the Budget Reserve to increase the authorised budget. Notwithstanding this, in the opinion of the Policy & Resources Committee, it is vital that expenditure is managed within the overall authorised budget in 2017.
5.13 In addition, planning and delivery of tactical, productivity and efficiency savings must commence in 2016 so that initiatives can be implemented during 2017 as it will be the intention of the Policy & Resources Committee to recommend reductions in the Cash Limit in future years in line with the findings of the Costing, Benchmarking & Prioritisation Project, previous decisions of the States and the requirements recommended across other spending Committees in order to eliminate the deficit.
Transformation
5.14 The Policy & Resources Committee is committed to working with the Committee for Health & Social Care to ensure that a sustainable model of health and social care is developed and implemented. Affordability is one of the key drivers underpinning the need to transform the delivery of health and social care services. Historic and current cost pressures have resulted in difficulties in controlling expenditure, overspends against budget in recent years, and the need to substantially increase the allocation of funding to the Committee for Health & Social Care. However, unless fundamental changes are made, this position is expected to materially deteriorate. The dependency ratio, an indication of how many people each member of the working population is supporting, helps describe the mounting cost pressures for these services. In 2014, the dependency ratio in Guernsey was 0.53. This is projected to increase to up to 0.80 by 2040 which means that an increased burden will be placed on the working age population. Such an increase, without fundamental reform will result in demand for greatly increased health and social care budgets to be funded by a declining number of taxpayers.
33

2017 BUDGET REPORT
5.15 In addition to these cost pressures related to an ageing demographic, health and social care services face rising costs for new drugs and therapies which enable people to survive previously fatal conditions which, in turn, lead to further demand and cost pressures on the system.
5.16 As part of the 2016 Budget Report, the States approved funding of up to £1million from the Transformation and Transition Fund for the development of the Transforming Health and Social Care Services programme.
5.17 A programme mandate has been developed, setting out both the business need and investment objectives for the programme. The agreed mandate has, as its primary objective, the need for the transformation of health and social care services to ensure that “by 2025, we have designed, built and transitioned to a delivery model for these services that is both sustainable and affordable within the context of the long term fiscal and demographic forecasts.” Transition to the new model for health and social care must secure:
1. Greater efficiency of services provided – in order to cope with increasing demand on services;
2. Reduced cost of services – with lower unit costs releasing recurring savings capable
of being re‐invested to meet increasing demand or new or improved services; and 3. Improve quality – ensure all health and social care services consistently deliver
against appropriate professional standards and service user/patient commitments.
5.18 Funding was approved to complete the initiation of the programme including establishing a vision for the transformed services, setting out the specific activities required in order to deliver transformation, clarifying the risks and issues associated with the programme and estimating costs.
5.19 Following the completion of this work, in June 2016, a programme brief setting out the proposed approach for the development of a new delivery model for the island’s health and social care services and measures to improve operational controls and sustainably reduce costs was approved by the Committee for Health & Social Care and the Policy & Resources Committee.
5.20 In July 2016, the Policy & Resources Committee approved the release of further funds to establish a core programme team and accelerate the delivery of a range of measures to improve operational controls and control/reduce costs. In total, £432,000 of the prioritised amount of £1million has been approved to date.
5.21 The Committee for Health & Social Care intends to lay its detailed plans for system transformation before the States before the end of 2017. Such plans will need to clearly articulate the problem needing resolution, the options considered, the proposed changes, the benefits of change (both financial and non‐financial) and the quantum of the ‘reform dividend’, how these benefits will be measured, how much the change will cost (including the cost of transition) and what the risks are to successful delivery.
34

2017 BUDGET REPORT
5.22 The Policy & Resources Committee considers it important that the States do not lose sight of the scale of potential savings to the baseline by delivering on the large and complex transformation which will be unavoidable if we are to fund the growing demand for healthcare services. The Committee therefore strongly supports the work already commenced by the Committee for Health & Social Care to design and transition to a delivery model for health and social care services that is both sustainable and affordable.
5.23 While this whole system transformation planning is underway, it is vital that a programme of tactical, productivity and efficiency savings is put in place in order to deliver benefits in the short term. The Policy & Resources Committee acknowledges that there are likely to be costs associated with some of these projects and that further investment and support will be required if the Committee for Health & Social Care is to succeed in reducing its baseline costs.
5.24 Therefore, in order to secure the delivery of such savings, the Policy & Resources Committee is recommending an increase of £500,000 in its delegated authority to approve funding from the Transformation and Transition Fund for the Transforming Health and Social Care Services programme. The Policy & Resources Committee would use its delegated authority to fund discrete low‐risk projects which have clearly defined financial benefits and can be delivered in the short‐term, contributing to delivery of tactical, productivity and efficiency savings which will reduce the baseline budget of the Committee for Health & Social Care.
Funding Health and Social Care
5.25 The Policy & Resources Committee is conscious that the public funding of health and social care services (including those that are directly provided or commissioned by the States, and those, such as prescriptions or primary care, that are subsidised) currently has multiple sources. Services are funded through either General Revenue, allocated to and managed by the Committee for Health and Social Care, or by the Health Service Fund, collected and managed by the Committee for Employment and Social Security. In effect, this means that multiple bodies make decisions about the allocation of funding to health services, and shape health policy‐making by doing so.
5.26 It also means that the costs of the health and social care system are not fully transparent to the public or the States (the Health Service Fund accounts, for example, are considered within the Miscellaneous Accounts, whereas spending by the Committee for Health & Social Care forms part of the States’ Accounts) – nor is it always possible to see the full benefits of transformation. For example, a change in the way services are delivered by the Committee for Health & Social Care such as the recent introduction of video‐teleconferencing, is likely to result in more savings to the Committee for Employment & Social Security rather than to its own budget. These quirks in the system present barriers and disincentives to the full transformation of health and social care, which the Policy & Resources Committee consider should be removed. Therefore, following a request from the Committee for Health & Social Care, the Committee has been considering ways in which such barriers or disincentives might be addressed.
35

2017 BUDGET REPORT
5.27 In line with the resolutions from the Joint Report, the Policy & Resources Committee is also seeking to examine ways to make the tax and contributions system as a whole more progressive. The current system of part funding through social security contributions has issues with ‘distributional equity’ given the different rates charged for various categories of contributions and age; the lack of an allowance and the fact that contributions are not levied on all income in all cases.
5.28 Initial consideration has shown that there are options which might be able to tackle some of the underlying equity issue in the current social insurance system; make the overall collection of taxes and contributions more progressive by applying an allowance; and provide a more transparent funding mechanism which places all spending on health and social care services directly under the control of that Committee, thus enhancing financial control and transparency.
5.29 The Policy & Resources Committee has had initial discussions with the Committee for Employment & Social Security on this matter and agreed that there is merit in examining the options in more detail and exploring all of the risks and opportunities. Therefore, the Committees are intending to work together over the next year, in consultation with the Committee for Health & Social Care, in considering the reform of health service funding and will report back with proposals as part of the 2018 Budget Report.
5.30 This type of funding reform will help deliver transformation in this critical area and, as such, the Policy & Resources Committee intends to use its existing delegated authority to approve funding from the Transformation and Transition Fund to enable the Committees to carry out the review.
5.31 A grant is currently paid from General Revenue each year to the Health Service Fund which is calculated at 12% of the contributions collected for that Fund and is expected to total £4.7million in 2017.
5.32 In advance of this work and in recognition of the General Revenue funding challenges in respect of health and social care services set out above the Committee for Employment & Social Security and the Policy & Resources Committee have agreed to recommend that no grant is made from General Revenue to the Health Service Fund in 2017 only. This recommendation is being made given that, according to the recent actuarial valuation of the Fund, the Health Service Fund contributions are above the break‐even level with the balance on the fund expected to grow to some 3.3 times cover over the valuation period.
5.33 The Policy & Resources Committee considers that this is a proportionate measure given the overall demands on General Revenue funding and is appropriate given the specific shortfall in relation to funding health and social care services in 2017. As set out earlier in this section, this shortfall has arisen due to the delay in establishing a transformation programme and the cost pressures being managed in 2016 in respect of agency staffing and off‐island treatment and therefore the Committee for Health & Social Care and the Policy & Resources Committee remain confident that benefits have only been delayed.
36

2017 BUDGET REPORT
5.34 It will however be necessary to take this reduction into account as part of the planned joint working in respect of future funding models and, if necessary, to ensure this funding is subsequently restored.
5.35 As this reduction in General Revenue Expenditure of £4.7million will partially offset the continuation of the temporary additional funding of £8.2million for health and social care services, the Policy & Resources Committee is recommending that the objective in the Fiscal and Economic Plan which provides for a real‐terms’ freeze in aggregate States’ revenue expenditure should exclude the net additional overall expenditure amount of £3.5million. This will allow the States to continue to make the necessary investment in health and social care without having seriously to impact the services of all other Committees in the short term.
37

2017 BUDGET REPORT
Section 6: Expenditure Proposals
Implementation of the States’ Review Committee proposals
6.1 The revised organisational structure of the machinery of government, as agreed by the States following consideration of the States’ Review Committee proposals, was implemented during early 2016. All Budgets included in this Budget Report, including the detailed Budgets in Appendix II are based upon the new structure and 2016 Cash Limits and 2015 Accounts have been restated for comparative purposes.
6.2 The reorganisation of budgets has included all costs for Finance and Human Resources being collectively budgeted; this is included within the Corporate Functions budget which is accounted for within the Policy & Resources Committee. This has resulted in 2016 budgets of £2.1million (Finance) and £2.8million (Human Resources) transferring from other budgets to the Policy & Resources Committee. A similar exercise for Information Systems & Services is in progress and budget transfers will be made later in the year.
Costing, Benchmarking and Priority‐Based Budget Setting Reviews
6.3 As agreed in the 2016 Budget Report, the Policy & Resources Committee has commissioned, funded from the Budget Reserve, projects to undertake detailed costing analysis of the current services provided by the Committees for Education, Sport & Culture and Home Affairs, benchmarked to comparable models in other jurisdictions and then used to inform efficient priority based budgets. The contract for these assessments was awarded to PricewaterhouseCoopers and they are currently in progress, with the full support and co‐operation of both Committees, with the final reports expected in February 2017. These reviews will enable evidence‐based decisions to be made on the future allocations to those Committees including the appropriate level of future years’ budget reductions.
38

2017 BUDGET REPORT
2017 Cash Limits
6.4 The expenditure budget for 2017 has been set on the basis of no real‐terms’ growth in revenue expenditure. In determining the limit of all expenditure, the June RPIX figure of 0.6% is applied in the calculation in order to avoid the complications that occur if an estimate is used.
6.5 The Committee is recommending that 2017 total Cash Limits are set at £373million calculated as follows:
Note £m
2016 Cash Limits 382.6 Less allowance for late delivery of Financial Transformation Programme (FTP) Targets
1
(1.1)
Less additional budget allocated to the Committee for Health & Social Care
2
(8.2)
373.3 Reflate 2016 Cash Limits using June 2016 RPIX (0.6%) 2.3
2017 ‘Base’ Cash Limits 375.6
Allowance for late delivery of FTP Targets 1 0.5 Additional allocation to the Committee for Health & Social Care (net of no grant from General Revenue to the Health Service Fund)
2 3.5
Less 3% budget reduction 3 (6.6)
2017 Recommended Cash Limits 373.0
6.6 Note 1 ‐ In 2016, an allowance of £1.1million was included within individual Cash Limits
to recognise that there were cases where Departments have identified and initiated projects which have certain and ongoing benefits at least equal to the balance of their FTP Target by the end of 2015, but a full year’s benefit may not be achieved until 2017 or subsequent years.
6.7 The Committee for Education, Sport & Culture’s recommended 2017 Cash Limit includes £500,000 whereby FTP benefits will not be received until 2018 and subsequent years including in respect of the final two years of implementation of changes to the grants to the Colleges. The Committee also has £136,000 of FTP benefits which it plans to realise in 2017; this balance has now been added onto the 3% budget reduction.
6.8 Note 2 – As set out in paragraph 3.7, it is recommended that, in the same way as in 2016, for 2017 the objective within the Fiscal and Economic Plan for a real‐terms’ freeze in aggregate States’ revenue expenditure should exclude the additional £8.2million of budget allocated for the Committee for Health & Social Care. As set out in paragraph 5.32, this has been partially offset by the recommended suspension in 2017 of the grant from General Revenue to the Health Service Fund.
39

2017 BUDGET REPORT
6.9 Note 3 – As set out in paragraph 1.15 a real‐terms’ reduction of 3% (i.e. a cash reduction of 3.6%) has been applied to all expenditure excluding:
Non‐Formula Led expenditure as, once the rates have been set, there is no scope to influence expenditure levels;
Committee for Health & Social Care which is subject to a separate efficiency programme; and
Overseas Aid & Development Commission whose allocation is subject to a specific States’ resolution.
The requirement for a real‐terms’ reduction in all other expenditure effectively means that, in calculating overall Cash Limits, no provision can be made for any pay awards in 2017. The financial position is such that the aim is to maintain all pay rates at as close to their 2016 levels as possible and that, if restraint is not exercised, any increases that could not be met by use of the Budget Reserve would undoubtedly result in a requirement to reduce expenditure elsewhere, including through a reduction in staffing numbers.
Of the total budget reductions of £6.6million, £2.4million has been identified and removed from budgets and £4.2million is yet to be specifically identified with Committees actively working to develop initiatives for delivery of these balances and finalise plans for their implementation.
Committee Cash Limits
6.10 The recommended Cash Limits for 2017 include adjustments in respect of the following:
The transfer of £1.264million from the Formula Led budget of the Committee for Employment & Social Security to the Committee for Education, Sport & Culture in line with the States’ decision of December 2015 (Billet d’État XX, 2015) to part‐fund pre‐school education by a £2.40 per child per week reduction in Family Allowance from 1 January 2017.
A small number of other low value inter‐Committee transfers where responsibility for a service has transferred between States’ Committees;
Allowance for all settled pay awards (£2.6million);
An inflation allowance on Non‐Formula Led non‐pay costs for the Committee for Health & Social Care (£680,000);
A small number of cyclical, one‐off and other low value items.
6.11 Within their agreed Cash Limits, Committees have to consider very carefully their own priorities. The Policy & Resources Committee does not ‘micro‐manage’ individual Committees’ budgets, as this is the responsibility of the Committees concerned.
40

2017 BUDGET REPORT
6.12 The recommended Cash Limits for 2017 are detailed in the following table. (Full line by line details of the 2017 budgets are included as Appendix II):
6.13 The Policy & Resources Committee was pleased to accept the offers by the Royal Court and Law Officers to set their recommended Cash Limits with reductions of £85,000 and £30,000 respectively, in addition to the 3% budget reductions.
6.14 Note 1 – Committee for Education, Sport & Culture – this Cash Limit is calculated net of a transfer from the Lottery Appropriation Account of an amount not exceeding the revenue deficit of Beau Sejour Leisure Centre. As a result of the success of the Lottery, the amount budgeted to reduce Beau Sejour Leisure Centre’s revenue deficit has increased by £300,000 to £625,000 and a commensurate reduction of £300,000 has been made to the Committee’s recommended Cash Limit. This means that the net revenue cost of Beau Sejour Leisure Centre to General Revenue is only expected to be £35,000 in 2017.
In addition to the transfer of £1.264million from the Committee for Employment & Social Security to part‐fund pre‐school education, the recommended Cash Limit also includes funding of £192,000 for this purpose as directed by the States.
Note 2017
Revenue Cash Limit £’000s
2017 RoutineCapital £’000s
2017 Total
Cash Limit £’000s
2016 Restated Cash Limit £’000
Policy & Resources
General 26,950 625 27,575 28,294
Formula Led 1,900 1,900 2,010
Economic Development 6,385 50 6,435 6,597
Education, Sport & Culture 1 77,995
Timing of delivery of FTP Benefits 500
77,445 400 77,845 79,529
Employment & Social Security
General 11,365 11,365 11,592
Formula Led 2 54,040 54,040 60,605
Environment & Infrastructure 3 12,005 3,175 15,180 16,102
Health & Social Care 120,100 750 120,850 117,767
Home Affairs 4 32,060 300 32,360 33,226
Scrutiny Management 5 553 553 570
Development & Planning 1,475 1,475 1,520
Overseas Aid & Development 6 2,915 2,915 2,885
States Trading Supervisory 1,540 700 2,240 2,054
Royal Court 2,460 2,460 2,740
Law Officers 4,530 4,530 4,700
States of Alderney 1,830 1,830 1,880
357,553 6,000 363,553 372,071
Backlog property maintenance ‐ 1,500 1,500 1,500
Budget Reserve 4,947 3,000 7,947 9,029
362,500 10,500 373,000 382,600
41

2017 BUDGET REPORT
6.15 Note 2 – Committee for Employment & Social Security, after allowing for no grant to the Health Service Fund in 2017, the Formula Led expenditure is estimated to be approximately £500,000 below the total expected due mainly to a reduction in Supplementary Benefit expenditure. This decrease, which largely cancels out a similar real‐terms’ increase in 2016, allows restoration of the general amount held in the Budget Reserve, the level of which was reduced in 2016.
6.16 Note 3 – Committee for the Environment & Infrastructure – In September 2014, the States agreed that the General Revenue funding for dairy farm management payments should be reduced by £1million in five equal steps over a five year period commencing on 1 January 2015. Therefore, the 2017 recommended Cash Limit takes into account a reduction of £200,000 as the third year reduction.
The recommended Cash Limit includes £1.625million in respect of the revenue costs associated with the implementation of the Integrated On Island Transport Strategy agreed by the States in July 2015 (Billet d’État XIV, 2015).
In accordance with the States decision of December 2015 (Billet d’État XX, 2015), the recommended Cash Limit includes £80,000 in respect of the Biodiversity Strategy.
6.17 Note 4 – Committee for Home Affairs – In accordance with the States’ decision of January 2016 (Billet d’État XXIII, 2015), the recommended Cash Limit includes net additional funding of £65,100 in respect of implementing the Domestic Abuse Strategy which has been made available through compensatory reductions in all other Cash Limits.
6.18 Note 5 – Scrutiny Management Committee – In February 2016 (Billet d’État IV, 2016), the States considered a Policy Letter from the Scrutiny and Public Accounts Committee entitled “The Scrutiny Management Committee – Powers, Resources and Impartiality” and, inter alia, resolved “To agree that the Scrutiny Managements Committee will annually submit to the Policy & Resources Committee a budget request (not exceeding a Cash Limit of £936,000 for 2017), which will be considered in conjunction with all other committees’ budget requests. If the Policy & Resources Committee is unable to recommend within the Annual Budget of the States a Cash Limit for the Scrutiny Management Committee at the level requested by that Committee, then the Policy & Resources Committee will reproduce in full in the Annual Budget the Scrutiny Management Committee’s budget request and include the reasons why it is not recommending a Cash Limit at the level requested and the financial implications of approving a Cash Limit at the level requested.”
The Scrutiny Management Committee has advised that “In light of the current financial position of the States, the Scrutiny Management Committee is not seeking an increase in its Cash Limit for 2017 and furthermore has reduced its budget submission to incorporate a 3% real‐terms’ reduction. Therefore, its 2017 budget submission of £555,000 is £381,000 lower than the maximum amount agreed by the States in February 2016. The Scrutiny Management Committee will, during 2017, consider its resource requirements for 2018 and future years in light of its planned programme of reviews and the financial position of the States and submit budget requests accordingly.”
42
2017 BUDGET REPORT
The Policy & Resources Committee commends the responsible financial approach being taken by the Scrutiny Management Committee. If the Scrutiny Management Committee is required / considers it beneficial to carry out an unplanned review for which it does not have sufficient budget, it is able to apply for funding from the Budget Reserve.
6.19 Note 6 – Overseas Aid & Development Commission – the recommended Cash Limit has been set in accordance with the States’ resolution of January 2012 (Billet d’État III, 2012) in which it was agreed that the States maintains its current level of contribution to overseas aid plus an annual ring‐fenced budget of £200,000 for emergency aid.
Budget Reserve
6.20 The Budget Reserve is the instrument used to manage overall budget contingencies and deal with any one‐off, unexpected, in‐year cost pressures. The Budget Reserve holds the allocation which it is expected will be transferred to individual Committees during the year. It is held centrally instead of being included within recommended Cash Limits as it is not known, with a sufficient level of detail or certainty, the amount which will be required by each Committee. Therefore, each Committee’s ‘Original Budget’ will increase during the year as this funding is released, for example, in respect of settled pay awards thus increasing ‘Original Budgets’ to become ‘Authorised Budgets’. Individual Committees do not routinely hold budget contingencies which invariably would not be fully utilised every year but funding is available from the Budget Reserve, if required. The portion of the Budget Reserve which is not earmarked for specific purposes is approximately £2million which is only 0.5% of total Cash Limits.
6.21 The 2017 Budget Reserve is £8million (2016:£9million) which includes:
Allowance for variations in formula‐led expenditure;
Provision for increasing established staff budgets in case the assumed 5% level of underspend arising from staff turnover does not occur;
Allowance for unanticipated / contingency / ‘emergency’ expenditure where there is a clear business case or demand / cost pressures that cannot be met by reprioritising existing budgets including if pay rates cannot be maintained at their 2016 levels. This allowance will also be available to fund any costs incurred in responding to ‘Brexit’ and the continuing court case regarding States’ employees’ pension arrangements;
Allowance for transfers to Committees’ routine capital allocations, as there are a significant number of capital projects that may be progressed in 2017 but, at this stage, their timing or cost is not known with any degree of certainty.
43
2017 BUDGET REPORT
Routine Capital Allocations
6.22 Overall, approximately £3million of Committee routine capital allocations were brought forward into 2016 and additional allocations of £7.5million were approved in the 2016 Budget Report. Historically, routine capital requirements have been overestimated and, in most cases, fewer projects are carried out, and at a later time, than was included in the routine capital programme funding requests. Therefore, the recommended Committees’ routine capital allocations for 2017 which are slightly lower than in 2016 do not accommodate all funding requests. However, the Budget Reserve includes a provision for transfers to Committees’ routine capital allocations.
6.23 As part of addressing the 2016 in‐year adverse financial position, all Committees were requested to review their routine capital allocations and consider whether any funding could be returned to General Revenue. The Committee for Education, Sport & Culture has undertaken a comprehensive review of its current capital programme and has removed, deferred or reduced in scope a number of projects which mean it is returning to General Revenue £690,000 of its current capital allocation. The Policy & Resources Committee is grateful for this substantial return of funding and thanks the Committee for Education, Sport & Culture for its wholehearted embracement of the need to address the 2016 deficit.
6.24 Since 2012, a specific amount of £175,000 per annum was ring‐fenced for funding an ongoing schedule of planned preventative maintenance for elemental refurbishment of Les Beaucamps High School (as set out in the November 2010 States Report [Billet d’État XXIII, 2010]). The Treasury and Resources Department was firmly of the view that, whilst it fully supported plans to ensure that the school is maintained appropriately in order to maximise its useful life and deliver optimum value for money in return for the substantial capital sum expended, the funding mechanism of a sinking fund was not in accordance with existing States’ practice, whereby such expenditure is planned and funded at the appropriate time through either routine capital allocation or as a Capital Reserve project. However, an amendment to the 2015 Budget Report directed the Treasury and Resources Department to:
“continue to allocate for this purpose £175,000 per annum in subsequent years in addition to the Education Department’s net routine capital expenditure budget”
6.25 The Policy & Resources Committee is also of the view that a sinking fund approach for future expenditure is not necessary or affordable given the current demands for funding to meet present and high‐priority expenditure requirements.
6.26 The Committee for Education, Sport & Culture has advised that it has agreed that the full balance (£875,000) of the routine capital allocation specifically held in respect of planned preventative maintenance for elemental refurbishment of Les Beaucamps High School can be returned to General Revenue and no objections will be raised to this ‘sinking fund’ being closed with no further annual appropriations of £175,000 being made.
44

2017 BUDGET REPORT
6.27 The Policy & Resources Committee commends the responsible stance taken by the Committee for Education, Sport & Culture and recommends that the States agree to rescind their previous resolution in respect of the sinking fund and the immediate return of its current balance to General Revenue.
6.28 The recommendations for routine capital allocations include a ring‐fenced allocation of £1.5million (2015: £1.5million) specifically to fund backlog maintenance of property assets. The States Trading Supervisory Board’s Property Services section will, in consultation with Committees, prepare a prioritised plan for carrying out the works. Approval of capital votes for individual projects is subject to the existing procedures (including in respect of the Policy & Resources Committee being able to exercise its delegated authority).
45

2017 BUDGET REPORT
Section 7: Capital Reserve
Update on Current Portfolio
7.1 There are nine projects, with total notional funding allocated of £35million, which were either prioritised as part of the original exercise or added later as urgent projects and remain in progress within the 2014‐2017 portfolio:
Replacement Fisheries Protection Vessel: Following the sursis (Billet d'État XVI, 2016) an independent survey has been carried out and its findings are being considered in relation the further development options for the project;
Guernsey College of Further Education: Options development and appraisal work is in progress;
Bus Fleet Replacement: The full business case for Phase one of the bus fleet replacement (12 Buses) has been approved and vehicles are expected to be delivered in the second quarter of 2017;
Alderney Airport ‐ Runway Rehabilitation: an economic study on the impacts of the runway options has been undertaken so as to inform the development of the options in the outline business case with the report due for completion before the end of 2016;
Replacement Radiology Equipment: Room 3 equipment replacement is complete and room 1 is scheduled for completion before the end of 2016;
Income Tax Electronic Data Management System: The outline business case has been completed and assurance reviewed. The tender specification documentation is currently being developed;
Electronic Health and Social Care Record: The project is entering into its latter stages with work focused on areas relating to the Children’s Information Database;
Storm Damage Repairs: Urgent repairs at Bulwer Avenue, Longue Hougue, Admiral Park, Fort Grey and Perelle were approved by the Treasury and Resources Department and work is ongoing; and
Guernsey Prison Fence Upgrade: The Committee for Home Affairs has chosen its preferred option and is proceeding to tender before completing the final business case.
46

2017 BUDGET REPORT
7.2 In March 2016 (Billet d’État XI, 2016) the States directed the Committee for Education, Sport & Culture to report back on ‘the optimum changes to the education estate to give effect to the States’ policies contained in Propositions 1 and 1A’. Propositions 1 and 1A necessitate a full review of how secondary education is delivered from a three secondary school model with each school ‘ideally of a broadly comparable size but in any event of a size capable of securing equality of opportunity for all students’ and with the 11 Plus admissions examination removed from September 2019.
7.3 Therefore, the La Mare de Carteret Schools Rebuild project has been removed from the 2014‐2017 capital portfolio and the associated funding released to be available in the next funding period. The Committee for Education, Sport & Culture has submitted a bid for a schools rebuild project to be considered as part of this prioritisation round.
7.4 The States directed that funding be made available from the Capital Reserve to undertake essential capital works at La Mare de Carteret High School while planning is underway for the ultimate proposed solution. A capital vote has been opened with a value of £2million in respect of this work, of which £400,000 is forecast to be have been incurred by the close of 2016.
Funding
7.5 The 2016 Budget Report included: “The Treasury and Resources Department recognises the importance of investment in the island’s capital infrastructure, as evidenced by the substantial increase in appropriations in recent years, and in normal circumstances would be recommending maintaining the value of the baseline appropriation in real terms, which would give a 2016 transfer of £36.8million.
7.6 However, as a result of the current and forecast fiscal position for 2016, the Department considers that the most prudent and practical response is to temporarily reduce the appropriation from General Revenue to the Capital Reserve in order to achieve a balanced budget. Therefore, the Treasury and Resources Department is recommending that £18.3million is transferred to the Capital Reserve on 1 January 2016.”
7.7 As set out in Section 2, the deterioration in the in‐year position means that the 2016 transfer will need to be reduced by a further £5.4million to £12.9million in order to deliver an in‐year balanced position.
7.8 The 2016 budget for the Capital Reserve also included £10million of returns of capital from trading entities. The Policy & Resources Committee is pleased to advise that Guernsey Electricity Ltd and Guernsey Post Ltd are returning £4million and £6million respectively to the States of Guernsey, as shareholder, in the form of buyback of shares. In accordance with the States Trading Companies (Bailiwick of Guernsey) Ordinance 2001, it is recommended that the States approve the repurchase of £4million of shares in Guernsey Electricity Limited and £6million of shares in Guernsey Post Limited.
7.9 Therefore, the total value of transfers to the Capital Reserve in 2016 will be £22.9million, £13.9million less than the target appropriation, and £5.4million less than the 2016 Budget.
47

2017 BUDGET REPORT
7.10 In respect of 2017, returning to the policy of maintaining the value of the baseline appropriation to the Capital Reserve in real‐terms would give a 2017 transfer of £37.9million. However, the forecast overall position for 2017 is such that, in order to remain in budget balance, there is a shortfall of £8.1million on this amount. Therefore, the Policy & Resources Committee is recommending that £29.8million is transferred to the Capital Reserve on 1 January 2017.
7.11 During 2015, the Treasury & Resources Department commenced work to determine the appropriate level of investment return that should be generated from the States’ trading assets. The first phase of this work began by examining the financial structures and engaging with representatives of Guernsey Post Limited, Guernsey Electricity Limited and Guernsey Water. As a result a return of capital, as set out above, has been received by General Revenue.
7.12 It remains the view of the Policy & Resources Committee that “these significant investments should generate a return to the States of Guernsey as shareholder, which in turn could be transferred to the Capital Reserve to be reinvested in future capital infrastructure” and that applying a more commercial model and rigour to the trading assets can result in dividends and return of capital / equity to the States as owner with improved focus on efficiency to ensure that this does not detrimentally affect customers by resulting in fees and charges being increased.
7.13 In addition to the return of capital or equity, the States’ Trading Supervisory Board (through States Property Services) is responsible for the management of the States’ built estate. The Policy & Resources Committee has previously stated the intention to ensure that at least two States owned properties – Grange Road House and Cornet Street – are vacated by the end of 2017. This will enable a commercial options analysis to be undertaken to determine the best use of those assets, which could be commercial rental, internal use, or disposal (including to the Guernsey Housing Association). Any capital receipts from the disposal of property should be returned to General Revenue for transfer to the Capital Reserve.
7.14 Now that the States Trading Supervisory Board has been established, the Policy & Resources Committee intends to work closely with it in order to determine the appropriate level of return for General Revenue from all of the trading assets, both incorporated and unincorporated through designing appropriate capital structures, suitable dividend policies, disposal of assets and agreeing the level of investment return which the States, as shareholder, can expect. This should result in a regular income stream through dividends and capital income which can support the States’ capital portfolio.
7.15 Given the Committee’s view that a combination of clear financial targets and a rigorous governance model can ensure these benefits are released, it therefore recommends setting the States’ Trading Supervisory Board a target minimum contribution of £5million of capital return from the States’ trading assets in 2017 and is budgeting on this basis. It is recommended that return of capital from trading assets in 2017 be transferred to the Capital Reserve.
48
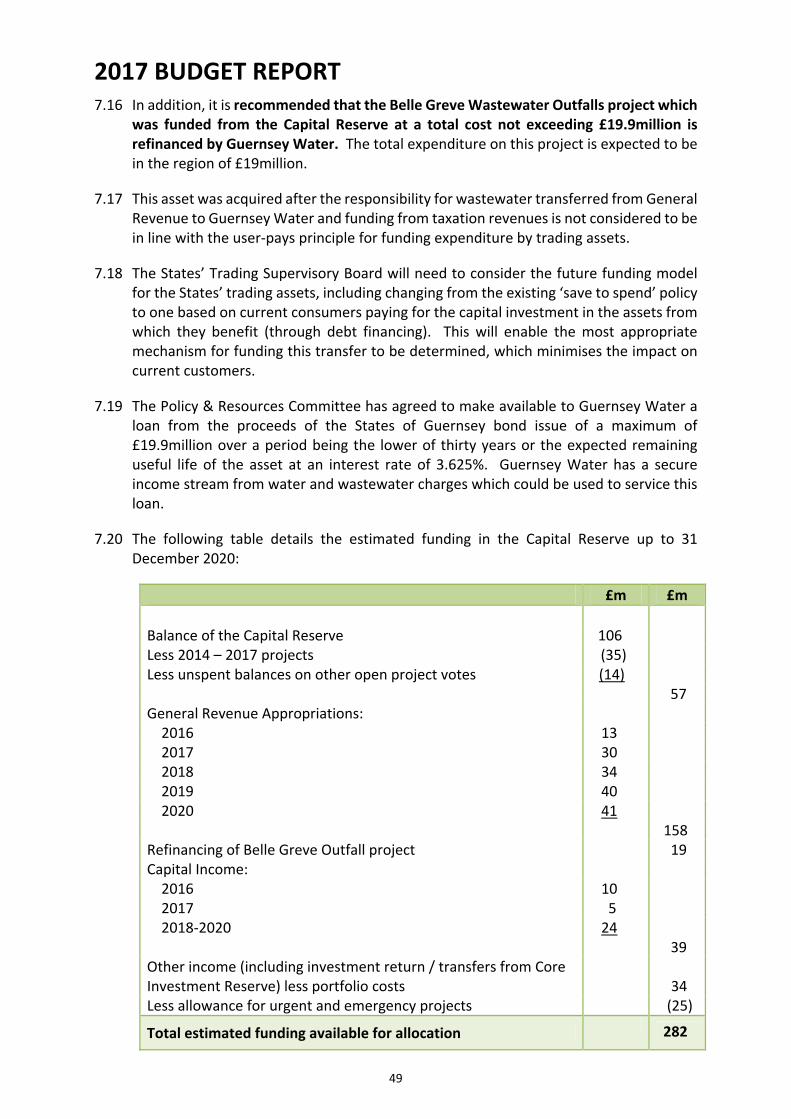
2017 BUDGET REPORT
7.16 In addition, it is recommended that the Belle Greve Wastewater Outfalls project which was funded from the Capital Reserve at a total cost not exceeding £19.9million is refinanced by Guernsey Water. The total expenditure on this project is expected to be in the region of £19million.
7.17 This asset was acquired after the responsibility for wastewater transferred from General Revenue to Guernsey Water and funding from taxation revenues is not considered to be in line with the user‐pays principle for funding expenditure by trading assets.
7.18 The States’ Trading Supervisory Board will need to consider the future funding model for the States’ trading assets, including changing from the existing ‘save to spend’ policy to one based on current consumers paying for the capital investment in the assets from which they benefit (through debt financing). This will enable the most appropriate mechanism for funding this transfer to be determined, which minimises the impact on current customers.
7.19 The Policy & Resources Committee has agreed to make available to Guernsey Water a loan from the proceeds of the States of Guernsey bond issue of a maximum of £19.9million over a period being the lower of thirty years or the expected remaining useful life of the asset at an interest rate of 3.625%. Guernsey Water has a secure income stream from water and wastewater charges which could be used to service this loan.
7.20 The following table details the estimated funding in the Capital Reserve up to 31 December 2020:
£m £m
Balance of the Capital Reserve 106 Less 2014 – 2017 projects (35) Less unspent balances on other open project votes (14) 57 General Revenue Appropriations: 2016 13 2017 30 2018 34 2019 40 2020 41 158 Refinancing of Belle Greve Outfall project 19 Capital Income: 2016 10 2017 5 2018‐2020 24 39 Other income (including investment return / transfers from Core Investment Reserve) less portfolio costs
34
Less allowance for urgent and emergency projects (25)
Total estimated funding available for allocation 282
49

2017 BUDGET REPORT
7.21 There are forecast to be unspent balances on open capital votes in the Capital Reserve totalling £18million at the end of 2016 in respect of projects that were part of the 2014‐2017 portfolio and earlier programmes, such as St Sampsons High School and the Crane Strategy projects. All open capital votes where work is substantially complete are being reviewed with the aim of closing votes, where appropriate, in order to release unspent amounts to supplement the funding for the capital portfolio set out above.
7.22 It is intended that £25million of the total available funding is set aside in order to fund unplanned urgent or emergency projects that arise rather than having to delay or remove prioritised projects from the portfolio. Any use of this funding will be in accordance with existing delegated authority in respect of urgent capital projects.
7.23 Therefore, a total of £282million is expected to be available from the Capital Reserve to fund the capital portfolio over the period 2017 – 2020 and the portfolio will be planned on this basis. There may, of course, be the opportunity for certain projects to be funded from another source including by a partnership with the private sector or through a loan from the proceeds of the States of Guernsey bond issue.
Capital Prioritisation
7.24 The 2016 Budget Report included that “Given that a number of the projects included in the current portfolio have yet to develop in any material sense; that the portfolio remains over‐committed with the majority of projects now estimated to cost more than original forecasts; increased uncertainty of funding given the proposed reduction in the appropriation to the Capital Reserve in 2016; and the changes in the economy and strategic plans since approval of the current portfolio; the Treasury and Resources Department is proposing that all projects which have not planned to have completed a fully assurance reviewed outline business case by the end of 2015 are then re‐assessed and re‐prioritised in 2016 along with all new bids.”
7.25 Therefore, all projects in the 2014 – 2017 portfolio not largely complete or listed in paragraph 7.1, have been re‐considered as part of the capital prioritisation exercise and scored against new proposals.
7.26 The approach taken by the Policy & Resources Committee in undertaking the capital prioritisation exercise has sought to build on previous experience and incorporate ‘lessons learned’. Proposals were invited from across the organisation by completion of an on‐line form designed to gather all necessary information which was accompanied by a guidance booklet. This form captured the following information:
Strategic alignment – with reference to the existing States Strategic Plan (which have now been mapped to the proposed Policy & Resource Plan objectives) and Public Service Reform themes;
Investment objectives – to understand the main reason(s) for the investment request such as compliance, improved efficiency or service continuity;
Complexity of the proposal in order to make an assessment on deliverability;
Capacity and capability to deliver the proposal;
50

2017 BUDGET REPORT
The number of beneficiaries were considered, in line with previous multi‐criteria analysis approaches, in order to recognise the breadth and depth of the potential impact of the proposal;
At a high level, the case for change was considered in order to understand the current situation and the risk of not addressing it;
All proposal submissions were expected to articulate the likely benefits – both quantitative and / or qualitative.
7.27 The estimated capital and revenue costs were captured in broad bands due to the
inherent difficulties in assessing costs at an early stage.
7.28 A panel of senior officers was established to consider and rank the proposals. The panel met with all of the submitting teams to ensure that there was an opportunity to explain the background to the proposals and enable the panel to ask questions in order better to understand and challenge the proposal before scoring was finalised.
7.29 The proposals were then assessed and ranked in accordance with the strategic alignment and desired outcomes; investment objectives; benefits – with cash releasing benefits given a higher weighting; and the number of and anticipated level of impact on each type of potential beneficiary. This has not been a ‘tick‐box exercise’. While a reasonably standardised approach is of value, judgment has also been exercised.
7.30 In May 2016, each new Committee was asked to confirm that all proposals submitted in respect of their mandated areas of responsibility remained a priority. As a result of this exercise, all proposals were confirmed and one additional proposal submitted. In total, 51 proposals were submitted with a total estimated capital value of approximately £690million.
51

2017 BUDGET REPORT
7.31 Given the number of proposals, the range of investment objectives and the difficulty in comparing such diverse initiatives, the proposals have been categorised in order to make it easier to understand the make‐up of the pipeline projects and provide a clearer view of the large and complex portfolio. As the submitted value of the projects is significantly in excess of the projected funding available, it is proposed that each of the categories is allocated a proportion of the total funding. The three categories chosen and the proposed funding allocations are:
Category Description Percentage Allocation
Funding Allocated
£m
Maintain Maintain the operation of existing services (24 proposals totalling £275million)
30% 85
Transform Transform service delivery, in line with Public Sector Reform (19 proposals totalling £282million)
50% 141
Grow Benefit the island or a specific sector of the economy (8 proposals totalling £133million)
20% 56
7.32 A member of the Chief Executive’s Management Team has been assigned to each
category in order to lead its progression who will work closely with the portfolio team in order to further challenge and scrutinise the proposals within each category.
7.33 The Policy & Resources Committee wishes to ensure that consideration is taken of a range of matters in order to ensure that the final portfolio includes the ‘right’ projects with the ‘right’ scope from the outset to deliver a portfolio which is both achievable and affordable. Such matters will include the timing and scheduling of proposals, capacity and capability to deliver, risk, impact on suppliers and the need to continue to deliver ‘business as usual’.
7.34 In order to ensure the portfolio integrates with and supports delivery on the objectives of the Policy & Resource Plan, the Policy & Resources Committee is intending to present a capital portfolio for approval in June 2017 to allow time to work through all of these important matters.
7.35 There is a significant amount of work required to develop proposals including examining all options; considering the impact of deferral; investigating alternative solutions; exploring all funding options (including alternative sources); undertaking feasibility analysis; and defining an affordable project scope. It is intended that funding is made available from the Capital Reserve to support the development of the initiatives to inform consideration of the portfolio by the States in June 2017.
7.36 Therefore, the Policy & Resources Committee intends to use its delegated authority to, following recommendation from the Chief Executive’s Management Team, approve use of up to a total of £5million (less than 2% of the estimated total portfolio value) of the Capital Reserve to develop the pipeline projects such that it is able to recommend a sustainable capital portfolio in June 2017.
52

2017 BUDGET REPORT
Project Development
7.37 Following the initial prioritisation exercise, a small number of projects have been identified as discrete ‘ready to go’ projects which typically require a relatively low level of investment. The indicative value of these projects is £18million but it is anticipated that this will decrease as scope is agreed and specifications developed. These projects, are largely low risk but have the potential to create significant benefits across the organisation or community and will be ready to move into the delivery stage prior to June 2017. There is also the potential for several of them to directly contribute to the Public Service Reform objectives and help enable delivery of tangible financial benefits which will contribute to delivery of savings targets over the short‐term.
7.38 In particular, the Policy & Resources Committee considers it essential that there is the ability to immediately progress the projects which will enable the rationalisation of office accommodation. It is imperative that use of States’ property assets is maximised which will also improve service outcomes for Islanders and business.
7.39 The first step towards achieving this efficiency is the proposed property rationalisation programme to decant staff from two buildings – income tax at Cornet Street and education offices at Grange Road House – to Edward T Wheadon House, Sir Charles Frossard House and the King Edward VII site in order to be better aligned to the new structure of government and service demands.
7.40 It is planned that these buildings are vacated by the end of 2017 which will realise revenue savings through greater efficiency in staff, maintenance costs or commercial rental income and / or capital income through the disposal of the buildings. Capital funding has been requested in order to refurbish Sir Charles Frossard House and the King Edward VII site to facilitate these moves.
7.41 All of these ‘ready to go’ projects need to have their scope well‐defined, benefits developed in more detail and costs challenged and it is unlikely that all could be concurrently initiated. Therefore, the Policy & Resources Committee will undertake an exercise to determine the optimum order in which these projects are progressed. It is recommended that authority is delegated to the Policy & Resources Committee to open capital votes, not exceeding £10million in total, charged to the Capital Reserve following consideration of full business cases for progressing discrete low‐value, low‐risk projects or those that facilitate the rationalisation of the property estate. This delegated authority will only remain in place until such time as the Policy & Resources Committee reports back on the capital portfolio in June 2017. The Committee will report full details on the use of these delegated authorities to the States.
7.42 In progressing projects, the Policy & Resources Committee has listened to and sought feedback on the current methods for developing capital projects, including a report from the Internal Audit Unit. These ‘lessons learned’ include the need for simple, clear and well communicated processes for the development of prioritised capital projects and further education and training for those responsible for their development. It is the intention of the Committee that revised, simplified and unified directives for the development of capital projects are completed before the end of 2016 and that all processes should continue to evolve in response to feedback.
53

2017 BUDGET REPORT
7.43 The Committee is seeking to ensure that there is a balance between the need to maintain momentum in the progression of prioritised schemes with the need for a robust business case upon which to base decisions to invest substantial amounts of public funds.
7.44 The Policy & Resources Committee considers there is a vital need to address the lack of clarity and agreement on project scope and scale at the outset that has caused disagreement in past schemes. The Committee’s aim is to ensure that not only the right schemes are chosen, but that the options considered and developed are both sustainable and affordable.
Routine Capital Allocations
7.45 Currently, funding for routine capital votes (up to £500,000 for straightforward replacements and up to £250,000 for all other projects) is allocated to individual Committees. The Policy & Resources Committee is investigating whether it would support improved prioritisation and co‐ordination of capital works by moving to a system whereby routine capital allocations are generally allocated to the broad functional areas of property, information and community technology, equipment and fleet management, together with continuation of separate allocations for roads’ resurfacing and replacement of medical equipment.
7.46 This would enable the development of rolling programmes with funding allocated over several years which would enable better planning by the Heads of Profession who would be responsible for preparing a single prioritised budget submission for their area and submitting requests to open capital votes.
7.47 There would also be a review of the current delegation arrangements and funding thresholds with a view to increasing the value at which projects are funded from the Capital Reserve and funding all straightforward replacements from routine capital allocations.
7.48 The Policy & Resources Committee is intending to report back in June 2017 and will include recommendations for revising the approach taken to routine capital allocations.
54

2017 BUDGET REPORT
Section 8: Forecast
8.1 There are inherent difficulties in forecasting income and expenditure over extended periods, with increasing uncertainty the further ahead you look. However, the Policy & Resources Committee has compiled a four‐year forecast of revenues and expenditure in order to commence planning for this term of Government and support the first phase of the Policy & Resource Plan.
8.2 Forecasting is entirely reliant on the chosen assumptions. Those used are both prudent and realistic:
Negligible real‐terms’ growth in income tax receipts;
Personal income tax allowances maintained in real‐terms;
No real‐terms’ increases in TRP (apart from domestic TRP where a real‐terms’ increase of 7.5% per annum is assumed in line with The Joint Report);
Document duty to increase by £500,000 per annum in real‐terms to reflect the ongoing recovery in the housing market;
Reinstatement of the grant from General Revenue to the Health Service Fund from 2018 onwards;
A 5% per annum reduction in overall revenue expenditure excluding Formula‐Led headings, Committee for Health & Social Care and Overseas Aid & Development Commission in each of 2018 and 2019;
A prudent allowance for the short‐term additional funding for the Committee for Health & Social Care to reduce by £2million in 2018 and a further £1million in each of 2019 and 2020;
Appropriations to the Capital Reserve maintained in line with previous policy but reduced if necessary in order to balance the overall position (i.e. no deficit);
Any capital income is transferred to the Capital Reserve.
55

2017 BUDGET REPORT
8.3 The following table details the indicative income, expenditure and appropriations:
2017 Budget Estimate
£m
2018 Indicative Estimate
£m
2019 Indicative Estimate
£m
2020 Indicative Estimate
£m
Revenue Income Income Tax 303 303 304 305 Other Taxes 79 80 81 81 Other Income 21 21 20 20
Revenue Income 403 404 405 406 Capital Income 5 8 8 8 Revenue Expenditure (362) (356) (346) (345) Routine Capital Allocations (11) (11) (11) (11)
Operating Surplus 35 45 56 58
Transfer to Capital Reserve: Capital Income 5 8 8 8 General Revenue Appropriation 38 38 38 38 Reduction (8) (1) ‐ ‐
Surplus ‐ ‐ 10 12
8.4 However, there are a number of risks and opportunities to the assumptions used in
compiling these forecasts including:
Notwithstanding that a very prudent assumption of negligible real‐terms’ growth in income tax receipts has been used, there are risks that either the level of income receipts deteriorates over the period, either through a general decline or as a result of ‘economic shocks’. Equally, there could be recovery and real‐terms’ growth in income receipts ‐ modest growth of 1% per annum in each of 2018, 2019 and 2020 would result in nearly £10million of additional income from 2020 onwards;
There is a risk of non‐delivery of the 5% per annum reductions in overall revenue expenditure in each of 2018 and 2019 (£9million in each year); non‐delivery of 50% of the total would virtually eliminate the projected surpluses;
The demand for existing services and pressure for the introduction of new services may result in real‐terms’ increases in expenditure;
The Committee for Health & Social Care may not generate the level of savings currently considered achievable and the short‐term additional funding allocated becomes longer‐term in nature.
Capital income is not realised in line with projections resulting in pressure to increase appropriations from General Revenue in order to fund the portfolio.
56

2017 BUDGET REPORT
8.5 Once the States’ financial position is no longer in deficit, there are a number of options
for use of surpluses including:
Reinvest the reform dividend in meeting demand for existing services or the introduction of new or enhanced services. This could mean, for example, funding the proposals for the reform of supplementary benefit approved following recommendations by the Social Welfare Benefits Investigations Committee or the cost pressures arising from the implementation of the Supported Living and Ageing Well strategy. Any such expenditure will need to be prioritised by the States once funding becomes available.
Restoration of the General Revenue Account Reserve which is currently exhausted. The previous policy was to maintain this Reserve at 5% of annual expenditure (approximately £20million) in order to manage in‐year shortfalls in income, short‐term cyclical variations and other timing issues;
Transfer to the Capital Reserve to compensate for the reductions necessary to balance the overall position in prior years (estimated to be £14million over the period 2016 – 2018);
Appropriate to the Core Investment Reserve to reinstate the amount depleted during the period of funding deficits from reserves.
57

2017 BUDGET REPORT
Section 9: Other Matters
Economic Development Fund
9.1 As part of the 2015 Budget Report, the States approved “the establishment of an Economic Development Fund with immediate effect by transferring £7,000,000 from the Contingency Reserve (Tax Strategy) and to delegate authority to the Treasury and Resources Department to approve use of this Fund”.
9.2 In addition to this £7million, balances in respect of projects approved through the Strategic Development Fund totalling £2.1million were also transferred into the Fund.
9.3 The current uncommitted balance of the Economic Development Fund is £5million:
£’000 £’000
Opening Balance 7,000 Transfer from Strategic Development Fund 2,100 9,100 Initiatives approved: Guernsey Finance (900) Visit Guernsey (500) Innovation Centre (Digital Greenhouse) (1,460) Locate Guernsey (1,200) (3,760)
Balance 5,040
9.4 The Fund is currently available to provide targeted support, for an initial investment period, for individual initiatives linked to the Economic Development Strategy whose objectives include the stimulation and promotion of sustainable growth in the Guernsey economy resulting in new or enhanced revenue streams for the States of Guernsey. Business cases for use of the Fund must demonstrate:
New or enhanced growth for the economy;
Evidenced and measurable benefits;
Return on investment by way of revenue for the States of Guernsey.
58

2017 BUDGET REPORT
9.5 The draft Future Guernsey Programme for Government (in Phase one of the Policy &Resource Plan) highlights our aim to maintain a strong, sustainable and growing economy and recommends the following policy objectives:
Ensure conditions that encourage and foster enterprise and remove barriers to business, keeping regulation appropriate and proportionate;
Ensure the provision of reliable, sustainable and affordable sea and air links;
Focus on maintaining an appropriately‐sized working population;
Look to remove barriers that are discouraging or preventing some people from pursuing or remaining in paid employment and provide additional support to those who need it to find and sustain employment;
Promote Guernsey as an attractive place to work and live in order to encourage the retention of our current workforce, the return of those who have chosen to gain life experience in other jurisdictions, and to attract those who may bring valuable skills to the island; and
Encourage the growth of digital and information businesses through the Economic Development Fund.
9.6 The continued strength of our economy is a critical foundation to supporting our quality of life and community. The Policy & Resources Committee considers that Government’s focus should be on ensuring we have the right conditions for business to set up, grow and operate successfully.
9.7 A strong, growing and sustainable economy is critical in delivering sustainable public finances and real‐terms’ growth in States’ revenues through new or enhanced tax receipts will, as long as accompanied by expenditure restraint, result in our target of budget surpluses.
9.8 The Policy & Resources Committee therefore considers that the existence of a Fund to support the economy remains essential. However, to support the objectives of Future Guernsey, the Committee believes that the name and criteria for use of the Fund should now be amended.
9.9 Therefore, it is recommended that the Economic Development Fund is renamed as the Future Guernsey Economic Fund and the Policy & Resources Committee intends to use its existing delegated authority to approve funding for initiatives which deliver on the six objectives above and which:
Ensure we have the right conditions for business to set up, grow and operate;
Improve or protect economic growth; and
Have measurable economic and fiscal benefits.
9.10 Further, and to encourage and incentivise initiatives which deliver tangible fiscal returns, the Committee recommends that 50% of any evidenced fiscal receipts to the States of Guernsey arising from measures funded from the Future Guernsey Economic Fund are re‐invested in the Fund.
59

2017 BUDGET REPORT
Transformation and Transition Fund
9.11 As part of the 2015 Budget Report, the States resolved to establish a Transformation and Transition Fund in order to recognise “the significant investment required to deliver the public services of the future and the substantial policy agenda for the States.” The overarching criteria to be demonstrated in any business cases for use of the Fund were set out as:
Significant long‐term transformation in the delivery of services;
Evidenced and measurable benefits; and
A return on investment.
9.12 As set out in the 2015 Budget Report, the outstanding commitments of the Fundamental Spending Review Fund and the balance of the Fund were transferred to the Transformation and Transition Fund at the end of 2014. In addition, a transfer was made from the Strategic Development Fund of £862,000 representing the £800,000 balance of that Fund together with the balance (£62,000) of the maximum funding of £100,000 allocated to developing the Children and Young People’s Plan.
9.13 In the 2016 Budget Report, the Policy Council and Treasury and Resources Department recommended that a number of initiatives and programmes be prioritised by the States to allow the planning work to develop and define these important programmes to progress to the point where they are ready to be presented to the States for approval of policy or transformation proposals including projects of work and programme benefits (both financial and non‐financial) prior to moving to project delivery. These prioritised initiatives and programmes are:
Social Policy Development – to ensure that social policy development is appropriately resourced in order to initiate and co‐ordinate corporate change with a short term focus on the Supported Living and Ageing Well Strategy and the Children and Young People’s Plan.
Public Service Reform – establishment of an over‐arching programme to co‐ordinate the delivery of benefits through the Framework for Public Sector Reform.
Programmes of Service Transformation – to enable the development of the principles to use in each of the four planned programmes of service transformation – Education and Training Services, Health and Social Care Services, Justice and Equality Services and Other Government Services. It will determine the scope and design principles to be used within each programme and co‐ordinate the effort across the programmes to avoid duplication.
Civil Service Reform – focussing on improving the way in which the civil service supports government and clarifying the future shape and size of the civil service; improving the capability and capacity within the civil service to support policy development; sharpen accountability for the implementation of policy; and enable the recommendations of the States’ Review Committee to be implemented in full.
60

2017 BUDGET REPORT
9.14 Delegated authority was given to the Treasury and Resources Department to approve funding of up to £750,000 for any one programme, apart from Transforming Health and Social Care Services where a limit of £1million was agreedf. In addition, the Treasury and Resources Department was given delegated authority, to a maximum of £250,000, to approve funding for any initiatives not on the prioritised list.
9.15 Further uses of the Fund have been approved by the States as follows:
As part of the 2016 Budget Report, the Treasury and Resources Department was given delegated authority to approve funding of a maximum of £500,000 in respect of the revenue expenditure associated with the change in the system of population management as previously approved by the States.
Following consideration of the States Review Committee – The Organisation of States’ Affairs (Billet d’État XII 2015) proposals, the States agreed to delegate authority to the Treasury and Resources Department to approve up to £550,000 to provide for the implementation of the improved committee system.
9.16 During the year the Treasury & Resources Department and latterly the Policy & Resources Committee have begun to approve expenditure against some of these prioritised amounts as set out in the table below.
9.17 In addition, in March 2016 the Treasury & Resources Department used its delegated authority to authorise expenditure of £236,000 from the Fund to enable the delivery of a corporate performance management framework across the States of Guernsey over the next twelve months which will help drive continuous performance improvement and support evidence‐based decision‐making.
f As set out in paragraph 5.24, the Policy & Resources Committee is recommending an increase of £500,000 in this delegated authority.
61

2017 BUDGET REPORT
9.18 As set out in the table below, the current uncommitted balance of the Transformation and Transition Fund is £17.7million:
Prioritised£’000
Approved £’000
Opening balance 25,000 Transfer from Fundamental Spending Review Fund 817 Transfer from Strategic Development Fund 862 26,679 Initiatives: Social Policy Development 750 ‐ Public Service Reform 750 395 Transforming Education & Training Services 750 ‐ Transforming Health & Social Care Services 1,000 432 Transforming Justice & Equality Services 750 ‐ Transforming Other Government Services 750 ‐ Civil Service Reform 750 ‐ Population Management 500 290 Corporate Performance Reporting 236 236 Implementation of States Review Committee proposals 550 265 Fundamental Spending Review Fund commitments including the introduction of resource accounting and budgeting 2,117 817 Children and Young People’s Plan 62 37 8,965 2,472
Balance 17,714
9.19 The Policy & Resources Committee will report in the States of Guernsey Accounts on the
detailed use of the Future Guernsey Economic Fund and the Transformation and Transitional Fund and the benefits realised from these investments.
62

2017 BUDGET REPORT
States of Guernsey Bond
9.20 As part of the 2015 Budget Report, the States authorised the Treasury and Resources Department to:
“Issue a States of Guernsey Bond of £250million with a minimum term of 20 years and a maximum term of 40 years at such a time and on such terms as that Department considers to be in the best interests of the States; and to lend on the capital thereby raised to States owned entities, trading accounts and funds, the Guernsey Housing Association, the Alderney Housing Association and/or the Ladies’ College on such terms that the Department may approve, subject to each recipient repaying such borrowing in full from a secure income stream and without direct recourse to General Revenue and, in accordance with policies of the States affirmed in 2004, 2006, 2009 and 2014, to direct the Treasury & Resources Department to report to the States as expeditiously as possible, but in any event by no later than the 2016 Budget Report, to demonstrate how all such borrowing has been or soon will be allocated clearly to individual recipients and how each recipient will be repaying such borrowing in full from a secure income stream and without recourse in any way to general revenue”
and to delegate authority to the Policy Council to:
“Approve an increase in the value of the States of Guernsey Bond issue by a maximum of a further £80million, following consideration of a justification from the Treasury and Resources Department; and, in accordance with policies of the States affirmed in 2004, 2006, 2009 and 2014, to direct the Treasury & Resources Department to report to the States as expeditiously as possible, but in any event by no later than the 2016 Budget Report, to demonstrate how all such additional borrowing has been or soon will be allocated clearly to individual recipients and how each recipient will be repaying such borrowing in full from a secure income stream and without recourse in any way to general revenue.”
9.21 In November 2014, the Policy Council approved an increase of £80million in the value of the States of Guernsey bond issue.
9.22 The bond issue, which took place in December 2014 and has a final maturity date of 2046, was over‐subscribed with a strong level of investor interest which enabled the States of Guernsey to secure an issue of the full £330million at a fixed rate of interest of 3.375% which represented the lowest ever coupon for a long‐term fixed rate sterling bond from any issuer without a UK Government guarantee. The minimum interest rate charged on any lending is 3.625%; the calculation of which recovers the yield adjustment and all of the costs associated with issuing the bond.
63

2017 BUDGET REPORT
9.23 The Bond Management Sub‐Committee of the Treasury and Resources Department has agreed loans totalling £132million from the proceeds of the States of Guernsey Bond issue. The interest rate charged on loans is calculated by application of a formula which incorporates:
a ‘credit risk score’ calculated on the basis of a simple scorecard approach which incorporates key financial ratios including profitability, interest cover and gearing and considers the ‘proximity to General Revenue’ – i.e. through a General Revenue service with the loan repayments being funded entirely by charges made to service users; a General Revenue trading entity; an incorporated States Trading Company / wholly owned arrangement or any other entity; and
an adjustment for prevailing interest rates which relates to the difference between current swap rates for the loan term being requested compared to the swap rate for that loan term applicable on the date the Bond was issued.
9.24 The average interest rate charged on the loans made to date is 3.8% which is slightly in excess of the minimum interest rate of 3.625%.
9.25 The bond issue proceeds which have not yet been lent on to entities form part of the General Revenue investment assets which are invested in line with the direction set by the Committee’s Investment and Bond Management Sub‐Committee. The investment return received in 2015 was not sufficient to meet the full costs of the annual bond coupon (interest) payment, resulting in a £5.7million deficit on the Bond Reserve. However, during the first half of 2016, this position was reversed and the investment return outperformed the target return and comfortably exceeded the amount necessary to pay the coupon, eliminating the 2015 shortfall.
9.26 There are some entities which currently have external borrowings, guaranteed by the States of Guernsey, where breaking the existing arrangements and replacing with a loan from the bond proceeds is not considered to be cost effective (e.g. due to cost of exiting fixed rate arrangements or the attractiveness of short‐term funding in the current interest rate environment). There are some entities where the timing of the funding requirement has changed including in respect of the Waste Strategy and Guernsey Electricity Limited where there is no longer an immediate requirement to replace a cable.
64
2017 BUDGET REPORT
9.27 Notwithstanding that it would inevitably take a period of time to lend on the proceeds of the States of Guernsey bond issue, the amount currently approved is lower than was anticipated at the time of issue. However, the reasons are largely considered to be short‐term timing issues and it is reiterated that there are significant financing requirements in the short‐ to medium‐term which could be funded from the Bond issue proceeds including:
Guernsey Water: to refinance the Belle Greve Wasterwater Outfalls project (up to £19.9million);
Guernsey Water: to fund infrastructure investment as set out in the Guernsey Water business plan (£55million for the next ten years);
Guernsey Housing Association: to continue development of affordable housing (average of £10million per annum); and
Guernsey Electricity Limited: further infrastructure requirements including, potentially, a direct cable to France (approximately £80million).
9.28 In addition, as set out paragraphs 7.11 to 7.18, the continuing work on reviewing the capital structures of the States’ trading assets is likely to result in proposed changes which would require funding from the bond proceeds.
9.29 The Policy & Resources Committee intends to investigate whether, in limited and specific circumstances, and subject to provision of appropriate security and a business plan that demonstrates that the interest and capital repayments will be made, it would be desirable to extend the range of entities to which the bond proceeds can be lent to include organisations which are not part of, or wholly owned by, the States. The Committee will report back to the States with recommendations, if appropriate, to change the policy for the on‐lending of the bond proceeds.
Aurigny
9.30 In November 2015 (Billet d’État XX, 2015), following consideration of a Policy Letter from the Treasury and Resources Department, the States resolved, inter alia, to approve the recapitalisation of Cabernet Ltd (Aurigny Group) in respect of its cumulative losses of £19.9million up to 31 December 2014 and its forecast losses of £5.3million for the years 2015 to 2017.
9.31 The States also agreed “To authorise the Treasury and Resources Department to provide short‐term borrowing facilities to the Aurigny Group” and “To direct the Treasury and Resources Department to report to the States of Deliberation with details of any short‐term borrowing facilities provided to the Aurigny Group within six months of their provision, explaining the need for the facility.”
9.32 The following profile of losses for 2015 to 2017 were forecast in the Policy Letter:
2015 ‐ £2.3million
2016 ‐ £1.5million
2017 ‐ £1.5million
65

2017 BUDGET REPORT
9.33 The 2015 results of a loss of £2.55million (excluding any adjustment arising from the application of Accounting Standard FRS102 which will ‘reverse out’ in future years) was £250,000 higher than anticipated due to unexpected maintenance requirements. The 2015 Accounts will be published following the company’s Annual General Meeting in the final quarter of 2016.
9.34 However, in respect of 2016, the position is substantially worse as a loss of £4.6million is anticipated. This means that all of the recapitalisation funds will have been used by the end of 2016 and Aurigny will be in a negative balance sheet position of nearly £2million. Due to the timings of the Company’s cash‐flows (primarily the large amount of money it receives from the advance sale of flight tickets), it has not needed to request a borrowing facility.
9.35 The major reasons for the £3.1million deterioration in the 2016 financial position are: increased maintenance costs (£1.4million), shortfall in flight revenue (£0.7million), increased one‐off costs associated with the introduction of the Dornier aircraft (£0.3million); withdrawal of Jersey‐Guernsey codeshare (£0.2million) and increased disruption costs associated with unusually high periods of fog (£0.2million).
9.36 In respect of 2017 – 2019, the Aurigny has forecast losses of £4‐5million per annum. This is substantially higher than the position anticipated in November 2015 due to increased maintenance costs as a result of the ageing aircraft fleet, exposure to the US dollar exchange rate and increased crew and compliance costs arising from greater regulation and scrutiny by the Civil Aviation Authority.
9.37 The Policy & Resources Committee has recently commissioned a strategic review of the role and objectives of Aurigny with the intention of reporting back to the States as early in 2017 as possible. The objective of the review is to make recommendations to the Committee and the States Trading Supervisory Board (in its shareholder role) that can help to set clear and long‐term policy and economic objectives for Aurigny. In addition, the review will consider shorter‐term steps that can be taken to enhance the social and economic enablement role of Aurigny. The objective that is currently set for Aurigny is to break‐even before allowing for budgeted losses on the Alderney routes.
9.38 Any change to the existing shareholder objectives which negatively impact on the company’s financial position will need to consider the associated funding issues.
9.39 In respect of the budgeted losses on the Alderney routes, estimated to be £1.4million per annum (when the new Dornier fleet is operational), although this is not defined as a ‘Transferred Service’ within the financial arrangements pertaining to Alderney, it is funded directly from General Revenue (and a significant proportion of the recent recapitalisation will relate to losses incurred on the Alderney routes). Whilst recognising that these airlinks are considered to be necessary for the maintenance and expansion of Alderney’s economy, the future funding arrangement for these routes will be considered as part of the Review of the Financial Relationship with Alderney.
66

2017 BUDGET REPORT
9.40 Until the States have considered the strategic review and decisions made on the future objectives for Aurigny, including the impact this will have on its operating position and its future funding arrangements, the Policy & Resources Committee will make provision, within the General Revenue Account Reserve, for the company’s accumulated losses (which are estimated to total £3million by the end of quarter one – 2017), which is in line with treatment of losses prior to the recent recapitalisation.
9.41 There will, of course, be a requirement to fund this accumulated loss in the future – either through a further recapitalisation or a one‐off revenue grant. The Policy & Resources Committee intends to address this matter as part of its Policy Letter on the strategic review. In the meantime, if required, the Committee would make available a temporary borrowing facility to Aurigny, pending determination of the future funding arrangements.
Alderney
9.42 In February 2016 (Billet d’Etat II, 2016), the States considered a Policy Letter from the Policy Council titled “The Review of the Financial Relationship between Guernsey and Alderney” and, agreed in principle, that the financial arrangements be modified such that:
Guernsey retains responsibility to fund all Transferred Services, and the Social Security Funds, through the pooled income sources of Income Tax and Social Security Contributions;
The States of Alderney is responsible for funding all other public services in Alderney (including the harbour, drainage (foul and surface water), roads, coastal defence, water and electricity), from all other levies, rates, taxes, permit fees, rents, duties and other income collected from sources based in Alderney (such as tax on real property, occupiers’ rates, import duties and excise duties, fees in lieu of Congé, document duty, numismatic and philatelic profits, and company registration fees.
9.43 Work is ongoing to consider the most appropriate future arrangements for expenditure currently funded directly by the States of Guernsey for certain services provided in / for Alderney. The two major items are the deficit on operating Alderney Airport and the (public service) subsidy to the airline operating the Alderney routes. It is not anticipated that recommendations on the future funding arrangements for these items will be made until such time as the approach to be taken with regard to the Alderney Airport runway has been determined and consideration of the strategic review of the role and objectives of Aurigny in respect of the Alderney routes. The future treatment of the Alderney Gambling Control Commission surpluses and funding arrangements for the States of Alderney capital requirements, Alderney Airport and air routes are key elements of the Review and work is ongoing to consider these and proposals will be included in future Budget Reports.
67

2017 BUDGET REPORT
9.44 The recommended 2017 Cash Limit for the States of Alderney is £1.83million (net of a 3% budget reduction of £55,000) which will be used by the States of Alderney, together with income it collects directly, to fund Non Transferred Services. As the first stage in introducing the modified financial arrangements, the Policy & Resources Committee is intending, subject to the formal approval of the States of Alderney, to propose in the 2018 Budget Report that, with effect from 2018:
The Tax on Real Property (TRP) rates in respect of Alderney buildings will be set at £zero. The 2017 budget for this income is £800,000;
The excise duty on Motor Fuel imports into Alderney will be set at £zero. The 2017 budget for this income is £350,000;
The document duty on conveyances of Alderney property which is paid to General Revenue is paid to the States of Alderney. The 2017 budget for this income is £350,000;
A commensurate reduction is made to the recommended 2018 Cash Limit for the States of Alderney. The estimated reduction is £1.5million which would reduce the Cash Limit to £330,000 per annum.
9.45 At this stage, it is not recommended that a similar arrangement is put in place for other excise (alcohol and tobacco) and import duties as, unlike motor fuel which is delivered directly into Alderney Harbour, the vast majority are made as ‘duty‐paid’ imports as they have formed part of larger imports into Guernsey where the duty has been paid. Therefore, any change would require revised administrative and duty charging arrangements which would result in increased cost of collection and the need for additional border agency officials, particularly if the duty rates were different between Guernsey and Alderney in order to protect against evasion.
9.46 During 2017, the States of Alderney will develop its existing Occupier’s Rates system (which uses the existing Cadastre register) in order to levy one property tax. As part of its 2018 Budget, the States of Alderney will agree the Occupier’s Rates and Excise Duty on Motor Fuel it will levy. The States of Alderney considers that these proposals would provide them with greater freedom and flexibility to set tax and duty rates at such levels they determine will best raise the funds necessary to provide their public services. If there is a requirement to increase expenditure on public services provided by the States of Alderney, either through an increase in demand for existing services or the introduction of new services, this will increase the options available to the States of Alderney to make funding available.
9.47 The States of Alderney is currently developing governance processes and procedures including in respect of finance and resource management incorporating an Accounting Officer framework. These will be reviewed by the Policy & Resources Committee and, if required, appropriate proposals put before the States to request approval to any changes to the existing approved arrangements.
68

2017 BUDGET REPORT
9.48 The Alderney Gambling Control Commission generates annual surpluses in the region of £2million which, under the existing financial arrangements, should be treated as General Revenue income. However, for a number of years, these surpluses have been used as the source of funding for the States of Alderney capital programme and have predominantly been used to address the back‐log of major infrastructure works. As part of the 2015 Budget Report the States, inter alia, agreed:
That the Alderney Gambling Control Commission surpluses received by the States of Alderney continue to be transferred to the States of Alderney capital allocation up to 31 December 2017;
To approve the establishment of a States of Alderney Economic Development Fund with effect from 1 January 2014 and to delegate authority to the Treasury and Resources Department to approve use of this Fund; and
To delegate authority to the Treasury and Resources Department to approve transfers to the States of Alderney Economic Development Fund to a maximum of £900,000 from the surpluses received by the States of Alderney from the Alderney Gambling Control Commission.
9.49 The States of Alderney have approved the use of £794,000 from the States of Alderney Economic Development Fund for projects which are designed to contribute positively to economic development, population growth, income growth or lead to expenditure reduction.
9.50 As set out in paragraph 9.43, the future treatment of the Alderney Gambling Control Commission surpluses is closely linked with any revision to the funding arrangements for the States of Alderney capital requirements, Alderney Airport and air routes.
9.51 However, in order to provide short‐term certainty for the States of Alderney whilst work is ongoing to develop the long‐term changes to the financial arrangements, it is recommended that:
The Alderney Gambling Control Commission surpluses received by the States of Alderney continue to be transferred to the States of Alderney capital allocation up to 31 December 2019;
Delegated authority is given to the States of Alderney to:
i. make transfers from the States of Alderney capital allocation to the States of Alderney Economic Development Fund of a maximum of £300,000 per annum; and
ii. Approve uses of the States of Alderney Economic Development Fund;
With effect from 2020, unless alternative arrangements are put in place as part of the package of changes to the financial relationship between Guernsey and Alderney, the Alderney Gambling Control Commission surpluses will be credited to the General Revenue Account.
69

Draft Ordinance Entitled
The Excise Duties (Budget) Ordinance, 2016
THE STATES, in pursuance of their Resolution of the 1st November 2016 and in exercise of the powers conferred on them by sections , 23C(3) and 23K of the Customs and Excise (General Provisions) (Bailiwick of Guernsey) Law, 1972 as amendeda, hereby order:‐
Amendment of Fourth Schedule to the Law.
1. In the Fourth Schedule to the Customs and Excise (General Provisions) (Bailiwick of Guernsey) Law, 1972, as amended, for the tables in paragraphs 1 to 7 under “GOODS LIABLE TO EXCISE DUTY; & RATES OF EXCISE DUTY” substitute the following‐
"1. Tobacco and tobacco products
(a) Cigarettes £315.24 per kilo
(b) Cigars £306.70 per kilo
(c) Hand rolling tobacco £285.61 per kilo
(d) Other manufactured tobacco £247.73 per kilo
(e) Tobacco leaf – unstemmed £275.01 per kilo
(f) Tobacco leaf – stemmed £277.77 per kilo
2. Petrol and Gas oil –
(a) Petrol other than any fuel used for the purpose of air
navigation (and subject to b.)
63.5p per litre
(b) Petrol used for the purpose of marine navigation 40.4p per litre where
supplied by an approved
trader except where
supplied to an approved
trader in which case 63.5p
per litreb
(c) Gas oil 63.5p per litre
3. Other fuels‐
Biodiesel 63.5p per litre
For the purposes of calculating the excise duty applicable to any biodiesel ‐
(a) any computation of the volume of biodiesel shall be made in litres as at 15 degrees Celsius, and
(b) where any colouring matter or substance commonly added for the purpose of improving or modifying the quality or characteristics of biodiesel as a fuel is added to biodiesel prior to its delivery, then the volume of that biodiesel shall be determined by reference to the total volume including such additives.
a Ordres en Conseil Vol. XXIII, p.573; as amended by Vol. XXIV, p.87; Vol. XXXI, p. 278; Vol. XXXIII, p. 217; Order in Council No. X of 2004;
No. XIV of 2007; No. II of 2010; No. XV of 2012; Receuil d'Ordonnances Tome XXIX, p. 406; Tome XXXII, pp. 607 and 668; Tome XXXIII, p.
38; and Ordinance No. XLIII of 2013; No. XL of 2015; and No. IX of 2016. b The circumstances in which the different rates may apply shall be specified by the Committee by Order.
70

4. Beer
(a) Beer exceeding 1.2 per cent volume but not
exceeding 2.8 per cent volume
47p per litre
(b) Beer brewed by an independent small brewery
exceeding 2.8 per cent volume but not exceeding 4.9
per cent volume
47p per litre
(c) Beer, other than beer brewed by an independent
small brewery, exceeding 2.8 per cent volume but not
exceeding 4.9 per cent volume
75p per litre
(d) Beer brewed by an independent small brewery
exceeding 4.9 per cent volume but not exceeding 7.5
per cent volume
60p per litre
(e) Beer, other than beer brewed by an independent
small brewery, exceeding 4.9 per cent volume but not
exceeding 7.5 per cent volume
94p per litre
(f) Beer exceeding 7.5 per cent volume £1.09 per litre
5. Spirits
Spirits £33.96 per litre of alcohol
contained in the liquor,
calculated in accordance
with section 23D
6. Cider
(a) Cider exceeding 1.2 per cent volume but not
exceeding 2.8 per cent volume
47p per litre
(b) Cider produced by an independent small cider‐maker
exceeding 2.8 per cent volume but not exceeding 4.9
per cent volume
47p per litre
(c) Cider, other than cider produced by an independent
small cider‐maker, exceeding 2.8 per cent volume but
not exceeding 4.9 per cent volume
75p per litre
(d) Cider produced by an independent small cider‐maker
exceeding 4.9 per cent volume but not exceeding 7.5
per cent volume
60p per litre
(e) Cider, other than cider produced by an independent
small cider‐maker, exceeding 4.9 per cent volume but
not exceeding 7.5 per cent volume
94p per litre
(f) Cider exceeding 7.5 per cent volume £1.09 per litre
71

7. Wines
(a) Light wines not exceeding 5.5 per cent volume 59p per litre
(b) Light wines exceeding 5.5 per cent volume but not
exceeding 15 per cent volume (including sparkling
wines)
£2.39 per litre
(c) Other wines £3.82 per litre”
Extent
2. This Ordinance shall have effect in the Islands of Guernsey, Alderney, Herm and Jethou.
Repeals
3. The Excise Duties (Budget) Ordinance, 2015c is repealed.
Citation
4. This Ordinance may be cited as the Excise Duties (Budget) Ordinance, 2016.
Commencement
5. This Ordinance shall come into force on the 1st November, 2016.
c Ordinance No. XL of 2015.
72

Draft Ordinance Entitled
The Taxation of Real Property (Guernsey and Alderney) (Amendment) Ordinance, 2016
THE STATES, in pursuance of their resolution of the 1st November, 2016 and in exercise of the powers conferred
upon them by sections 1 and 2 of the Taxation of Real Property (Enabling Provisions) (Guernsey and Alderney)
Law, 2005a, hereby order:‐
Rates of property tax
1. For the tables in Part I of Schedule 1 to the Taxation of Real Property (Guernsey and Alderney) Ordinance, 2007b substitute the tables in the Schedule to this Ordinance.
Repeal
2. The Taxation of Real Property (Guernsey and Alderney) (Amendment) Ordinance, 2015 c is repealed.
Extent.
3. This Ordinance shall have effect in the Islands of Guernsey, Alderney and Herm.
Citation and Commencement
4. This Ordinance may be cited as the Taxation of Real Property (Guernsey and Alderney) (Amendment) Ordinance, 2016.
Commencement
5. This Ordinance shall come into force on the 1st January, 2017.
a Order in Council No. X of 2006. b Recueil d’Ordonnances Tome XXXII, p.504, as amended by Order in Council No. XIII of 2010, Recueil d’Ordonnances Tome XXXIII, pp. 35
and 332; Ordinance No. XIII of 2012; and Ordinance No. XLI of 2015. c Ordinance No. XLI of 2015.
73

SCHEDULE
Section 1
TABLE (A)
GUERNSEY REAL PROPERTY
GUERNSEY BUILDINGS
1
Property
Reference
2
Property
Description/Usage
3
Tariff
B1.1 Domestic (whole unit) Local Market £1.38
B1.2 Domestic (flat) Local Market £1.38
B1.3 Domestic (glasshouse) Local Market 5p
B1.4 Domestic (outbuildings) Local Market 69p
B1.5 Domestic (garaging and parking) (non‐owner‐occupied) Local Market £1.38
B2.1 Domestic (whole unit) Open Market £1.38
B2.2 Domestic (flat) Open Market £1.38
B2.3 Domestic (glasshouse) Open Market 5p
B2.4 Domestic (outbuildings) Open Market 69p
B2.5 Domestic (garaging and parking) (non‐owner‐occupied) Open Market £1.38
B3.1 Domestic (whole unit) Social Housing Zero
B3.2 Domestic (flat) Social Housing Zero
B3.3 Domestic (glasshouse) Social Housing Zero
B3.4 Domestic (outbuildings) Social Housing Zero
B3.5 Domestic (garaging and parking) (non‐owner‐occupied) Social Housing Zero
B4.1 Hostelry and food outlets £5.50
B4.2 Self‐catering accommodation £3.45
B4.3 Motor and marine trade £4.65
B4.4 Retail £9.50
B4.5 Warehousing £5.05
B4.6 Industrial and workshop £4.05
B4.7 Recreational and sporting premises £2.35
B4.8 Garaging and parking (non‐domestic) £5.05
B5.1 Utilities providers £39.45
B6.1 Office and ancillary accommodation (regulated finance industries) £36.80
B6.2 Office and ancillary accommodation (other than regulated finance industries) £12.30
B7.1 Horticulture (building other than a glasshouse) 5p
B8.1 Horticulture (glasshouse) 5p
B9.1 Agriculture 5p
B10.1 Publicly owned non‐domestic Zero
B11.1 Exempt (Buildings) Zero
B12.1 Buildings – Penal Rate Zero
B13.1 Development buildings (domestic) 69p
B13.2 Development buildings (non‐domestic) £5.25
74

SCHEDULE
GUERNSEY LAND
1
Property
Reference
2
Property
Description/Usage
3
Tariff
L1.1 Communal (flat) Local Market 18p
L1.2 Communal (flat) Open Market 18p
L1.3 Hostelry and food outlets 36p
L1.4 Self‐catering accommodation 36p
L1.5 Motor and marine trade 36p
L1.6 Retail 36p
L1.7 Warehousing 36p
L1.8 Industrial 36p
L1.9 Recreational and sporting premises 36p
L1.10 Office and ancillary accommodation (regulated finance industries) £1.20
L1.11 Office and ancillary accommodation (other than regulated finance industries) 40p
L1.12 Utilities providers 36p
L2.1 Approved development site £1.20
L3.1 Domestic Local Market 18p
L3.2 Domestic Open Market 18p
L3.3 Horticulture 18p
L3.4 Agriculture 18p
L3.5 Domestic Social Housing Zero
L3.6 Publicly owned non‐domestic Zero
L4.1 Exempt (Land) Zero
L5.1 Land – Penal Rate Zero
L6.1 Garaging and parking (non‐domestic) 36p
75

SCHEDULE
TABLE (B)
ALDERNEY REAL PROPERTY
ALDERNEY BUILDINGS
1
Property
Reference
2
Property
Description/Usage
3
Tariff
B1.1A Domestic (whole unit) £1.38
B1.2A Domestic (flat) £1.38
B1.3A Domestic (glasshouse) 5p
B1.4A Domestic (outbuildings) 69p
B1.5A Domestic (garaging and parking) (non‐owner‐occupied) £1.38
B3.1A Domestic (whole unit) Social Housing Zero
B3.2A Domestic (flat) Social Housing Zero
B3.3A Domestic (glasshouse) Social Housing Zero
B3.4A Domestic (outbuildings) Social Housing Zero
B3.5A Domestic (garaging and parking) (non‐owner‐occupied) Social Housing Zero
B4.1A Hostelry and food outlets £5.50
B4.2A Self‐catering accommodation £3.45
B4.3A Motor and marine trade £4.65
B4.4A Retail £9.50
B4.5A Warehousing £5.05
B4.6A Industrial and workshop £4.05
B4.7A Recreational and sporting premises £2.35
B4.8A Garaging and parking (non‐domestic) £5.05
B5.1A Utilities providers £39.45
B6.1A Office and ancillary accommodation (regulated finance industries) £36.80
B6.2A Office and ancillary accommodation (other than regulated finance industries) £12.30
B7.1A Horticulture (building other than a glasshouse) 5p
B8.1A Horticulture (glasshouse) 5p
B9.1A Agriculture 5p
B10.1A Publicly owned non‐domestic Zero
B11.1A Exempt (Buildings) Zero
B12.1A Buildings – Penal Rate Zero
B13.1A Development building (domestic) 69p
B13.2A Development building (non‐domestic) £5.25
76

SCHEDULE
ALDERNEY LAND
1
Property
Reference
2
Property
Description/Usage
3
Tariff
L1.1A Communal (flat) Zero
L1.3A Hostelry and food outlets Zero
L1.4A Self‐catering accommodation Zero
L1.5A Motor and marine trade Zero
L1.6A Retail Zero
L1.7A Warehousing Zero
L1.8A Industrial Zero
L1.9A Recreational and sporting premises Zero
L1.10A Office and ancillary accommodation (regulated finance industries) Zero
L1.11A Office and ancillary accommodation (other than regulated finance industries) Zero
L1.12A Utilities providers Zero
L2.1A Approved development site Zero
L3.1A Domestic Zero
L3.3A Horticulture Zero
L3.4A Agriculture Zero
L3.5A Domestic Social Housing Zero
L3.6A Publicly owned non‐domestic Zero
L4.1A Exempt (Land) Zero
L5.1A Land – Penal Rate Zero
L6.1A Garaging and parking (non‐domestic) Zero
77

SCHEDULE
TABLE (C)
HERM REAL PROPERTY
HERM BUILDINGS
1
Property
Reference
2
Property
Description/Usage
3
Tariff
B1.1H Domestic (whole unit) Zero
B1.2H Domestic (flat) Zero
B1.3H Domestic (glasshouse) Zero
B1.4H Domestic (outbuildings) Zero
B1.5H Domestic (garaging and parking) (non‐owner‐occupied) Zero
B3.1H Domestic (whole unit) Social Housing Zero
B3.2H Domestic (flat) Social Housing Zero
B3.3H Domestic (glasshouse) Social Housing Zero
B3.4H Domestic (outbuildings) Social Housing Zero
B3.5H Domestic (garaging and parking) (non‐owner‐occupied) Social Housing Zero
B4.1H Hostelry and food outlets Zero
B4.2H Self‐catering accommodation Zero
B4.3H Motor and marine trade Zero
B4.4H Retail Zero
B4.5H Warehousing Zero
B4.6H Industrial and workshop Zero
B4.7H Recreational and sporting premises Zero
B4.8H Garaging and parking (non‐domestic) Zero
B5.1H Utilities providers Zero
B6.1H Office and ancillary accommodation (regulated finance industries) Zero
B6.2H Office and ancillary accommodation (other than regulated finance industries) Zero
B7.1H Horticulture (building other than a glasshouse) Zero
B8.1H Horticulture (glasshouse) Zero
B9.1H Agriculture Zero
B10.1H Publicly owned non‐domestic Zero
B11.1H Exempt (Buildings) Zero
B12.1H Buildings – Penal Rate Zero
B13.1H Development buildings (domestic) Zero
B13.2H Development buildings (non‐domestic) Zero
78

SCHEDULE
HERM LAND
1
Property
Reference
2
Property
Description/Usage
3
Tariff
L1.1H Communal (flat) Zero
L1.3H Hostelry and food outlets Zero
L1.4H Self‐catering accommodation Zero
L1.5H Motor and marine trade Zero
L1.6H Retail Zero
L1.7H Warehousing Zero
L1.8H Industrial Zero
L1.9H Recreational and sporting premises Zero
L1.10H Office and ancillary accommodation (regulated finance industries) Zero
L1.11H Office and ancillary accommodation (other than regulated finance industries) Zero
L1.12H Utilities providers Zero
L2.1H Approved development site Zero
L3.1H Domestic Zero
L3.3H Horticulture Zero
L3.4H Agriculture Zero
L3.5H Domestic Social Housing Zero
L3.6H Publicly owned non‐domestic Zero
L4.1H Exempt (Land) Zero
L5.1H Land – Penal Rate Zero
L6.1H Garaging and parking (non‐domestic) Zero
79

Draft Ordinance Entitled
The Document Duty (Amendment) Ordinance, 2016
THE STATES, in pursuance of their Resolution of the 1st November, 2016 and in exercise of the powers conferred on them by sections 1 and 6 of the Document
Duty (Guernsey) Law, 1973a, hereby order:‐
Amendment to Schedule 1.
1. In Schedule 1 to the Document Duty Ordinance, 2003b, for the entries
in each of the columns at each of paragraphs 1, 2, 3 and 5 substitute ‐
"1. Conveyance of realty other than a conveyance within item 2, 3 or 5:
(a) 2.0% of the value of the transaction up to £250,000; and (b) 3.25% of any part of the value of the transaction between £250,001 and £400,000; and (c) 3.5% of any part of the value of the transaction between £400,001 and £750,000; and (d) 3.75% of any part of the value of the transaction between £750,001 and £1,000,000; and (e) 4.0% of any part of the value of the transaction in excess of £1,000,000.".
_____________________________________________________________________ a Ordres en Conseil Vol. XXIV, p. 74, as amended by Ordres en Conseil Vol. XXXI, p. 278; Vol. XLII(2), p. 1324; as applied to Alderney by Recueil d’Ordonnances Tome XXIX, pp. 284. b Recueil d’Ordonnances Tome XXIX, p. 284; as amended by Recueil d’Ordonnances Tome XXIX, p. 406; Tome XXXI, p. 436; Tome XXXIII, pp. 617 and 620; and Tome XXXIII, p. 342.
80

"2. Conveyance by way of gift inter vivos of realty
(a) 2.0% of the value of the realty up to £250,000; and (b) 3.25% of any part of the value of the realty between £250,001 and £400,000; and (c) 3.5% of any part of the value of the realty between £400,001 and £750,000; and (d) 3.75% of any part of the value of the realty between £750,001 and £1,000,000; and (e) 4.0% of any part of the value of the realty in excess of £1,000,000.".
"3. Conveyance by way of Exchange of realty
In respect of the value of the realty acquired by each party, the same amount that would be payable if the realty had been conveyed by way of gift inter vivos; plus in respect of any further consideration given by either party:
(a) 2.0% of that consideration up to £250,000; and (b) 3.25% of any part of that consideration between £250,001 and £400,000; and (c) 3.5% of any part of that consideration between £400,001 and £750,000; and (d) 3.75% of any part of that consideration between £750,001 and £1,000,000; and (e) 4.0% of any part of that consideration in excess of £1,000,000; less 2.0% of the value of the realty exchanged.".
81

"5. Partage or Conveyance by way of Délaissance of realty‐ (a) Between co‐owners
(b) Other than between co‐
owners
£5.00 (a) 2.0% of the value of the realty up to £250,000; and (b) 3.25% of any part of the value of the realty between £250,001 and £400,000; and (c) 3.5% of any part of the value of the realty between £400,001 and £750,000; and (d) 3.75% of any part of the value of the realty between £750,001 and £1,000,000; and (e) 4.0% of any part of the value of the realty in excess of £1,000,000.".
Repeal.
2. The Document Duty (Amendment) Ordinance, 2013c is repealed.
Transitional relief. 3. (1) Relief in accordance with the following provisions of this section is available on document duty paid in connection with a qualifying registration.
(2) Relief shall consist of a repayment to be made by the States
Policy & Resources Committee, out of the general revenue account of the States, of an amount equal to any difference between the document duty paid and that which would have been payable if this Ordinance had not been enacted.
_____________________________________________________________________ c Ordinance No XXV of 2013.
82

(3) For the purposes of this section –
(a) "a qualifying registration" means –
(i) registration, within the transitional period, of any prescribed document described in paragraphs 1, 2, 3 or 5 of Schedule 1 to the Document Duty Ordinance, 2003 which has been executed further to a qualifying agreement, or
(ii) registration, after the expiration of the
transitional period, of any prescribed document described in paragraphs 1, 2, 3 or 5 of Schedule 1 to the Document Duty Ordinance, 2003 –
(A) which has been executed further to a
qualifying agreement, and (B) where written notice of the existence of
that agreement has, within the transitional period, been given to Her Majesty's Greffier,
(b) "a qualifying agreement" means an agreement –
(i) entered into prior to 4th October, 2016, and (ii) the terms and conditions of which, in the
opinion of Her Majesty's Greffier, are or were legally binding on any party to the agreement, and
(c) "the transitional period" means the period
commencing on 1st January, 2017 and ending on 30th June, 2017,
Interpretation. 4. Any reference in this Ordinance to an enactment is a reference thereto as from time to time amended, re‐enacted (with or without modification), extended or applied.
83

Extent. 5. This Ordinance shall have effect in the Islands of Guernsey and
Alderney. Citation. 6. This Ordinance may be cited as the Document Duty (Amendment) Ordinance, 2016. Commencement. 7. This Ordinance shall come into force on 1st January, 2017.
84
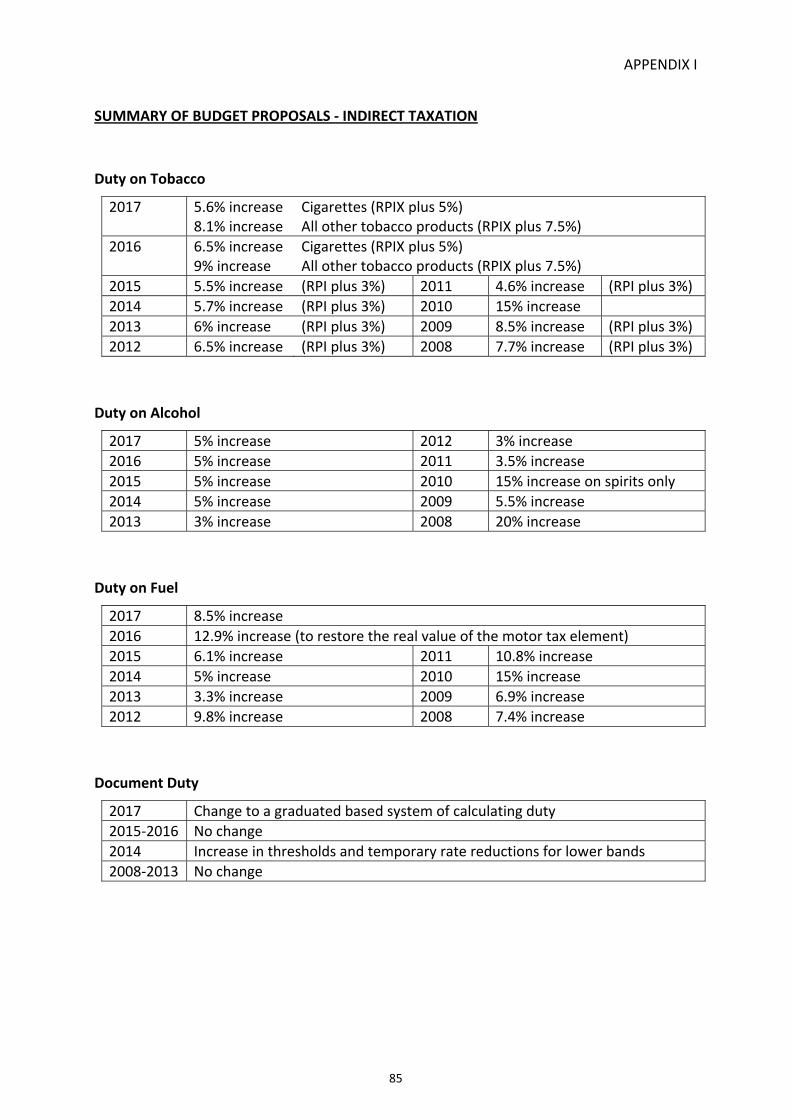
APPENDIX I
SUMMARY OF BUDGET PROPOSALS ‐ INDIRECT TAXATION
Duty on Tobacco
2017 5.6% increase 8.1% increase
Cigarettes (RPIX plus 5%) All other tobacco products (RPIX plus 7.5%)
2016 6.5% increase 9% increase
Cigarettes (RPIX plus 5%) All other tobacco products (RPIX plus 7.5%)
2015 5.5% increase (RPI plus 3%) 2011 4.6% increase (RPI plus 3%)
2014 5.7% increase (RPI plus 3%) 2010 15% increase
2013 6% increase (RPI plus 3%) 2009 8.5% increase (RPI plus 3%)
2012 6.5% increase (RPI plus 3%) 2008 7.7% increase (RPI plus 3%)
Duty on Alcohol
2017 5% increase 2012 3% increase
2016 5% increase 2011 3.5% increase
2015 5% increase 2010 15% increase on spirits only
2014 5% increase 2009 5.5% increase
2013 3% increase 2008 20% increase
Duty on Fuel
2017 8.5% increase
2016 12.9% increase (to restore the real value of the motor tax element)
2015 6.1% increase 2011 10.8% increase
2014 5% increase 2010 15% increase
2013 3.3% increase 2009 6.9% increase
2012 9.8% increase 2008 7.4% increase
Document Duty
2017 Change to a graduated based system of calculating duty
2015‐2016 No change
2014 Increase in thresholds and temporary rate reductions for lower bands
2008‐2013 No change
85

APPENDIX I
Tax on Rateable Value / Tax on Real Property
2017 10% increase 5% increase
Domestic Commercial
2016 10% increase 2.5% increase 5% increase
Domestic Retail Commercial (other than retail)
2015 15% increase 5% increase 10% increase
Domestic Retail Commercial (other than retail)
2014 5% increase
2013 3% increase
2012 20% increase 3% increase
Domestic Commercial
2011 20% increase 3.5% increase
Domestic Commercial
2010 10% increase
2009 5.5% increase 25% increase 50% increase
Domestic and Commercial Office and ancillary accommodation (other than regulated finance industries) Office and ancillary accommodation (regulated finance industries) buildings and land and approved development site land
2008 100% increase 400% increase
Commercial, utilities and recreational / sporting buildings and land Office and ancillary accommodation (regulated finance industries) buildings and land and approved development site land
86

INCOME AND EXPENDITURE ACCOUNT2015 2016 2017
ActualOriginal
Budget£'000s £'000s Note £'000s
Income
289,946 305,050 Income Taxes 1 302,500 68,736 75,300 Other Taxes 2 79,150 21,135 19,475 Miscellaneous Income 3 21,150
379,817 399,825 General Revenue Income 402,800
36,236 34,826 Committee Operating Income (including transfers) 38,743
416,053 434,651 441,543
Less Expenditure
213,678 211,846 Pay 4 217,172126,868 127,748 Non‐Pay 5 127,40860,218 62,615 Formula‐Led 6 55,940
‐ ‐ Balance of Budget Reduction (4,224)‐ (1,920) Efficiency Target ‐ ‐ (270) Financial Transformation Programme Target ‐ ‐ (622) Budget Submission in Excess of Cash Limit ‐
400,764 399,397 Revenue Expenditure 396,296
‐ 7,529 Budget Reserve 4,947
15,289 27,725 40,300
61 10,000 Capital Income 5,000
7,506 10,500 Less Routine Capital Expenditure 7 10,500
7,844 27,225 34,800
Transfers
(36,308) (28,300) To Capital Reserve (34,800)
(28,464) (1,075) Transfer from General Revenue Account Reserve ‐
APPENDIX II
Income and Expenditure by Category Budget
Total Income
Revenue Surplus
Net Surplus
87

INCOME AND EXPENDITURE ACCOUNT2015 2016 2017
ActualOriginal
Budget£'000s £'000s £'000s
379,817 399,825 Revenue Income 402,800 61 10,000 Capital Income 5,000
379,878 409,825 Total Income 407,800
Net Revenue Expenditure
29,337 30,074 Policy & Resources Committee 28,850 6,147 6,597 Committee for Economic Development 6,385
78,082 78,404 Committee for Education, Sport & Culture 77,445 69,750 72,197 Committee for Employment & Social Security 65,405 14,187 12,652 Committee for the Environment & Infrastructure 12,005 118,582 116,142 Committee for Health & Social Care 120,100 33,059 32,826 Committee for Home Affairs 32,060
468 570 Scrutiny Management Committee 553 17 ‐ States' Review Committee ‐
1,459 1,520 Development & Planning Authority 1,475 2,855 2,885 Overseas Aid & Development Commission 2,915 1,458 1,584 States' Trading Supervisory Board 1,540 2,557 2,540 Royal Court 2,460 4,711 4,700 Law Officers 4,530 1,859 1,880 States of Alderney 1,830
‐ 7,529 Budget Reserve 4,947
364,528 372,100 362,500
Routine Capital Expenditure
287 230 Policy & Resources Committee 625 ‐ ‐ Committee for Economic Development 50
2,066 1,125 Committee for Education, Sport & Culture 400 14 ‐ Committee for Employment & Social Security ‐ 517 3,450 Committee for the Environment & Infrastructure 3,175
2,957 1,625 Committee for Health & Social Care 750 986 400 Committee for Home Affairs 300 363 470 States' Trading Supervisory Board 700 197 200 Royal Court ‐ 119 ‐ Law Officers ‐
‐ 1,500 Backlog Property Maintenance 1,500 ‐ 1,500 Budget Reserve 3,000
7,506 10,500 10,500
372,034 382,600 Total Cash Limits 373,000
7,844 27,225 34,800
Transfers
(36,308) (28,300) To Capital Reserve (34,800)
(28,464) (1,075) Transfer from General Revenue Account Reserve ‐
Net Surplus
Income and Expenditure by Service Area Budget
88

NOTES
2015 2016 2017
ActualOriginal
Budget£'000s £'000s £'000s
238,351 245,700 Individuals 247,900 41,498 50,350 Companies (including Banks) 45,600 10,097 9,000 Distributed Profits 9,000
289,946 305,050 Income Taxes 302,500
2015 2016 2017
ActualOriginal
Budget£'000s £'000s £'000s
Customs ‐ Excise and Import Duties3,201 3,340 Beer 3,500 716 780 Cider 800
17,082 18,850 Motor Fuel 19,400 2,891 3,120 Spirits 2,950 7,058 7,980 Tobacco 8,600 4,805 4,930 Wine 5,350 1,705 1,450 Import duties 1,300
37,458 40,450 41,900
19,018 20,200 Tax on Real Property 21,400 12,260 13,500 Document Duty ‐ Conveyancing and Bonds 14,700
‐ 1,150 Vehicle First Registration Duty 1,150
68,736 75,300 Other Taxes 79,150
1. Income Taxes
Budget
2. Other Taxes
Budget
89

NOTES
2015 2016 2017
ActualOriginal
Budget£'000s £'000s £'000s
10,220 10,375 Company Fees 10,200 4,768 4,600 Net Housing Rental Income 4,850 3,741 1,650 Surplus on Notes and Coins Trading Account 1,550 548 2,850 Investment Return 2,850 998 ‐ States' Trading Companies' Dividends 1,600 860 ‐ Other Income 100
21,135 19,475 Miscellaneous Income 21,150
2015 2016 2017
ActualOriginal
Budget£'000s £'000s £'000s
82,495 83,326 Established Staff 83,571 48,355 46,989 Nurses and Medical Consultants 51,422 41,422 40,765 Teachers, Lecturers and Learning Support Assistants 41,601 16,292 16,108 Public Service Employees 16,119 9,289 9,084 Police Officers 8,887 3,351 3,373 Prison Officers 3,442 3,327 3,433 Guernsey Border Agency Officers 3,440 3,500 3,438 Fire Officers 3,429 1,780 1,927 Home Support Staff 1,820 1,634 1,664 Crown Officers, Magistrates and Royal Court Judge 1,664 2,233 1,739 Other Pay Groups 1,777
213,678 211,846 Pay Costs by Pay Group 217,172
3. Miscellaneous Income
Budget
4. Pay Costs by Pay Group
Budget
90

NOTES
2015 2016 2017
ActualOriginal
Budget£'000s £'000s £'000s
Staff Non Pay Costs2,194 2,700 Recruitment 2,257 2,044 2,659 Training 2,495 529 516 Other Staff Costs 519
4,767 5,875 5,271
Support Services1,901 1,894 Advertising Marketing and PR 1,920 241 222 Audit Fees 225 159 103 Bank Charges 199
8,876 9,753 Communications and IT 9,839 2,258 2,066 Consultants Fees 1,560 8,488 8,286 Contracted Out Work 8,417
5 8 Incidental and Other costs 98 2,028 1,907 Postage, Stationery and Printing 1,693 2,156 2,189 Risk Management and Insurance 2,391
26,112 26,428 26,342
785 755 823 2,595 2,699 2,626
15,211 15,247 15,084 4,816 5,710 5,379
23,407 24,411 23,912
246 276 Benefit Payments 328 29,704 29,808 30,568
29,950 30,084 30,896
1,343 1,387 1,294
27,742 25,220 25,154 13,547 14,343 14,539
41,289 39,563 39,693
126,868 127,748 Non‐Pay Costs by Expenditure Category 127,408
Vehicles and Vessels
Supplies and ServicesServicesSupplies
Transport
5. Non‐Pay Costs by Expenditure Category
Budget
PremisesEquipment, Fixtures and FittingsRents and LeasingRepairs, Maintenance and ServicingUtilities
Third Party Payments
Grants and Subsidies
91

NOTES
2015 2016 2017
ActualOriginal
Budget£'000s £'000s £'000s
Policy & Resources Committee1,982 2,010 Payments to States Members 1,900
20,946 22,210 Supplementary Benefit 21,635 15,018 15,410 Social Insurance Grant 15,555 9,824 9,850 Family Allowance 8,230 5,072 5,300 Severe Disability Benefit and Carers' Allowances 5,510 2,175 2,580 Legal Aid 2,525 4,577 4,680 Health Service Grant ‐ 624 575 Concessionary TV Licences for the Elderly 585
60,218 62,615 Formula‐Led Costs 55,940
2015 2016 2017
ActualOriginal
Budget£'000s £'000s £'000s
4,269 7,077 Miscellaneous Capital Works 6,504 846 1,182 IT Projects and Equipment 1,824
2,391 1,921 Equipment, Machinery and Vehicles 1,491 ‐ 1,500 Budget Reserve 3,000
7,506 11,680 12,819
‐ (1,180) (2,319)
7,506 10,500 10,500
Use of Accumulated Capital Allocation
Net Routine Capital Expenditure
7. Routine Capital Expenditure
Budget
6. Formula‐Led Costs by Expenditure Category
Budget
Committee for Employment & Social Security
92

POLICY & RESOURCES COMMITTEE2015 2016 2017
ActualOriginal
BudgetBudget
£'000s £'000s £'000s
1,183 1,199 1,101
Non Formula‐Led Expenditure
17,691 17,728 Pay costs 17,779
Non Pay costs2,409 3,243 Staff Non Pay costs 2,594 6,616 6,438 Support Services 6,602 275 325 Premises 314
1,006 1,044 Third Party Payments 1,014 8 12 Transport 9
533 593 Supplies & Services 545 ‐ ‐ Balance of Budget Reduction (806)
10,847 11,655 10,272
27,355 28,184 Net Non Formula‐Led Expenditure by Category 26,950
Formula‐Led Expenditure
1,982 2,010 Third Party Payments 1,900
1,982 2,010 1,900
‐ (120) Financial Transformation Programme Target ‐
29,337 30,074 28,850
Net Expenditure by Category
Operating Income
Formula‐Led Expenditure by Category
Total Net Expenditure by Category
93

POLICY & RESOURCES COMMITTEE2015 2016 2017
ActualOriginal
BudgetBudget
£'000s £'000s £'000s
Non Formula‐Led Expenditure
Core Services709 769 Central Services 748
1,284 1,301 External Affairs 1,1821,706 1,279 Policy 1,162975 731 Treasury 756
4,674 4,080 3,848
Corporate Functions489 521 Assurance and Risk 491162 210 Communications 268
2,221 2,444 Finance 2,4115,245 6,158 Human Resources 5,8354,365 4,210 Income Tax 4,1803,476 3,700 Information Systems & Services 3,7931,879 1,875 Insurance 1,875343 368 Procurement 379
3,686 3,738 Shared Services Centre 3,837(1) ‐ Transformation & Change ‐ 9 7 Tribunals 14
21,874 23,231 23,083
54 69 Commonwealth Parliamentary Association 52753 804 HE Lieutenant Governor 773
‐ ‐ Balance of Budget Reduction (806)
27,355 28,184 26,950
Formula‐Led Expenditure
1,982 2,010 Payments to States Members 1,900
1,982 2,010 1,900
‐ (120) Financial Transformation Programme Target ‐
29,337 30,074 28,850
270 520 IT Projects and Equipment 963
17 22 Equipment, Machinery and Vehicles ‐
287 542 963
‐ (312) (338)
287 230 625
Net Expenditure by Service Area
Net Expenditure by Service Area
Routine Capital Expenditure
Use of Accumulated Capital Allocation
Net Routine Capital Expenditure
94

COMMITTEE for ECONOMIC DEVELOPMENT2015 2016 2017
ActualOriginal
BudgetBudget
£'000s £'000s £'000s
772 712 663
Non Formula‐Led Expenditure
2,689 2,757 Pay costs 2,768
Non Pay costs40 61 Staff Non Pay costs 31
2,684 2,737 Support Services 2,56258 116 Premises 88
1,209 1,229 Third Party Payments 1,25234 80 Transport 67
205 329 Supplies & Services 280
4,230 4,552 4,280
6,147 6,597 6,385 Net Non Formula‐Led Expenditure by Category
Net Expenditure by Category
Operating Income
95

COMMITTEE for ECONOMIC DEVELOPMENT2015 2016 2017
ActualOriginal
BudgetBudget
£'000s £'000s £'000s
Non Formula‐Led Expenditure665 779 Central Services 70214 2 Civil Aviation Office 4
Finance and Economic Development584 704 Finance Sector Development 665512 485 Business Innovation and Skills 458
1,096 1,189 1,123
1,212 1,227 Grant and Support Schemes 1,250
Marketing & Tourism1,428 1,335 Consumer and Communications 1,299
49 75 Guernsey Information Centre 7668 79 Quality Development 70645 611 Strategic Marketing 637423 551 Trade and Media Relations 503
2,613 2,651 2,585
3 20 Office of the Public Trustee 20382 401 Sea Fisheries 389162 328 Strategic Projects 312
6,147 6,597 6,385
‐ ‐ IT Projects and Equipment 72
‐ ‐ (22)
‐ ‐ 50
Net Expenditure by Service Area
Net Expenditure by Service Area
Routine Capital Expenditure
Use of Accumulated Capital Allocation
Net Routine Capital Expenditure
96

COMMITTEE for EDUCATION, SPORT & CULTURE2015 2016 2017
ActualOriginal
BudgetBudget
£'000s £'000s £'000s
6,249 5,793 6,033
Non Formula‐Led Expenditure
56,681 56,349 Pay costs 56,579
Non Pay costs1,001 849 Staff Non Pay costs 9203,774 3,540 Support Services 3,5225,033 5,513 Premises 5,57814,199 14,001 Third Party Payments 15,026
239 132 Transport 1593,404 3,913 Supplies & Services 4,125
‐ ‐ Balance of Budget Reduction (2,431)
27,650 27,948 26,899
78,082 78,504 77,445
‐ (100) Financial Transformation Programme Target ‐
78,082 78,404 77,445
Operating Income
Net Non Formula‐Led Expenditure by Category
Net Expenditure by Category
97

COMMITTEE for EDUCATION, SPORT & CULTURE2015 2016 2017
ActualOriginal
BudgetBudget
£'000s £'000s £'000s
Beau Sejour672 709 Net expenditure 660(672) (325) Less transfer from Channel Islands Lottery (Guernsey) Fund (625)
‐ 384 35
4,667 4,881 Central Services 4,989402 414 Cultural Activities and Events 415
Further Education8,118 7,853 College of Further Education 7,708740 740 Guernsey Training Agency 740
1,187 1,379 Institute of Health and Social Care Studies 1,122
10,045 9,972 9,570
5,037 4,697 Higher Education 4,755Museums and Libraries
1,570 1,573 Grants to Libraries 1,598280 292 Island Archive Service 301
1,072 1,115 Museums Service 1,093
2,922 2,980 2,992
7,288 7,657 School and Pupil Support Services 7,575Schools
4,663 4,494 Grants to Colleges 4,389‐ 226 Pre‐School 1,723
14,975 15,032 Primary Schools 15,075697 650 School Music Service 678
19,556 19,334 Secondary Schools 19,5825,580 5,587 Special Schools 5,8501,831 1,780 Voluntary Schools 1,813
47,302 47,103 49,110
419 416 Sports 435‐ ‐ Balance of Budget Reduction (2,431)
78,082 78,504 77,445
‐ (100) Financial Transformation Programme Target ‐
78,082 78,404 77,445
1,766 1,149 Miscellaneous Capital Works 55413 ‐ IT Projects and Equipment ‐ 287 225 Equipment, Machinery and Vehicles ‐
2,066 1,374 554
‐ (249) Use of Accumulated Capital Allocation (154)
2,066 1,125 400
Net Expenditure by Service Area
Net Expenditure by Service Area
Routine Capital Expenditure
Net Routine Capital Expenditure
98

2015 2016 2017
ActualOriginal
BudgetBudget
£'000s £'000s £'000s
48 17 20
Non Formula‐Led Expenditure
3,687 3,899 Pay costs 3,882
Non Pay costs20 27 Staff Non Pay costs 35749 848 Support Services 802
6,356 5,970 Premises 5,764616 674 Third Party Payments 72736 37 Transport 3798 154 Supplies & Services 138
7,875 7,710 7,503
11,514 11,592 Non Formula‐Led Expenditure by Category 11,365
Formula‐Led Expenditure
56,061 58,025 Third Party Payments 51,515
2,175 2,580 Supplies & Services 2,525
58,236 60,605 Formula‐Led Expenditure by Category 54,040
69,750 72,197 65,405
Net Expenditure by Category
Total Net Expenditure by Category
Operating Income
COMMITTEE for EMPLOYMENT &
SOCIAL SECURITY
99

2015 2016 2017
ActualOriginal
BudgetBudget
£'000s £'000s £'000s
Non Formula‐Led Expenditure by Service Area
1,589 1,780 Administration of Social Security and Legal Aid 1,736299 317 Benefits and Allowances 411
1,003 1,108 Central Services 1,06922 51 Disability and Inclusion 51
249 319 Employment Relations Service 301330 393 Health and Safety Executive 391829 798 Housing Strategy and Planning 758
6,643 6,233 Social Housing Buildings Maintenance 6,027550 593 Social Housing Tenancy Management 621
11,514 11,592 Net Non Formula‐Led Expenditure by Service Area 11,365
Formula‐Led Expenditure
Legal Aid1,358 1,696 Civil Legal Aid 1,655817 884 Criminal Legal Aid 870
2,175 2,580 2,525
624 575 Concessionary TV Licences for the Elderly 5859,824 9,850 Family Allowance 8,2304,577 4,680 Health Service Grant ‐ 5,072 5,300 Severe Disability Benefit and Carers' Allowances 5,51015,018 15,410 Social Insurance Grant 15,55520,946 22,210 Supplementary Benefit 21,635
58,236 60,605 Formula‐Led Expenditure by Service Area 54,040
69,750 72,197 65,405
14 13 Equipment, Machinery and Vehicles 28
‐ (13) Use of Accumulated Capital Allocation (28)
14 ‐ ‐
Net Expenditure by Service Area
Total Net Expenditure by Service Area
COMMITTEE for EMPLOYMENT &
SOCIAL SECURITY
Routine Capital Expenditure
Net Routine Capital Expenditure
100
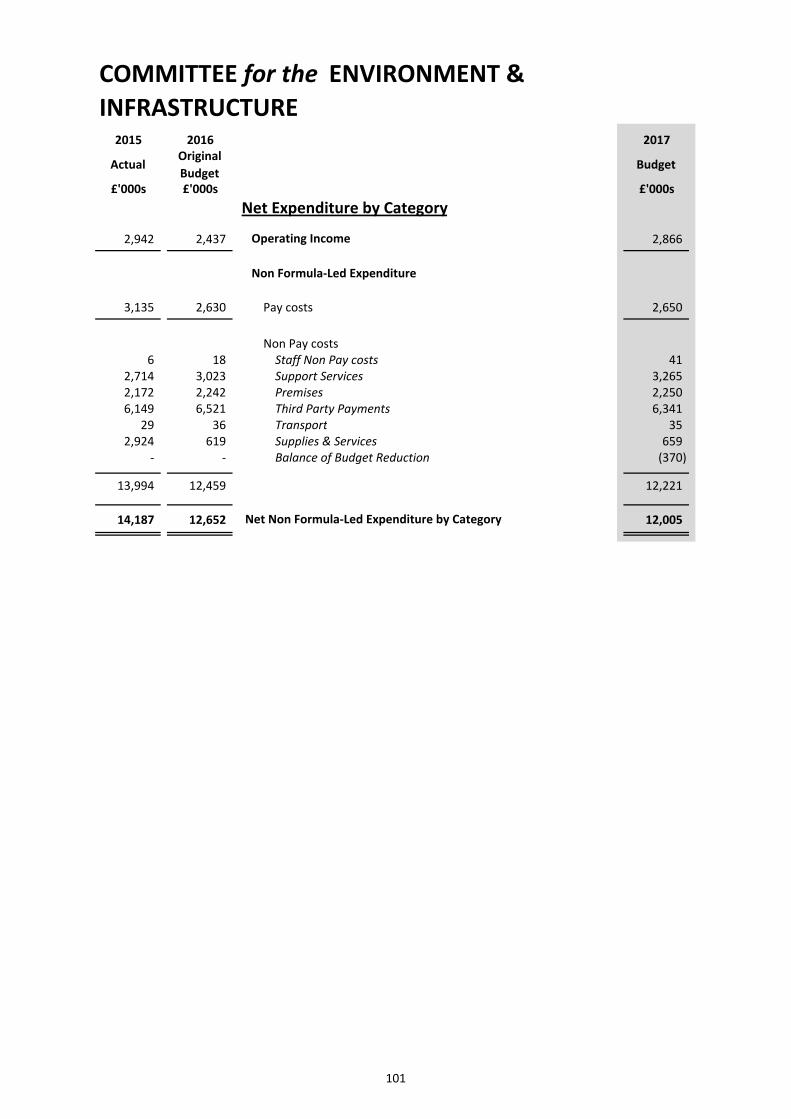
2015 2016 2017
ActualOriginal
BudgetBudget
£'000s £'000s £'000s
2,942 2,437 2,866
Non Formula‐Led Expenditure
3,135 2,630 Pay costs 2,650
Non Pay costs6 18 Staff Non Pay costs 41
2,714 3,023 Support Services 3,2652,172 2,242 Premises 2,2506,149 6,521 Third Party Payments 6,341
29 36 Transport 352,924 619 Supplies & Services 659
‐ ‐ Balance of Budget Reduction (370)
13,994 12,459 12,221
14,187 12,652 12,005
COMMITTEE for the ENVIRONMENT &
INFRASTRUCTURE
Net Expenditure by Category
Operating Income
Net Non Formula‐Led Expenditure by Category
101

2015 2016 2017
ActualOriginal
BudgetBudget
£'000s £'000s £'000s
880 332 Central Services 33881 100 Alderney Breakwater 82
Environmental Services2,532 2,440 Agriculture and Veterinary Services 2,226933 853 Coastal Services 872871 893 Parks, Gardens and Nature Trails 912242 354 Other Environmental Services 453
4,578 4,540 4,463
Roads and Transport162 353 Integrated Transport Strategy 475179 399 Licensing and Traffic Services 423
4,069 4,899 Passenger Transport 4,5624,238 2,029 Roads* 2,032
8,648 7,680 7,492
‐ ‐ Balance of Budget Reduction (370)
14,187 12,652 12,005
512 3,351 Miscellaneous Capital Works 3,542‐ 66 IT Projects and Equipment ‐ 5 215 Equipment, Machinery and Vehicles 17
517 3,632 3,559
‐ (182) Use of Accumulated Capital Allocation (384)
517 3,450 3,175
Note: * With effect from 2016 roads' resurfacing and reconstruction is funded through routine
capital allocation instead of revenue expenditure.
Net Expenditure by Service Area
Routine Capital Expenditure
Net Routine Capital Expenditure
Net Expenditure by Service Area
COMMITTEE for the ENVIRONMENT &
INFRASTRUCTURE
102

COMMITTEE for HEALTH & SOCIAL CARE2015 2016 2017
ActualOriginal
BudgetBudget
£'000s £'000s £'000s
12,364 11,686 14,788
Non Formula‐Led Expenditure
84,879 83,331 Pay costs 89,121
Non Pay costs452 727 Staff Non Pay costs 769
4,481 4,355 Support Services 4,1995,516 6,052 Premises 5,7433,583 3,402 Third Party Payments 3,301556 700 Transport 597
31,479 31,161 Supplies & Services 31,158
46,067 46,397 45,767
118,582 118,042 120,100
‐ (1,900) Financial Transformation Programme Target ‐
118,582 116,142 120,100
Net Expenditure by Category
Operating Income
Net Non Formula‐Led Expenditure by Category
103

COMMITTEE for HEALTH & SOCIAL CARE2015 2016 2017
ActualOriginal
BudgetBudget
£'000s £'000s £'000s
Central Services1,041 1,209 Clinical Governance 1,3691,778 1,460 Contract Management 69911,720 12,586 Estates & Facilities 12,603
880 985 Procurement 1,007436 610 Recruitment & Retention 612
1,809 1,562 Strategy, Policy & Engagement 1,6842,417 2,796 Systems & Performance 2,983
20,081 21,208 20,957
Acute Services29,496 28,185 Acute Hospital Services 29,0439,195 7,888 Acute Off Islands Treatment 8,9241,525 1,023 Health Care Management 1,0401,586 1,671 Institute of Health and Social Care Studies 1,7822,643 2,582 St John Ambulance & Rescue 2,486
44,445 41,349 43,275
Community Services11,265 11,371 Adult Services 12,21910,837 11,425 Childrens Services 11,4948,377 8,990 Complex Placements 7,891
40 281 Social Care Management 40520,333 19,526 Specialist Services 20,028
50,852 51,593 52,037
Public Health & Strategy1,399 1,468 Community Health & Wellbeing 1,519851 1,151 Medical Public Health 963362 474 Public Health Management 542
2,612 3,093 3,024
592 799 Office of the Children's Convenor 807
118,582 118,042 120,100
‐ (1,900) Efficiency Target ‐
118,582 116,142 120,100
Routine Capital Expenditure
1,033 226 Miscellaneous Capital Works 105193 347 IT Projects and Equipment 353
1,731 1,196 Equipment, Machinery and Vehicles 741
2,957 1,769 1,199
‐ (144) Use of Accumulated Capital Allocation (449)
2,957 1,625 750
Net Expenditure by Service Area
Net Routine Capital Expenditure
Net Expenditure by Service Area
104

COMMITTEE for HOME AFFAIRS2015 2016 2017
ActualOriginal
BudgetBudget
£'000s £'000s £'000s
2,400 2,229 2,343
Non Formula‐Led Expenditure
28,342 28,185 Pay costs 27,813
Non Pay costs670 706 Staff Non Pay costs 676
2,872 3,099 Support Services 3,0181,613 1,638 Premises 1,525100 143 Third Party Payments 99225 243 Transport 236
1,637 1,688 Supplies & Services 1,608‐ ‐ Balance of Budget Reduction (572)
7,117 7,517 6,590
33,059 33,473 32,060
‐ (25) Financial Transformation Programme Target ‐
‐ (622) Budget Submission in Excess of Cash Limit ‐
33,059 32,826 32,060
Net Expenditure by Category
Operating Income
Net Non Formula‐Led Expenditure by Category
105

COMMITTEE for HOME AFFAIRS2015 2016 2017
ActualOriginal
BudgetBudget
£'000s £'000s £'000s
2,200 2,378 Administration and Central Services 2,160363 412 Bailiwick Drug and Alcohol Strategy 38292 118 Data Protection 116390 383 Domestic Abuse Strategy 427148 147 Emergency Planning 145(19) (19) Gambling Control (22)
3,889 3,848 Guernsey Fire and Rescue Service 3,734(44) 147 Housing Control 95743 680 Joint Emergency Services Control Centre 684
18,473 18,461 Law Enforcement 18,0385,285 5,417 Prison Service 5,4401,539 1,501 Probation Service 1,433
‐ ‐ Balance of Budget Reduction (572)
33,059 33,473 32,060
‐ (25) Financial Transformation Programme Target ‐
‐ (622) Budget Submission in Excess of Cash Limit ‐
33,059 32,826 32,060
398 307 Miscellaneous Capital Works 56251 101 IT Projects and Equipment 303337 200 Equipment, Machinery and Vehicles 281
986 608 640
‐ (208) Use of Accumulated Capital Allocation (340)
986 400 300
Net Expenditure by Service Area
Net Expenditure by Service Area
Routine Capital Expenditure
Net Routine Capital Expenditure
106

SCRUTINY MANAGEMENT COMMITTEE2015 2016 2017
ActualOriginal
BudgetBudget
£'000s £'000s £'000s
Non Formula‐Led Expenditure
394 420 Pay costs 415
Non Pay costs2 14 Staff Non Pay costs 1063 104 Support Services 102‐ 1 Premises 19 31 Supplies & Services 25
74 150 138
468 570 553
STATES' REVIEW COMMITTEE
ActualOriginal
BudgetBudget
£'000s £'000s £'000s
Non Formula‐Led Expenditure
11 ‐ Pay costs ‐
Non Pay costs1 ‐ Support Services ‐ 5 ‐ Supplies & Services ‐
6 ‐ ‐
17 ‐ ‐
Net Non Formula‐Led Expenditure by Category
Net Expenditure by Category
Net Non Formula‐Led Expenditure by Category
Net Expenditure by Category
107

DEVELOPMENT & PLANNING AUTHORITY2015 2016 2017
ActualOriginal
BudgetBudget
£'000s £'000s £'000s
1,089 1,094 1,075
Non Formula‐Led Expenditure
2,314 2,318 Pay costs 2,307
Non Pay costs70 83 Staff Non Pay costs 86135 175 Support Services 1641 1 Premises 118 22 Transport 2210 15 Supplies & Services 15‐ ‐ Balance of Budget Reduction (45)
234 296 243
1,459 1,520 1,475
108 136 Central Services 140 130 112 Building Control 150158 160 Planning Control 178473 522 Planning Support 464590 590 Policy & Conservation 588
‐ ‐ Balance of Budget Reduction (45)
1,459 1,520 1,475
Net Expenditure by Category
Operating Income
Net Non Formula‐Led Expenditure by Category
Net Expenditure by Service Area
Net Expenditure by Service Area
108

OVERSEAS AID & DEVELOPMENT COMMISSION2015 2016 2017
ActualOriginal
BudgetBudget
£'000s £'000s £'000s
Non Formula‐Led Expenditure
Non Pay costs2,855 2,885 Third Party Payments 2,915
2,855 2,885 Total Net Expenditure by Category 2,915
Non Formula‐Led Expenditure
2,655 2,685 Overseas Aid Grants 2,715200 200 Emergency Disaster Relief 200
2,855 2,885 2,915 Net Expenditure by Service Area
Net Expenditure by Service Area
Net Expenditure by Category
109
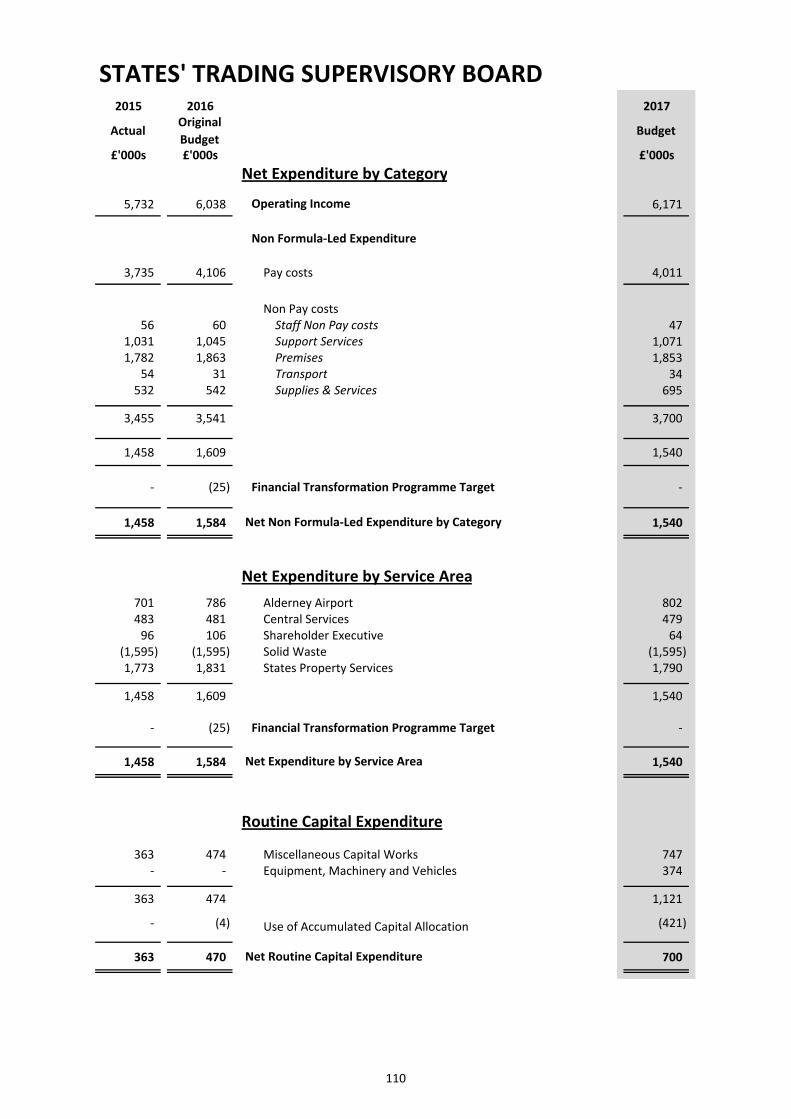
STATES' TRADING SUPERVISORY BOARD2015 2016 2017
ActualOriginal
BudgetBudget
£'000s £'000s £'000s
5,732 6,038 6,171
Non Formula‐Led Expenditure
3,735 4,106 Pay costs 4,011
Non Pay costs56 60 Staff Non Pay costs 47
1,031 1,045 Support Services 1,0711,782 1,863 Premises 1,853
54 31 Transport 34532 542 Supplies & Services 695
3,455 3,541 3,700
1,458 1,609 1,540
‐ (25) Financial Transformation Programme Target ‐
1,458 1,584 1,540
701 786 Alderney Airport 802483 481 Central Services 47996 106 Shareholder Executive 64
(1,595) (1,595) Solid Waste (1,595)1,773 1,831 States Property Services 1,790
1,458 1,609 1,540
‐ (25) Financial Transformation Programme Target ‐
1,458 1,584 1,540
363 474 Miscellaneous Capital Works 747‐ ‐ Equipment, Machinery and Vehicles 374
363 474 1,121
‐ (4) Use of Accumulated Capital Allocation (421)
363 470 700
Net Non Formula‐Led Expenditure by Category
Net Expenditure by Service Area
Net Expenditure by Service Area
Routine Capital Expenditure
Net Routine Capital Expenditure
Net Expenditure by Category
Operating Income
110

ROYAL COURT2015 2016 2017
ActualOriginal
BudgetBudget
£'000s £'000s £'000s
1,881 1,990 2,026
Non Formula‐Led Expenditure
3,769 3,715 Pay costs 3,675
Non Pay costs3 8 Staff Non Pay costs 9
241 344 Support Services 342192 230 Premises 228
‐ 5 Third Party Payments 55 7 Transport 8
228 221 Supplies & Services 219
669 815 811
2,557 2,540 2,460
821 848 Bailiffs Office 826564 706 Client Services 670
1,015 828 Court Services 807157 158 Parliament 157
2,557 2,540 2,460
197 50 Miscellaneous Capital Works ‐ ‐ 100 IT Projects and Equipment 50‐ 50 Equipment, Machinery and Vehicles 50
197 200 100
‐ ‐ Use of Accumulated Capital Allocation (100)
197 200 ‐
Net Expenditure by Service Area
Net Expenditure by Service Area
Routine Capital Expenditure
Net Routine Capital Expenditure
Net Expenditure by Category
Operating Income
Net Non Formula‐Led Expenditure by Category
111
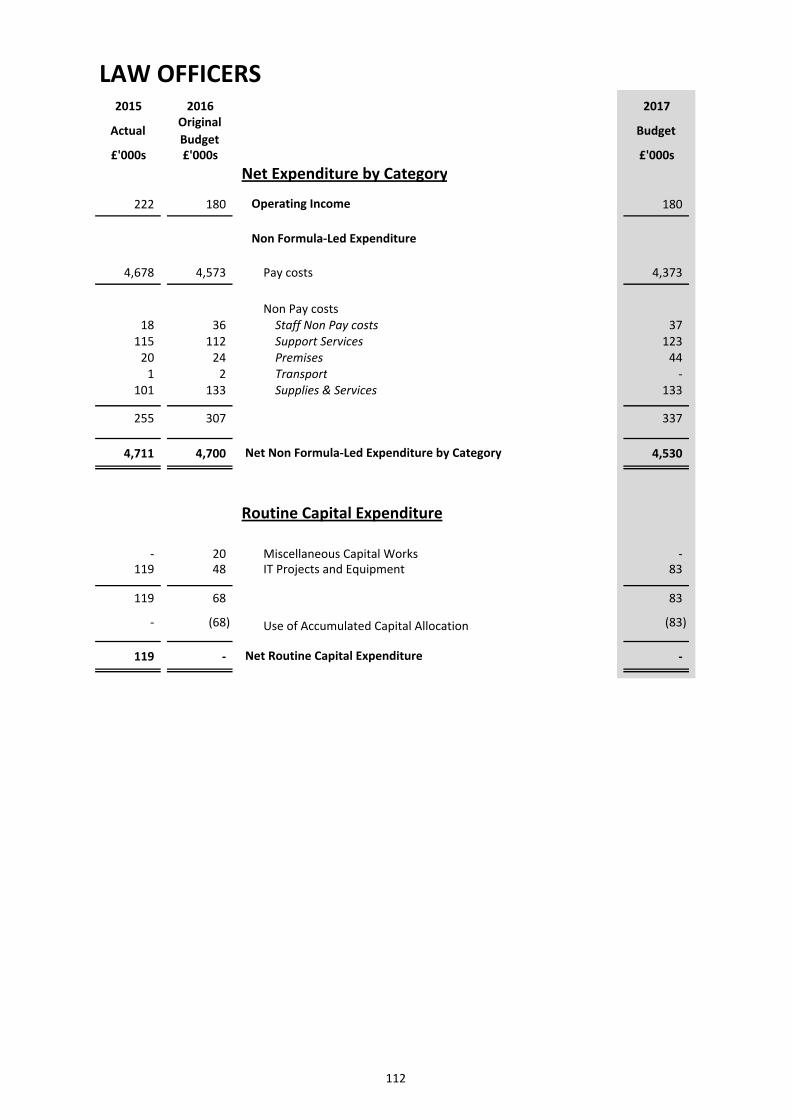
LAW OFFICERS2015 2016 2017
ActualOriginal
BudgetBudget
£'000s £'000s £'000s
222 180 180
Non Formula‐Led Expenditure
4,678 4,573 Pay costs 4,373
Non Pay costs18 36 Staff Non Pay costs 37115 112 Support Services 12320 24 Premises 441 2 Transport ‐
101 133 Supplies & Services 133
255 307 337
4,711 4,700 4,530
‐ 20 Miscellaneous Capital Works ‐ 119 48 IT Projects and Equipment 83
119 68 83
‐ (68) Use of Accumulated Capital Allocation (83)
119 ‐ ‐
Net Expenditure by Category
Operating Income
Net Non Formula‐Led Expenditure by Category
Routine Capital Expenditure
Net Routine Capital Expenditure
112

STATES OF ALDERNEY2015 2016 2017
ActualOriginal
BudgetBudget
£'000s £'000s £'000s
1,354 1,451 1,477
Non Formula‐Led Expenditure
1,673 1,835 Pay costs 1,799
Non Pay costs20 43 Staff Non Pay costs 16636 608 Support Services 570389 436 Premises 523233 180 Third Party Payments 216138 85 Transport 90124 164 Supplies & Services 93
1,540 1,516 1,508
‐ (20) Efficiency Target ‐
1,859 1,880 1,830
Note:
19 October 2016 meeting of the States of Alderney.
Net Expenditure by Category
The Budget for the States of Alderney for 2017 will be considered at the
Operating Income
Net Non Formula‐Led Expenditure by Category
113

CORPORATE HOUSING PROGRAMME FUND2015 2016 2016 2017
ActualOriginal
Budget
Probable
OutturnBudget
£'000s £'000s £'000s £'000s
Income and Expenditure by Category
Income128 250 544 Sale of Incompatible Housing Stock ‐
128 250 544 ‐
Expenditure
Non Pay Costs(539) (500) (600) Premises (885)
(3,935) (15,650) (4,740) Third Party Payments (3,279)
(4,474) (16,150) (5,340) (4,164)
(4,346) (15,900) (4,796) (4,164)
128 250 544 Sale of Incompatible Housing Stock ‐ (539) (500) (600) Modernisation (885)
Corporate Initiatives & Strategies(2,110) (650) (650) Older People Housing & Support ‐ (1,825) (15,000) (3,540) Social Housing Development Programme (1,841)
‐ ‐ (550) SupportedLiving (1,438)
(3,935) (15,650) (4,740) (3,279)
(4,346) (15,900) (4,796) (4,164)
58,129 30,330 33,783 Balance of Fund at 1st January 28,987(20,000) ‐ ‐ Transfer to Capital Reserve ‐ (4,346) (15,900) (4,796) Net (Deficit) for the year (4,164)
33,783 14,430 28,987 24,823
Net (Deficit) for the year
Balance of Fund at 31st December
Total Income
Net (Deficit) for the year
Net Income / (Expenditure)
by Service Area
114

SOLID WASTE TRADING ACCOUNT2015 2016 2016 2017
ActualOriginal
Budget
Probable
OutturnBudget
£'000s £'000s £'000s £'000s
Net Income by Category
Income
6,315 7,256 6,389 Operating Income 6,51924 30 2 Investment Return ‐
6,339 7,286 6,391 Total Income 6,519
Expenditure
(456) (550) (372) Pay Costs (333)(4) ‐ (5) Staff Non‐Pay Costs (6)
(4,444) (5,612) (5,028) Support Services (4,985)(46) ‐ (125) Premises (127)
‐ ‐ (1) Transport (1)(312) (477) (358) Supplies & Services (425)
(5,262) (6,639) (5,887) Total Expenditure (5,877)
1,077 647 503 Net Surplus for the Year 642
3,344 1,618 3,711 Balance at 1 January 2,619 1,077 647 503 Net Surplus for the year 642 885 ‐ ‐ Adjustment for Capital Expenditure (2015 and earlier) ‐
(1,595) (1,595) (1,595) Transfer to General Revenue (1,595)
3,711 670 2,619 Balance at 31 December 1,666
Capital Expenditure
1,385 ‐ ‐ Miscellaneous Capital Works ‐ ‐ ‐ ‐ IT Projects and Equipment 40‐ 187 187 Equipment, Machinery and Vehicles 50
1,385 187 187 90
(1,385) (187) (187) Loans from General Revenue for Capital Expenditure (90)
‐ ‐ ‐ Total Capital Expenditure for the Financial Year ‐
115

2015 2016 2016 2017
ActualOriginal
Budget
Probable
OutturnBudget
£'000s £'000s £'000s £'000s
Net Income by Category
Income
9,945 10,253 10,066 Operating Income 10,093
Expenditure
(460) (472) (391) Pay costs (401)
Non Pay costs(5) (21) (7) Staff Non Pay costs (15)
(246) (386) (377) Support Services (439)(124) (146) (136) Premises (147)(18) (38) (23) Supplies & Services (41)
(393) (591) (543) (642)
9,092 9,190 9,132 9,050
Company Registry9,815 10,121 9,919 Income 9,946(814) (996) (873) Expenditure (966)
9,001 9,125 9,046 8,980
Intellectual Property Office130 132 147 Income 147(39) (67) (61) Expenditure (77)
91 65 86 70
9,092 9,190 9,132 9,050
Surplus transferred to General Revenue
Surplus transferred to General Revenue
GUERNSEY REGISTRY
Net Income / (Expenditure)
by Service Area
116

GUERNSEY AIRPORT2015 2016 2016 2017
ActualOriginal
Budget
Probable
OutturnBudget
£'000s £'000s £'000s £'000s
11,916 12,156 12,258 Operating Income 12,451
(7,024) (6,595) (7,104) Pay costs (6,993)
Non Pay costs(187) (230) (233) Staff Non Pay costs (247)
(5,224) (1,479) (3,193) Support Services (1,131)(1,464) (1,186) (1,575) Premises (1,270)
(22) (31) (60) Transport (38)(1,851) (2,069) (2,113) Supplies & Services (2,192)
(8,748) (4,995) (7,174) (4,878)
(3,856) 566 (2,020) 580
(1,475) (1,278) (1,278) (1,234)
(5,331) (712) (3,298) (654)
Income392 440 393 Advertising, picketing etc 388769 770 786 Airport Development Charge 782734 750 726 Car Parking Fees 790
1,927 1,995 1,973 Rents 1,9547,920 8,024 8,202 Traffic Receipts 8,357
11,742 11,979 12,080 12,271
Operational Expenditure(1,093) (1,067) (1,121) Administration (1,030)(2,190) (1,884) (2,180) Aerodrome Fire Service (2,098)(7,076) (2,884) (5,097) Airport Infrastructure (2,627)(1,552) (1,851) (1,895) Airport Security (2,015)(3,861) (3,905) (3,985) Navigational Services (4,101)
(15,772) (11,591) (14,278) (11,871)
174 178 178 Recovery From Alderney Airport 180
(3,856) 566 (2,020) 580
(1,475) (1,278) (1,278) Depreciation (1,234)
(5,331) (712) (3,298) (654)
Operating (Deficit) after depreciation
Operating Surplus / (Deficit) before depreciation
Operating (Deficit) after depreciation
Net Expenditure by Category
Depreciation
Net Income / (Expenditure)
by Service Area
Operating Surplus / (Deficit) before depreciation
117

GUERNSEY AIRPORT2015 2016 2016 2017
ActualOriginal
Budget
Probable
OutturnBudget
£'000s £'000s £'000s £'000s
‐ (400) (206) Miscellaneous Capital Works (1,770)(163) (1,818) (281) Equipment, Machinery and Vehicles (925)
(163) (2,218) (487) Routine Capital Expenditure (2,695)
(492) (500) ‐ Airport Pavements Project ‐
(126) (131) ‐ Airport Radar ‐ 618 631 ‐ ‐
(163) (2,218) (487) Net Capital Expenditure (2,695)
HARBOURS2015 2016 2016 2017
ActualOriginal
Budget
Probable
OutturnBudget
£'000s £'000s £'000s £'000s
9,057 9,255 8,843 Operating Income 8,914
(3,803) (3,726) (3,409) Pay costs (3,435)
Non Pay costs(175) (179) (128) Staff Non Pay costs (189)(34) ‐ 44 Peripheral Activities ‐ (786) (828) (898) Support Services (883)
(1,493) (2,216) (1,445) Premises (1,549)(82) (105) (91) Transport (139)
(384) (224) (373) Supplies & Services (358)
(2,954) (3,552) (2,891) (3,118)
2,300 1,977 2,543 2,361
(1,035) (1,270) (1,270) (1,321)
1,265 707 1,273 1,040
Transfer from Capital Reserve
Capital Expenditure
Net Expenditure by Category
Depreciation
Operating Surplus before depreciation
Operating Surplus after depreciation
118

HARBOURS2015 2016 2016 2017
ActualOriginal
Budget
Probable
OutturnBudget
£'000s £'000s £'000s £'000s
3,354 3,202 3,233 Commercial Port Operations 3,006(394) (408) (182) Property (111)487 160 768 Leisure 851
(1,124) (959) (1,259) Non‐Commercial Port Operations (1,358)(22) (18) (18) Ships Registry (27)
2,300 1,977 2,543 Operating Surplus before Depreciation 2,361
(1,035) (1,270) (1,270) Depreciation (1,321)
1,265 707 1,273 1,040
(1,087) (1,900) (650) Miscellaneous Capital Works (2,650)(20) (450) (130) IT Projects and Equipment (250)(187) (2,040) (20) Equipment, Machinery, Vehicles and Vessels (1,100)
(1,294) (4,390) (800) Routine Capital Expenditure (4,000)
(900) (190) ‐ Crane Strategy ‐ ‐ (1,150) ‐ Deep Water Berth Investigations ‐
900 1,340 ‐ ‐
(1,294) (4,390) (800) Net Capital Expenditure (4,000)
Capital Expenditure
Less transfer from Capital Reserve
Net Income / (Expenditure)
by Service Area
Operating Surplus after Depreciation
119

PORTS HOLDING ACCOUNT
2015 2016 2016 2017
ActualOriginal
Budget
Probable
OutturnBudget
£'000s £'000s £'000s £'000s
Operating Surplus / (Deficit) before depreciation(3,856) 566 (2,020) Guernsey Airport 5802,300 1,977 2,543 Harbours 2,361
(1,556) 2,543 523 2,941
24 20 (26) Investment Return ‐
Capital Expenditure(163) (2,218) (487) Guernsey Airport (2,695)
(1,294) (4,390) (800) Harbours (4,000)‐ ‐ 700 Asset disposal ‐
(1,457) (6,608) (587) (6,695)
(2,989) (4,045) (90) (Deficit) before depreciation (3,754)
(2,510) (2,548) (2,548) Depreciation (2,555)
(5,499) (6,593) (2,638) (Deficit) for the year (6,309)
6,023 4,045 3,034 Balance at 1st January 2,944(2,989) (4,045) (90) (Deficit) for the year before depreciation (3,754)
3,034 ‐ 2,944 Balance at 31st December (810)
120

GUERNSEY WATER2015 2016 2016 2017
ActualOriginal
Budget
Probable
OutturnBudget
£'000s £'000s £'000s £'000s
Income
Water Supplies6,934 7,286 7,125 Measured 7,2713,655 3,630 3,565 Unmeasured 3,569
Waste Water2,127 2,220 2,151 Measured 2,2021,218 1,246 1,235 Unmeasured 1,2731,059 1,105 1,104 Cesspit Emptying Charges 1,137291 ‐ 547 Grant from General Revenue 549
439 250 300 333
15,723 15,737 16,027 16,334
Expenditure
Operating Expenses(317) (449) (445) (432)
(1,197) (1,244) (1,236) (1,314)(3,366) (3,508) (3,409) (3,440)(559) (539) (625) Water distribution (579)
(2,158) (2,065) (1,958) Water production (2,019)
Management Expenses(632) (763) (722) Compliance (611)(648) (559) (782) Customer services (694)(674) (1,205) (990) Management and general (1,198)
(1,129) (1,190) (1,145) Support Services (912)
(10,680) (11,522) (11,312) (11,199)
5,043 4,215 4,715 Operating Surplus before depreciation 5,135
(4,156) (3,970) (4,321) Depreciation (4,412)
‐ ‐ (30) Loss on disposal of fixed assets (75)
887 245 364 Operating Surplus for the year 648
61 200 40 Net Interest receivable 40
948 445 404 Surplus for the year 688
(154) ‐ ‐ Transfer to reserve for property renewal ‐
794 445 404 688
Asset Management
Net Income by Service Area
Surplus on other trading activities before management
expenses and depreciation
Pumping StationsSewers
Retained Surplus for the year transferred to Revenue
Account Reserve
121

GUERNSEY WATER2015 2016 2016 2017
ActualOriginal
Budget
Probable
OutturnBudget
£'000s £'000s £'000s £'000s
(17,946) (1,000) (600) Belle Greve Wastewater Disposal Facility ‐ (1,381) (350) (200) Demand Management (300)(189) (330) (280) Management and General ‐ Operational (360)(998) (1,600) (1,600) Pumping Stations (1,600)(257) (590) (150) Quality ‐ Environmental Protection (365)
(1,329) (1,360) (1,450) Sewers (1,338)(438) (460) (460) Water distribution (479)(414) (819) (819) Water resources (749)(490) (750) (450) Water treatment (1,015)
(23,442) (7,259) (6,009) Gross Capital Investment (6,206)
‐ 58 ‐ Customer contributions and asset sales ‐ 17,946 1,000 600 Transfer from General Revenue ‐
(5,496) (6,201) (5,409) Net Capital Investment (6,206)
Capital Expenditure
122

STATES WORKS2015 2016 2016 2017
ActualOriginal
Budget
Probable
OutturnBudget
£'000s £'000s £'000s £'000s
Income
221 81 92 Administration 44105 109 69 Building Maintenance ‐
2,079 1,963 2,180 Cleansing and Refuse 2,239314 356 310 Drainage 311
1,240 1,056 1,150 Electrical and Mechanical 1,155103 102 113 Emergency Services 105702 718 695 Fleet Services 694
1,744 1,794 1,550 Highway Repairs 1,5582,219 2,284 2,080 Land Management 2,0903,278 3,106 3,272 Landfill and Recycling 3,390222 208 208 Management Services 205
2,401 2,432 2,420 Sewage Collection 2,380432 406 406 Signs and Lines 408488 420 420 Stores 422
15,548 15,035 14,965 15,001
Expenditure
Management Expenses(430) (556) (559) Administration Expenses (556)(204) (168) (202) Building maintenance (203)
(1,494) (1,666) (1,611) Salaries, wages and superannuation (1,595)
Operating Expenses
(7,102) (7,174) (7,024) Labour (7,008)(4,046) (3,475) (3,736) Materials (3,721)(365) (354) (320) Transport and plant (322)
(13,641) (13,393) (13,452) (13,405)
1,907 1,642 1,513 1,596
(891) (1,134) (993) Depreciation (1,246)
1,016 508 520 Operating Surplus for the year 350
60 70 12 Net Interest Receivable 12
1,076 578 532 Surplus for the year 362
(9) (112) (12) Office Equipment (161)(134) (360) (335) Site Developments (200)
(1,468) (1,333) (1,963) Vehicles, Plant, Tools and Equipment (1,402)
(1,611) (1,805) (2,310) (1,763)
Operating Surplus before depreciation
Total Capital Expenditure for the Financial year
Capital Expenditure
Net Income by Service Area
123

GUERNSEY DAIRY2015 2016 2016 2017
ActualOriginal
Budget
Probable
OutturnBudget
£'000s £'000s £'000s £'000s
Net Income by Service Area
Sales1,552 1,466 1,497 Dairy products 1,6965,657 5,735 5,842 Liquid Milk 5,926
35 25 25 Sundry income 24
7,244 7,226 7,364 Total Income 7,646
Cost of Sales(44) (36) (40) Dairy product ingredients (50)
(3,654) (3,680) (3,802) Milk (3,975)(111) (110) (116) Milk working loss (120)(72) (72) (72) Freight (72)
(544) (461) (461) Packaging materials (500)(884) (862) (890) Production wages (885)
(5,309) (5,221) (5,381) (5,602)
Expenses(89) (127) (90) Advertising and promotion (90)(64) (67) (67) Cleaning materials (65)(288) (309) (300) Fuel, light, power, water and rates (290)(46) (38) (50) General administration costs (40)(99) (94) (94) Laboratory expenses (100)(26) (36) (31) Motor vehicle expenses (30)(38) (57) (50) Other expenses (50)(185) (147) (181) Professional fees (340)(181) (154) (204) Repairs, maintenance and insurance (165)(612) (584) (564) Salaries and wages (585)
(1,628) (1,613) (1,631) (1,755)
(6,937) (6,834) (7,012) Total Expenditure (7,357)
307 392 352 Operating Surplus before depreciation, 289interest and exceptional item
‐ ‐ (750) Exceptional items ‐ (204) (256) (235) Depreciation/impairment of assets (258)
103 136 (633) Operating Surplus/(Deficit) for the year 31
30 117 30 Net Interest receivable 10
133 253 (603) Surplus/(Deficit) for the year 41
Capital Expenditure
(30) (30) (120) Miscellaneous Capital Works (250)(8) ‐ ‐ IT Projects and Equipment ‐
(160) (1,112) (1,112) Equipment, Machinery and Vehicles (250)
(198) (1,142) (1,232) Total Capital Expenditure for the Financial Year (500)
124

STATES CAPITAL INVESTMENT PORTFOLIO ‐
OPERATING COSTS2015 2016 2016 2017
ActualOriginal
Budget
Probable
OutturnBudget
£'000s £'000s £'000s £'000s
Pay costs460 778 480 Established Staff 775
460 778 480 775
Non Pay costs3 57 3 Staff Non Pay costs 6535 32 29 Support Services 322 5 1 Supplies & Services 5
40 94 33 102
500 872 513 877 Total Expenditure by Category
Net Expenditure by Category
125

SUPERANNUATION FUND ADMINISTRATION2015 2016 2016 2017
ActualOriginal
Budget
Probable
OutturnBudget
£'000s £'000s £'000s £'000s
Pay costs378 461 452 Established Staff 457
378 461 452 457
Non Pay costs393 173 299 Consultants Fees 291 147 69 69 Support Services 74
540 242 368 365
918 703 820 822
‐ ‐ 130 ICT System 70
‐ ‐ 130 70 Routine Capital Expenditure
Total Expenditure by Category
Net Expenditure by Category
Capital Expenditure
126

CONTRIBUTORY FUNDS 2015 2016 2016 2017
ActualOriginal
Budget
Probable
OutturnBudget
£'000s £'000s £'000s £'000s
Income157,203 161,040 159,848 Contribution Income 172,08119,595 20,090 19,921 States Grants 15,557
176,798 181,130 179,769 187,638
Benefit Expenditure(129,809) (134,590) (135,098) Social Insurance (140,602)(39,767) (42,408) (41,189) Health Insurance (41,973)(17,913) (18,325) (18,225) Long‐term Care Insurance (19,510)
(187,489) (195,323) (194,512) (202,085)
Administration(4,163) (4,673) (4,549) Pay Costs (4,592)
(35) (20) (21) Staff Non Pay costs (23)(1,911) (2,100) (2,040) Support Services (1,935)
(72) (74) (71) Premises (65)(176) (180) (180) Supplies & Services (193)
(6,357) (7,047) (6,861) (6,808)
(177) (130) (121) Depreciation (114)
(17,225) (21,370) (21,725) (21,369)
(19,330) (21,558) (22,956) Guernsey Insurance Fund (24,139)1,377 (379) 513 Guernsey Health Service Fund (4,260)728 567 718 Long‐term Care Insurance Fund 7,030
(17,225) (21,370) (21,725) (21,369)
‐ (20) (10) Miscellaneous Capital Works (20)‐ (125) (15) Equipment, Machinery and Vehicles (225)‐ (250) (100) IT Projects and Equipment (200)
‐ (395) (125) (445)
COMMITTEE for EMPLOYMENT & SOCIAL SECURITY
Net Income / (Expenditure)
by Category
Operating Deficit Before Investing Activities
Net Income / (Expenditure)
by Service Area
Operating Deficit Before Investing Activities
Routine Capital Expenditure
Net Routine Capital Expenditure
127

THE LADIES COLLEGE (Senior School)
2014/2015 2015/2016 2016/2017
Actual Budget Budget
£'000s £'000s £'000s
Income2,072 2,064 Fees 2,155
62 28 Miscellaneous Income 27 1,922 1,897 States Grant 1,818
4,056 3,989 4,000
Expenditure8 12 8 6 6 Audit Fee 8
103 112 Books and Stationery 113 ‐ ‐ Depreciation 167
54 60 Examination Fees 60 50 69 Fixed Asset Acquisition Costs 44 37 42 General Administrative Expenses 52 12 14 Laboratory and Design and Technology Expenses 14
174 184 Maintenance of Buildings, Grounds and Equipment 184 16 21 Marketing and Development Expenses 22 19 30 Rates, Taxes and Insurance 25 56 31 Recruitment and Relocation 36
2,995 3,157 Salaries and Wages 3,220 27 37 Sports, conferences, field trips etc. 40 10 15 Staff training 15 72 87 Utilities 87
3,639 3,877 4,095
417 112 Revenue Surplus / (Deficit) for the year (95)
551 500 Fundraising donations received 200
‐ ‐ Bank Interest payable (42)
1,418 2,386 Balance b/f from previous year 2,998
2,386 2,998 Balance c/f to next year 3,061
Art
Net Income by Category
128