Embed Size (px)
Citation preview
Safety Science 63 (2014) 8–17
Contents lists available at ScienceDirect
Safety Science
journal homepage: www.elsevier .com/locate /ssc i
A probabilistic approach for safety risk analysis in metro construction
0925-7535/$ - see front matter � 2013 Elsevier Ltd. All rights reserved.http://dx.doi.org/10.1016/j.ssci.2013.10.016
⇑ Corresponding author at: School of Civil Engineering & Mechanics, HuazhongUniversity of Science and Technology, Wuhan, Hubei 430074, China.
E-mail address: [email protected] (X. Wu).
Limao Zhang a,b, Miroslaw J. Skibniewski b,c, Xianguo Wu a,⇑, Yueqing Chen a, Qianli Deng b
a School of Civil Engineering & Mechanics, Huazhong University of Science and Technology, Wuhan, Hubei 430074, Chinab Department of Civil & Environmental Engineering, University of Maryland, College Park, MD 20742-3021, USAc Institute of Theoretical and Applied Informatics, Polish Academy of Sciences, Poland
a r t i c l e i n f o a b s t r a c t
Article history:Received 15 March 2013Received in revised form 19 October 2013Accepted 22 October 2013Available online 16 November 2013
Keywords:Fuzzy fault tree analysisProbabilistic decision approachMetro constructionComplex environmentsExpert confidence index
This paper presents a probabilistic decision approach for safety risk analysis for metro construction incomplex project environments. An expert confidence index is proposed for the fuzzy probability estima-tion of basic events, aiming to ensure the reliability of collected data during the expert investigation. Anapproach for defuzzification is developed in a precise way based on the representation theorem, attempt-ing to overcome the limitations related to fuzzy linear approximations. A sensitivity analysis technique isutilized to evaluate the percentage contribution of the basic events to the failure of a top-event. A pos-sibility based importance index, fuzzy importance measure, is deployed for the sensitivity analysis of basicevent to reveal the critical basic events for reducing the risk limit. A typical hazard in tunnel cross passageconstruction (TCPC) on the example of Wuhan Yangtze Metro Tunnel construction is presented in a casestudy. The results demonstrate the feasibility of the proposed method and its application potential. Theproposed method can be used as a decision support tool to provide guidelines for safety management inmetro construction, and thus increase the likelihood of a successful project in a complex environment.
� 2013 Elsevier Ltd. All rights reserved.
1. Introduction
In the past ten years, metro construction has presented a pow-erful momentum for rapid economic development worldwide. Ow-ing to various risk factors in complex project environments, safetyviolations occur frequently in metro construction worldwide (AFP,2008; Schexnayder, 2007; Thomas, 2010; Yu, 2012). Obviously,metro construction entails to a highly complicated project withlarge potential risks, which can bring enormous dangers to publicsafety.
Many accidents have led to the growing public concern for apriori Probabilistic Risk Assessment (PRA) in relation to the metroconstruction safety (Abdelgawad and Fayek, 2010). PRA plays animportant role in safety management process, aiming to illustratethe risk factors’ contribution to the occurrence of an accident. Crit-ical potential risks and risk factors can then be identified to helpproject engineers determine the main safety checkpoints in theconstruction phase. There are several methodologies proposed forrisk analysis, such as hazard and operability study (HAZOP), func-tional hazard analysis, failure modes and effect analysis (Pillay andWang, 2003). Most of the traditional methodologies are based onqualitative analysis tools, and are normally used for preparingfeedback for a fault tree analysis (FTA) (Yuhua and Datao, 2005).
FTA is one of the most effective techniques for estimating the fre-quency of occurrence of hazardous events in PRA (Deshpande,2011; Labib and Read, 2013). According to ‘‘Guidelines for Tunnel-ing Risk Management’’ published by the International TunnelingAssociation (ITA) in 2004, FTA was highly recommended as a toolfor risk analysis and assessment (Degn Eskesen et al., 2004). In con-ventional FTA, the occurrence probability of basic events was al-ways regarded as a crisp value. However, in engineering practice,it is difficult or nearly impossible to obtain exact values of proba-bility due to the lack of sufficient data (Mentes and Helvacioglu,2011). Singer (1990) indicated that conventional FTA resulted ininsufficient information concerning the relative frequencies of haz-ardous events in many cases. Therefore, a group decision makingmethod is generally employed to assess the occurrence probabilityof basic events. The uncertainties can then be considered in term ofintervals or fuzzy numbers (Horcik, 2008). Fuzzy arithmetic pro-vides a successful tool to solve engineering problems with uncer-tain parameters (Hanss, 1999). Nowadays, fuzzy numbers arewidely used in engineering applications because of their suitabilityfor representing uncertain information (Boukezzoula et al., 2007).Thus, fuzzy fault tree analysis has experienced rapid developmentrecently.
Metro construction can be regarded as a typical large-scale sys-tem, associated with enormous potential risks to public safety (Shiet al., 2012). Any kind of information loss or calculation errors aretherefore unacceptable for decision support analysis, and therequirement for the precise estimation of failure probabilities is
X1
TE
X2 Xn-1 Xn
OR
Fig. 1. ‘‘OR’’ gate representation in FTA.
X1
TE
X2 Xn-1 Xn
AND
Fig. 2. ‘‘AND’’ gate representation in FTA.
L. Zhang et al. / Safety Science 63 (2014) 8–17 9
in great need in metro engineering practice. In current fuzzy basedprobability analysis, all collected data is entered for decision anal-ysis without any data reliability evaluation, resulting in inaccurateproblems in subsequent computation (Ferdous et al., 2009). Mean-while, the membership functions of the multiplied fuzzy numbershave to be approximated by linear functions at the defuzzificationstage (Mentes and Helvacioglu, 2011). Such fuzzy linear approxi-mation operations are likely to generate considerable informationloss and certain deviations, leading to errors in risk analysis anddecision making (Hanss, 1999). To overcome those limitations, afuzzy decision analysis approach for safety management in metroconstruction in complex environments is proposed in this paper.The expert confidence index is first introduced to ensure the reli-ability of collected data during the expert investigation, with theexpert judgment ability and subjectivity taken into account. Then,an approach for defuzzification is developed based on the repre-sentation theorem. A possibility based importance index, calledfuzzy importance measure, is deployed for the sensitivity analysisof basic events, attempting to reveal the critical basic events soas to reduce the risk limit. Finally, a typical hazard in tunnel crosspassage construction (TCPC) such as one located in the WuhanYangtze Metro Tunnel is used for a case study. The results demon-strate the feasibility of the proposed method, as well as its applica-tion potential.
This paper is organized as follows. The fundamental theoryand the proposed analysis method are introduced in Section 2.Section 3 highlights two steps in the proposed method, namelythe fuzzification and defuzzification processes. Improvementsare presented in response to the limitations of the current ap-proaches. In Section 4, the proposed method is applied to fuzzydecision support in safety management. The conclusions are pre-sented in Section 5.
m-a m m+ba b
u p(x
)
0.8
0.6
0.4
0.2
0
1.0
x
Fig. 3. Membership function of a triangular fuzzy number P�
.
2. Fuzzy decision analysis methodology
2.1. Fault tree analysis
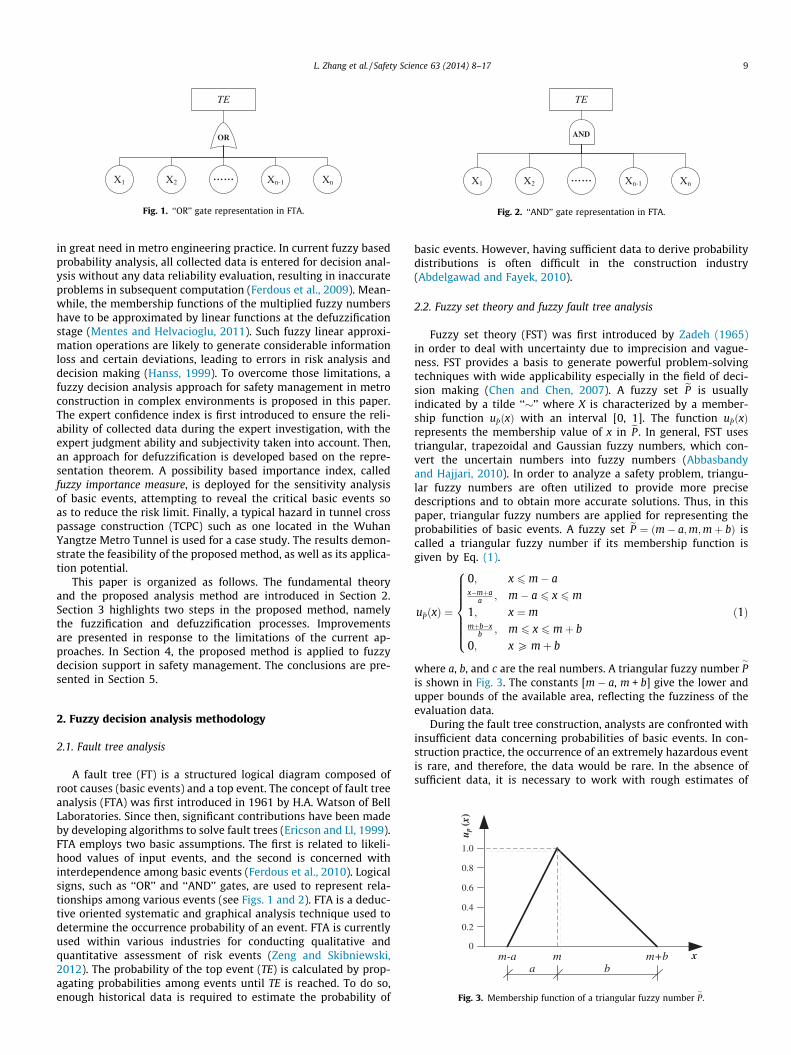
A fault tree (FT) is a structured logical diagram composed ofroot causes (basic events) and a top event. The concept of fault treeanalysis (FTA) was first introduced in 1961 by H.A. Watson of BellLaboratories. Since then, significant contributions have been madeby developing algorithms to solve fault trees (Ericson and Ll, 1999).FTA employs two basic assumptions. The first is related to likeli-hood values of input events, and the second is concerned withinterdependence among basic events (Ferdous et al., 2010). Logicalsigns, such as ‘‘OR’’ and ‘‘AND’’ gates, are used to represent rela-tionships among various events (see Figs. 1 and 2). FTA is a deduc-tive oriented systematic and graphical analysis technique used todetermine the occurrence probability of an event. FTA is currentlyused within various industries for conducting qualitative andquantitative assessment of risk events (Zeng and Skibniewski,2012). The probability of the top event (TE) is calculated by prop-agating probabilities among events until TE is reached. To do so,enough historical data is required to estimate the probability of
basic events. However, having sufficient data to derive probabilitydistributions is often difficult in the construction industry(Abdelgawad and Fayek, 2010).
2.2. Fuzzy set theory and fuzzy fault tree analysis
Fuzzy set theory (FST) was first introduced by Zadeh (1965)in order to deal with uncertainty due to imprecision and vague-ness. FST provides a basis to generate powerful problem-solvingtechniques with wide applicability especially in the field of deci-sion making (Chen and Chen, 2007). A fuzzy set eP is usuallyindicated by a tilde ‘‘�’’ where X is characterized by a member-ship function u~PðxÞ with an interval [0, 1]. The function u~PðxÞrepresents the membership value of x in eP . In general, FST usestriangular, trapezoidal and Gaussian fuzzy numbers, which con-vert the uncertain numbers into fuzzy numbers (Abbasbandyand Hajjari, 2010). In order to analyze a safety problem, triangu-lar fuzzy numbers are often utilized to provide more precisedescriptions and to obtain more accurate solutions. Thus, in thispaper, triangular fuzzy numbers are applied for representing theprobabilities of basic events. A fuzzy set eP ¼ ðm� a;m;mþ bÞ iscalled a triangular fuzzy number if its membership function isgiven by Eq. (1).
u~PðxÞ ¼
0; x 6 m� ax�mþa
a ; m� a 6 x 6 m
1; x ¼ mmþb�x
b ; m 6 x 6 mþ b
0; x P mþ b
8>>>>>><>>>>>>:
ð1Þ
where a, b, and c are the real numbers. A triangular fuzzy number P�
is shown in Fig. 3. The constants [m � a, m + b] give the lower andupper bounds of the available area, reflecting the fuzziness of theevaluation data.
During the fault tree construction, analysts are confronted withinsufficient data concerning probabilities of basic events. In con-struction practice, the occurrence of an extremely hazardous eventis rare, and therefore, the data would be rare. In the absence ofsufficient data, it is necessary to work with rough estimates of

10 L. Zhang et al. / Safety Science 63 (2014) 8–17
probabilities (Liu and Tsai, 2012). Obviously, under such uncertaincircumstances, it is considered inappropriate to use conventionalFTA for computing the system failure probability. FST offers theframe of analysis that could deal with imprecision in input failureprobabilities for the estimation of top event probability, and suchanalysis is termed fuzzy fault tree analysis (FFTA) (Mentes and Hel-vacioglu, 2011). The fuzzy probability of the TE is represented byP�
TE. P�
TE of the n inputs connected by an OR gate (see Fig. 1) canbe defined by Eq. (2). P
�TE of the n inputs connected by an AND gate
(see Fig. 2) can be defined by Eq. (3).
ePORTE ¼ 1� ð1� ePx1 Þ � ð1� ePx2 Þ � � � � � ð1� ePxn Þ�
hð2Þ
P�
ANDTE ¼ ePx1 � ePx2 � � � � � ePxn ð3Þ
2.3. Fuzzy sensitivity analysis
In previous FFTA studies, the TE probability merely gives an ideaabout system conditions, regardless of the percentage contributionof each basic event. Determining the importance level of differentbasic events is essential for decision analysis. Vesley et al. (2002)indicated that less than 20% of basic events are responsible formore than 90% of the probability of the TE. The sensitivity analysisis therefore applied to identify the weakest components of the sys-tem (Contini et al., 2000).
To determine the importance level of different root causes, Sur-esh et al. (1996) first introduced a fuzzy importance measure (FIM)by means of the Euclidean distance. In this paper, FIM is utilizedto carry out the sensitivity analysis, attempting to reveal the criti-cal basic events so as to reduce the risk limit. The basis of the FIMcalculation is to first assess the TE fuzzy probability (P
�TE), assuming
that all basic events occur. Next, each basic event xi is eliminated(i.e., by setting P
�xi¼ 0 for the event xi) and again calculating the
TE fuzzy probability (P�
TEi). Subsequently, the FIM of the event xi, de-
noted by FIMi, can be calculated by Eq. (4). According to Abdelga-wad and Fayek (2010), results showed that FIM gave more logicalresults than other indexes, based on the risk coordinator’sassessment.
FIMi ¼P�
TE � P�
TEi
P�
TE
24
35� 100% ð4Þ
2.4. A step-by-step procedure for decision analysis
Quantitative FFTA is a time-consuming activity and requiresseveral steps. For the implementation of the fuzzy decision analy-sis for safety management in complex project environments, a sys-tematic methodology is developed, as seen in Fig. 4. In theproposed approach, the following steps are adopted:
Risk/Hazard identification
Risk mechanism analysis
Top-event Identification
Sub-event Identification
Fault tree construction
Potential failure scenarios
Develop failure logic
Build up a fault tree
Probability asse(Fuzzificati
Expert investig
Data gather
Probability fuzzi
Fig. 4. Fuzzy decision analysis procedure for s
� Step 1. Risk/Hazard identification: Carry out the preliminaryrisk mechanism analysis for the problem, reveal the potentialrisks/risk factors and their causal relationships, and then iden-tify the top-event and sub-events.� Step 2. Fault tree construction: Identify the potential failure-
consequence scenario of the top event, develop a failure logic,and then build up a fault tree using the basic events.� Step 3. Probability assessment (Fuzzification): Carry out the
expert investigation for the probability estimation of basicevents, gather the data, transform the linguistic and fuzzyexpressions into fuzzy numbers, and then calculate the fuzzyprobability of basic events based on fuzzification process.� Step 4. Fuzzy based risk analysis (Defuzzification): Calculate
fuzzy failure probabilities using the probabilities of basicevents, and use the fuzzy importance measure for sensitivityanalysis. Convert the resulting fuzzy probability into a crispvalue based on the defuzzification process, and then rank thecalculating results.� Step 5. Decision making: Figure out the critical sensitivity fac-
tors based on risk analysis results, propose relevant controlmeasures for risk response, and make decisions for monitoringand reviewing process.
Steps 1, 2, and 5 rely on the elicitation of knowledge from ex-perts using a standard technique (e.g., Chapman (1998)). The nextsection highlights steps 3 and 4.
3. Fuzzification and defuzzification process
Fuzzification and defuzzification both play a crucial role in thefuzzy decision analysis. Fuzzification attempts to define the basicevent data into a fuzzy probability set and uses them in subsequentcomputation, while defuzzification is to obtain a precise top eventprobability (Ferdous et al., 2009). Owing to the high potential risksfor the metro construction in complex environments, the fuzzyprobability analysis should meet the highly required precision forthe purpose of safety management in the metro construction prac-tice. However, the precision of the calculated results is significantlyaffected due to the limitations in current approaches for fuzzifica-tion and defuzzification.
3.1. Fuzzification
3.1.1. Limitations on current fuzzy probability assessmentIn fuzzy based probability analysis, the imprecise failure proba-
bilities of basic events are refined by characterizing the basic eventwith a suitable membership function. It is difficult to have an exactestimation of the failure rate due to the lack of sufficient data.Therefore, a group decision making method is generally employedto define the linguistic terms to assess the fuzzy probability ofoccurrence of basic events. There mainly exist two deficienciesduring the current fuzzy probability assessment process asfollows:
ssmenton)
ation
ing
fication
Fuzzy based risk analysis(Defuzzification)
Fuzzy failure probability
Fuzzy sensitivity analysis
Defuzzification analysis
Decision making
Critical sensitive risks
Safety control measures
Monitoring and reviewing
afety management in tunnel construction.

L. Zhang et al. / Safety Science 63 (2014) 8–17 11
(1) In traditional expert investigation, all collected survey datais entered into the fault tree without any kind of data reli-ability evaluation. In fact, most interviewed individuals havedifferent confidence levels for their subjective judgmentsaccording to their educational levels, working years and riskattitudes. Thus, a certain deviation exists in the data reliabil-ity among different interviewed individuals. For instance,the reliability of the investigation data obtained from a pro-ject engineer with 30 years of working experience is com-paratively higher than that from an engineer with 5 yearsof working experience. It is therefore necessary to carryout the data reliability evaluation with expert ability andsubjectivity fully considered.
(2) During the division of probability intervals, five linguisticterms [very low (VL), low (L), medium (M), high (H), andvery high (VH)] are commonly used to assess the probabilityof occurrence. The current probability span is excessivelylarge within a single interval. For instance, the scope of‘‘H’’ ranges from 21.5% to 67% (see Abdelgawad and Fayek,2010). Such rough intervals division cannot meet therequired precision for failure probability assessment of basicevents in metro engineering practice.
3.1.2. Expert confidence indexExpert confidence index is proposed to reveal the reliability of
the data obtained from interviews with various individuals. Forone thing, the expert judgment ability needs to be first taken intoaccount. In construction practice, it is generally considered that thejudgment ability of individuals tends to become increasinglysophisticated and stable with the accrual of educational back-ground and working experience. In other words, the judgment abil-ity level, denoted by f, is improved accordingly. The judgmentability is divided into four levels, represented by ‘‘I, II, III, IV’’ asseen in Table 1. The level ‘‘I’’ with a score f = 1.0 stands for a high-est reliability for the expert judgment ability. For another thing, theexpert confidence index involves a kind of subjective measure-ments. It is necessary to collect individuals’ subjectivity informa-tion related to their judgments during the expert investigation.Therefore, the subjective reliability level, denoted by w, is pro-posed to measure the experts’ reliability towards their judgmentsby themselves. The subjectivity reliability w is divided into five lev-els with a score of ‘‘1.0, 0.9, 0.8, 0.7, 0.6’’, respectively. The higherthe w, the more reliable the judgment.
Taking both the judgment ability level f and the subjectivityreliability level w into consideration, the expert confidence index,denoted by h, is then calculated by Eq. (5). In this way, the reliabil-ity of the collected data can be secured.
h ¼ f� w ð5Þ
3.1.3. Probability interval division and expert investigationTo reach the highly required precision for the occurrence proba-
bility of the top event in the metro construction practice, the occur-rence probability of basic events is divided into 17 intervals,
Table 1Setting of expert judgment ability level.
Level Expert description
I 1. Domain experts with more than 32. Professors within the research fiel
II 1. Domain experts with 10–20 years2. Associate professors within the re
III 1. Domain experts with 5–10 years o2. Assistant professors within the res
IV 1. Domain experts with 1–5 years of
represented by ‘‘1–17’’. As seen in Table 2, the kth interval isdefined by [ak, ak+1] together with a mean ck (1 6 k 6 17). Duringthe expert investigation, the purpose of questionnaires as seen in Ta-ble 3 is to collect the information related to occurrence probabilityinterval K and subjectivity reliability level w. For ‘‘Probability inter-val K’’, interviewed individuals were required to fill in a numberranging from 1 to 17 (as seen in Table 2). For ‘‘Subjectivity reliabilitylevel w’’, they were required to fill in a number ranging from 1.0 to0.6. If they fail to evaluate the data reliability within a reliability de-gree of more than 0.6 by themselves, that field can be left blank.
3.1.4. Data gatheringAssuming one considers the occurrence probability of a specific
basic event is in the kth interval with a subjective reliability w, theexpert confidence index h for the event lying in the kth interval canthen be calculated by Eq. (5). In general, h is lesser than 1, whichmeans that the event has a residual probability of 1 � h lying inother intervals. This kind of information is often lost, regardlessof the potentially useful information. According to the Gaussiandistribution patterns of random variables (Montgomery et al.,2009), the occurrence probability tends to fluctuate around itsexpectation, and decrease gradually as it goes far away from theexpectation. Thus, a simplified formula concerning the distributionof residual probability 1 � h among other intervals is presented inthis paper, as seen in Eq. (6).
pi ¼
ðak�ak�iÞPk�1
j¼1ðak�ajÞ
� 1�h2 1 6 i 6 k� 1
h i ¼ kða18þk�i�akÞP17
j¼kþ1ðaj�akÞ
� 1�h2 kþ 1 6 i 6 17
8>>>><>>>>:
ð6Þ
3.1.5. Probability fuzzificationIn an actual investigation, there are S experts involved in the
investigation. For the purpose of data analysis and normalizationprocessing, the average occurrence probability of a specific basicevent lying in the ith interval is calculated to be Pi (1 6 i 6 17)using Eq. (7). According to the Gaussian distribution patterns ofrandom variables, the data reliability for the random variable lyingin the interval [E(p) � 3r, E(p) + 3r] reaches up to 99.7%, whereE(p) stands for the expectation and r stands for the standard devi-ation (Montgomery et al., 2009). The above mentioned principle isalso called the ‘‘3r rule’’. In this paper, the ‘‘3r rule’’ is adopted forthe probability fuzzification process, as seen in Eqs. (8)–(10).
Pi ¼XS
i¼1
pi=S ð7Þ
m ¼ EðPÞ ¼X17
i¼1
ðci � PiÞ ð8Þ
r ¼ffiffiffiffiffiffiffiffiffiffiDðPÞ
p¼
ffiffiffiffiffiffiffiffiffiffiffiffiffiffiffiffiffiffiffiffiffiffiffiffiffiffiffiffiffiffiffiffiffiffiffiffiffiffiffiffiffiffiffiffiffiffiffiffiffiX17
i¼1½ðci � EðPÞÞ2 � pi�
rð9Þ
f
0 years of working experience 1.0d of metro constructionof working experience. 0.9
search field of metro constructionf working experience 0.8earch field of metro constructionworking experience 0.7
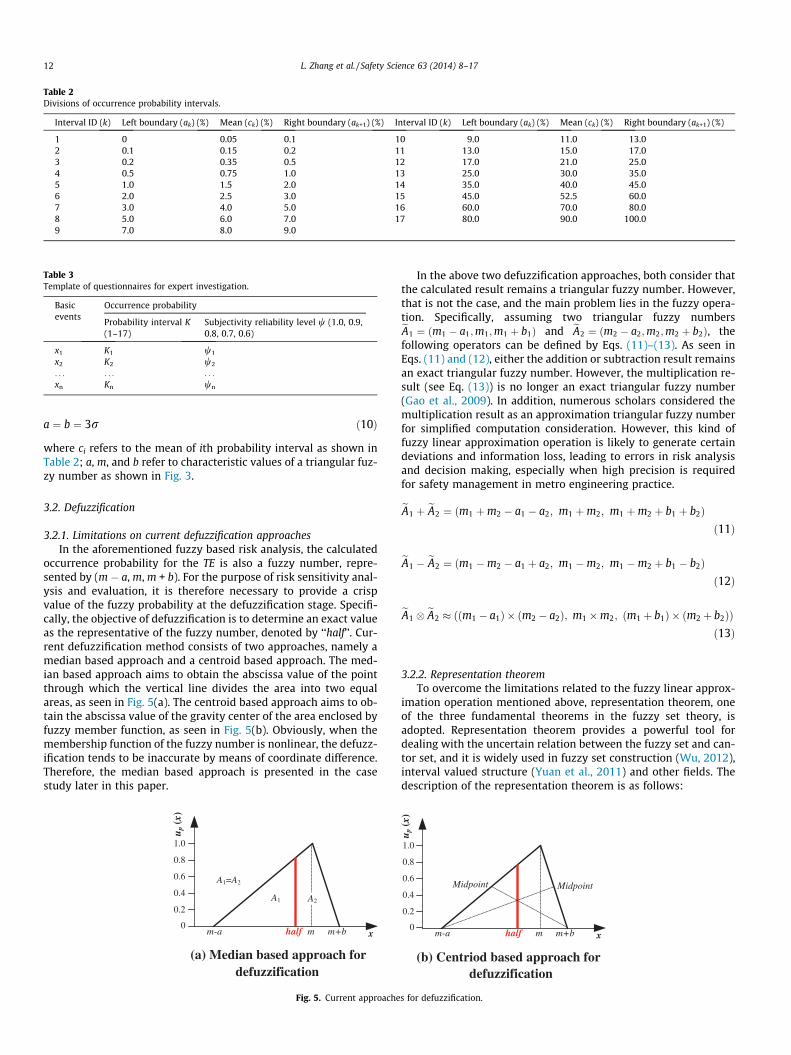
Table 2Divisions of occurrence probability intervals.
Interval ID (k) Left boundary (ak) (%) Mean (ck) (%) Right boundary (ak+1) (%) Interval ID (k) Left boundary (ak) (%) Mean (ck) (%) Right boundary (ak+1) (%)
1 0 0.05 0.1 10 9.0 11.0 13.02 0.1 0.15 0.2 11 13.0 15.0 17.03 0.2 0.35 0.5 12 17.0 21.0 25.04 0.5 0.75 1.0 13 25.0 30.0 35.05 1.0 1.5 2.0 14 35.0 40.0 45.06 2.0 2.5 3.0 15 45.0 52.5 60.07 3.0 4.0 5.0 16 60.0 70.0 80.08 5.0 6.0 7.0 17 80.0 90.0 100.09 7.0 8.0 9.0
Table 3Template of questionnaires for expert investigation.
Basicevents
Occurrence probability
Probability interval K(1–17)
Subjectivity reliability level w (1.0, 0.9,0.8, 0.7, 0.6)
x1 K1 w1
x2 K2 w2
. . . . . . . . .
xn Kn wn
12 L. Zhang et al. / Safety Science 63 (2014) 8–17
a ¼ b ¼ 3r ð10Þ
where ci refers to the mean of ith probability interval as shown inTable 2; a, m, and b refer to characteristic values of a triangular fuz-zy number as shown in Fig. 3.
3.2. Defuzzification
3.2.1. Limitations on current defuzzification approachesIn the aforementioned fuzzy based risk analysis, the calculated
occurrence probability for the TE is also a fuzzy number, repre-sented by (m � a, m, m + b). For the purpose of risk sensitivity anal-ysis and evaluation, it is therefore necessary to provide a crispvalue of the fuzzy probability at the defuzzification stage. Specifi-cally, the objective of defuzzification is to determine an exact valueas the representative of the fuzzy number, denoted by ‘‘half’’. Cur-rent defuzzification method consists of two approaches, namely amedian based approach and a centroid based approach. The med-ian based approach aims to obtain the abscissa value of the pointthrough which the vertical line divides the area into two equalareas, as seen in Fig. 5(a). The centroid based approach aims to ob-tain the abscissa value of the gravity center of the area enclosed byfuzzy member function, as seen in Fig. 5(b). Obviously, when themembership function of the fuzzy number is nonlinear, the defuzz-ification tends to be inaccurate by means of coordinate difference.Therefore, the median based approach is presented in the casestudy later in this paper.
m-a
u p(x
)
0.8
0.6
0.4
0.2
0
1.0
xm m+bhalf
A1 A2
A1=A2
(a) Median based approach for defuzzification
Fig. 5. Current approache
In the above two defuzzification approaches, both consider thatthe calculated result remains a triangular fuzzy number. However,that is not the case, and the main problem lies in the fuzzy opera-tion. Specifically, assuming two triangular fuzzy numberseA1 ¼ ðm1 � a1;m1;m1 þ b1Þ and eA2 ¼ ðm2 � a2;m2;m2 þ b2Þ, thefollowing operators can be defined by Eqs. (11)–(13). As seen inEqs. (11) and (12), either the addition or subtraction result remainsan exact triangular fuzzy number. However, the multiplication re-sult (see Eq. (13)) is no longer an exact triangular fuzzy number(Gao et al., 2009). In addition, numerous scholars considered themultiplication result as an approximation triangular fuzzy numberfor simplified computation consideration. However, this kind offuzzy linear approximation operation is likely to generate certaindeviations and information loss, leading to errors in risk analysisand decision making, especially when high precision is requiredfor safety management in metro engineering practice.
eA1 þ eA2 ¼ ðm1 þm2 � a1 � a2; m1 þm2; m1 þm2 þ b1 þ b2Þð11Þ
eA1 � eA2 ¼ ðm1 �m2 � a1 þ a2; m1 �m2; m1 �m2 þ b1 � b2Þð12Þ
eA1 � eA2 ððm1 � a1Þ � ðm2 � a2Þ; m1 �m2; ðm1 þ b1Þ � ðm2 þ b2ÞÞð13Þ
3.2.2. Representation theoremTo overcome the limitations related to the fuzzy linear approx-
imation operation mentioned above, representation theorem, oneof the three fundamental theorems in the fuzzy set theory, isadopted. Representation theorem provides a powerful tool fordealing with the uncertain relation between the fuzzy set and can-tor set, and it is widely used in fuzzy set construction (Wu, 2012),interval valued structure (Yuan et al., 2011) and other fields. Thedescription of the representation theorem is as follows:
m-a
u p(x
)
0.8
0.6
0.4
0.2
0
1.0
xm m+bhalf
Midpoint Midpoint
(b) Centriod based approach for defuzzification
s for defuzzification.
L. Zhang et al. / Safety Science 63 (2014) 8–17 13
Representation theorem: If H : ð0;1� ! IR; k#HðkÞ ¼ ½mk;nk�–;,k1 < k2 ) ½mk1 ;nk1 � ½mk2 ;nk2 �, eA is a fuzzy number with an inter-
val ½m~A;n~A�, ½mk;nk� stands for the k cut set interval of eA, then: (1)eA ¼ Sk2½0;1�kHðkÞ; (2) eAk ¼T1
n¼1HðknÞ, k > 0; kn ¼ 1� 1nþ1
� �� �; (3)
eA ¼ ð½m~A;n~A�; L~A;R~AÞ, and m~A ¼ limn!1
mkn , n~A ¼ limn!1
nkn , L~AðxÞ ¼ _0<k<1
fkjmk 6 xg;R~AðxÞ ¼ _0<k<1
fkjnk P xg.
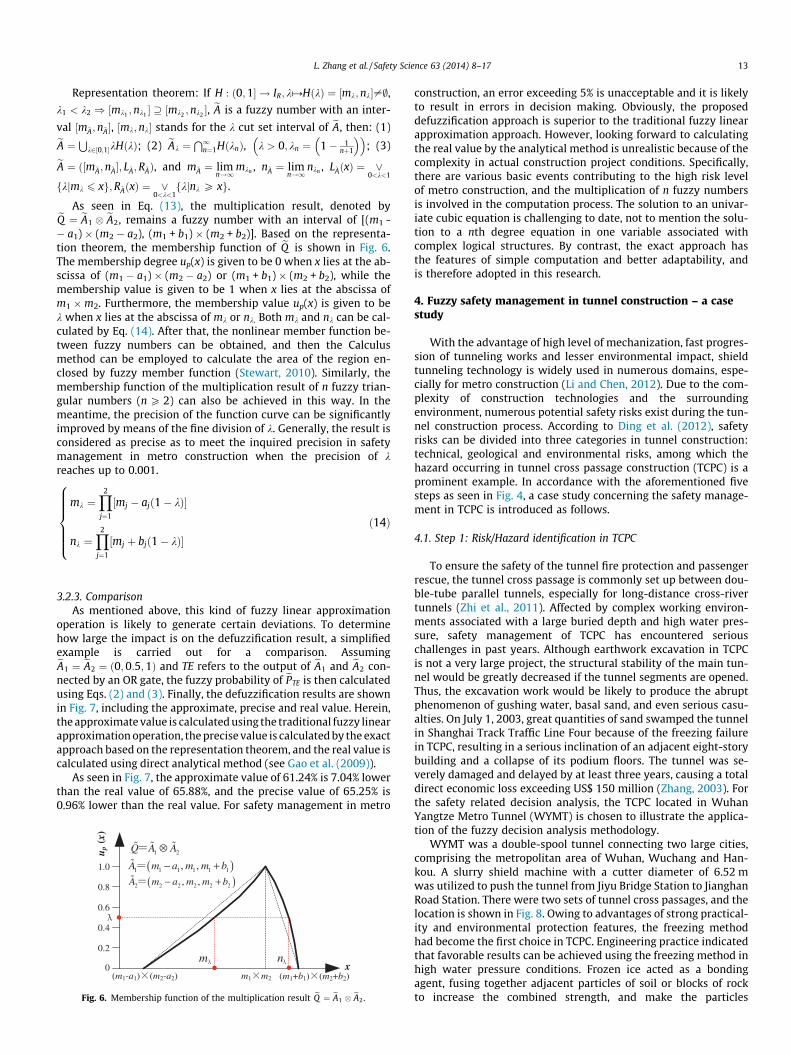
As seen in Eq. (13), the multiplication result, denoted byeQ ¼ eA1 � eA2, remains a fuzzy number with an interval of [(m1 -� a1) � (m2 � a2), (m1 + b1) � (m2 + b2)]. Based on the representa-tion theorem, the membership function of eQ is shown in Fig. 6.The membership degree up(x) is given to be 0 when x lies at the ab-scissa of (m1 � a1) � (m2 � a2) or (m1 + b1) � (m2 + b2), while themembership value is given to be 1 when x lies at the abscissa ofm1 �m2. Furthermore, the membership value up(x) is given to bek when x lies at the abscissa of mk or nk. Both mk and nk can be cal-culated by Eq. (14). After that, the nonlinear member function be-tween fuzzy numbers can be obtained, and then the Calculusmethod can be employed to calculate the area of the region en-closed by fuzzy member function (Stewart, 2010). Similarly, themembership function of the multiplication result of n fuzzy trian-gular numbers (n P 2) can also be achieved in this way. In themeantime, the precision of the function curve can be significantlyimproved by means of the fine division of k. Generally, the result isconsidered as precise as to meet the inquired precision in safetymanagement in metro construction when the precision of kreaches up to 0.001.
mk ¼Y2
j¼1
½mj � ajð1� kÞ�
nk ¼Y2
j¼1
½mj þ bjð1� kÞ�
8>>>>><>>>>>:
ð14Þ
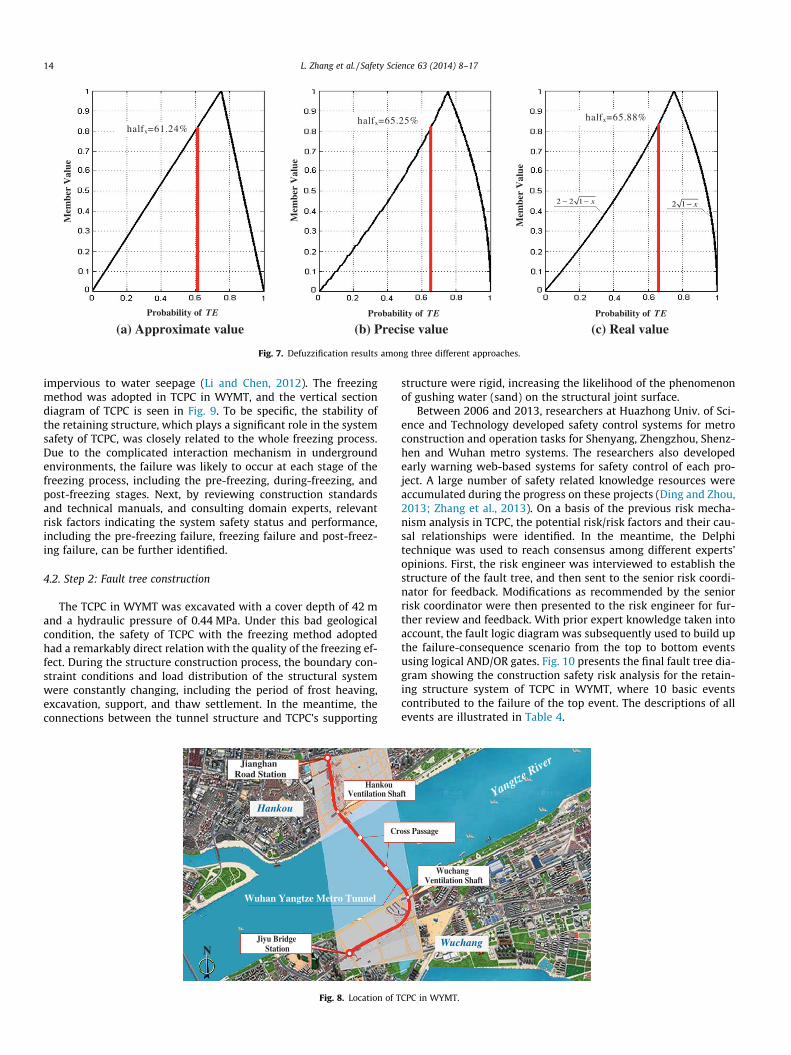
3.2.3. ComparisonAs mentioned above, this kind of fuzzy linear approximation
operation is likely to generate certain deviations. To determinehow large the impact is on the defuzzification result, a simplifiedexample is carried out for a comparison. AssumingeA1 ¼ eA2 ¼ ð0;0:5;1Þ and TE refers to the output of eA1 and eA2 con-nected by an OR gate, the fuzzy probability of ePTE is then calculatedusing Eqs. (2) and (3). Finally, the defuzzification results are shownin Fig. 7, including the approximate, precise and real value. Herein,the approximate value is calculated using the traditional fuzzy linearapproximation operation, the precise value is calculated by the exactapproach based on the representation theorem, and the real value iscalculated using direct analytical method (see Gao et al. (2009)).
As seen in Fig. 7, the approximate value of 61.24% is 7.04% lowerthan the real value of 65.88%, and the precise value of 65.25% is0.96% lower than the real value. For safety management in metro
Fig. 6. Membership function of the multiplication result eQ ¼ eA1 � eA2.
construction, an error exceeding 5% is unacceptable and it is likelyto result in errors in decision making. Obviously, the proposeddefuzzification approach is superior to the traditional fuzzy linearapproximation approach. However, looking forward to calculatingthe real value by the analytical method is unrealistic because of thecomplexity in actual construction project conditions. Specifically,there are various basic events contributing to the high risk levelof metro construction, and the multiplication of n fuzzy numbersis involved in the computation process. The solution to an univar-iate cubic equation is challenging to date, not to mention the solu-tion to a nth degree equation in one variable associated withcomplex logical structures. By contrast, the exact approach hasthe features of simple computation and better adaptability, andis therefore adopted in this research.
4. Fuzzy safety management in tunnel construction – a casestudy
With the advantage of high level of mechanization, fast progres-sion of tunneling works and lesser environmental impact, shieldtunneling technology is widely used in numerous domains, espe-cially for metro construction (Li and Chen, 2012). Due to the com-plexity of construction technologies and the surroundingenvironment, numerous potential safety risks exist during the tun-nel construction process. According to Ding et al. (2012), safetyrisks can be divided into three categories in tunnel construction:technical, geological and environmental risks, among which thehazard occurring in tunnel cross passage construction (TCPC) is aprominent example. In accordance with the aforementioned fivesteps as seen in Fig. 4, a case study concerning the safety manage-ment in TCPC is introduced as follows.
4.1. Step 1: Risk/Hazard identification in TCPC
To ensure the safety of the tunnel fire protection and passengerrescue, the tunnel cross passage is commonly set up between dou-ble-tube parallel tunnels, especially for long-distance cross-rivertunnels (Zhi et al., 2011). Affected by complex working environ-ments associated with a large buried depth and high water pres-sure, safety management of TCPC has encountered seriouschallenges in past years. Although earthwork excavation in TCPCis not a very large project, the structural stability of the main tun-nel would be greatly decreased if the tunnel segments are opened.Thus, the excavation work would be likely to produce the abruptphenomenon of gushing water, basal sand, and even serious casu-alties. On July 1, 2003, great quantities of sand swamped the tunnelin Shanghai Track Traffic Line Four because of the freezing failurein TCPC, resulting in a serious inclination of an adjacent eight-storybuilding and a collapse of its podium floors. The tunnel was se-verely damaged and delayed by at least three years, causing a totaldirect economic loss exceeding US$ 150 million (Zhang, 2003). Forthe safety related decision analysis, the TCPC located in WuhanYangtze Metro Tunnel (WYMT) is chosen to illustrate the applica-tion of the fuzzy decision analysis methodology.
WYMT was a double-spool tunnel connecting two large cities,comprising the metropolitan area of Wuhan, Wuchang and Han-kou. A slurry shield machine with a cutter diameter of 6.52 mwas utilized to push the tunnel from Jiyu Bridge Station to JianghanRoad Station. There were two sets of tunnel cross passages, and thelocation is shown in Fig. 8. Owing to advantages of strong practical-ity and environmental protection features, the freezing methodhad become the first choice in TCPC. Engineering practice indicatedthat favorable results can be achieved using the freezing method inhigh water pressure conditions. Frozen ice acted as a bondingagent, fusing together adjacent particles of soil or blocks of rockto increase the combined strength, and make the particles
Mem
ber
Val
ue
Probability of TE Probability of TE Probability of TE
(a) Approximate value (b) Precise value (c) Real value
halfx=61.24%halfx=65.25% halfx=65.88%
Mem
ber
Val
ue
Mem
ber
Val
ue
Fig. 7. Defuzzification results among three different approaches.
14 L. Zhang et al. / Safety Science 63 (2014) 8–17
impervious to water seepage (Li and Chen, 2012). The freezingmethod was adopted in TCPC in WYMT, and the vertical sectiondiagram of TCPC is seen in Fig. 9. To be specific, the stability ofthe retaining structure, which plays a significant role in the systemsafety of TCPC, was closely related to the whole freezing process.Due to the complicated interaction mechanism in undergroundenvironments, the failure was likely to occur at each stage of thefreezing process, including the pre-freezing, during-freezing, andpost-freezing stages. Next, by reviewing construction standardsand technical manuals, and consulting domain experts, relevantrisk factors indicating the system safety status and performance,including the pre-freezing failure, freezing failure and post-freez-ing failure, can be further identified.
4.2. Step 2: Fault tree construction
The TCPC in WYMT was excavated with a cover depth of 42 mand a hydraulic pressure of 0.44 MPa. Under this bad geologicalcondition, the safety of TCPC with the freezing method adoptedhad a remarkably direct relation with the quality of the freezing ef-fect. During the structure construction process, the boundary con-straint conditions and load distribution of the structural systemwere constantly changing, including the period of frost heaving,excavation, support, and thaw settlement. In the meantime, theconnections between the tunnel structure and TCPC’s supporting
Fig. 8. Location of T
structure were rigid, increasing the likelihood of the phenomenonof gushing water (sand) on the structural joint surface.
Between 2006 and 2013, researchers at Huazhong Univ. of Sci-ence and Technology developed safety control systems for metroconstruction and operation tasks for Shenyang, Zhengzhou, Shenz-hen and Wuhan metro systems. The researchers also developedearly warning web-based systems for safety control of each pro-ject. A large number of safety related knowledge resources wereaccumulated during the progress on these projects (Ding and Zhou,2013; Zhang et al., 2013). On a basis of the previous risk mecha-nism analysis in TCPC, the potential risk/risk factors and their cau-sal relationships were identified. In the meantime, the Delphitechnique was used to reach consensus among different experts’opinions. First, the risk engineer was interviewed to establish thestructure of the fault tree, and then sent to the senior risk coordi-nator for feedback. Modifications as recommended by the seniorrisk coordinator were then presented to the risk engineer for fur-ther review and feedback. With prior expert knowledge taken intoaccount, the fault logic diagram was subsequently used to build upthe failure-consequence scenario from the top to bottom eventsusing logical AND/OR gates. Fig. 10 presents the final fault tree dia-gram showing the construction safety risk analysis for the retain-ing structure system of TCPC in WYMT, where 10 basic eventscontributed to the failure of the top event. The descriptions of allevents are illustrated in Table 4.
CPC in WYMT.

Left Tunnel
Pump room
Fireproofingdoor
Right TunnelRight TunnelRight TunnelRight Tunnel
Freezing area
Freezing area
Fig. 9. Vertical section diagram of TCPC in WYMT.
L. Zhang et al. / Safety Science 63 (2014) 8–17 15
4.3. Step 3: Probability assessment
During the expert investigation, questionnaires were adminis-tered to a group of experts. A total of 140 questionnaires were dis-tributed, and 115 were returned (the return rate is about 82%), ofwhich 9 were invalid and 106 were valid. Among 106 valid ques-tionnaires, the reviewed experts consisted 64 domain experts withat least of five years of working experience, and of 42 researchworkers in this field. The distribution of the judgment ability levelamong these experts is illustrated in Fig. 11. Based on the workingexperience and knowledge background, each expert individuallyevaluated the occurrence probability intervals of basic events to-gether with their subjective reliability taken into account. The ex-pert confidence index h among individuals was then calculated byEq. (5). In addition, the reliable confidence was distributed among17 intervals using Eq. (6). For instance, during the occurrence prob-ability assessment for the basic event x1 = ‘‘fault in flowing water(sand) while drilling’’, one expert with a judgment ability f = 0.8considered the probability interval was within 8th interval, associ-ated with a subjectivity reliability w = 0.7. That is to say, the mostlikely occurrence probability for x1 was between 5% and 7% (see Ta-ble 2) with a completely reliable confidence h = 0.56 using Eq. (5).The residual reliable confidence 1 � h = 0.44 was distributedamong the other 16 intervals, as seen in Fig. 12. Generally, the ex-pert knowledge was considered as a scarce resource which was notable to provide universal consultation or real-time guidance (Dinget al., 2012). In this way, the data use efficiency can then be highlyimproved.
x1
B1
x2
OR
x3 x4
B2
x5
OR
x6 x7
B3
x8
OR
x9 x10
TE
OR
Fig. 10. Fault tree diagram for the safety management of TCPC in WYMT.
Subsequently, the frequency assessment of each basic eventwas calculated, and the average occurrence probability of a specificbasic event lying in the ith interval was obtained using Eq. (7). Fi-nally, the ‘‘3r rule’’ was used to convert the accumulated probabil-ities into fuzzy failure rates based on Eqs. (8)–(10). The results offuzzy probability assessment of the aforementioned 10 basicevents x1 � x10 (see Fig. 10) were presented in Table 5.
4.4. Step 4: Fuzzy based risk analysis
The fuzzy probability of the top event (‘‘the safety of retainingstructure’’) in TCPC was calculated using Eqs. (2) and (3). Next, atthe defuzzification stage, the top-event probability was calculatedto be 74.74% using Eq. (14). Matlab7.1 was applied in the program-ming implementation, and the calculated result was shown inFig. 13. Herein, the probability curve was made up of massive spotswhere the precision of cut set k reached up to 0.001.
A sensitivity analysis technique was then utilized to evaluatethe percentage contribution of the basic events that led to thetop event failure in TCPC. A possibility based important index,FIM, was deployed for the sensitivity analysis of basic events usingEq. (4). Table 6 presents the calculated results of FIM of basicevents. By analyzing these values correctly, more sufficient systemcomponents could be selected and improved, and hence the failureprobabilities would be reduced. The FIM helps the decision makersto reduce the risk limits by identifying the most critical events, andto work out the risk response strategies.
4.5. Step 5: Consequence analysis and safety management
Basic events with higher importance measures would contrib-ute more to the failure of the top event in TCPC. Therefore, it isimportant to rank and compare the sensitivity analysis results ofall basic events. The ranking results as seen in Fig. 14 illustrate thatthe most critical basic events to the system failures are related tox7 (Fault in the instability of the frozen curtain), x9 (Fault in theflooding occurrence in the frozen curtain) and x5 (Fault in poorfreezing effect because of inhomogeneity in the frozen curtain).This conclusion once again demonstrates that the quality andstrength of the frozen curtain plays a significant role in ensuringthe safety of the freezing construction. In addition, poor stabilityevents are prone to occur on the frozen curtain because of exces-sive convergence deformation caused by partial stress concentra-tion. The results allow us to make the proper arrangements onthe failure configuration in order to reduce the risk limit. To guar-antee the safety and reliability of the reinforcing scheme in freez-ing construction, it is necessary to carry out numerical analyses toinvestigate the distribution of the stress field in the frozen curtain.Furthermore, the strength test should then be conducted based onresults of numerical analyses, and the stability safety coefficientshould be controlled above 2.0.
From the perspective of the construction period, the top twosensitive basic events both belong to the post-freezing period(see Fig. 14). Therefore, we had reasons to believe that the post-freezing period was the critical sensitive period during the safetymanagement in TCPC, rather than pre-freezing or freezing period.In fact, this deduction was consistent with the actual situation,since the post-freezing period corresponds exactly to the substan-tive excavation progress. In this period, numerous environmentalfactors associated with much uncertainty were encountered, con-tributing to the high sensitivity for the top event failure. Therefore,significant attention should be paid to the displacement and defor-mation of surrounding soil at this period. The frequency of moni-toring should also be increased, ensuring the feedback analysis ofmeasured data in the real time.
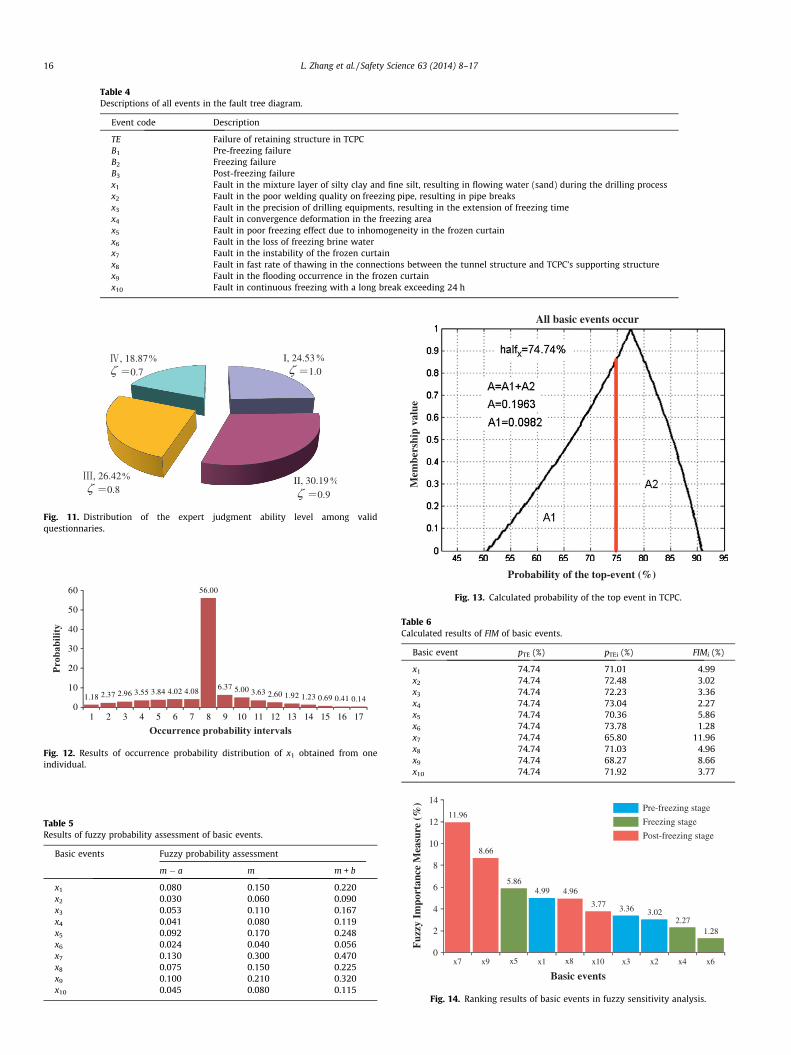
Table 4Descriptions of all events in the fault tree diagram.
Event code Description
TE Failure of retaining structure in TCPCB1 Pre-freezing failureB2 Freezing failureB3 Post-freezing failurex1 Fault in the mixture layer of silty clay and fine silt, resulting in flowing water (sand) during the drilling processx2 Fault in the poor welding quality on freezing pipe, resulting in pipe breaksx3 Fault in the precision of drilling equipments, resulting in the extension of freezing timex4 Fault in convergence deformation in the freezing areax5 Fault in poor freezing effect due to inhomogeneity in the frozen curtainx6 Fault in the loss of freezing brine waterx7 Fault in the instability of the frozen curtainx8 Fault in fast rate of thawing in the connections between the tunnel structure and TCPC’s supporting structurex9 Fault in the flooding occurrence in the frozen curtainx10 Fault in continuous freezing with a long break exceeding 24 h
Fig. 11. Distribution of the expert judgment ability level among validquestionnaries.
1.18 2.37 2.96 3.55 3.84 4.02 4.08
56.00
6.37 5.00 3.63 2.60 1.92 1.23 0.69 0.41 0.14 0
10
20
30
40
50
60
1 2 3 4 5 6 7 8 9 10 11 12 13 14 15 16 17
Fig. 12. Results of occurrence probability distribution of x1 obtained from oneindividual.
Table 5Results of fuzzy probability assessment of basic events.
Basic events Fuzzy probability assessment
m � a m m + b
x1 0.080 0.150 0.220x2 0.030 0.060 0.090x3 0.053 0.110 0.167x4 0.041 0.080 0.119x5 0.092 0.170 0.248x6 0.024 0.040 0.056x7 0.130 0.300 0.470x8 0.075 0.150 0.225x9 0.100 0.210 0.320x10 0.045 0.080 0.115
All basic events occur
Mem
bers
hip
valu
e
Probability of the top-event (%)
Fig. 13. Calculated probability of the top event in TCPC.
Table 6Calculated results of FIM of basic events.
Basic event pTE (%) pTEi (%) FIMi (%)
x1 74.74 71.01 4.99x2 74.74 72.48 3.02x3 74.74 72.23 3.36x4 74.74 73.04 2.27x5 74.74 70.36 5.86x6 74.74 73.78 1.28x7 74.74 65.80 11.96x8 74.74 71.03 4.96x9 74.74 68.27 8.66x10 74.74 71.92 3.77
11.96
8.66
5.864.99 4.96
3.77 3.36 3.022.27
1.28
0
2
4
6
8
10
12
14
x7 x9 x1 x10 x3 x2 x4 x6x5 x8
Pre-freezing stage
Freezing stage
Post-freezing stage
Basic events
Fuz
zy I
mpo
rtan
ce M
easu
re (
%)
Fig. 14. Ranking results of basic events in fuzzy sensitivity analysis.
16 L. Zhang et al. / Safety Science 63 (2014) 8–17
L. Zhang et al. / Safety Science 63 (2014) 8–17 17
5. Conclusions and future research
Metro construction is typically a highly complicated projectassociated with various potential risks. In recent years, safety man-agement and management of metro construction have attractedbroad attention due to their close relation to public safety. Dueto the lack of sufficient data, it is difficult to have an exact estima-tion of the failure rate of the occurrence probability of undesiredevents, a fuzzy decision analysis method for safety managementin tunneling construction has been presented. A typical hazard inTCPC such as the one located in Wuhan Yangtze Metro Tunnel isused for a case study. Results demonstrate the feasibility of theproposed method, as well as its application potential.
Also, there are some other projects encountering the similar sit-uation, where the statistical data is insufficient and high potentialrisks exist in complex environments, such as coal mining, dammonitoring, nuclear power plants and others. Accordingly, duringthe fuzzy decision analysis, there increases the need for precisefailure probabilities for the purpose of safety management in pro-ject management practice. To reach the highly required precisionfor the fuzzy decision analysis, the expert confidence index canbe first proposed to ensure the reliability of collected data duringthe fuzzy probability estimation, with the expert judgment abilityand subjectivity being fully considered. Then, an exact approachcan be developed for defuzzification based on the representationtheorem, attempting to overcome the limitations related to fuzzylinear approximation operations. Furthermore, a possibility basedimportance index, fuzzy importance measure, can be deployed forthe sensitivity analysis of basic events to reveal the critical basicevents for reducing the risk limit. This fuzzy decision analysiscan be used by industry practitioners as a decision support toolto provide guidelines for safety management not only in metroconstruction, but also in other similar complicated projects.
In this research, the fuzzy decision analysis approach is devel-oped on a basis of the triangular fuzzy numbers. However, in Fuzzyset theory (FST), both trapezoidal and Gaussian fuzzy numbers canalso be used to convert the uncertain numbers into fuzzy numbers.Which kind of fuzzy numbers performs to have less informationloss during the probability fuzzification and defuzzification processis unknown. Our subsequent research will be focused on the appli-cation of the proposed method under conditions of other fuzzynumbers, as well as comparisons among different fuzzificationmethods.
Acknowledgements
The National Science and Technology Support Plan (No.51378235), Wuhan City Construction Committee Support Project(No. 201208) and China Scholarship Council (CSC) are acknowl-edged for their financial support of this research.
References
Abbasbandy, S., Hajjari, T., 2010. Weighted trapezoidal approximation-preservingcores of a fuzzy number. Computers and Mathematics with Applications 59,3066–3077.
Abdelgawad, M., Fayek, A.R., 2010. Fuzzy reliability analyzer: quantitativeassessment of risk events in the construction industry using fuzzy fault-treeanalysis. Journal of Construction Engineering and Management 137, 294–302.
AFP, 2008. 21 dead in China subway accident: state media. <http://www.emirates247.com/eb247/news/asia/21-dead-in-china-subway-accident-state-media-2008-11-19-1.227244> (15.11.08).
Boukezzoula, R., Galichet, S., Foulloy, L., et al., 2007. Inverse Arithmetic Operatorsfor Fuzzy Intervals, pp. 279–286.
Chapman, R.J., 1998. The effectiveness of working group risk identification andassessment techniques. International Journal of Project Management 16, 333–343.
Chen, S.-J., Chen, S.-M., 2007. Fuzzy risk analysis based on the ranking of generalizedtrapezoidal fuzzy numbers. Applied Intelligence 26, 1–11.
Contini, S., Scheer, S., Wilikens, M., 2000. Sensitivity analysis for system designimprovement. In: Proceedings of the International Conference on DependableSystems and Networks, July 1, 2001–July 4, 2001. IEEE Computer Society, NewYork, NY, United States, pp. 243–248.
Degn Eskesen, S.O.R., Tengborg, P., Kampmann, J.O.R., Holst Veicherts, T., 2004.Guidelines for tunnelling risk management: international tunnellingassociation, working group No. 2. Tunnelling and Underground SpaceTechnology 19, 217–237.
Deshpande, A., 2011. Fuzzy fault tree analysis: revisited. International Journal ofSystems Assurance Engineering and Management 2, 3–13.
Ding, L.Y., Zhou, C., 2013. Development of web-based system for safety risk earlywarning in urban metro construction. Automation in Construction 34, 45–55.
Ding, L., Yu, H., Li, H., Zhou, C., Wu, X., Yu, M., 2012. Safety risk identification systemfor metro construction on the basis of construction drawings. Automation inConstruction 27, 120–137.
Ericson, A., Ll, C., 1999. Fault tree analysis, System Safety Conference, Orlando,Florida, pp. 1–9.
Ferdous, R., Khan, F., Veitch, B., Amyotte, P.R., 2009. Methodology for computeraided fuzzy fault tree analysis. Process Safety and Environmental Protection 87,217–226.
Ferdous, R., Khan, F., Sadiq, R., Amyotte, P., Veitch, B., 2010. Fault and event treeanalyses for process systems risk analysis: uncertainty handling formulations.Risk Analysis 31, 86–107.
Gao, S., Zhang, Z., Cao, C., 2009. Multiplication operation on fuzzy numbers. Journalof Software 4, 331–338.
Hanss, M., 1999. On the implementation of fuzzy arithmetical operations forengineering problems, Fuzzy Information Processing Society, 1999. NAFIPS. In:18th International Conference of the North American, IEEE, pp. 462–466.
Horcik, R., 2008. Solution of a system of linear equations with fuzzy numbers. FuzzySets and Systems 159, 1788–1810.
Labib, A., Read, M., 2013. Not just rearranging the deckchairs on the Titanic:learning from failures through risk and reliability analysis. Safety Science 51,397–413.
Li, X., Chen, X., 2012. Using grouting of shield tunneling to reduce settlements ofoverlying tunnels: case study in Shenzhen metro construction. Journal ofConstruction Engineering and Management 138, 574–584.
Liu, H.-T., Tsai, Y.-L., 2012. A fuzzy risk assessment approach for occupationalhazards in the construction industry. Safety Science 50, 1067–1078.
Mentes, A., Helvacioglu, I.H., 2011. An application of fuzzy fault tree analysis forspread mooring systems. Ocean Engineering 38, 285–294.
Montgomery, D.C., Runger, G.C., Hubele, N.F., 2009. Engineering Statistics. Wiley.Pillay, A., Wang, J., 2003. Technology and Safety of Marine Systems. Elsevier Science
Limited.Schexnayder, C.J., 2007. Sao Paulo Officials Launch Probe after Deadly Collapse.
<http://enr.construction.com/news/transportation/archives/070129a.asp>(12.01.07).
Shi, C., Zhong, M., Nong, X., He, L., Shi, J., Feng, G., 2012. Modeling and safety strategyof passenger evacuation in a metro station in China. Safety Science 50, 1319–1332.
Singer, D., 1990. A fuzzy set approach to fault tree and reliability analysis. FuzzySets and Systems 34, 145–155.
Stewart, J., 2010. Calculus: early Transcendentals. Brooks Cole Publishing Company.Suresh, P., Babar, A., Raj, V.V., 1996. Uncertainty in fault tree analysis: a fuzzy
approach. Fuzzy Sets and Systems 83, 135–141.Thomas, T., 2010. Breaking News – Prague ring road tunnel collapse. <http://
tunnellingjournal.com/news/breaking-news-prague-ring-road-tunnel-collapse> (06.07.10).
Vesley, D.W., Dugan, D.J., Fragole, J., Minarik II, J., Railsback, J., 2002. Fault treehandbook with aerospace applications. NASA Office of Safety and MissionAssurance. NASA Headquarters, Washington DC.
Wu, H.-C., 2012. Generalized representation theorem and its application to theconstruction of fuzzy sets: existence and uniqueness. International Journal ofApproximate Reasoning 53, 1020–1030.
Yu, F., 2012. Fatal N China Explosion Covered Up: Authorities. <http://english.cri.cn/6909/2013/01/03/2941s741834.htm> (25.12.12)
Yuan, X., Li, H., Sun, K., 2011. The cut sets, decomposition theorems andrepresentation theorems on intuitionistic fuzzy sets and interval valued fuzzysets. Science China Information Sciences 54, 91–110.
Yuhua, D., Datao, Y., 2005. Estimation of failure probability of oil and gastransmission pipelines by fuzzy fault tree analysis. Journal of Loss Preventionin the Process Industries 18, 83–88.
Zadeh, L.A., 1965. Fuzzy sets. Information and Control, 338–353.Zeng, Y., Skibniewski, M.J., 2012. Risk assessment for enterprise resource planning
(ERP) system implementations: a fault tree analysis approach. EnterpriseInformation Systems, 1–22.
Zhang, M., 2003. Frozen failure of connection aisle: Accident investigation inShanghai Track Traffic Line 4. <http://news.sina.com.cn/c/2003-07-02/15011265552.html> (01.07.03).
Zhang, L., Wu, X., Ding, L., Skibniewski, M.J., Yan, Y., 2013. Decision support analysisfor safety control in complex project environments based on BayesianNetworks. Expert Systems with Applications 40, 4273–4282.
Zhi, T., Zheng, F., Jian-ping, Y., Jia-yun, S.U.N., 2011. Optimized design on the widthand spacing of the cross passageway in tunnels. Procedia Engineering 11, 409–415.