Embed Size (px)
Citation preview

CE DATA QUALITY PROFILE TEAM
Deliverable #3
A proposal for a preliminary framework for monitoring and reporting on data quality for the Consumer Expenditure Survey
Authors
Scott Fricker & Lucilla Tan
Project Consultants Janel Brattland & Christopher Stringer
SUBMITTED: 2012.04.12
REVISED: 2012.05.15
Contents
1. Introduction .............................................................................................................................................. 1
2. Summary Review of Data Quality Profiles ................................................................................................ 5
3. Proposed framework ................................................................................................................................ 9
a. Motivation .......................................................................................................................................................... 9
b. Outline of the framework and procedure for its implementation ................................................................... 13
c. Illustration ......................................................................................................................................................... 16
4. Data Quality Profile Annual Reports ....................................................................................................... 19
a. Proposed Report Outline for Internal Users ..................................................................................................... 19
b. Proposed Report Outline for External Users .................................................................................................... 24
5. Discussion ................................................................................................................................................ 28
References .................................................................................................................................................. 30
Appendix A. Definitions of quality dimensions ........................................................................................... 32
Appendix B. Example of template for metric metadata ............................................................................. 35

1
1. Introduction
Various indicators and measures have been used, ad hoc, to assess the quality of data collection and
survey products for the Consumer Expenditure Survey (CE). Over time, survey designers, analysts, and
survey managers increasingly recognized the utility of having a more comprehensive, systematic, and
consistent approach for routinely monitoring and interpreting the quality of inputs and outputs
throughout the survey production process. The CE Data Quality Profile Team was initiated to develop a
proposal for a framework that would support a systematic and integrated approach for monitoring and
reporting on data quality for the CE. A consistent, well-defined set of monitoring metrics will be an
integral component of this framework, and will be used to establish baselines for monitoring trends in
the quality of routine survey production activities over time. These metrics also can be drawn upon to
evaluate the impact of survey design options under consideration, as well as external interventions that
affect the survey.
The Data Quality Profile development project will consist of iterative phases. In this initial phase, the
primary task was to propose content for an annual CE Data Quality Profile that would be released with
survey products, and outline of procedures for doing so.
What does quality mean for survey data?
Whereas data accuracy (error properties) was once the primary focus for quality assessment (Biemer
and Lyberg 2003; Groves 1989; Groves et al. 2004), most statistical agencies and survey producers over
the past decade have come to subscribe to the goal of “fitness for use” of the data, thereby broadening
the concept of quality beyond accuracy to include other dimensions such as relevance, coherence,
timeliness, accessibility, and interpretability of the data (see Brackstone 1999). CE has similarly adopted
this multi-dimensional definition of data quality (see Gonzalez et al. 2009). For a definition of these
quality dimensions, see Appendix A.
Data Quality Profiles
Data quality profiles (DQPs) are usually viewed by survey producers as a product for external data users
for assessing the “fitness of use” of the data for their applications. For example:

2
Survey Research Center (2010) define a data quality profile as “a comprehensive report
prepared by producers of survey data that provides information data users need to assess
the quality of the data”;
From the Introduction to the 1996 Quality Profile of the American Housing Survey: “this
report is intended to provide researchers and data users with a single source for a wide
range of information on the quality of AHS data”.
The Australian Bureau of Statistics produces Quality Declarations for their statistical
products “to ensure that the users of our statistics are well informed on the quality of these
statistics in order to assess their fitness of purpose”.
However, the information needed to produce DQPs for external users is also relevant for quality
measurement and planning within a survey program. We propose that the DQP not be viewed primarily
as a product for external data users, but as a secondary by-product of an annual internal quality report
that provides CE managers and staff an integrated view of the overall quality of survey production
activities at the an end of the survey production year. This integrated report not only provides efficient
access to information about quality on the spectrum of survey activities, but it also will facilitate the
identification of strengths and weaknesses in different aspects of survey activities to assist managers in
their budget and resource allocation planning for “continuous improvement” of survey operations; in
addition, it could also serve to enhance staff’s appreciation of the interdependence of their individual
contributions to the production of survey products.
Framework to support the production of Data Quality Profiles
The interdependence of the quality of survey products and the processes that produce them cannot be
ignored:
“Quality products cannot be produced without quality processes, and having quality processes
requires an organization that manages for quality.” (page II-6, Survey Research Center 2010,
emphasis added).
Our proposed framework can be viewed as a preliminary step to implement the survey process quality
management approach, in which quality management encompasses all the stages of the survey lifecycle.

3
The survey process quality management approach focuses on quality at three levels: the organization,
the process, and the product. Exhibit 1, based on Survey Research Center (2010), illustrates how the
elements of survey process quality management facilitate the assessment of the quality of processes
throughout the survey lifecycle.
Exhibit 1. Survey Process Quality Management
As Exhibit 1 suggests, setting up the infrastructure to implement survey quality process management
can be understandably daunting. The Guidelines written by Survey Research Center (2010) for each
stage of the survey lifecycle altogether comprise 691 pages! Although these Guidelines aimed to
highlight best practices for conducting comparative survey research across cultures and countries, they
are still applicable to addressing quality monitoring of surveys in general. The information requirement
for quality assessment is extensive and non-trivial, even if not all the elements are adopted for CE. We

4
view our proposed framework as a first step towards survey process quality management that can be
iteratively built upon.
By framework we mean how information on quality monitoring measures and methods are created,
monitored, and maintained/stored/reported, to become the basic inputs in the production of the annual
DQPs for both internal and external readers, or other quality reports needed. We propose that the
framework be structured around the stages or functions routinely carried out over the course of survey
operations (survey lifecycle), with staff in each functional area taking a lead in recommending and
monitoring quality measures because of their hands-on experience and knowledge of their functional
area. From our experience working on interim tasks prior to formulating this proposal, we believe that
many basic inputs, or knowledge for developing inputs, for quality measurement already exist, if
latently, in current survey production activities. The objective is to make these quality practices “visible”
(Doyle and Clark, 2001). Further elaboration on the motivation behind this approach is given in Section
III.
The rest of this report is organized as follows:
Section II provides an overview of the variety of content and format of DQPs from other surveys
or statistical agencies;
Section III broadly outlines the framework and our preliminary thoughts on procedures for
implementing the proposed framework for creating the inputs to DQPs; and
Section IV outlines possible reporting elements for the internal and external DQPs for CE
Section V provides a summary of the main themes of our proposal.
5
2. Summary Review of Data Quality Profiles
The development of the quality profile concept grew out of models of total survey design (e.g., Hansen,
Hurwitz, and Bershad, 1961) that emphasized the identification and measurement of individual
components of survey error. An early, influential model for quality profiles in U.S. statistical agencies
was set by Statistical Policy Working Paper #3 issued by the U.S. Federal Committee on Statistical
Methodology (FCSM) (1978, NTIS PB86-214269/AS). This 85-page report – described as an ‘error profile,’
using the terminology of the day – described the purpose and design of the Current Population Survey
(CPS), examined components of its survey operations (e.g., sampling design and implementation, data
collection, processing, estimation), identified potential sources of error associated with each
components’ activities (and described any program efforts to address/reduce those errors), and
attempted to assess the impact of those errors on estimates of unemployment; the profile did not
address the potential impact of errors on other CPS concepts/statistics. The objective of this Working
Paper was to provide a comprehensive picture of the quality of CPS unemployment statistics in a single
report by reviewing and synthesizing all that was known about the sources and magnitude of errors.
The authors also intended that this approach would help elucidate areas for quality improvement in the
survey, and serve as a template for similar profiles in other surveys.
Since the publication of the 1978 Working Paper, U.S. statistical agencies have produced quality profiles
for four surveys.1 The content and structure of these profiles closely follow the CPS Error Profile model.
Each begins by providing an overview of the survey objectives and design, offers some statement about
the purpose of the profile and its intended audience(s), and then begins in-depth treatment of the
different error sources. Their focus is almost exclusively on the accuracy dimension of quality,
addressing sampling and nonsampling error sources (e.g., coverage, sampling, nonresponse,
measurement, processing, and estimation) while ignoring other key concepts (e.g., relevance,
timeliness, accessibility).2 They are long and detailed – ranging from 100 pages to more than 250 pages -
1 The Census Bureau first developed a quality profile for the Survey of Income and Program Participation (SIPP) in
1984, and published revisions in 1993 and 1998 (U.S. Bureau of the Census, 1998). The National Center for Education Statistics (NCES) prepared a quality profile for the School and Staffing Survey (SASS) in 1994 and again in 2000 (Kalton et al., 2000). The Energy Information Administration (EIA) released the Residential Energy Consumption Survey Quality Profile in 1996. The Department of Housing and Urban Development produced the American Housing Survey (AHS) Quality Profile in 1996 (Chakrabarty and Torres, 1996). 2 The SASS Quality Profile (2000) is the only exception; it provides brief discussion of timeliness, relevance, and
accessibility issues.

6
containing numerous charts and tables that quantify specific aspects of the components of error (e.g.,
coverage ratios, unit and item nonresponse rates), and references to external source materials (e.g.,
reports on experimental evaluations or technical documentation). Each of these profiles also includes
sections that attempt to summarize major error sources in the survey and discuss areas for further
methodological research.3 The profiles are made available to readers as full, stand-alone documents in
PDF or HTML format, and are generally accessible through the Technical Documentation section of the
surveys’ website (though they vary in how easy they are to find).
In the last decade, the European statistical community has broadened the quality profile concept to
include other dimensions of quality beyond accuracy, developed standard guidelines for preparing
comprehensive “quality reports,” and provided useful models for tailoring the content and format of
these reports to particular users. For example, the European Statistical System (ESS) (2009) has quality
report guidelines organized by the following statistical output and process quality components:
Introduction to the statistical process and its outputs – an overview to provide context;
Relevance – an output quality component;
Accuracy – an output quality component;
Timeliness and punctuality - output quality components;
Accessibility and clarity - output quality components;
Coherence and comparability - output quality components;
Trade-offs between output quality components;
Assessment of user needs and perceptions – covering all aspects of output quality;
Performance, cost, and respondent burden – process quality components;
Confidentiality, transparency, and security – process quality components;
Conclusions – summary of principal quality problems and proposed improvements.
The ESS guidelines additionally provide examples of the type of information or metrics that should be
included under each component, and for sub-sections within each component (e.g., overall accuracy,
sampling errors, coverage errors, accuracy of price indices, etc.). There is an emphasis on transparency
3 The first chapter of the AHS Profile (1996) provides a particularly good, high-level summary for readers. In 10
pages, it outlines the objectives of the profile and provides a succinct description of the major error sources, the metrics and methods by which they have been assessed, and their potential impact on estimates. When there is insufficient information about a particular error component, the profile explicitly acknowledges this fact.

7
– documenting reasons why certain design and procedural decisions were made, acknowledging
insensitive or insufficient metrics, etc. – and where possible, on providing recommendations that are
specific enough to be helpful to those who use the data for specific analyses.
The European framework also acknowledges that there is a wide range of possible quality reports
depending on its desired scope (e.g., focus on a specific indicator or estimate, the survey, or
organization as a whole), the intended user (agency or program managers, internal data
users/producers, or external data users), reporting frequency (the more frequent typically the less detail
required), and orientation (focus on survey processes vs. survey outputs). And, they provide guidance
for tailoring quality reports for these various uses, while acknowledging that the development of a
comprehensive set of quality reports will necessarily require a progressive and iterative process (see,
e.g., ESS Standard for Quality Reports, 2009; ESS Handbook for Quality Reports, 2009).
The United Kingdom’s Office for National Statistics (ONS) and the Australian Bureau of Statistics (ABS)
currently provide two noteworthy examples of how quality reports can be customized to their intended
audiences. For a given survey, these agencies offer comprehensive quality reports similar to U.S. quality
profiles, shorter but sufficiently detailed quality reports for external data users (e.g., ABS “Explanatory
Notes” or ONS “Quality and Methodology Information” papers), and brief (1 –2 page) statements about
the quality of statistical products based on the typical Total Quality Management quality dimensions
(e.g., ABS “Quality Declarations”). Each of these resources is designed for and available on the agency
website.
Benefits and limitations
In their assessment of the quality profile concept, Kasprzyk and Kalton (2001) note that their greatest
value stems from the documentation and synthesis of methodological information and research on
sources of error that otherwise typically would be isolated and therefore less useful to most data users
(internal and external). It is the integration and evaluation of these multiple sources that provide survey
managers a powerful tool to help guide the allocation of available resources at different stages of survey
operations, quality assurance activities, methodological research, and experimentation. This also aids
data users by providing a comprehensive picture of the survey design and important context for
evaluating the effects of errors on the estimates. But, as these authors point out, one of the limitations
of previous quality profiles is that they have tended to focus on sources of error for the survey as a

8
whole, rather than providing specific error characteristics about individual statistics. As a result,
researchers may find it difficult to know how to use this survey-level information to assess the impact of
errors on specific analyses (e.g. for particular estimates, sub-group comparisons) in the absence of
proper guidance from the survey producer.
There are a number of ways this issue has been (or could be) handled to improve the usefulness of
quality profiles for data users. One approach is to provide users with general guidelines that broadly
apply to many different survey products or analyses. For example, the SIPP, SASS, and RECS Quality
Profiles (and the respective Users’ Guides to which they reference) tell users how to use weights, take
sampling error into account in their analyses, and calculate standard errors for cross-year comparisons.
Another approach is to alert users to known or suspected problems with specific data items and suggest
approaches for analyses of these items. The RECS profile provides some limited guidance to users along
these lines, but one could imagine expanding coverage of these issues by targeting not only items but
sets of analyses that are common in the user community (e.g., by providing examples of alternative
estimation procedures for a given analysis and discussing the issues and risks associated with each one).
In fact, there are a number of existing resources that provide models for the types of analysis-specific
information that could be included, summarized, or referenced in a quality profile. For example,
Statistics Sweden produced a document entitled “Estimation in the Presence of Nonresponse and Frame
Imperfections” that describes a range of techniques commonly used for resolving issues arising from
nonresponse, provides examples of their application to various statistics (e.g., totals, means, variances)
under different assumptions, and discusses practical considerations for the user (Lundström and
Särndal, 2001). Similarly, the Institute for Social and Economic Research (ISER) has published work on
approaches to estimation in the presence of measurement error (i.e., methods for deriving upper and
lower bounds for population estimates) (Nicoletti et al., 2007). Although neither organization uses
these approaches prescriptively – telling users which methods should or should not be used – or
currently incorporates them into formal quality profiles (or their equivalent), they provide potentially
useful information for analysts. Developers of quality profiles could review methods that have
incorporated error-dependent analyses of their survey data, and offer those that are sufficiently robust
as possible suggestions to users looking for additional guidance for specific analyses. The process of
reviewing and evaluating these methods would have the added benefit of helping the survey manager
identify methodological gaps and areas for future research.

9
3. Proposed framework
We outline a framework that can be used to create and maintain information about quality-related
activities and measures. This framework can be iteratively finessed and scaled up to establish the
infrastructure for quality assessment and reporting, including the production of DQPs for both internal
and external data users. Before further elaboration on this framework, we describe the motivation
behind our decision to propose this approach.
a. Motivation
Among the Team’s preceding tasks before writing this proposal were: [1] to review the existing Data
Collection Quality Monitor Reports on CEWEB, and [2] to propose metrics for monitoring the impact of
the re-organization of the management structure of the Census Regional Offices on the CE Interview
Survey and the Diary Survey (see Fricker et al. (2012a and 2012b)). The Team learned several important
lessons from the work undertaken to accomplish these tasks:
In order to propose appropriate metrics to monitor a specific survey activity, it is important to
first identify and understand the issues/risks associated with it, and not to begin by thinking
about how to monitor error/quality dimensions for that activity. Once these issues/risks have
been identified and understood, the metrics or monitoring method generally “tend to suggest
themselves”.
o It became apparent early on to the Team members that they lacked sufficient
knowledge about field and data processing procedures needed to understand and
foresee potential risks arising from the restructuring of the management of Census
field staff. The Team made inquiries of staff working in these relevant areas to
gather information about current procedures, which added time to the process.
Even then, it was the Team’s opinion that although having a general understanding
of procedures may be adequate for coming up with appropriate monitoring metrics
or methods for some survey activities, it probably is not for others.
It is useful to adopt a standardized format, or template, to describe metrics at the point of their
proposal. This not only ensures that all the necessary information to define, produce and
10
interpret a metric is thought through and documented – i.e. effectively capturing monitoring
metadata “upstream” - but it also promotes transparency in the metric’s definition and will
assist in its consistent interpretation over time. 4 Having this type of documentation about a
metric would minimize dependency on individual staff, an added benefit in light of staff
turnover or attrition.
There already exists quality checks and measures used in current survey activities, but these are
not easily “visible” or transparent, to staff who do not work directly in these areas.
We have read data quality reports from other agencies that were produced regularly for a
period, then ceased production (e.g. the last American Housing Survey Quality profile appeared
in the 1990s). Doyle and Clark (2001) described a coordinated effort at the U.S. Census Bureau
to produce standardized quality profiles for demographic surveys; the inter-divisional Quality
Profile Development Committee was established in the late 1990s for this purpose. However,
we could not find any evidence of quality profiles that followed from the implementation of this
effort. We feel strongly that the best incentive to get sustainable resource commitment to
producing these types of reports is if both management and staff recognize that there are
benefits to internal operations from the effort to produce these reports that outweigh the costs
to produce them.
Comments by experienced researchers and practitioners at the 2012 FedCASIC Conference should also
be kept in mind. Although the conference speakers were addressing topics on the use of data related to
the process of data collection as well as data about data content to improve survey quality, we regard
their recommendations as also relevant for our objective; these recommendations are highlighted in
Exhibit 2.
4 See Table 2 of Deliverable 1 report for the Team’s review of the existing Data Collection Quality Monitor Reports
on CEWEB that prompted this recommendation.

11
A framework for creating data quality profile (DQP) inputs that is built around stages of the survey
lifecycle will fit in most naturally with the production activities already in place. Not only will this
leverage staff’s “hands-on” area-specific expertise to develop appropriate monitoring metrics, but it will
also minimize the imposition of significant additional burden on staff if these measures are
incorporated, or may already be incorporated, into routine survey production activities. This approach
of organizing the creation and maintenance of DQP inputs will thus be a part of survey operation
activities already familiar and undertaken by staff, and has the advantage of clear delineation of staff
responsibility for identifying issues, developing and maintaining monitoring metrics for their routine
survey activities.
Exhibit 2. Recommendations from 2012 FedCASIC Conference
Monitoring metrics or methods should be actionable
Should not just be “nice to know” information – their collection and use must demonstrate benefits ~ Francois Laflamme (Statistics Canada)
1
Too many metrics, even if informative, can be burdensome ~ Andy Peytchev (RTI) 1
Must be tied to a specific operational concern/issue ~ Anan Koppikar (Mathematica) 1
Identify Key Performance Indicators and demonstrate their value ~ Barbara O’Hare (Census) 1
Indicators that are easy to collect may not be useful, call out indicators that are not useful ~ Roger Tourangeau (WESTAT) 1
Access to context metadata for the monitoring metrics is necessary for their regular use
Lack of use of monitoring reports often due to readers not knowing how to interpret them ~ Anan Koppikar (Mathematica) 1
High development cost
Development of infrastructure takes time and commitment ~ Anan Koppikar (Mathematica) 1
Cost to developing metadata is high, especially if standards not implemented and captured upstream ~ Jeff Butler (IRS) 2
1 Plenary panel on Use of Paradata to Improve Survey Quality
2 Session on Survey Uses of Metadata

12
The basic principles motivating this approach and which we want the proposed framework to reflect are
enumerated below.
Underlying principles
1. Use one framework to create, organize, and maintain all quality related information for the
survey to promote transparency, with a coordinating body overseeing the process.
2. Have one source of information about quality that program office staff in all areas can query.
3. Minimize creating additional burden on staff, and leverage staff expertise in their area of
responsibility to recommend appropriate metrics (in conjunction with consultations with survey
methodologists or other quality experts, as needed).
4. Any monitoring method or metric implemented must demonstrate its usefulness - i.e., tied to a
specific concern(s) and not just be “nice to know”.

13
b. Outline of the framework and procedure for its implementation
The proposed framework for creating and maintaining metadata on quality monitoring is depicted in
Exhibit 3.
Exhibit 3. Proposed framework
We outline procedures for implementing this framework below.

14
Outline of procedures for implementing the proposed framework
1. Establish a coordinating team to oversee the implementation of the framework.
2. Identify key functional stages that represent the entire scope of the CE annual survey lifecycle, from survey design to the release of survey data and products (as an example, see Exhibit 4).
3. For each key stage, identify activities that support that survey stage.
4. For each activity, identify staff responsible for that area of work to perform the following tasks:
[a] Describe the issues of concern, or that warrant attention, associated with each activity. These issues will motivate the development of monitoring methods, and also raise awareness of potential risks to look out for that activity. [b] For each issue, recommend a method or metric for monitoring the issue, if possible.
o A monitoring method (or metric) may be both quantitative and/or qualitative. o If a monitoring method cannot be currently identified, it should be noted as such. o For each issue, staff can work with methodology experts to describe/characterize potential
risk, quality dimension affected, and monitoring methods/metrics. o Understand that some activities and issues may be more difficult to describe, so plan that
this may entail an iterative process.
5. Use a standardized format to describe each monitoring method or metric that is recommended
This helps ensure that all the necessary elements to define, produce, and monitor a metric are documented in a systematic and consistent way.
Using a standardized format also facilitates maintaining metric metadata in electronic database.
For example: see Appendix B.
6. Establish a priori guidelines for deciding if a proposed monitoring metric/method should be adopted.
We want to be selective in what monitoring metrics or methods to implement to avoid being burdened with too many indicators or measures.
For example: limit monitoring methods or metrics to what can be effectively described, implemented, interpreted, and actionable.
7. Use one (or more) standardized format(s) for reporting monitoring results for each survey activity.
This will facilitate the extraction of monitoring results as inputs to quality reports. (e.g. BRPD Project tracking database “Outcome” field).
Development of these report templates will necessarily involve metric proponents as well as supervisors.
Summary level reporting is desirable; more detailed information can be referenced.
Reporting elements should include: o Metric/method definition and context metadata for interpretation (point to metric
metadata) o Monitoring period o Success/failure in meeting targets o Call out problems / potential problems o Follow up actions to take (or not)

15
Exhibit 4. Survey Lifecycle

16
c. Illustration
We sketch out an example of working through steps 2 through 5 of the procedure, based on the Team’s
work to produce the deliverables referenced in Section 3a.
Step 1. Identify key survey functions or stages in survey lifecycle.
As an example, Survey Research Center (2010) depicted a general survey lifecycle as shown in Exhibit 4.
For the CE, an exercise analogous to the process that of identifying survey process activities submitted
to the OPLC Methodology Dissemination Group in March 2012, as shown in Exhibit 5, can be a starting
point for identifying major survey stages relevant to the CE (the first row of Exhibit 5), and supporting
activities under each stage.
For the purpose of illustrating our proposed procedure, we select a major stage in the CE survey lifecycle
from the first row in Exhibit 5.
Exhibit 5. One possible representation of CE’s Survey Process Activities
(preliminary, submitted to the OPLC Methodology Dissemination Group)
Step 2. Survey stage: we use “survey collection” as an example.

17
Step 3.
Activity : we use “data collection management” as an example.
Issue: change in management structure of Census RO field staff
Description of concerns, and potential risks: see Exhibit 6.
Recommended monitoring metrics: see Exhibit 6.
Exhibit 6 summarizes how we identified and described concerns associated with an issue (in this example, a change in Regional Offices management structure), and possible metric(s) to monitor each concern.
Exhibit 6. Potential risks to CE Diary Data Collection associated with reorganized Regional Offices
Activity Pre-consolidation
Structure Consolidated
Structure Potential Risk under
Consolidated Structure
Diary Survey Monitoring indicators proposed
Monitoring of data collection
By survey-specific Survey Supervisor.
By non survey-specific Field Survey Statistician, and survey-specific Office Survey Statistician. More automated tools for monitoring available.
Field supervisors now have to monitor all surveys conducted out of the RO, as opposed to focusing on one survey, although there is the Office Survey Statistician who will focus on a specific survey.
Expenditure item attribute imputation rate Expenditure edit rates Missing CHI data Refusal conversion rate Prevalence of total recall diaries
Diary placement There was a dedicated Survey Clerk to make calls to ensure/follow up that Diaries were placed in timely manner.
There is no dedicated Diary Survey Clerk.
Diaries may not be placed as timely as previously.
Double placement rate Distribution of difference in Weeks 1 and 2 Diary placement dates
Re-interviews ROSCO randomly selects cases each month – about 30 for Interview Survey, 10 for Diary Survey
Survey-specific Supervisor did the re-interviews.
Likely to be done by Field Supervisor or Field Survey Statistician? Or survey-specific Office Survey Statistician?
If done by Field Supervisor or Field Survey Statistician, it will depend on their experience with / knowledge of CE.
None identified
Note: this is based on Table 1 of Fricker et al. (2012b)
Step 4. Quality dimension affected: see Exhibit 7.
Step 5. Capturing metric/method metadata at creation - documentation of recommended metric using
template: see Exhibit 7.

18
Exhibit 7. Example of metric metadata description using a template
Metric Name: Placement dates
Description: Frequency distribution of the number of days between placement of Week 1 and Week 2 diaries
Survey: CED
Quality Dimension: Measurement error
Use of this metric Ideally, Week 2 diaries are placed on Day 8. Week 2 diaries placed after Day 8 require respondents to use retrospective recall (not daily recording of expenditures) to report diary entries for the days between Day 8 and the actual placement date. Retrospective recall is subject to reporting errors due to memory (e.g., forgetting, telescoping), with effects worsening as the recall period lengthens. Thus, it is desirable to have a distribution of days between Week 1 and 2 placement which is tightly clustered around Day 8. Note: Zero days between diary placements (i.e. the difference in the number of days between placements of Week 1 and Week 2 diaries is zero), indicates the Week 1 and Week 2 diaries for a consumer unit were placed on the same day (i.e. “double placed” diaries).
CALCULATION
Formula For each CU (identified using 1
st nine digits of FAMID), compute the difference in placement dates of Week 2
and Week 1 diaries as:
Number of days between diary placements= Placement date of Week 2 Diary – Placement date of Week 1 Diary
Then, compute the frequency distribution of “Number of days between diary placements”
Data items used in formula Phase 2: FAMID, PLCEDATE, WEEKI, DPLC_CHK
Frequency: Monthly / Quarterly after transitional RO monitoring
Level: RO
Produced by: P&C MONITORING
Target / Threshold / Tolerance: to be determined.
Presentation / display: to be determined. COMMENTS None.
19
4. Data Quality Profile Annual Reports
a. Proposed Report Outline for Internal Users
Timing of report
We propose that the DQP for internal users (Internal DQP) be ready about 1 month before release of the
DQP for external users (External DQP). The DQP for external users could be released simultaneously with
published tables, or with microdata.
Format and content of report
Develop standardized reporting formats.
Summary level reporting is desirable; more detailed information can be referenced.
Organize the presentation of information by key stages in the survey lifecycle identified in Step 1 of the framework.
For each monitoring metric/method, elements of reporting should include: o Metric/method definition and context metadata for interpretation (sufficient to
reference, need not be re-stated) o Monitoring period o Success/failure in meeting targets o Call out problems / potential problems o Follow up actions to take (if needed or recommended)
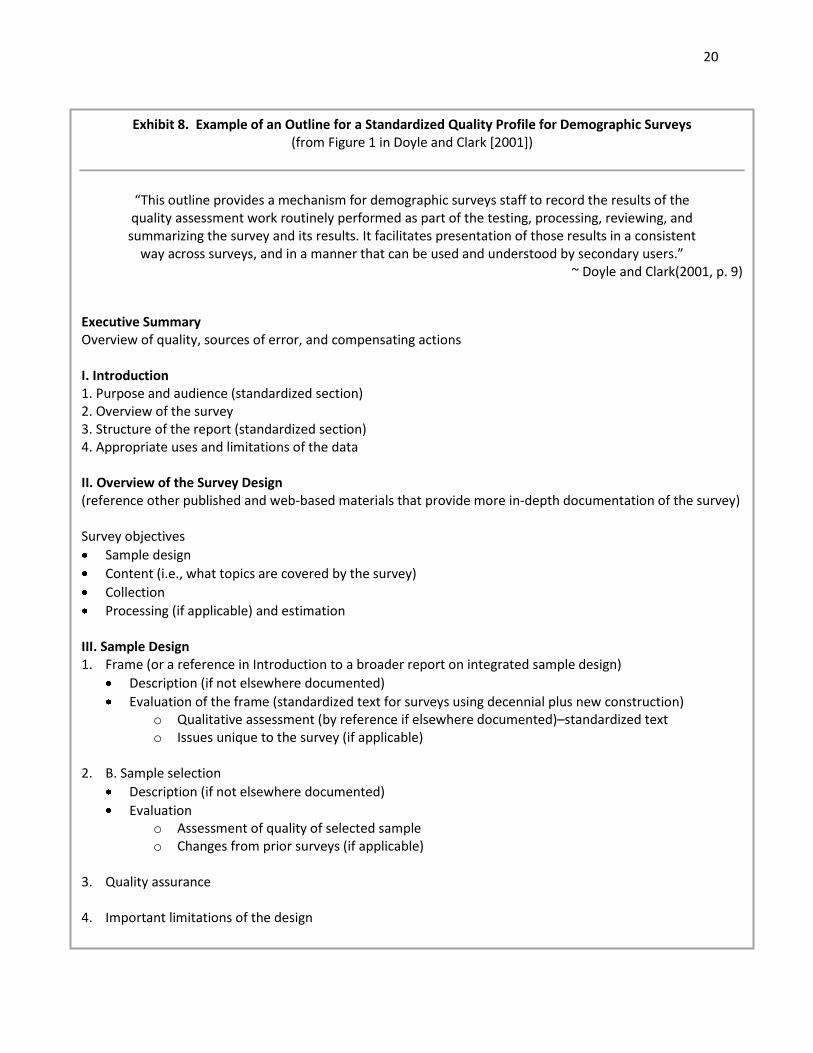
In Exhibit 8 that follows, we reproduce Doyle and Clark’s (2001) Outline for Standardized Quality Profile
for Demographic Surveys, which focuses more on the survey accuracy dimension than the broader Total
Quality Management dimensions. We are not proposing that CE produces an internal Quality Profile
similar in detail to Exhibit 8 from Doyle and Clark(2001), but have included this Outline in our proposal
as it provides a useful illustration of how to organize monitoring information built around key survey
functions into a report.5
5 We modified the format of Doyle and Clark’s (2001) Outline shown in their Figure 1 on page 17, but not the
content.
20
Exhibit 8. Example of an Outline for a Standardized Quality Profile for Demographic Surveys (from Figure 1 in Doyle and Clark [2001])
“This outline provides a mechanism for demographic surveys staff to record the results of the
quality assessment work routinely performed as part of the testing, processing, reviewing, and summarizing the survey and its results. It facilitates presentation of those results in a consistent
way across surveys, and in a manner that can be used and understood by secondary users.” ~ Doyle and Clark(2001, p. 9)
Executive Summary Overview of quality, sources of error, and compensating actions I. Introduction 1. Purpose and audience (standardized section) 2. Overview of the survey 3. Structure of the report (standardized section) 4. Appropriate uses and limitations of the data II. Overview of the Survey Design (reference other published and web-based materials that provide more in-depth documentation of the survey) Survey objectives
Sample design
Content (i.e., what topics are covered by the survey)
Collection
Processing (if applicable) and estimation III. Sample Design 1. Frame (or a reference in Introduction to a broader report on integrated sample design)
Description (if not elsewhere documented)
Evaluation of the frame (standardized text for surveys using decennial plus new construction) o Qualitative assessment (by reference if elsewhere documented)–standardized text o Issues unique to the survey (if applicable)
2. B. Sample selection
Description (if not elsewhere documented)
Evaluation o Assessment of quality of selected sample o Changes from prior surveys (if applicable)
3. Quality assurance 4. Important limitations of the design

21
Exhibit 8 continued IV. Data Collection Provide an overview of basic features and (if applicable) improvements introduced 1. Pre-collection research
a. Pretesting research on instrument quality (summarize or reference if documented elsewhere) b. Assessments of results from earlier rounds of data collection and enhancements incorporated—
(summarize or reference, if published elsewhere) 2. Instrument
a. Mode(s) b. Structure and length c. Overview of content d. Reference period(s) e. Quality control procedures
3. Special strategies employed to improve data quality
a. Efforts to maximize response rates (includes incentives) b. Assessment of the success of these measures from studies of prior rounds of collection
4. Field staff
a. Experience b. Training c. Supervision
5. Respondent rules 6. Results of other measures to improve quality of collection (if applicable) 7. Important limitations of collection (for example, a particularly short period for following up with nonrespondent units yielding a relatively high level of nonresponse relative to other demographic surveys) V. Data Processing/Preparation (if applicable) and Estimation 1. Overview of processing and estimation (reference other documentation for fuller details) 2. Description of principal estimators 3. More detail on data input (keying, imaging, if applicable) and automated coding (if not elsewhere
documented) 4. More detail on weighting (if not elsewhere documented) 5. More detail on the edit and imputation process (if not elsewhere documented)

22
Exhibit 8 continued V. Data Processing/Preparation (if applicable) and Estimation continued 6. Public use file preparation (particularly data modification for disclosure avoidance, if not elsewhere
documented) 7. Quality assurance
a. Summary of comparison of input and output, summarizing impact (good and bad) b. Description of quality control process
8. Evaluation and research VI. Data Quality Assessment 1. Sampling error (Copy existing text from the Source and Source and Reliability Statements) 2. Coverage 3. Issues beyond those associated with the frame (if applicable) 4. Coverage ratios and discussion of reasons for and corrections for under coverage 5. Response rates
a. Types and definitions of response rates (largely standardized text but details vary by b. survey) c. Unit response rates (and subunit if applicable) d. Attrition (if applicable) e. Item response rates (summarize here and report details as companion to data or on the Internet
rather than here) 6. Nonresponse and compensating adjustments
a. Nonresponse bias b. Weighting c. Editing (if applicable) d. Imputation (if applicable) e. Assessment of success f. Recent nonresponse research (if applicable)
7. Results of post collection assessment of performance (includes debriefing and reinterview research) 8. Measurement quality – response error
a. Frequencies and univariates on all items (to accompany data file rather than included here) b. Pretesting research on instrument quality (summarize or reference if published elsewhere); covers
post collection evaluation of instrument and (if appropriate)reiterates findings from Section IV.2 c. Assessments of enhancements incorporated as result of research on prior collections—(summarize
or reference, if published elsewhere)

23
Exhibit 8 continued VI. Data Quality Assessment continued 9. Measurement quality – response error continued
e. Record check studies (if applicable) f. Effects of basic design features on data quality g. Other measurement error (for example, seam bias, cognitive research, if applicable)
10. Measurement quality – the quality of survey estimates
a. Benchmark final estimates against independent source (if applicable) b. Impact of post collection processing (includes weighting)
Assessment of changes in distributions of key characteristics due to post collection processing
Reduction in measurement error due to post collection processing c. Comparability over time, if applicable (for example, a standard set of quality assessment tables
repeated over rounds of interviewing) d. Seasonal adjustments
11. Total variation (document all known sources and make crude assessment of unmeasured sources of variation)
12. Important limitations (e.g., lack of comparability of reference periods among the surveys that comprise the
Survey of Program Dynamics)
VII Conclusion 1. Recommendations 2. Future research 3. Sources of additional information & Technical Appendices

24
b. Proposed Report Outline for External Users
Timing of publication
We propose that the External DQP be made available with the release of annual survey data on the CE
website (published tables or microdata).
Format and content
Since some variant of the Total Quality Management framework is currently used for reporting on data
quality by most agencies, and this format encompasses all the quality dimensions deemed important to
assess fitness-of-use of the data, we propose that the External DQP adopt this format. Quality
dimensions identified in Step 4 of the framework can be used to organize information by quality
dimensions.
As the review of quality profiles in Section II showed, the level of detail in reporting can vary. As a
starting point, we propose that CE aims to produce an External DQP that addresses the Total Quality
Management dimensions at a summary level. The following reporting elements should also be
considered for inclusion:
Objective(s) / scope of the annual External DQP
Target audience
Survey background (point to links/documents if these description already exist elsewhere)
Summary information on quality dimensions & magnitude of survey errors for the data being released
o if the magnitudes of these errors are unknown, explicitly state this – for examples taken from the European Union’s Labor Force Survey Quality Report 2004:
On Measurement Error - “No estimates of these errors are available. However, the number of proxy interviews, the average number of interviews per interviewer and statistics on the last updates of the questionnaire, are all related to the error sources (of measurement error) listed above.” ~pg. 16
On Processing Errors - “No estimates can be produced indicating the rate of processing errors in the EU-LFS.” ~pg. 18
Highlight and report on innovations/research undertaken to improve survey quality over the past year
Planned research on quality improvement activities in the coming year
Contact information

25
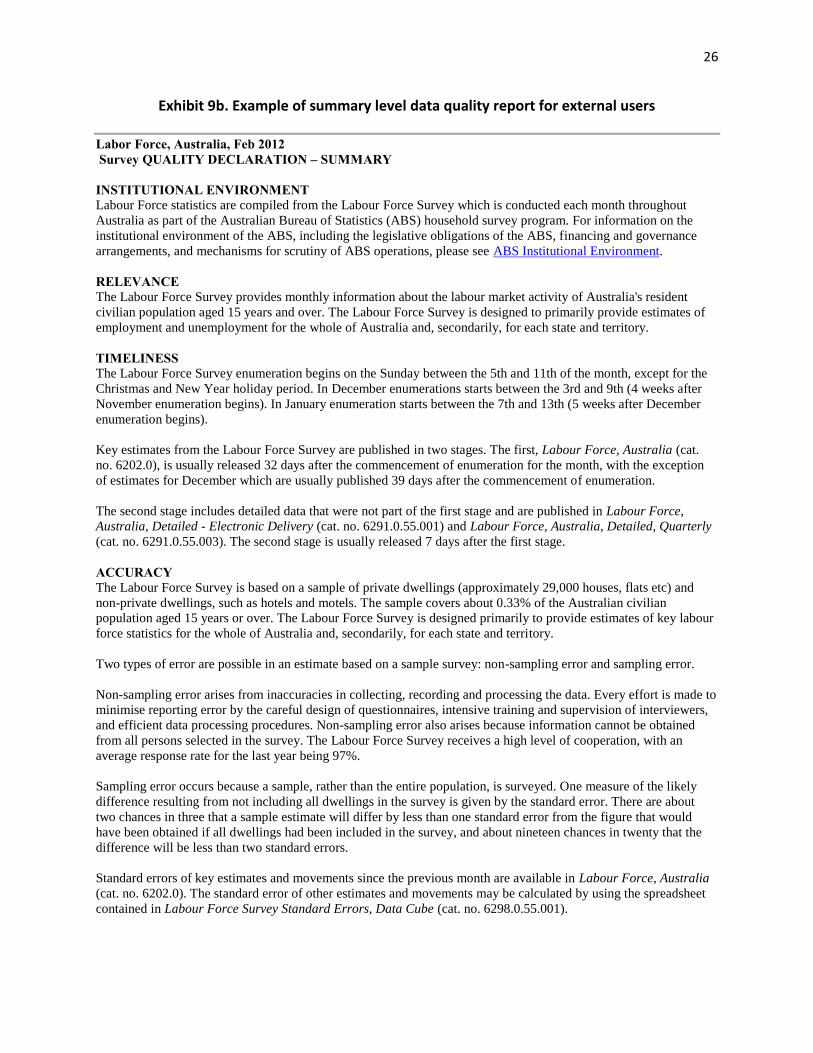
Exhibit 9a provides an illustration of a summary level quality report for external data users from the
Australian Bureau of Statistic, which appears as a tab on the web page for the survey. Exhibit 9b displays
the content of the summary level report.
Exhibit 9a. Example of Summary Quality Declaration as it appears on the ABS web site Source: http://www.abs.gov.au/Ausstats/[email protected]/0/C8EA41B567B547C1CA257927000DBE89?OpenDocument , accessed March 20, 2012.
26
Exhibit 9b. Example of summary level data quality report for external users
Labor Force, Australia, Feb 2012 Survey QUALITY DECLARATION – SUMMARY
INSTITUTIONAL ENVIRONMENT Labour Force statistics are compiled from the Labour Force Survey which is conducted each month throughout
Australia as part of the Australian Bureau of Statistics (ABS) household survey program. For information on the
institutional environment of the ABS, including the legislative obligations of the ABS, financing and governance
arrangements, and mechanisms for scrutiny of ABS operations, please see ABS Institutional Environment.
RELEVANCE The Labour Force Survey provides monthly information about the labour market activity of Australia's resident
civilian population aged 15 years and over. The Labour Force Survey is designed to primarily provide estimates of
employment and unemployment for the whole of Australia and, secondarily, for each state and territory.
TIMELINESS The Labour Force Survey enumeration begins on the Sunday between the 5th and 11th of the month, except for the
Christmas and New Year holiday period. In December enumerations starts between the 3rd and 9th (4 weeks after
November enumeration begins). In January enumeration starts between the 7th and 13th (5 weeks after December
enumeration begins).
Key estimates from the Labour Force Survey are published in two stages. The first, Labour Force, Australia (cat.
no. 6202.0), is usually released 32 days after the commencement of enumeration for the month, with the exception
of estimates for December which are usually published 39 days after the commencement of enumeration.
The second stage includes detailed data that were not part of the first stage and are published in Labour Force,
Australia, Detailed - Electronic Delivery (cat. no. 6291.0.55.001) and Labour Force, Australia, Detailed, Quarterly
(cat. no. 6291.0.55.003). The second stage is usually released 7 days after the first stage.
ACCURACY The Labour Force Survey is based on a sample of private dwellings (approximately 29,000 houses, flats etc) and
non-private dwellings, such as hotels and motels. The sample covers about 0.33% of the Australian civilian
population aged 15 years or over. The Labour Force Survey is designed primarily to provide estimates of key labour
force statistics for the whole of Australia and, secondarily, for each state and territory.
Two types of error are possible in an estimate based on a sample survey: non-sampling error and sampling error.
Non-sampling error arises from inaccuracies in collecting, recording and processing the data. Every effort is made to
minimise reporting error by the careful design of questionnaires, intensive training and supervision of interviewers,
and efficient data processing procedures. Non-sampling error also arises because information cannot be obtained
from all persons selected in the survey. The Labour Force Survey receives a high level of cooperation, with an
average response rate for the last year being 97%.
Sampling error occurs because a sample, rather than the entire population, is surveyed. One measure of the likely
difference resulting from not including all dwellings in the survey is given by the standard error. There are about
two chances in three that a sample estimate will differ by less than one standard error from the figure that would
have been obtained if all dwellings had been included in the survey, and about nineteen chances in twenty that the
difference will be less than two standard errors.
Standard errors of key estimates and movements since the previous month are available in Labour Force, Australia
(cat. no. 6202.0). The standard error of other estimates and movements may be calculated by using the spreadsheet
contained in Labour Force Survey Standard Errors, Data Cube (cat. no. 6298.0.55.001).

27
Exhibit 9b continued.
COHERENCE The ABS has been conducting the Labour Force Survey each month since February 1978. While seeking to provide
a high degree of consistency and comparability over time by minimising changes to the survey, sound survey
practice requires careful and continuing maintenance and development to maintain the integrity of the data and the
efficiency of the collection.
The changes which have been made to the Labour Force Survey have included changes in sampling methods,
estimation methods, concepts, data item definitions, classifications, and time series analysis techniques. In
introducing these changes the ABS has generally revised previous estimates to ensure consistency and coherence
with current estimates. For a full list of changes made to the Labour Force Survey see Chapter 20 in Labour
Statistics: Concepts, Sources and Methods (cat. no. 6102.0.55.001).
INTERPRETABILITY The key estimates from the Labour Force Survey are available as original, seasonally adjusted and trend series.
Seasonal adjustment is a means of removing the effects of normal seasonal variation from the series so other
influences on the series can be more clearly recognised. Seasonal adjustment does not aim to remove the irregular
influences which may be present and therefore month-to-month movements may not be reliable indicators of
underlying behaviour. To assist in interpreting the underlying behaviour, the ABS produces the trend series by
smoothing the seasonally adjusted series to reduce the impact of the irregular component. For further information,
see A Guide to Interpreting Time Series - Monitoring Trends (cat. no. 1349.0).
Further information on the terminology and other technical aspects associated with statistics from the Labour Force
Survey can be found in the publication Labour Force, Australia (cat. no. 6202.0), which contains detailed
Explanatory Notes, Standard Error information and a Glossary.
ACCESSIBILITY
Please see the Related Information tab for the list of products that are available from this collection.
Source: http://www.abs.gov.au/Ausstats/[email protected]/0/C8EA41B567B547C1CA257927000DBE89?OpenDocument ,
accessed March 20, 2012.

28
5. Discussion
The Team’s objectives for this proposal were to propose content and an outline of procedures for
producing an annual CE Data Quality Profile.6 A summary review of the development and content of
data quality profiles produced for other surveys was presented in Section 2. A high level description of a
framework for creating, maintaining and reporting on quality information was described in Section 3. A
high-level outline of possible content of data quality reports for internal program staff and external data
users was presented in Section 4. We did not include specific recommendations on metrics of methods
for quality monitoring because we realized our lack of survey activity-specific knowledge, from which
these recommendations should arise.
We have proposed a framework that is built around survey operations, and leveraging the expertise of
staff who perform these specific survey activities. The motivation for the framework we proposed
stemmed from the recognition that:
Identifying appropriate quality monitoring methods or metrics will require familiarity with a
survey activity to understand the issues or concerns associated it; a general understanding may
not be sufficient;
There is a high cost in terms of resources and commitment to establishing the information base
necessary to produce reports on quality. In order for this effort to be sustainable, the benefits
from it must be relevant and useful to survey operations, apart from providing external data
users information about quality to help them assess fitness of use of the CE survey products for
their applications.
Our proposed framework is very much in the spirit of the approach taken by Statistics Sweden to
develop quality indicators (Biemer and Trewin 2012), and can be viewed as taking a preliminary step to
building the information bases necessary to perform the type of overall quality evaluation they did for
their survey products. The objectives such a framework attempts to achieve are to:
identify (potential) sources of error
develop awareness of the relative risks of these errors, and quantify them where possible
6 Team charter (version November 9, 2011), Phase 1 Deliverable #3.

29
identify gaps in methodology
promote the use and integration of monitoring information
help prioritize areas that need improvement in survey operations.
If this proposed framework is accepted, its implementation will necessarily be an iterative process
(starting out with one survey stage, then scaling up to include more survey stages) as we will need to
learn how to operationalize the general principles and guidelines proposed, to understand what level of
detail of quality monitoring about survey activities is useful, and last but not least, to demonstrate if and
how this approach is useful to the managing and monitoring quality for survey operations.

30
References
Australian Bureau of Statistics (2010). Quality Management of Statistical Processes Using Quality Gates, ABS 2010, Catalogue No. 1540.0. The Australian Bureau of Statistics Data Quality Framework http://www.abs.gov.au/websitedbs/D3310114.nsf/home/Quality:+The+ABS+Data+Quality+Framework, accessed on March 20, 2012.
Biemer, Paul P., and Lars E. Lyberg. (2003). Introduction to Survey Quality, New York: Wiley. Biemer, P., and Trewin, D. (2012). Development of Quality Indicators at Statistics Sweden. Report dated January 9, 2012 submitted to Statistics Sweden. Brackstone, G. (1999). Managing Data Quality in a Statistical Agency, Survey Methodology, 25(2): 139-149. Chakrabarty, R. and Torres, G. (1996). American Housing Survey: A Quality Profile. Washington, DC: U.S. Department of Housing and Urban Development and U.S. Department of Commerce. (Current Housing Reports H121/95-1). Doyle, P. and Clark, C. (2001). Quality Profiles and Data Users. Paper presented at the International Conference on Quality in Official Statistics, Session 36. Federal Committee on Statistical Methodology (1978). An Error Profile: Employment as Measured by the Current Population Survey. (Statistical Policy Working Paper 3, NTIS PB86-214269/AS.) Washington, DC: U.S. Department of Commerce. Fricker, S. , Stringer, C., and Tan, L. (2012a). Proposed Regional Office Consolidation Monitoring Metrics for the Consumer Expenditure Interview Survey. Division of Consumer Expenditure Survey Internal Report. Fricker, S. , Stringer, C., and Tan, L. (2012b). Proposed Regional Office Consolidation Monitoring Metrics for the Consumer Expenditure Diary Survey. Division of Consumer Expenditure Survey Internal Report. Gonzalez, J., Hackett, C., To, N., and Tan, L. (2009). Definition of Data Quality for the Consumer Expenditure Survey: A Proposal. Division of Consumer Expenditure Survey Internal Report. Groves, Robert M. 1989. Survey Errors and Survey Costs, New York: Wiley. Groves, Robert M., Floyd J. Fowler J, Mick P. Couper, Jame M. Lepkowski, Eleanor Singer, and Roger Rourangeau. 2004. Survey Methodology, New York: Wiley. Kalton, G., Winglee, M., Krawchuk, S., and Levine, D. (2000). Quality Profile for SASS: Rounds 1 – 3: 1987 – 1995. Washington, DC: U.S. Department of Education, National Center for Education Statistics (NCES 2000-308).

31
Kasprzyk, D. and Kalton, G. (2001). Quality Profiles in U.S. Statistical Agencies. Paper presented at the International Conference on Quality in Official Statistics, Session 36. Lundström, S. & Särndal, C.-E. (2001). Estimation in the presence of Nonresponse and Frame Imperfections. Stockholm: Statistiska centralbyrån. Lyberg, L. E., & Biemer, P. P. (2008). Quality assurance and quality control in surveys. In E. D. de Leeuw, J. J. Hox, & D. A. Dillman (Eds.), International handbook of survey methodology. New York/London: Lawrence Erlbaum Associates/Taylor & Francis Group. Nicoletti, C., F. Peracchi, and F. Foliano, 2007. Estimating income poverty in the presence of measurement error and missing data problems. ISER Working Paper Series (NO 2007-15). Office of National Statistics. (?). GSS Quality Measurement and Reporting: Guidance Statement and a Framework for Reporting. Retrieved March 20, 2012 from http://www.ons.gov.uk/ons/guide-method/best-practice/gss-best-practice/gss-quality-good-practice/quality-measurement-and-reporting-guidance/quality-measurement-and-reporting-guidance.html Survey Research Center. (2010). Guidelines for Best Practice in Cross-Cultural Surveys. Ann Arbor, MI: Survey Research Center, Institute for Social Research, University of Michigan. Retrieved February 29, 2012 from http://www.ccsg.isr.umich.edu/. U.S. Bureau of the Census (1998). Survey of Income and Program Participation (SIPP) Quality Profile. 3rd Edition. Washington, DC: U.S. Department of Commerce. U.S. Energy Information Administration (1996). Residential Energy Consumption Survey Quality Profile. Washington, DC: U.S. Department of Energy.

32
Appendix A. Definitions of quality dimensions
Reproduced from Table 1 in Gonzalez et al. (2009)
Exhibit A1. Total Quality Management Dimensions of Quality
Dimension and Definition Examples for the CE
1. Relevance The degree to which the survey products meets the user’s specific needs in terms of both content and coverage.
Relative shares of expenditure categories are used in the formation of the Consumer Price Index (CPI) weights. Failure of the CE to capture certain types of expenditures may result in the misrepresentation of the relative shares of expenditure categories.
2. Accuracy The degree to which the estimate is similar to the true value of the population parameter. The difference between the estimate and the true value is the Total Survey Error.
Error in the measurement of actual purchases could result in the misrepresentation of relative shares.
3. Coherence Degree to which different sources or methods on the same phenomenon are similar.
If there are other data sources that describe US households’ out-of-pocket spending patterns, to what degree are the key estimates from these other sources similar to those from the CE?
4. Timeliness The interval between the time data are made available to users and the event or the phenomena the data describe.
The superlative CPI, which allows for changes in consumer spending behavior in response to changes in the relative prices of CPI item categories, is based on weights constructed from the CE that lag two years.
5. Accessibility The ease with which statistical information and appropriate documentation describing that information can be obtained from the statistical organization.
Tabulated data are published on CE’s public website. Microdata are available for purchase. Data users can contact CE by phone, fax, mail, and email. CE responds promptly to data inquiries.
6. Interpretability Availability of adequate information to allow users to properly use and interpret the survey products.
CE provides information on survey metadata, data quality information and indicators on CE’s public website.
33
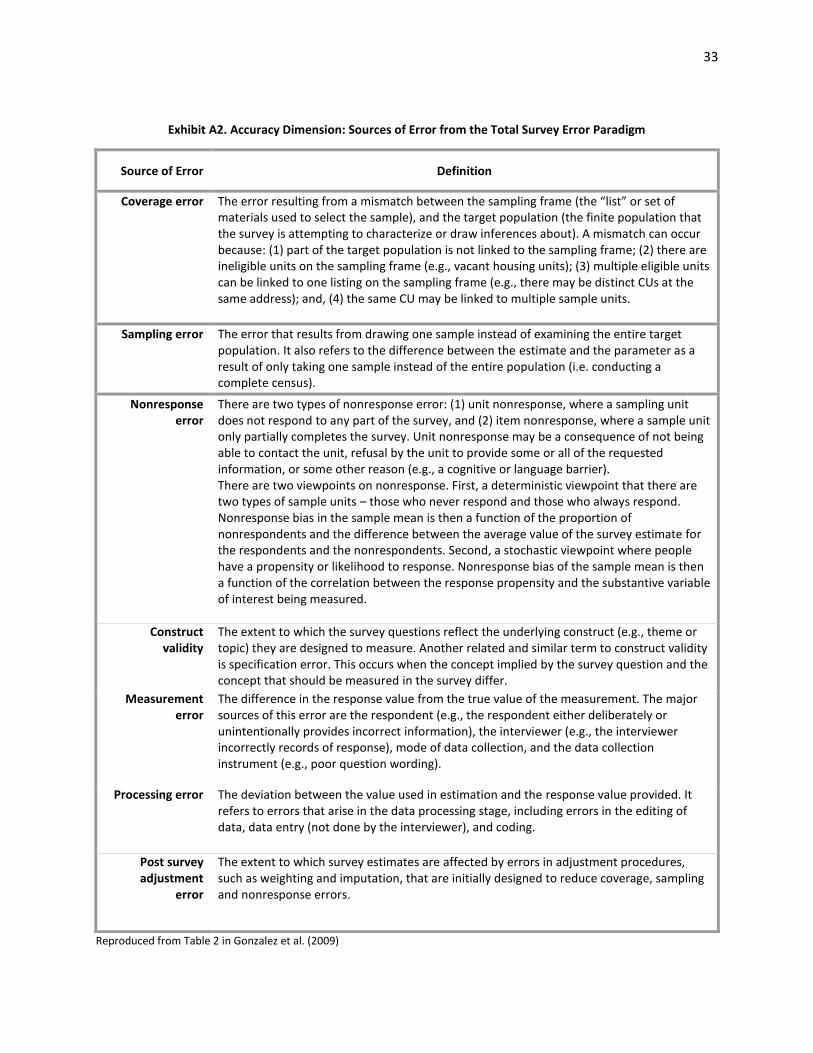
Reproduced from Table 2 in Gonzalez et al. (2009)
Exhibit A2. Accuracy Dimension: Sources of Error from the Total Survey Error Paradigm
Source of Error Definition
Coverage error The error resulting from a mismatch between the sampling frame (the “list” or set of materials used to select the sample), and the target population (the finite population that the survey is attempting to characterize or draw inferences about). A mismatch can occur because: (1) part of the target population is not linked to the sampling frame; (2) there are ineligible units on the sampling frame (e.g., vacant housing units); (3) multiple eligible units can be linked to one listing on the sampling frame (e.g., there may be distinct CUs at the same address); and, (4) the same CU may be linked to multiple sample units.
Sampling error The error that results from drawing one sample instead of examining the entire target population. It also refers to the difference between the estimate and the parameter as a result of only taking one sample instead of the entire population (i.e. conducting a complete census).
Nonresponse error
There are two types of nonresponse error: (1) unit nonresponse, where a sampling unit does not respond to any part of the survey, and (2) item nonresponse, where a sample unit only partially completes the survey. Unit nonresponse may be a consequence of not being able to contact the unit, refusal by the unit to provide some or all of the requested information, or some other reason (e.g., a cognitive or language barrier). There are two viewpoints on nonresponse. First, a deterministic viewpoint that there are two types of sample units – those who never respond and those who always respond. Nonresponse bias in the sample mean is then a function of the proportion of nonrespondents and the difference between the average value of the survey estimate for the respondents and the nonrespondents. Second, a stochastic viewpoint where people have a propensity or likelihood to response. Nonresponse bias of the sample mean is then a function of the correlation between the response propensity and the substantive variable of interest being measured.
Construct validity
The extent to which the survey questions reflect the underlying construct (e.g., theme or topic) they are designed to measure. Another related and similar term to construct validity is specification error. This occurs when the concept implied by the survey question and the concept that should be measured in the survey differ.
Measurement error
The difference in the response value from the true value of the measurement. The major sources of this error are the respondent (e.g., the respondent either deliberately or unintentionally provides incorrect information), the interviewer (e.g., the interviewer incorrectly records of response), mode of data collection, and the data collection instrument (e.g., poor question wording).
Processing error The deviation between the value used in estimation and the response value provided. It refers to errors that arise in the data processing stage, including errors in the editing of data, data entry (not done by the interviewer), and coding.
Post survey adjustment
error
The extent to which survey estimates are affected by errors in adjustment procedures, such as weighting and imputation, that are initially designed to reduce coverage, sampling and nonresponse errors.

34
In addition, Survey Research Center (2010) also considered four additional factors that may affect fitness
for use – optimization of costs, minimization of burden on respondents and interviewers, staff
professionalism, and design constraints. The effect of these factors on quality dimensions are
represented in Exhibit A3.
Exhibit A3. Dimensions of Survey Quality
35
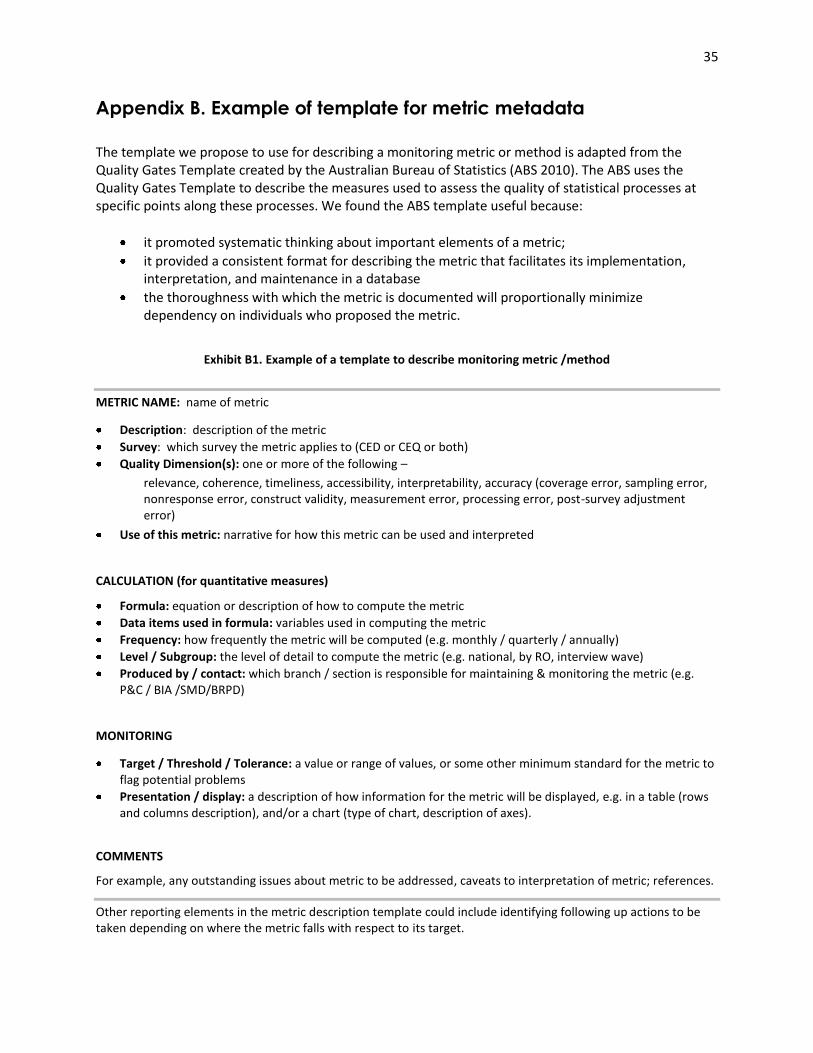
Appendix B. Example of template for metric metadata
The template we propose to use for describing a monitoring metric or method is adapted from the Quality Gates Template created by the Australian Bureau of Statistics (ABS 2010). The ABS uses the Quality Gates Template to describe the measures used to assess the quality of statistical processes at specific points along these processes. We found the ABS template useful because:
it promoted systematic thinking about important elements of a metric;
it provided a consistent format for describing the metric that facilitates its implementation, interpretation, and maintenance in a database
the thoroughness with which the metric is documented will proportionally minimize dependency on individuals who proposed the metric.
Exhibit B1. Example of a template to describe monitoring metric /method
METRIC NAME: name of metric
Description: description of the metric
Survey: which survey the metric applies to (CED or CEQ or both)
Quality Dimension(s): one or more of the following –
relevance, coherence, timeliness, accessibility, interpretability, accuracy (coverage error, sampling error, nonresponse error, construct validity, measurement error, processing error, post-survey adjustment error)
Use of this metric: narrative for how this metric can be used and interpreted
CALCULATION (for quantitative measures)
Formula: equation or description of how to compute the metric
Data items used in formula: variables used in computing the metric
Frequency: how frequently the metric will be computed (e.g. monthly / quarterly / annually)
Level / Subgroup: the level of detail to compute the metric (e.g. national, by RO, interview wave)
Produced by / contact: which branch / section is responsible for maintaining & monitoring the metric (e.g. P&C / BIA /SMD/BRPD)
MONITORING
Target / Threshold / Tolerance: a value or range of values, or some other minimum standard for the metric to flag potential problems
Presentation / display: a description of how information for the metric will be displayed, e.g. in a table (rows and columns description), and/or a chart (type of chart, description of axes).
COMMENTS
For example, any outstanding issues about metric to be addressed, caveats to interpretation of metric; references.
Other reporting elements in the metric description template could include identifying following up actions to be taken depending on where the metric falls with respect to its target.

36
Exhibit B2. Example of qualitative metric description using template
Source: ABS(2010), page 21.