Embed Size (px)
Citation preview

Keeyask Generation Project
April 2013
Aq
uatic Effects
Mon
itoring
Plan
PRELIMINARY DRAFT
Aquatic Effects Monitoring Plan
KEEYASK GENERATION PROJECT
AQUATIC EFFECTS
MONITORING PLAN
DRAFT
Prepared by
Keeyask Hydropower Limited Partnership
Winnipeg, Manitoba
October 2012
Canadian Environmental Assessment
Registry Reference Number: 11-03-64144
PREFACE
KEEYASK ENVIRONMENTAL PROTECTION PROGRAM
An Environmental Protection Program (the Program) has been developed to mitigate, manage and monitor potential environmental effects described in the Keeyask Generation Project: Response to EIS Guidelines during the construction and operation phases of the Keeyask Generation Project (the Project) shown on Map 1(Drafters Note: general location map to be inserted). The Program includes a collection of plans grouped in the following categories: Environmental Protection Plans, Environmental Management Plans, and Environmental Monitoring Plans.
Figure 1 lists all of the plans included in the Program. It also demonstrates how the Program will be managed. The Keeyask Hydropower Limited Partnership (the Partnership) has delegated authority to Manitoba Hydro to manage construction and operation of the Project including implementation of the Program. The organizational structure of the Partnership for this aspect of the Project includes a Monitoring Advisory Committee (MAC), which includes participants from each of the Keeyask Cree Nations (KCNs) and Manitoba Hydro. Manitoba Hydro will be guided on the implementation of the Program by the MAC, the Partnership Board of Directors and ongoing discussion with Regulators.

Keeyask Hydropower Limited Partnership (KHLP)
Manitoba Hydro Project Manager
Monitoring Advisory Committee
(MAC including Manitoba Hydro and
KCNs)
Feedback
Environmental Protection Program(the Program)
Environmental Protection Plans
(EnvPPs)
• Generating Station• South Access Road
Environmental Management Plans
• Sediment Management Plan• Fish Habitat Compensation Plan• Access Management Plan• Heritage Resources Protection Plan• Vegetation Rehabilitation Plan• Terrestrial Mitigation Implementation Plan• Waterways Management Plan• Reservoir Clearing Plan
Environmental Monitoring Plans
Technical Science
• Physical Environment
• Aquatic Effects• Terrestrial Effects• Socio-Economic• Resource Use
Aboriginal Traditional Knowledge
(ATK)• Tataskweyak Cree
Nation• War Lake First
Nation• York Factory First
Nation• Fox Lake Cree
Nation
Figure 1: Environmental Protection Program
The Environmental Protection Plans (EnvPPs) provide detailed, site-specific environmental protection measures to be implemented by the contractors and construction staff to minimize environmental effects from construction of the generating station and south access road. They are designed for use as reference documents providing the best management practices to meet or exceed regulatory requirements. EnvPPs are organized by construction activity, highlighting measures to reduce the impact of a specific work activity (e.g., tree clearing or material placement in water). Contractors’ compliance with the EnvPPs is a contractual obligation. Under Manitoba Hydro’s construction site management, a Site Environmental Officer will be responsible for monitoring compliance and determining when corrective actions are required.
The Environmental Management Plans focus on minimizing effects on specific environmental parameters. They outline specific actions that must be taken during construction and in some cases into the operational phase to mitigate Project effects. The management plans include monitoring to determine success of the actions taken and to determine other actions that need to be undertaken (adaptive management). Implementation of these plans will involve Manitoba Hydro’s staff, the KCNs, specialized consultants and contractors under the direction of the Project Manager.
The Environmental Monitoring Plans are designed to measure the actual effects of the Project, test predictions or identify unanticipated effects. During the course of the environmental assessment, numerous requirements for monitoring were identified. There will be both technical science monitoring and Aboriginal

Traditional Knowledge (ATK) monitoring undertaken. The technical science monitoring will be conducted by Manitoba Hydro and specialized consultants contracted by Manitoba Hydro, who will in turn hire members of the KCNs to work with them to fulfil the monitoring activities. Manitoba Hydro will also have contracts with each of the KCNs to undertake ATK monitoring of the project.
The activities that occur and the results generated from the Environmental Protection Program will be discussed at MAC meetings. The MAC is an advisory committee to the Partnership Board of Directors and will review outcomes of the programs and, if appropriate provide advice and recommendations to the Partnership on additional monitoring or alternative mitigation measures that may be required. The MAC will provide a forum for collaboration among all partners. On behalf of the Partnership, the MAC will also ensure that the outcomes of the Environmental Protection Program are communicated more broadly on an annual basis to Members of the KCNs, regulators and the general public.
KEEYASK GENERATION PROJECT DRAFT - October 2012
AQUATIC EFFECTS MONITORING PLAN i
TABLE OF CONTENTS
1.0 INTRODUCTION ................................................................................... 1
1.1 SUMMARY OF AEMP COMPONENTS AND RELATED PROGRAMS .......................... 4
1.1.1 Summary of AEMP Components ........................................................... 4
1.1.1.1 Water Quality ....................................................................................... 4
1.1.1.2 Aquatic Habitat ................................................................................... 5
1.1.1.3 Aquatic Macroinvertebrates ................................................................ 5
1.1.1.4 Fish Community .................................................................................. 5
1.1.1.5 Lake Sturgeon ...................................................................................... 6
1.1.1.6 Mercury in Fish Flesh .......................................................................... 6
1.1.2 Summary of Physical Environment Monitoring Information Relevant to the AEMP ............................................................................ 6
1.1.3 Coordinated Aquatic Monitoring Program (CAMP) .............................. 7
1.2 MONITORING SCHEDULE .................................................................................. 10
1.3 STUDY AREA ...................................................................................................... 13
1.3.1 Project Effects Study Area .................................................................... 13
1.3.2 Reference Sampling Sites ...................................................................... 13
2.0 WATER QUALITY .................................................................................. 17
2.1 MONITORING DURING CONSTRUCTION ............................................................ 17
2.1.1 Pathways of Effect and Key Questions ................................................. 18
2.1.2 Core Monitoring .................................................................................... 18
2.1.2.1 Monitoring Area ................................................................................. 18
2.1.2.2 Sampling Design ................................................................................ 18
2.1.2.3 Parameters .......................................................................................... 20
2.1.2.4 Sampling Sites .................................................................................... 20
2.1.2.5 Sampling Frequency and Schedule .................................................... 22
2.1.2.6 Methods .............................................................................................. 22
2.1.2.7 Quality Assurance and Quality Control .............................................. 22
2.1.3 Specific Effects Monitoring .................................................................. 23
2.2 MONITORING DURING OPERATION .................................................................. 23
2.2.1 Pathways of Effect and Key Questions ................................................. 23
KEEYASK GENERATION PROJECT DRAFT - October 2012
AQUATIC EFFECTS MONITORING PLAN ii
2.2.2 Core Monitoring .................................................................................... 24
2.2.2.1 Monitoring Area ................................................................................. 24
2.2.2.2 Sampling Design ................................................................................ 24
2.2.2.3 Parameters ......................................................................................... 24
2.2.2.4 Sample Sites ....................................................................................... 26
2.2.2.5 Sampling Frequency and Schedule ................................................... 26
2.2.2.6 Methods ............................................................................................. 27
2.2.2.7 Quality Assurance/Quality Control ................................................... 27
2.2.3 Specific Effects Monitoring .................................................................. 27
3.0 AQUATIC HABITAT ............................................................................. 28
3.1 MONITORING DURING CONSTRUCTION ............................................................ 28
3.2 MONITORING DURING OPERATION .................................................................. 28
3.2.1 Pathways of Effect and Key Questions ................................................. 28
3.2.2 Core Monitoring .................................................................................... 29
3.2.2.1 Development of Nearshore and Aquatic Macrophyte Habitat ............................................................................................... 29
3.2.2.1.1 Monitoring Area .................................................................... 29
3.2.2.1.2 Sampling Design and Methods ......................................... 29
3.2.2.1.3 Parameters .......................................................................... 31
3.2.2.1.4 Sampling Sites .................................................................... 31
3.2.2.1.5 Sampling Frequency and Schedule .................................... 31
3.2.2.2 Substrate Composition ........................................................................ 31
3.2.2.2.1 Monitoring Area ................................................................ 32
3.2.2.2.2 Sampling Design and Methods ......................................... 32
3.2.2.2.3 Parameters ......................................................................... 32
3.2.2.2.4 Sampling Sites ................................................................... 32
3.2.2.2.5 Sampling Frequency and Schedule ................................... 32
3.2.3 Specific Effects Monitoring .................................................................. 33
3.2.3.1 Monitoring Area ................................................................................. 33
3.2.3.2 Sampling Design and Methods ......................................................... 33
3.2.3.3 Parameters ......................................................................................... 34
3.2.3.4 Sampling Sites .................................................................................... 34
3.2.3.5 Sampling Frequency and Schedule ................................................... 34
KEEYASK GENERATION PROJECT DRAFT - October 2012
AQUATIC EFFECTS MONITORING PLAN iii
4.0 AQUATIC MACROINVERTEBRATES ............................................... 35
4.1 MONITORING DURING CONSTRUCTION ............................................................ 35
4.1.1 Pathways of Effect and Key Question .................................................. 35
4.1.2 Core Monitoring .................................................................................... 36
4.1.2.1 Monitoring Area ................................................................................. 36
4.1.2.2 Sampling Design ................................................................................ 36
4.1.2.3 Parameters .......................................................................................... 36
4.1.2.4 Sampling Sites .................................................................................... 37
4.1.2.5 Sampling Frequency and Schedule .................................................... 37
4.1.2.6 Methods .............................................................................................. 37
4.2 MONITORING DURING OPERATION .................................................................. 38
4.2.1 Pathways of Effect and Key Questions ................................................. 38
4.2.1.1 Outlet of Clark Lake to the Keeyask GS ............................................. 38
4.2.1.2 Downstream of the Keeyask GS ......................................................... 39
4.2.2 Core Monitoring .................................................................................... 39
4.2.2.1 Monitoring Area ................................................................................. 39
4.2.2.2 Sampling Design ................................................................................ 43
4.2.2.3 Parameters .......................................................................................... 43
4.2.2.4 Sampling Sites .................................................................................... 43
4.2.2.5 Sampling Frequency and Schedule .................................................... 43
4.2.2.6 Methods .............................................................................................. 43
5.0 FISH COMMUNITY .............................................................................. 45
5.1 MONITORING DURING CONSTRUCTION ............................................................ 45
5.1.1 Pathways of Effect and Key Questions ................................................. 45
5.1.2 Core Monitoring .................................................................................... 46
5.1.2.1 Monitoring Area ................................................................................. 46
5.1.2.2 Sampling Design ................................................................................ 46
5.1.2.3 Parameters .......................................................................................... 46
5.1.2.4 Sampling Sites .................................................................................... 48
5.1.2.5 Sampling Frequency and Schedule .................................................... 48
5.1.2.6 Methods .............................................................................................. 48
5.1.3 Specific Effects Monitoring .................................................................. 49
5.1.3.1 Monitoring Area ................................................................................. 49

KEEYASK GENERATION PROJECT DRAFT - October 2012
AQUATIC EFFECTS MONITORING PLAN iv
5.1.3.2 Sampling Design ................................................................................ 49
5.1.3.3 Parameters ......................................................................................... 49
5.1.3.4 Sampling Sites .................................................................................... 49
5.1.3.5 Sampling Frequency and Schedule ................................................... 49
5.1.3.6 Methods ............................................................................................. 50
5.2 MONITORING DURING OPERATION .................................................................. 50
5.2.1 Pathways of Effect and Key Questions ................................................. 50
5.2.2 Core Monitoring .................................................................................... 52
5.2.2.1 Fish Community Composition and Abundance in the Keeyask Reservoir .............................................................................. 52
5.2.2.1.1 Monitoring Area .................................................................... 52
5.2.2.1.2 Sampling Design ............................................................... 52
5.2.2.1.3 Parameters ......................................................................... 56
5.2.2.1.4 Sampling Sites ................................................................... 56
5.2.2.1.5 Sampling Frequency and Schedule ................................... 56
5.2.2.1.6 Methods ............................................................................. 56
5.2.2.2 Fish Movements ................................................................................ 56
5.2.2.2.1 Monitoring Area ................................................................ 57
5.2.2.2.2 Sampling Design ............................................................... 57
5.2.2.2.3 Parameters ......................................................................... 57
5.2.2.2.4 Sampling Sites ................................................................... 58
5.2.2.2.5 Sampling Frequency and Schedule ................................... 58
5.2.2.2.6 Methods ............................................................................ 59
5.2.3 Specific Effects Monitoring .................................................................. 59
5.2.3.1 Monitoring of Fish Gas Bubble Trauma ........................................... 59
5.2.3.1.1 Monitoring Area .................................................................... 59
5.2.3.1.2 Sampling Design ............................................................... 59
5.2.3.1.3 Parameters ......................................................................... 60
5.2.3.1.4 Sampling Sites ................................................................... 60
5.2.3.1.5 Sampling Frequency and Schedule ................................... 60
5.2.3.1.6 Methods ............................................................................. 60
5.2.3.2 Use of Existing and Created Spawning Habitat ................................ 61
5.2.3.2.1 Monitoring Area ................................................................. 61
5.2.3.2.2 Sampling Design ................................................................ 61
KEEYASK GENERATION PROJECT DRAFT - October 2012
AQUATIC EFFECTS MONITORING PLAN v
5.2.3.2.3 Parameters ......................................................................... 61
5.2.3.2.4 Sampling Sites .................................................................... 61
5.2.3.2.5 Sampling Frequency and Schedule ................................... 61
5.2.3.2.6 Methods ............................................................................. 61
5.2.3.3 Turbine and Spillway Mortality Study ................................................ 65
5.2.3.3.1 Monitoring Area ................................................................. 65
5.2.3.3.2 Sampling Design ................................................................ 65
5.2.3.3.3 Parameters ......................................................................... 65
5.2.3.3.4 Sampling Sites .................................................................... 65
5.2.3.3.5 Sampling Frequency and Schedule ................................... 66
5.2.3.3.6 Methods ............................................................................. 66
5.2.3.4 Fish Stranding Following Spill Events ............................................... 66
5.2.3.4.1 Monitoring Area ................................................................. 66
5.2.3.4.2 Sampling Design ................................................................ 66
5.2.3.4.3 Parameters ......................................................................... 67
5.2.3.4.4 Sampling Sites .................................................................... 67
5.2.3.4.5 Sampling Frequency and Schedule ................................... 67
5.2.3.4.6 Methods ............................................................................. 67
5.2.3.5 Experimental Catch and Transport Monitoring ................................ 67
5.2.3.5.1 Monitoring Area ................................................................. 67
5.2.3.5.2 Sampling Design ................................................................ 68
5.2.3.5.3 Parameters ......................................................................... 68
5.2.3.5.4 Sampling Sites .................................................................... 69
5.2.3.5.5 Sampling Frequency and Schedule ................................... 69
5.2.3.5.6 Methods ............................................................................. 69
5.2.3.6 Fish Winterkill in Area of Little Gull Lake ......................................... 69
5.2.3.6.1 Monitoring Area ................................................................. 70
5.2.3.6.2 Sampling Design ................................................................ 70
5.2.3.6.3 Parameters ......................................................................... 70
5.2.3.6.4 Sampling Sites .................................................................... 70
5.2.3.6.5 Sampling Frequency and Schedule ................................... 70
5.2.3.6.6 Methods ............................................................................. 70
6.0 LAKE STURGEON ................................................................................. 71
6.1 MONITORING DURING CONSTRUCTION ............................................................ 75

KEEYASK GENERATION PROJECT DRAFT - October 2012
AQUATIC EFFECTS MONITORING PLAN vi
6.1.1 Pathways of Effect and Key Questions ................................................. 75
6.1.2 Core Monitoring .................................................................................... 76
6.1.2.1 Abundance and Biological Metric Monitoring .................................. 76
6.1.2.1.1 Monitoring Area .................................................................... 76
6.1.2.1.2 Sampling Design ................................................................... 76
6.1.2.1.3 Parameters ............................................................................. 76
6.1.2.1.4 Sampling Sites ....................................................................... 76
6.1.2.1.5 Sampling Frequency and Schedule ....................................... 77
6.1.2.1.6 Methods ................................................................................. 77
6.1.2.2 Macro-scale Movement/Habitat Use Monitoring ............................ 77
6.1.2.2.1 Monitoring Area .................................................................... 77
6.1.2.2.2 Sampling Design ............................................................... 77
6.1.2.2.3 Parameters ......................................................................... 78
6.1.2.2.4 Sampling Sites ................................................................... 79
6.1.2.2.5 Sampling Frequency and Schedule ................................... 79
6.1.2.2.6 Methods ............................................................................. 79
6.1.2.3 Recruitment/Year-class Strength Monitoring ................................... 79
6.1.2.3.1 Monitoring Area .................................................................... 79
6.1.2.3.2 Sampling Design ............................................................... 79
6.1.2.3.3 Parameters ......................................................................... 79
6.1.2.3.4 Sampling Sites ................................................................... 80
6.1.2.3.5 Sampling Frequency and Schedule ................................... 80
6.1.2.3.6 Methods ............................................................................. 80
6.2 MONITORING DURING OPERATION .................................................................. 80
6.2.1 Pathways of Effect and Key Questions ................................................. 80
6.2.2 Core Monitoring .................................................................................... 82
6.2.2.1 Abundance and Biological Metric Monitoring .................................. 82
6.2.2.2 Macro-scale Movement/Habitat Use Monitoring ............................ 82
6.2.2.3 Recruitment/Year-class Strength Monitoring ................................... 83
6.2.3 Specific Effects Monitoring .................................................................. 83
6.2.3.1 Spawning Area Identification ............................................................ 83
6.2.3.1.1 Monitoring Area .................................................................... 83
6.2.3.1.2 Sampling Design ............................................................... 83
6.2.3.1.3 Parameters ......................................................................... 83

KEEYASK GENERATION PROJECT DRAFT - October 2012
AQUATIC EFFECTS MONITORING PLAN vii
6.2.3.1.4 Sampling Sites .................................................................... 84
6.2.3.1.5 Sampling Frequency and Schedule .................................... 84
6.2.3.1.6 Methods ............................................................................. 84
6.2.3.2 Egg Deposition Monitoring ............................................................... 84
6.2.3.2.1 Monitoring Area ................................................................. 84
6.2.3.2.2 Sampling Design ................................................................ 84
6.2.3.2.3 Parameters ......................................................................... 84
6.2.3.2.4 Sampling Sites .................................................................... 85
6.2.3.2.5 Sampling Frequency and Schedule ................................... 85
6.2.3.2.6 Methods ............................................................................. 85
6.2.3.3 Larval Hatch and Drift Monitoring .................................................... 85
6.2.3.3.1 Monitoring Area ................................................................. 85
6.2.3.3.2 Sampling Design ................................................................ 85
6.2.3.3.3 Parameters ......................................................................... 85
6.2.3.3.4 Sampling Sites .................................................................... 85
6.2.3.3.5 Sampling Frequency and Schedule ................................... 86
6.2.3.3.6 Methods ............................................................................. 86
7.0 MERCURY IN FISH FLESH ................................................................ 87
7.1 MONITORING DURING CONSTRUCTION ............................................................ 87
7.2 MONITORING DURING OPERATION .................................................................. 87
7.2.1 Pathways of Effect and Key Questions ................................................. 87
7.2.2 Monitoring Area .................................................................................... 88
7.2.3 Sampling Design ................................................................................... 88
7.2.4 Parameters ............................................................................................. 90
7.2.5 Sampling Sites ....................................................................................... 90
7.2.5.1.1 Sampling Frequency and Schedule ........................................ 90
7.2.5.2 Methods .............................................................................................. 91
8.0 REFERENCES ....................................................................................... 92
8.1 LITERATURE CITED ........................................................................................... 92

KEEYASK GENERATION PROJECT DRAFT - October 2012
AQUATIC EFFECTS MONITORING PLAN viii
LIST OF TABLES
Page
Table 1. Waterbodies Sampled as a Part of the Coordinated Aquatic Monitoring Program (CAMP). ................................................................................................................................................. 8
Table 2. Summary of field studies planned for the Keeyask Aquatic Effects Monitoring Plan. ....................................................................................................................................................... 12
Table 3. Laboratory water quality parameters that will be monitored during Project construction. ........................................................................................................................................ 21
Table 4. Laboratory water quality parameters that will be monitored during Project operation. ............................................................................................................................................. 25
LIST OF MAPS
Page
Map 1. Aquatic Environment Study Area. ..................................................................................................... 3 Map 2. Clark Lake to Stephens Lake. ............................................................................................................ 15 Map 3. Kelsey Generating Station to Nelson River estuary. ..................................................................... 16 Map 4. Water quality monitoring areas. ........................................................................................................ 19 Map 5. Aquatic habitat monitoring area. ...................................................................................................... 30 Map 6. Split Lake area – Aquatic macroinvertebrate monitoring. ............................................................ 40 Map 7. Outlet of Clark Lake to Keeyask Generating Station – Aquatic macroinvertebrate
monitoring. ........................................................................................................................................... 41 Map 8. Keeyask Generating Station to Kettle Generating Station – Aquatic
macroinvertebrate monitoring. ......................................................................................................... 42 Map 9. 2011 acoustic receiver locations ....................................................................................................... 47 Map 10. Split Lake area – Fish community monitoring. .............................................................................. 53 Map 11. Outlet of Clark Lake to Keeyask Generating Station – Fish community
monitoring. ........................................................................................................................................... 54 Map 12. Keeyask Generating Station to Long Spruce Generating Station – Fish
community monitoring. ..................................................................................................................... 55 Map 13. Preferred habitat development locations in the Keeyask reservoir. ........................................... 62 Map 14. Proposed location of spawning habitat – Phase 1. ........................................................................ 63 Map 15. Proposed lake whitefish spawning shoal. ........................................................................................ 64 Map 16. Split Lake area – Lake sturgeon monitoring. .................................................................................. 72 Map 17. Outlet of Clark Lake to Keeyask Generating Station – Lake sturgeon monitoring. ................ 73 Map 18. Keeyask Generating Station to Long Spruce Generating Station – Lake sturgeon
monitoring. ........................................................................................................................................... 74

KEEYASK GENERATION PROJECT DRAFT - October 2012
AQUATIC EFFECTS MONITORING PLAN ix
Map 19. Mercury in fish flesh monitoring areas. ........................................................................................... 89

KEEYASK GENERATION PROJECT DRAFT - October 2012
AQUATIC EFFECTS MONITORING PLAN 1
1.0 INTRODUCTION
Drafting note: Review of this draft AEMP with Environment Canada (EC), Manitoba Conservation and Water Stewardship (MCWS) and Fisheries and Oceans Canada (DFO) may identify additional monitoring activities to be included in the final AEMP.
This document describes the Aquatic Effects Monitoring Plan (AEMP) for the Keeyask Generation Project (the Project), a 695 megawatt (MW) hydroelectric generating station at Gull Rapids on the lower Nelson River, immediately upstream of Stephens Lake (Map 1). The Keeyask Generation Project: Response to Guidelines, completed in June 2012, provides a summary of predicted effects and planned mitigation for the Project. Technical supporting information for the aquatic environment, including a description of the environmental setting, effects and mitigation, and a summary of proposed monitoring and follow-up programs is provided in the Keeyask Generation Project Environmental Impact Statement: Aquatic Environment Supporting Volume (AE SV).
Drafting note: standard introductory text describing the Environmental Protection Program is being prepared by Manitoba and will be inserted here.
The AE SV describes existing conditions and predicted environmental effects to the aquatic environment, including Valued Ecosystem Components (VECs). The AEMP describes monitoring that will provide information to:
Determine if the effects assessment predictions in the AE SV are correct;
Identify unexpected effects related to the Project;
Determine the effectiveness of mitigation measures;
Assess the need for additional mitigation or remedial actions if initial measures are not adequate;
Determine the effectiveness of any additional/adapted mitigation measure(s); and
Confirm compliance with regulatory requirements, including Project approvals and environmental regulations.
Monitoring activities focus on primary effects to key components of the environment rather than addressing all potential changes to the aquatic environment as described in the AE SV. The AEMP addresses the following components of the aquatic environment:
Water Quality (VEC) (Section 2.0);
Aquatic Habitat (Section 3.0);
Aquatic Macroinvertebrates (Section 4.0);
Fish Community (walleye, northern pike and lake whitefish are VEC species) (Section 5.0);

KEEYASK GENERATION PROJECT DRAFT - October 2012
AQUATIC EFFECTS MONITORING PLAN 2
Lake Sturgeon (VEC) (Section 6.0); and
Mercury in fish flesh (Section 7.0).
The AEMP provides plans for the construction and operation phases. Monitoring activities are split into two major categories: (1) core monitoring (CM); and (2) specific effects monitoring (SEM). The former evaluates effects of the Project over a broad geographic scale at repeated defined intervals, while the latter encompasses a number of more focussed monitoring components that evaluate effects of the Project at smaller spatial scales and in relation to site-specific and/or local effects.
The AEMP is adaptive with provisions to review results and modify monitoring programs and mitigation measures, if and as required. During the construction phase, results will be reviewed annually to determine whether observed results indicate the need for adjustments to either the temporal and/or spatial scope of sampling, and to provide feedback to Project personnel if alterations to mitigation measures are required. During the operation phase, monitoring results will provide the basis for modifications to sampling plans (e.g., reduction if effects are not observed, design changes if effects are not adequately recorded by existing plan), and the modification or implementation of additional mitigation measures, if required. While operation monitoring may continue thirty years post-impoundment of the reservoir, the monitoring timeframe for particular components may be reduced if there are no observed effects or if results indicate a more rapid stabilization. Review of the program results three years after impoundment to the full supply level will determine whether changes to the monitoring program are required in the short term. A synthesis report, which will form the basis for decisions about long-term monitoring, will be prepared after 10 years of post-impoundment monitoring.
Results of the AEMP will be provided to and discussed with DFO and MCWS, and any modifications to the plan/mitigation measures would be discussed with DFO and MCWS as specified in environmental approvals for the Project.
The remaining sections of this introduction provide the following:
Section 1.1 Summary of AEMP components and related programs;
Section 1.2 Monitoring schedule; and
Section 1.3 Study Area.

ÚÕ
ÚÕ
ÚÕ
!
!
!
!
Fox Lake Cree Nation
Tataskweyak Cree Nation
York Factory First Nation
War Lake First Nation
A Kwis Ki Mahka Reserve
Ilford
York Landing (Kawechiwasik)
Tataskweyak (Split Lake)
Fox Lake Cree Nation
Tataskweyak Cree Nation
York Factory First Nation
War Lake First Nation
A Kwis Ki Mahka Reserve
Ilford
York Landing (Kawechiwasik)
Tataskweyak (Split Lake)
ProposedKeeyask G.S.
Burntwood River
Kelsey G.S.Grass River
SPLIT LAKE
SPLIT LAKE
Clark Lake
Birthday Rapids
Gull RapidsGULL LAKE
NELSON RIVER
Aiken River
Waskaiowaka
Lake
Assean Lake
Odei River
Kettle G.S.
Ferris Bay
North Moswakot River
South Moswakot River
UV280
STEPHENS LAKE
SPLIT LAKE AREA
KEEYASK AREA
STEPHENS LAKE AREA
LongRapids
First Rapids
Witchai Lake Falls
¾ÀPR 280
Gillam
0 10 20 30 Kilometres
0 8 16 Miles
±
Projection: UTM Zone 15, NAD 83Data Source: NTS base 1:50 000, Stephens Lake Shoreline-Quickbird@Digitalglobe, 2006Nelson River Shoreline modelled by Manitoba Hydro
Aquatic Environment Study Area
File L
ocati
on: G
:\EIS
\Kee
yask
\Pub
lish_
MXDs
\SUP
PORT
ING_
VOLU
ME\R
EVIS
ED_S
tillOl
dTem
plate\
Intro\
AESV
_1_A
quati
cEnv
ironm
entS
tudyA
rea_
2012
0519
.mxd
!(
!(
!(
Thompson
ChurchillHudson Bay
90°W
90°W
95°W
95°W
100°W
100°W60°N
55°N55°N
LegendArea Boundary
Highway
Access Road
Proposed Access Road
Rail Line
Transmission Line
First Nation Reserve
Map 1

KEEYASK GENERATION PROJECT DRAFT - October 2012
AQUATIC EFFECTS MONITORING PLAN 4
1.1 SUMMARY OF AEMP COMPONENTS AND RELATED PROGRAMS
The main components of the AEMP are summarized in Section 1.1.1. In addition to the AEMP, results from components of the Physical Environmental Monitoring Plan (PEMP) and Sediment Management Plan will be used to: (i) describe effects to the aquatic environment; and (ii) interpret results from various components in the AEMP. Section 1.1.2 summarizes relevant information that will be obtained from the PEMP and SMP. Finally, the Coordinated Aquatic Monitoring Program, a program conducted jointly by Manitoba Conservation and Water Stewardship (MCWS) and Manitoba Hydro, includes the collection of environmental data at several locations in northern Manitoba that may be affected by the Project or that would provide useful context for interpreting changes observed in the area affected by the Project. CAMP sampling locations are provided in Section 1.1.3.
1.1.1 Summary of AEMP Components
The following is a brief summary of the components of the AEMP. Detailed descriptions of planned monitoring are provided in sections 2.0 to 7.0. Although plans are discussed for each component separately, results will be interpreted in an integrated manner in order to better understand observed environmental effects. In addition, if unanticipated effects are recorded in one component, results from another component may assist in interpreting and identifying whether modifications to mitigation are required.
1.1.1.1 Water Quality
During the construction phase, water quality will be measured at sites upstream and downstream of the construction site before, during, and after major instream construction activities (Section 2.1.2). Additional samples will be collected at sites farther downstream to establish the spatial extent of effects to water quality. Targeted sampling will also occur in the immediate receiving environment where effluent is discharged or where other site-specific effects may occur (Section 2.1.3). Annual monitoring once in the open water season and once in late winter will occur when there is no major instream construction work.
During the operation phase, water quality will be monitored upstream, within and downstream of the reservoir four times annually during the open water season and once during winter (Section 2.2.2). Within the reservoir, sampling will includes sites within flooded terrestrial areas, where effects to water quality are expected to be greatest, and along the mainstem of the river. Monitoring will be conducted annually for the first ten years after impoundment of the reservoir, though the extent of the program may be modified based on results. The timing and spatial extent of monitoring in the long term will be determined in a review of program results ten years after impoundment.
KEEYASK GENERATION PROJECT DRAFT - October 2012
AQUATIC EFFECTS MONITORING PLAN 5
1.1.1.2 Aquatic Habitat
No monitoring of aquatic habitat is planned during the construction phase as most changes will occur in the latter part of construction and be addressed in the operation phase. During operation, monitoring includes two primary components: i) monitoring to describe the evolution of nearshore habitat and the development of potential and occupied aquatic macrophyte habitat in the Keeyask reservoir (Section 3.2.2.1); and ii) monitoring to document substrate composition upstream and downstream of the GS over time, including monitoring of potential sedimentation over constructed and sensitive habitats (sections 3.2.2.2 and 3.2.3). Annual monitoring will be conducted for the first three years following impoundment, with subsequent monitoring scheduled to occur every three years until 10 years post-impoundment.
1.1.1.3 Aquatic Macroinvertebrates
Benthic macroinvertebrate sampling will be conducted in the fall of each year during construction and the first three years of operation. Monitoring will then be conducted every three years until 10 years post-impoundment. During construction, benthic macroinvertebrate monitoring will occur from immediately downstream of instream construction activities to the Kettle GS, upstream of instream activities (between Birthday and Gull rapids), and in Split Lake (Section 4.1.2). During operation, they will be monitored from the GS upstream to the base of Long Rapids, downstream to the Kettle GS, and in Split Lake (Map 1; Section 4.2.2).
Drifting macroinvertebrate sampling will be conducted four times a year during the first three years of operation and then every three years until 10 years post-impoundment (Section 4.2.2). During operation, drifting macroinvertebrates will be monitored from the GS upstream to the base of Long Rapids and downstream to the Kettle GS. They will also be assessed in the smaller, flooded tributaries and in selected backbays.
1.1.1.4 Fish Community
Fish community monitoring during the construction phase will consist of fish mortality monitoring at blast sites that are not expected to meet DFO blasting guidelines criteria (Wright and Hopky 1998; Section 5.1.3), and monitoring of VEC fish species’ movements and habitat use upstream and downstream of the construction site by acoustic telemetry (Section 5.1.2). Monitoring of fish movements will occur continuously throughout the construction phase.
Core monitoring of the fish community upstream and downstream of the GS will occur annually for the first three years of operation and every three years thereafter until 10 years post-impoundment (Section 5.2.2.1). The potential effects of total dissolved gas supersaturation on fish residing downstream of the GS will be monitored, and monitoring frequency will be largely dependent on river flows and spill events, during which total dissolved gases are expected to reach maximum concentrations (Section 5.2.3.1). Acoustic telemetry will continue to be used to monitor movements of the fish community VEC species upstream and downstream of the GS for the first three years following impoundment (Section 5.2.2.2). Monitoring fish use and overall success of existing and newly created spawning habitat in the reservoir and downstream of the GS will also take place during operation (Section 5.2.3.2). Monitoring will continue as needed to confirm that the structures are effective at mitigating potential losses to fish
KEEYASK GENERATION PROJECT DRAFT - October 2012
AQUATIC EFFECTS MONITORING PLAN 6
habitat. An assessment of rates of injury and mortality of fish passing through turbines will be conducted in the first year following commissioning of all turbines (Section 5.2.3.3). A program to monitor potential fish stranding in the area episodically wetted by spill will be conducted following spill events (Section 5.2.3.4).
1.1.1.5 Lake Sturgeon
Monitoring of lake sturgeon abundance, condition and growth, movements/habitat use and recruitment/year-class strength will be conducted during the construction and operation phases of the Project and will continue until self-sustaining populations have been established. Abundance and physical parameter monitoring will occur in the Upper Split Lake area (see Section 6.0 for a description of boundaries) and in the Nelson River between Clark Lake and the Kettle GS in alternating years, so that each site is sampled every second year (Map 1; (sections 6.1.2.1 and 6.2.2.1)). Habitat use and movements of sub-adult (juvenile) and adult lake sturgeon upstream and downstream of the GS will be monitored using acoustic telemetry (data collected across all seasons) and mark and recapture data from the physical parameter monitoring program (sections 6.1.2.2 and 6.2.2.2). Recruitment monitoring will be conducted both upstream and downstream of the GS on an annual basis (sections 6.1.2.3 and 6.2.2.3). Results of recruitment monitoring will be used to achieve several important monitoring objectives, including assessing the effectiveness of lake sturgeon stocking as a mitigation measure and determining the need for additional YOY and sub-adult habitat creation in the reservoir.
During the operation phase only, lake sturgeon spawning site selection will be monitored (Section 6.2.3.1); should sufficient numbers of spawning lake sturgeon be captured at a potential spawning site, egg deposition and larval drift monitoring would be conducted to monitor spawning success (sections 6.2.3.2 and 6.2.3.3). Specific areas targeted include the vicinity of Long Rapids, Birthday Rapids, and newly created spawning habitat downstream of the GS.
1.1.1.6 Mercury in Fish Flesh
Tissue samples will be collected from Gull Lake/the Keeyask reservoir, Stephens Lake, the Aiken River, and Split Lake and lakes (reference waterbody). If samples from Stephens Lake show a substantial increase in mercury levels, monitoring will be extended downstream to include areas below the Kettle GS. Walleye, lake whitefish, northern pike, and juvenile yellow perch will be sampled from each waterbody starting in 2013 and again in Years 1 and 4 during construction. Following impoundment, yearly sampling will be conducted until maximum fish mercury concentrations are reached, and every three years thereafter until concentrations have stabilized (Section 7.2.2).
1.1.2 Summary of Physical Environment Monitoring Information Relevant to the AEMP
The PEMP will provide a complete description of the monitoring of the physical environment. Several topics addressed in the PEMP will be required as inputs to the AEMP, as described below:
KEEYASK GENERATION PROJECT DRAFT - October 2012
AQUATIC EFFECTS MONITORING PLAN 7
Measurement of water depth and velocity during the open-water period under a variety of flow conditions upstream and downstream of the Keeyask GS will be required to validate predictions used as input into post-Project aquatic habitat models;
Monitoring of sediment parameters (e.g., total suspended solids (TSS), turbidity) upstream and downstream of the Keeyask GS to provide input into the water quality program;
Monitoring of shoreline erosion and peat breakdown will provide a link between mineral and organic inputs and effects to water quality;
Measurement of sediment deposition upstream and downstream of the GS will be used as an input to the aquatic habitat (substrate) and benthic invertebrate monitoring programs;
Monitoring of dissolved oxygen (DO) and water temperature in the reservoir mainstem, flooded backbays, and downstream of the Keeyask GS will provide important information for the water quality, benthic invertebrate, and fish community programs; and
Monitoring of total dissolved gas pressure upstream and downstream of the Keeyask GS under a variety of flow conditions will provide input into the fish community program to assess effects of gas supersaturation.
Results of monitoring immediately upstream and downstream of instream construction sites, as described in the SMP, will also be required to interpret results of the water quality and biological monitoring programs.
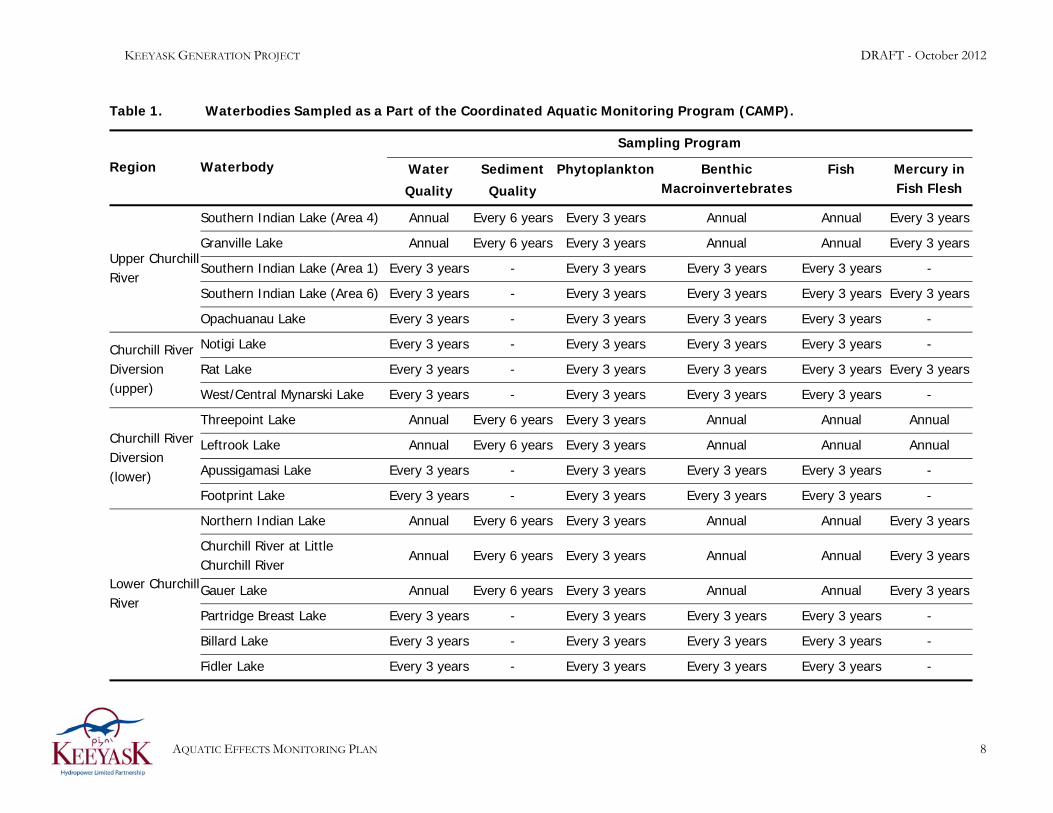
1.1.3 Coordinated Aquatic Monitoring Program (CAMP)
Monitoring of water quality, benthic invertebrates, fish, and mercury in fish flesh is conducted by MCWS and Manitoba Hydro under the Coordinated Aquatic Monitoring Program (CAMP) at several sites in the region (see Table 1 for a list of CAMP waterbodies in the region and monitoring program details). CAMP monitoring data will be obtained and considered within the AEMP reporting to: i) provide additional information on affected areas (i.e., Stephens Lake) and ii) provide context for changes observed in the study area (e.g., Split and Assean lakes, the Hayes River, the lower Nelson River downstream of the Limestone GS).
KEEYASK GENERATION PROJECT DRAFT - October 2012
AQUATIC EFFECTS MONITORING PLAN 8
Table 1. Waterbodies Sampled as a Part of the Coordinated Aquatic Monitoring Program (CAMP).
Region Waterbody
Sampling Program
Water
Quality
Sediment
Quality
Phytoplankton Benthic Macroinvertebrates
Fish Mercury in Fish Flesh
Upper Churchill River
Southern Indian Lake (Area 4) Annual Every 6 years Every 3 years Annual Annual Every 3 years
Granville Lake Annual Every 6 years Every 3 years Annual Annual Every 3 years
Southern Indian Lake (Area 1) Every 3 years - Every 3 years Every 3 years Every 3 years -
Southern Indian Lake (Area 6) Every 3 years - Every 3 years Every 3 years Every 3 years Every 3 years
Opachuanau Lake Every 3 years - Every 3 years Every 3 years Every 3 years -
Churchill River Diversion (upper)
Notigi Lake Every 3 years - Every 3 years Every 3 years Every 3 years -
Rat Lake Every 3 years - Every 3 years Every 3 years Every 3 years Every 3 years
West/Central Mynarski Lake Every 3 years - Every 3 years Every 3 years Every 3 years -
Churchill River Diversion (lower)
Threepoint Lake Annual Every 6 years Every 3 years Annual Annual Annual
Leftrook Lake Annual Every 6 years Every 3 years Annual Annual Annual
Apussigamasi Lake Every 3 years - Every 3 years Every 3 years Every 3 years -
Footprint Lake Every 3 years - Every 3 years Every 3 years Every 3 years -
Lower Churchill River
Northern Indian Lake Annual Every 6 years Every 3 years Annual Annual Every 3 years
Churchill River at Little Churchill River
Annual Every 6 years Every 3 years Annual Annual Every 3 years
Gauer Lake Annual Every 6 years Every 3 years Annual Annual Every 3 years
Partridge Breast Lake Every 3 years - Every 3 years Every 3 years Every 3 years -
Billard Lake Every 3 years - Every 3 years Every 3 years Every 3 years -
Fidler Lake Every 3 years - Every 3 years Every 3 years Every 3 years -

KEEYASK GENERATION PROJECT DRAFT - October 2012
AQUATIC EFFECTS MONITORING PLAN 9
Table 1. Waterbodies Sampled as a Part of the Coordinated Aquatic Monitoring Program (CAMP).
Region Waterbody
Sampling Program
Water
Quality
Sediment
Quality
Phytoplankton Benthic Macroinvertebrates
Fish Mercury in Fish Flesh
Lower Churchill River
Churchill River at Red Head Rapids
Every 3 years - Every 3 years Every 3 years Every 3 years -
Upper Nelson River
Cross Lake - West basin Annual Every 6 years Annual Annual Annual Every 3 years
Setting Lake Annual Every 6 years Annual Annual Annual Every 3 years
Playgreen Lake Every 3 years - Every 3 years Every 3 years Every 3 years Every 3 years
Little Playgreen Every 3 years - Every 3 years Every 3 years Every 3 years -
Walker Lake Every 3 years - Every 3 years Every 3 years Every 3 years -
Sipiwesk Lake Every 3 years - Every 3 years Every 3 years Every 3 years Every 3 years
Nelson River - downstream of Sipiwesk Lake to Kelsey GS
Every 3 years - Every 3 years Every 3 years Every 3 years -
Lower Nelson River
Split Lake Annual Every 6 years Annual Annual Annual Every 3 years
Assean Lake Annual Every 6 years Annual Annual Annual Every 3 years
Nelson River Mainstem – downstream of Limestone GS
Annual Every 6 years Every 3 years Annual Annual Every 3 years
Hayes River Annual Every 6 years Every 3 years Annual Annual Every 3 years
Stephens Lake - north arm Every 3 years - Every 3 years Every 3 years Every 3 years -
Stephens Lake - south Every 3 years - Every 3 years Every 3 years Every 3 years Every 3 years
Limestone Forebay Every 3 years - Every 3 years Every 3 years Every 3 years Every 3 years
Burntwood River - First Rapids to Split Lake
Annual - Every 3 years Every 3 years Every 3 years -
KEEYASK GENERATION PROJECT
AQUATIC EFFECTS MONITORING PLAN 10
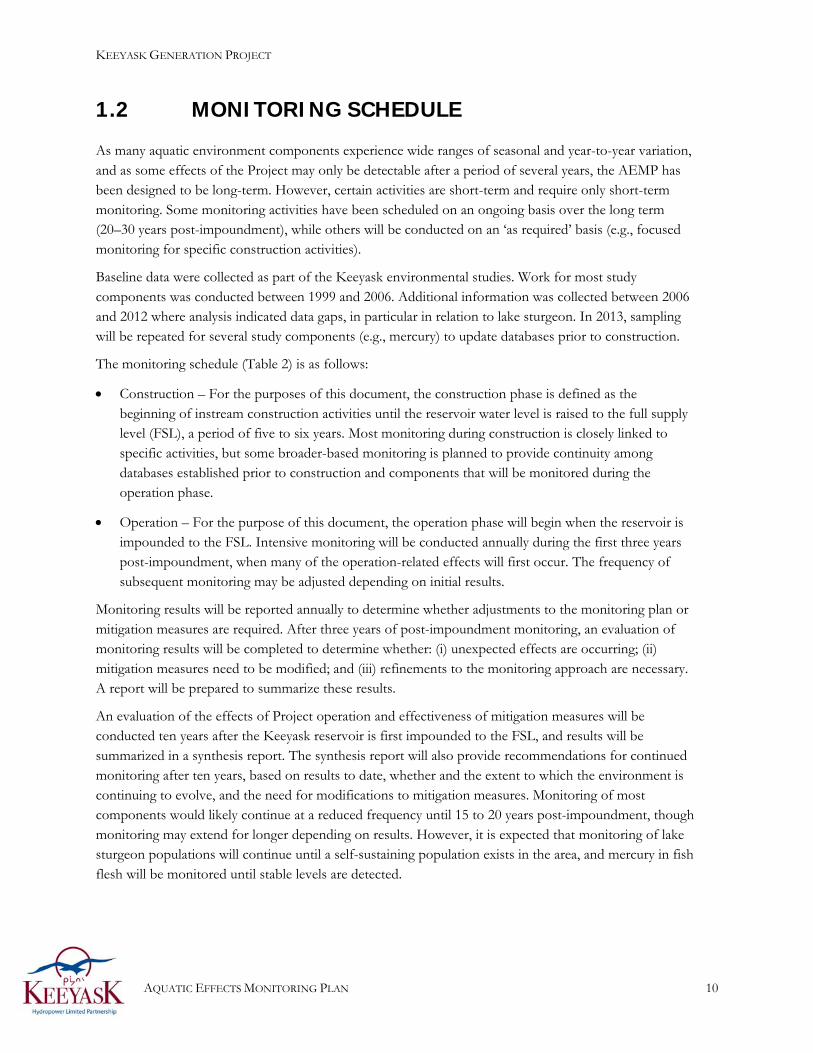
1.2 MONITORING SCHEDULE
As many aquatic environment components experience wide ranges of seasonal and year-to-year variation, and as some effects of the Project may only be detectable after a period of several years, the AEMP has been designed to be long-term. However, certain activities are short-term and require only short-term monitoring. Some monitoring activities have been scheduled on an ongoing basis over the long term (20–30 years post-impoundment), while others will be conducted on an ‘as required’ basis (e.g., focused monitoring for specific construction activities).
Baseline data were collected as part of the Keeyask environmental studies. Work for most study components was conducted between 1999 and 2006. Additional information was collected between 2006 and 2012 where analysis indicated data gaps, in particular in relation to lake sturgeon. In 2013, sampling will be repeated for several study components (e.g., mercury) to update databases prior to construction.
The monitoring schedule (Table 2) is as follows:
Construction – For the purposes of this document, the construction phase is defined as the beginning of instream construction activities until the reservoir water level is raised to the full supply level (FSL), a period of five to six years. Most monitoring during construction is closely linked to specific activities, but some broader-based monitoring is planned to provide continuity among databases established prior to construction and components that will be monitored during the operation phase.
Operation – For the purpose of this document, the operation phase will begin when the reservoir is impounded to the FSL. Intensive monitoring will be conducted annually during the first three years post-impoundment, when many of the operation-related effects will first occur. The frequency of subsequent monitoring may be adjusted depending on initial results.
Monitoring results will be reported annually to determine whether adjustments to the monitoring plan or mitigation measures are required. After three years of post-impoundment monitoring, an evaluation of monitoring results will be completed to determine whether: (i) unexpected effects are occurring; (ii) mitigation measures need to be modified; and (iii) refinements to the monitoring approach are necessary. A report will be prepared to summarize these results.
An evaluation of the effects of Project operation and effectiveness of mitigation measures will be conducted ten years after the Keeyask reservoir is first impounded to the FSL, and results will be summarized in a synthesis report. The synthesis report will also provide recommendations for continued monitoring after ten years, based on results to date, whether and the extent to which the environment is continuing to evolve, and the need for modifications to mitigation measures. Monitoring of most components would likely continue at a reduced frequency until 15 to 20 years post-impoundment, though monitoring may extend for longer depending on results. However, it is expected that monitoring of lake sturgeon populations will continue until a self-sustaining population exists in the area, and mercury in fish flesh will be monitored until stable levels are detected.

KEEYASK GENERATION PROJECT
AQUATIC EFFECTS MONITORING PLAN 11
All reviews of AEMP results and consideration of modifications to the AEMP and mitigation measures will be conducted in close consultation with DFO and MCWS.
KEEYASK GENERATION PROJECT DRAFT - July 2012
AQUATIC EFFECTS MONITORING PLAN 12
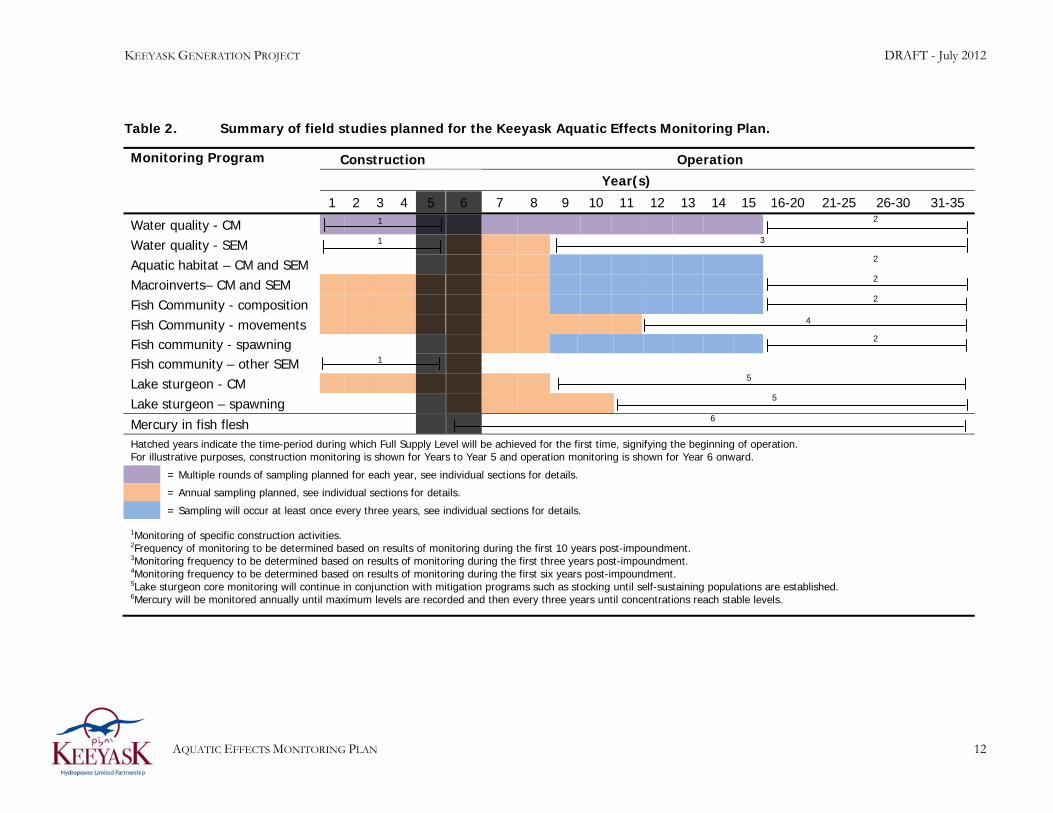
Table 2. Summary of field studies planned for the Keeyask Aquatic Effects Monitoring Plan.
Monitoring Program Construction Operation
Year(s)
1 2 3 4 5 6 7 8 9 10 11 12 13 14 15 16-20 21-25 26-30 31-35
Water quality - CM 1 2
Water quality - SEM 1 3
Aquatic habitat – CM and SEM 2
Macroinverts– CM and SEM
2
Fish Community - composition 2
Fish Community - movements 4
Fish community - spawning 2
Fish community – other SEM 1 Lake sturgeon - CM 5
Lake sturgeon – spawning 5
Mercury in fish flesh 6
Hatched years indicate the time-period during which Full Supply Level will be achieved for the first time, signifying the beginning of operation. For illustrative purposes, construction monitoring is shown for Years to Year 5 and operation monitoring is shown for Year 6 onward.
= Multiple rounds of sampling planned for each year, see individual sections for details.
= Annual sampling planned, see individual sections for details.
= Sampling will occur at least once every three years, see individual sections for details. 1Monitoring of specific construction activities. 2Frequency of monitoring to be determined based on results of monitoring during the first 10 years post-impoundment. 3Monitoring frequency to be determined based on results of monitoring during the first three years post-impoundment. 4Monitoring frequency to be determined based on results of monitoring during the first six years post-impoundment. 5Lake sturgeon core monitoring will continue in conjunction with mitigation programs such as stocking until self-sustaining populations are established. 6Mercury will be monitored annually until maximum levels are recorded and then every three years until concentrations reach stable levels.

KEEYASK GENERATION PROJECT DRAFT - October 2012
AQUATIC EFFECTS MONITORING PLAN 13
1.3 STUDY AREA
1.3.1 Project Effects Study Area
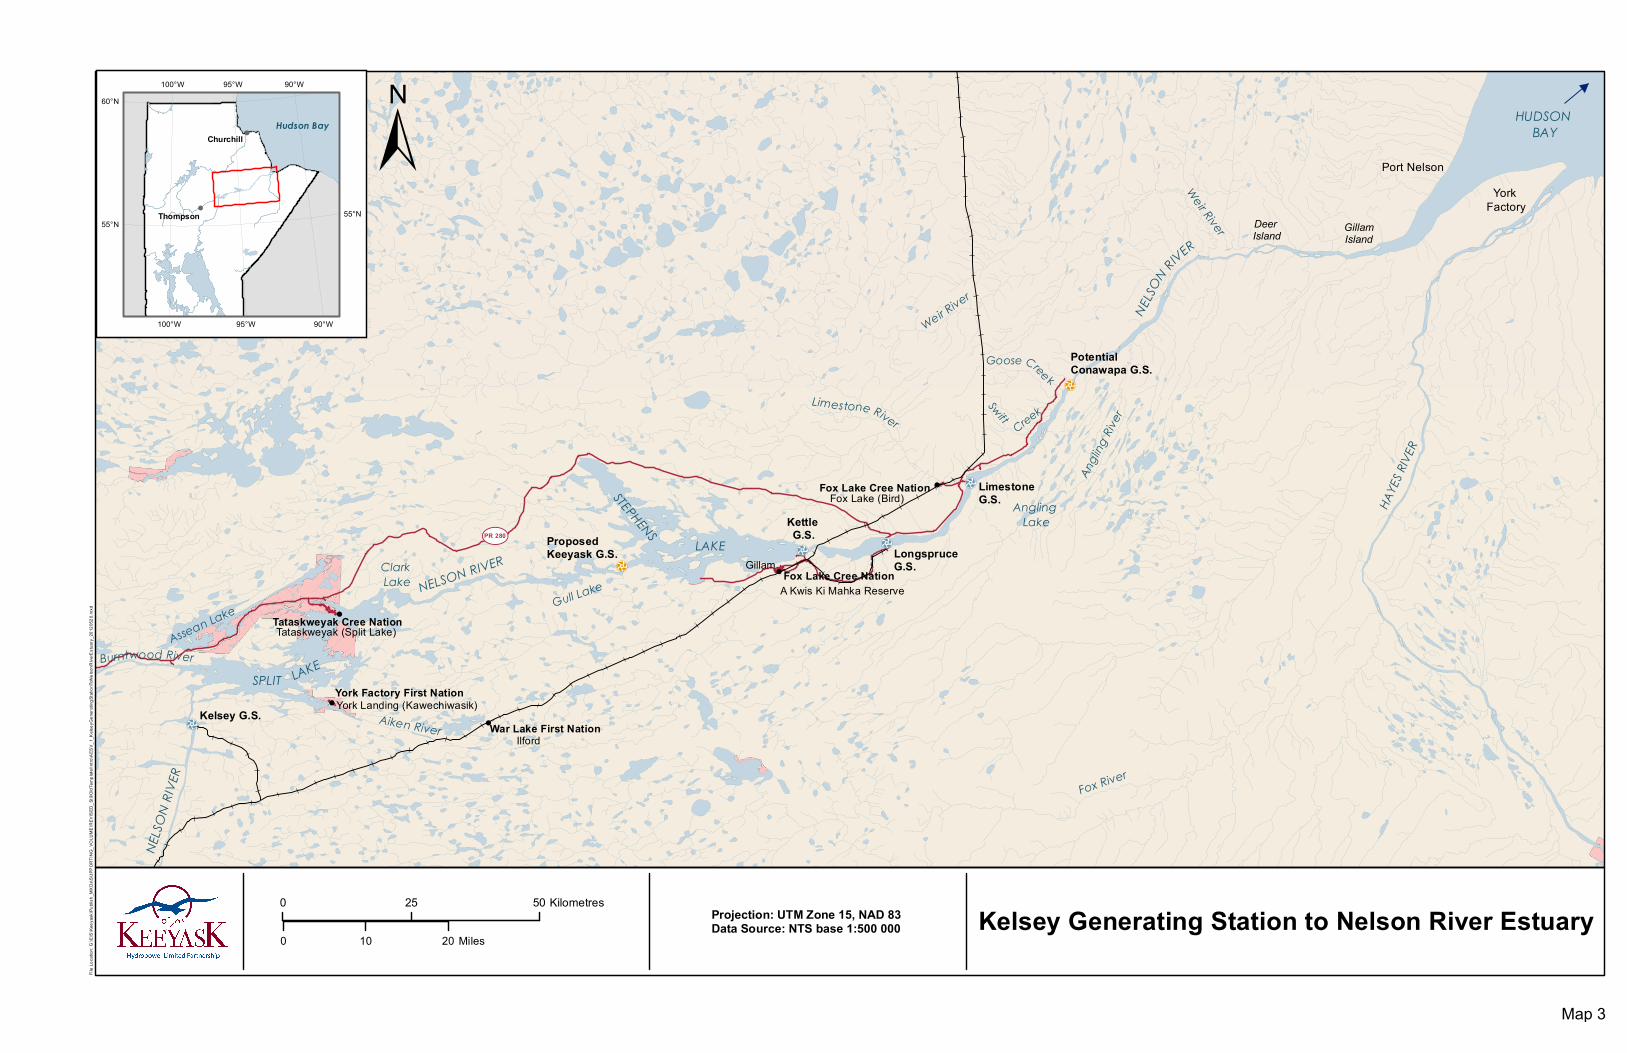
The study area includes the reach of the Nelson River from the Kelsey GS to the Kettle GS, as well as waterbodies immediately adjacent to the Nelson River (Map 1). Effects of both construction and operation vary in their size, as some activities will be confined to a specific site while others will be regional in scope; therefore, monitoring components will also vary in their spatial scales.
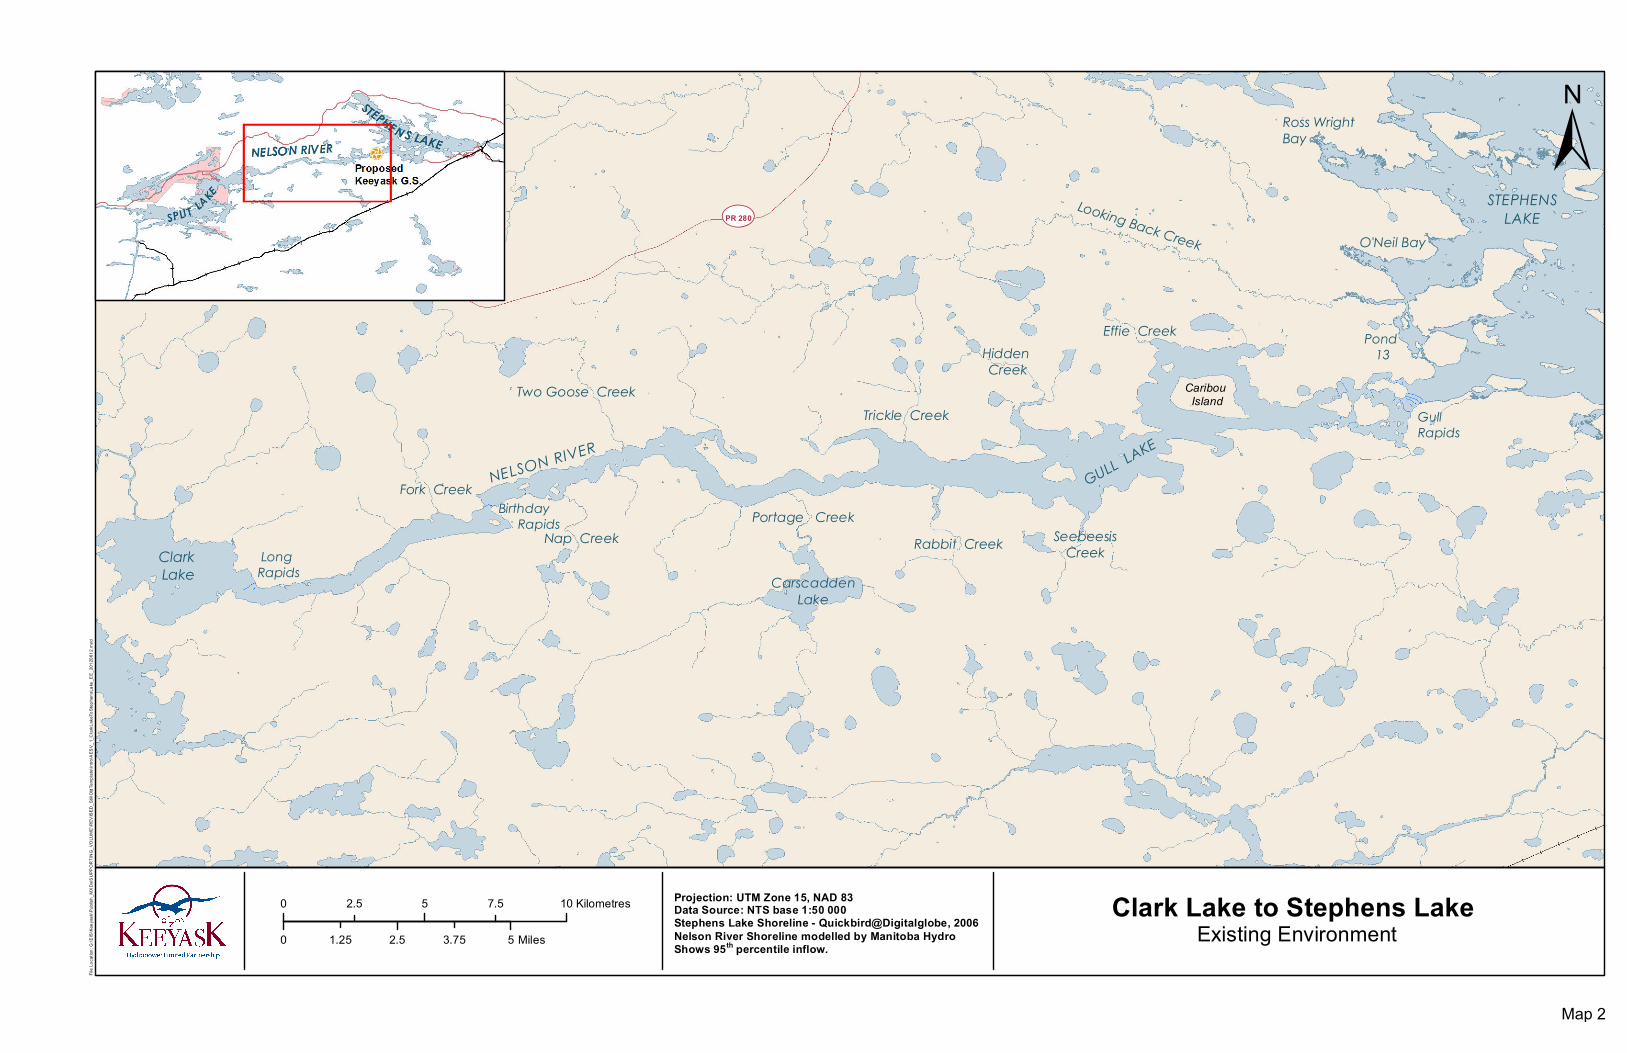
Environmental monitoring will be focused on the reach of the river from approximately 3 km downstream of the outlet of Clark Lake to approximately 3 km downstream of Gull Rapids (i.e., the inlet of Stephens Lake), where direct changes to water levels and flows are expected (Map 2). Selected components will also be monitored upstream of this reach (in Split Lake) and downstream of this reach (in Stephens Lake).
Sampling to collect drifting macroinvertebrates will be conducted immediately downstream of the Kettle GS, and acoustic receivers will be used to detect fish movements as far downstream as the Long Spruce reservoir. Monitoring for the water quality and mercury in fish flesh components will periodically extend downstream to the Nelson River estuary to address concerns that inputs to the water at the Project site could be carried downstream (Map 3).
1.3.2 Reference Sampling Sites
In monitoring plans, reference (control) sites are typically used to account for effects or changes in a given parameter that are not related to the impact/stressor under study. Therefore, choosing a reference area that is “as similar as possible to the exposure area is essential in order to interpret difference between areas” (Environment Canada 2002). Ideally, reference sampling sites would be similar in all attributes except for the development; however, in practice, this ideal situation seldom occurs. With respect to the study area, external environmental factors that could affect the aquatic environment include: inter-annual variations in flow and water quality in the Nelson and Burntwood rivers; seasonal run-off in the local watershed; other events in the local watershed (e.g., forest fires); inter-annual variations in weather (e.g., spring temperature, severe wind events with effects to erosion); commercial and domestic fisheries; potential arrival of invasive species, and climate change. Ideal reference areas would be subject to the same non-Project related stressors (e.g., commercial and domestic fishing) as the "exposure area”.
As is often the case for large-scale developments, there is no ideal reference water body for the Keeyask area. Split Lake, which is a large lake with a similar assemblage of species to the Keeyask reservoir and Stephens Lake, is the best candidate in terms of being subject to similar external stressors such as annual variations in stream flow and weather, and factors that will change in the future such as climate change. However, as discussed in the EIS, Split Lake is not an ideal reference lake as fish are able to move from the Keeyask reservoir to Split Lake and lake sturgeon populations in Split Lake will be augmented by planned regional mitigation (stocking) for the Project. In addition, the KCN have indicated that, based on traditional knowledge, they expect adverse effects to the aquatic environment as a result of Keeyask, despite findings of the technical assessment that no changes are anticipated.

KEEYASK GENERATION PROJECT DRAFT - October 2012
AQUATIC EFFECTS MONITORING PLAN 14
Information from selected water bodies sampled under CAMP (Table 2) will also be used to provide context and as reference sites to assist in interpreting changes in the Keeyask study area that may relate to factors independent of the effects of the Project.
Pond 13
Ross WrightBay
Nap Creek
Fork Creek
Clark Lake
Long Rapids
STEPHENSLAKE
Hidden Creek
Effie Creek
SeebeesisCreek
GULL LAKE
Caribou Island
Trickle Creek
NELSON RIVER
Two Goose Creek
Birthday Rapids
Looking Back Creek
CarscaddenLake
Gull Rapids
O'Neil Bay
Portage CreekRabbit Creek
UVPR 280
±
0 2.5 51.25 3.75 Miles
0 5 102.5 7.5 Kilometres Projection: UTM Zone 15, NAD 83Data Source: NTS base 1:50 000Stephens Lake Shoreline - Quickbird@Digitalglobe, 2006Nelson River Shoreline modelled by Manitoba HydroShows 95th percentile inflow.
Clark Lake to Stephens Lake Existing Environment
File L
ocati
on: G
:\EIS
\Kee
yask
\Pub
lish_
MXDs
\SUP
PORT
ING_
VOLU
ME\R
EVIS
ED_S
tillOl
dTem
plate\
Intro\
AESV
_1_C
larkL
akeT
oStep
hens
Lake
_EE_
2012
0612
.mxd
Map 2
ÚÕ
ÚÕ
ÚÕ
ÚÕÚÕ
ÚÕ
!
!
!
!
!
Fox Lake Cree Nation
Fox Lake Cree Nation
Tataskweyak Cree Nation
York Factory First Nation
War Lake First Nation
A Kwis Ki Mahka Reserve
Fox Lake (Bird)
Ilford
York Landing (Kawechiwasik)
Tataskweyak (Split Lake)
LongspruceG.S.
Kelsey G.S.
Gull Lake
Morgan Bay
Weir River
Goose Cree k
SPLIT
Weir River
NELSO
N RIVER
Okaw Creek
HAYE
S RIVE
R
LAKEClark Lake
Swift
Settee Lake
Fox River
Port Nelson
NELSON RIVER
Assean Lake
Potential Conawapa G.S.
Deer Island
Aiken River
York Factory
Creek
Angling Lake
NELS
ON RI
VER
STEPHENS
Angli
ng Ri
ver
LAKE
Proposed Keeyask G.S.
Burntwood River
GillamIsland
Limestone River
HUDSON BAY
Limestone G.S.
Kettle G.S.¾ÀPR 280
Gillam
Projection: UTM Zone 15, NAD 83Data Source: NTS base 1:500 000
0 25 50 Kilometres
0 10 20 Miles
!(
!(
!(
Thompson
ChurchillHudson Bay
90°W
90°W
95°W
95°W
100°W
100°W60°N
55°N55°N
Kelsey Generating Station to Nelson River Estuary
File L
ocati
on: G
:\EIS
\Kee
yask
\Pub
lish_
MXDs
\SUP
PORT
ING_
VOLU
ME\R
EVIS
ED_S
tillOl
dTem
plate\
Intro\
AESV
_1_K
elsey
Gene
ratin
gStat
ionTo
Nelso
nRive
rEstu
ary_
2012
0520
.mxd
±
Map 3
KEEYASK GENERATION PROJECT DRAFT - October 2012
AQUATIC EFFECTS MONITORING PLAN 17
2.0 WATER QUALITY
Monitoring data collected during construction and operation will be compared to upstream reference sampling sites (e.g., upstream-downstream comparisons in relation to relatively site-specific construction
activities), to pre-Project data (i.e., baseline data), and to Manitoba Water Quality Standards, Objectives
and Guidelines (MWQSOG; Manitoba Water Stewardship [MWS] 2011), the Canadian Council of
Ministers of the Environment (CCME) environmental quality guidelines (CCME 1999; updated to 2012),
and Health Canada guidelines for drinking water (Health Canada 2012).
The following describes the general background, approach, and methods for monitoring water quality during the construction phase until impoundment to the FSL and for the first ten years of operation after full impoundment. Additional information pertinent to monitoring of water quality is presented in the following documents:
Environmental Protection Plans (EnvPPs): monitoring of wastewater treatment plant discharge and effluent from the settling pond(s) prior to release is described in the EnvPPs for the Keeyask Generation Project and the Keeyask South Access Road;
Sediment Management Plan (SMP): the SMP describes a total suspended solids (TSS)/turbidity monitoring program designed to provide near continuous monitoring through the deployment of turbidity loggers upstream and downstream of the construction activities. The SMP forms the foundation of monitoring for the key effects predicted during the construction phase (i.e., increases in TSS related to water diversion and impoundment and to cofferdam placement and removal). SMP monitoring sites will be situated immediately upstream and downstream of instream construction; and
Physical Environment Monitoring Plan (PEMP): the PEMP will include a description of monitoring of dissolved oxygen (DO, water temperature, and total dissolved gas pressure.. Turbidity and TSS will be measured in a reach of the river extending from upstream of the reservoir to the furthest downstream extent of predicted effects (i.e., downstream of the Kettle GS at certain points during construction).
As discussed in Section 1.0, monitoring activities for the construction and operation phases are split into core and specific effects monitoring.
2.1 MONITORING DURING CONSTRUCTION
The following section provides a description of water quality monitoring during the construction phase, which is in addition to the monitoring referred to in the documents described above. As details regarding some of the construction activities are not available at this time, details of water quality monitoring for some Project effects will be developed in the future. In addition, it should be noted that the monitoring program described below is based on the current Project construction schedule and may be modified in the future.

KEEYASK GENERATION PROJECT DRAFT - October 2012
AQUATIC EFFECTS MONITORING PLAN 18
Water quality monitoring during construction focuses on activities that will increase TSS and related variables in the Nelson River and Stephens Lake, but is also intended to detect unforeseen effects and provide a means for adaptive management. The monitoring described below under (i.e., “core monitoring”) will provide monitoring information for a broader suite of water quality variables and over the entire construction phase.
2.1.1 Pathways of Effect and Key Questions
The primary effect of the Project during the construction phase is related to increases in TSS. Specifically,
the Project is expected to cause increases in TSS during critical periods of river management and
cofferdam placement/removal. Other pathways of effect (i.e., discharge of point sources) are expected to
result in highly localized and negligible to small effects (e.g., discharge of concrete batch plant effluent).
Key questions that will be addressed include:
Will the Project result in exceedances of water quality objectives or guidelines for the protection of aquatic life?
Will the Project result in exceedances of drinking water quality guidelines?
What are the magnitude and spatial extent of effects of construction on water quality?
2.1.2 Core Monitoring
Core monitoring will be conducted along a gradient (i.e., increasing distance from the construction site) and in relation to an upstream reference area(s). The overall objective of core monitoring is to record the net effect of various construction activities on a suite of water quality parameters along the mainstem of the Nelson River.
2.1.2.1 Monitoring Area
The core water quality monitoring area for the construction phase extends from Split Lake , including
inflows at the Nelson and Burntwood rivers (upstream reference sites) through Stephens Lake (Map 4).
Sampling will be more intensive in the vicinity of construction activities (i.e., Gull Rapids and downstream into Stephens Lake). Water quality in the Aiken River will also be monitored due to YFFN
concerns that the Project will affect water quality in this river. Monitoring downstream of Stephens Lake
to the Nelson River estuary will be included periodically to determine the extent of effects during
instream construction in this area.
2.1.2.2 Sampling Design
The sampling design is a hybrid design incorporating elements of both the before-after-control-impact
(BACI) and gradient designs. A BACI design consists of one or more control (or reference) locations to
which an exposure (or reference) area is compared, both before and after an impact is deemed to have
occurred. A gradient design refers to a series of sampling locations extending away from a potential
source of effect (e.g., increase in TSS due to instream work), to a sufficient distance downstream to