Embed Size (px)
Citation preview

sensors
Article
A Ratiometric Fluorescent Sensor for Cd2+ Based onInternal Charge Transfer
Dandan Cheng 1,†, Xingliang Liu 1,†, Yadian Xie 1, Haitang Lv 1, Zhaoqian Wang 1,Hongzhi Yang 1, Aixia Han 1,2,*, Xiaomei Yang 2 and Ling Zang 2,*
1 Chemical Engineering College, Qinghai University, Xining 810016, China; [email protected] (D.C.);[email protected] (X.L.); [email protected] (Y.X.); [email protected] (H.L.);[email protected] (Z.W.); [email protected] (H.Y.)
2 Department of Materials Science and Engineering, University of Utah, Salt Lake City, UT 84108, USA;[email protected]
* Correspondence: [email protected] (A.H.); [email protected] (L.Z.);Tel.: +86-971-5310-427 (A.H.); +1-801-587-1551 (L.Z.)
† These authors contributed equally to this work.
Received: 9 October 2017; Accepted: 31 October 2017; Published: 2 November 2017
Abstract: This work reports on a novel fluorescent sensor 1 for Cd2+ ion based on the fluorophore oftetramethyl substituted bis(difluoroboron)-1,2-bis[(1H-pyrrol-2-yl)methylene]hydrazine (Me4BOPHY),which is modified with an electron donor moiety of N,N-bis(pyridin-2-ylmethyl)benzenamine.Sensor 1 has absorption and emission in visible region, at 550 nm and 675 nm, respectively. The longwavelength spectral response makes it easier to fabricate the fluorescence detector. The sensormechanism is based on the tunable internal charge transfer (ICT) transition of molecule 1. Bindingof Cd2+ ion quenches the ICT transition, but turns on the π − π transition of the fluorophore,thus enabling ratiometric fluorescence sensing. The limit of detection (LOD) was projected downto 0.77 ppb, which is far below the safety value (3 ppb) set for drinking water by World HealthOrganization. The sensor also demonstrates a high selectivity towards Cd2+ in comparison to otherinterferent metal ions.
Keywords: ratiometric fluorescent sensor; Me4BOPHY; Cd2+ ion; ICT
1. Introduction
Cadmium represents a highly toxic industrial and environmental pollutant, and it is classifiedas a human carcinogen. Exposure to cadmium may cause cancer mutation of some organs, such aslung, endometria, prostate, kidney, etc. [1]. World Health Organization (WHO) underlines drinkingwater value for cadmium as 3 ppb [2]. So, detection of cadmium at trace level remains an importanttask, for which cadmium ion (Cd2+) usually remains as the target for chemical sensors to monitorthe cadmium pollution in water environment. Current methods for Cd2+ detection include UV-Visspectrometry [3], atomic absorption spectrometry (AAS) [4], inductively coupled plasma atomicemission spectroscopy (ICP-AES) [5], and fluorescent sensors [6–16]. Among these, fluorescent sensorsare uniquely compelling due to their high sensitivity, good selectivity [6–16], and capability forratiometric sensing to further improve the detection sensitivity [17–20]. However, many fluorescencesensors for Cd2+ ion reported thus far have some technical drawbacks, for example, a poor limitof detection (LOD) [7,8,18], complicated synthesis of sensor molecules [6], solvent toxicity [7],and a hardly controlled fluorescence change [14]. In order to develop high performance fluorescentsensors, the fluorophore must be designed with both high quantum efficiency and chemical tunabilityin response to metal binding [21,22]. Borondipyrromethene (BODIPY) has long been studiedas an outstanding organoboron fluorophore and been used in the development of fluorescent
Sensors 2017, 17, 2517; doi:10.3390/s17112517 www.mdpi.com/journal/sensors
Sensors 2017, 17, 2517 2 of 10
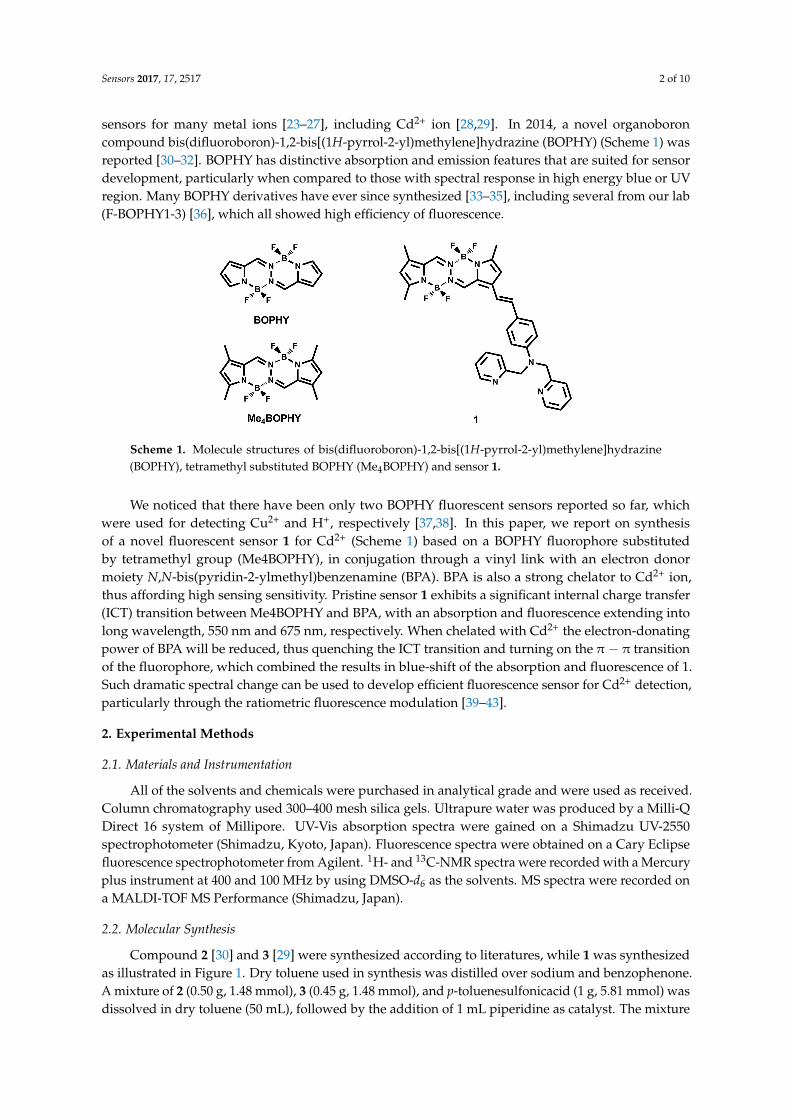
sensors for many metal ions [23–27], including Cd2+ ion [28,29]. In 2014, a novel organoboroncompound bis(difluoroboron)-1,2-bis[(1H-pyrrol-2-yl)methylene]hydrazine (BOPHY) (Scheme 1) wasreported [30–32]. BOPHY has distinctive absorption and emission features that are suited for sensordevelopment, particularly when compared to those with spectral response in high energy blue or UVregion. Many BOPHY derivatives have ever since synthesized [33–35], including several from our lab(F-BOPHY1-3) [36], which all showed high efficiency of fluorescence.
Sensors 2017, 17, 2517 2 of 10
fluorescent sensors for many metal ions [23–27], including Cd2+ ion [28,29]. In 2014, a novel organoboron compound bis(difluoroboron)-1,2-bis[(1H-pyrrol-2-yl)methylene]hydrazine (BOPHY) (Scheme 1) was reported [30–32]. BOPHY has distinctive absorption and emission features that are suited for sensor development, particularly when compared to those with spectral response in high energy blue or UV region. Many BOPHY derivatives have ever since synthesized [33–35], including several from our lab (F-BOPHY1-3) [36], which all showed high efficiency of fluorescence.
We noticed that there have been only two BOPHY fluorescent sensors reported so far, which were used for detecting Cu2+ and H+, respectively [37,38]. In this paper, we report on synthesis of a novel fluorescent sensor 1 for Cd2+ (Scheme 1) based on a BOPHY fluorophore substituted by tetramethyl group (Me4BOPHY), in conjugation through a vinyl link with an electron donor moiety N,N-bis(pyridin-2-ylmethyl)benzenamine (BPA). BPA is also a strong chelator to Cd2+ ion, thus affording high sensing sensitivity. Pristine sensor 1 exhibits a significant internal charge transfer (ICT) transition between Me4BOPHY and BPA, with an absorption and fluorescence extending into long wavelength, 550 nm and 675 nm, respectively. When chelated with Cd2+ the electron-donating power of BPA will be reduced, thus quenching the ICT transition and turning on the π − π transition of the fluorophore, which combined the results in blue-shift of the absorption and fluorescence of 1. Such dramatic spectral change can be used to develop efficient fluorescence sensor for Cd2+ detection, particularly through the ratiometric fluorescence modulation [39–43].
Scheme 1. Molecule structures of bis(difluoroboron)-1,2-bis[(1H-pyrrol-2-yl)methylene]hydrazine (BOPHY), tetramethyl substituted BOPHY (Me4BOPHY) and sensor 1.
2. Experimental Methods
2.1. Materials and Instrumentation
All of the solvents and chemicals were purchased in analytical grade and were used as received. Column chromatography used 300–400 mesh silica gels. Ultrapure water was produced by a Milli-Q Direct 16 system of Millipore. UV-Vis absorption spectra were gained on a Shimadzu UV-2550 spectrophotometer (Shimadzu, Kyoto, Japan). Fluorescence spectra were obtained on a Cary Eclipse fluorescence spectrophotometer from Agilent. 1H and 13C NMR spectra were recorded with a Mercury plus instrument at 400 and 100 MHz by using DMSO-d6 as the solvents. MS spectra were recorded on a MALDI-TOF MS Performance (Shimadzu, Japan).
2.2. Molecular Synthesis
Compound 2 [30] and 3 [29] were synthesized according to literatures, while 1 was synthesized as illustrated in Figure 1. Dry toluene used in synthesis was distilled over sodium and benzophenone. A mixture of 2 (0.50 g, 1.48 mmol), 3 (0.45 g, 1.48 mmol), and p-toluenesulfonicacid (1 g, 5.81 mmol) was dissolved in dry toluene (50 mL), followed by the addition of 1 mL piperidine as catalyst. The mixture was refluxed with stirring for 12 h under an atmosphere of nitrogen, during which time the color of the reaction mixture changed from pale yellow to red. After cooling to room temperature, the mixture was poured into H2O (100 mL) and extracted with CH2Cl2. After solvent
Scheme 1. Molecule structures of bis(difluoroboron)-1,2-bis[(1H-pyrrol-2-yl)methylene]hydrazine(BOPHY), tetramethyl substituted BOPHY (Me4BOPHY) and sensor 1.
We noticed that there have been only two BOPHY fluorescent sensors reported so far, whichwere used for detecting Cu2+ and H+, respectively [37,38]. In this paper, we report on synthesisof a novel fluorescent sensor 1 for Cd2+ (Scheme 1) based on a BOPHY fluorophore substitutedby tetramethyl group (Me4BOPHY), in conjugation through a vinyl link with an electron donormoiety N,N-bis(pyridin-2-ylmethyl)benzenamine (BPA). BPA is also a strong chelator to Cd2+ ion,thus affording high sensing sensitivity. Pristine sensor 1 exhibits a significant internal charge transfer(ICT) transition between Me4BOPHY and BPA, with an absorption and fluorescence extending intolong wavelength, 550 nm and 675 nm, respectively. When chelated with Cd2+ the electron-donatingpower of BPA will be reduced, thus quenching the ICT transition and turning on the π − π transitionof the fluorophore, which combined the results in blue-shift of the absorption and fluorescence of 1.Such dramatic spectral change can be used to develop efficient fluorescence sensor for Cd2+ detection,particularly through the ratiometric fluorescence modulation [39–43].
2. Experimental Methods
2.1. Materials and Instrumentation
All of the solvents and chemicals were purchased in analytical grade and were used as received.Column chromatography used 300–400 mesh silica gels. Ultrapure water was produced by a Milli-QDirect 16 system of Millipore. UV-Vis absorption spectra were gained on a Shimadzu UV-2550spectrophotometer (Shimadzu, Kyoto, Japan). Fluorescence spectra were obtained on a Cary Eclipsefluorescence spectrophotometer from Agilent. 1H- and 13C-NMR spectra were recorded with a Mercuryplus instrument at 400 and 100 MHz by using DMSO-d6 as the solvents. MS spectra were recorded ona MALDI-TOF MS Performance (Shimadzu, Japan).
2.2. Molecular Synthesis
Compound 2 [30] and 3 [29] were synthesized according to literatures, while 1 was synthesizedas illustrated in Figure 1. Dry toluene used in synthesis was distilled over sodium and benzophenone.A mixture of 2 (0.50 g, 1.48 mmol), 3 (0.45 g, 1.48 mmol), and p-toluenesulfonicacid (1 g, 5.81 mmol) wasdissolved in dry toluene (50 mL), followed by the addition of 1 mL piperidine as catalyst. The mixture

Sensors 2017, 17, 2517 3 of 10
was refluxed with stirring for 12 h under an atmosphere of nitrogen, during which time the color of thereaction mixture changed from pale yellow to red. After cooling to room temperature, the mixture waspoured into H2O (100 mL) and extracted with CH2Cl2. After solvent removal, the crude product waspurified by column chromatography (silica gel, CH2Cl2/petroleum ether, v/v = 2/1), producing a darkpurple solid (0.45 g), yield 49%. 1H-NMR (400 MHz, DMSO-d6) δ = 8.61–8.60 (m, 2H), 7.92 (s, 1H), 7.84(s, 1H), 7.65–7.62 (m, 2H), 7.38 (d, J = 5.6 Hz, 2H), 7.25 (d, J = 5.2 Hz, J = 5.2 Hz, 2H), 7.20–7.18 (m, 2H),7.17 (d, J = 2.8 Hz, 2H), 6.72 (d, J = 6.0 Hz, 2H), 6.68 (s, 1H), 6.16 (s, 1H), 4.87 (s, 4H), 2.48 (s, 3H), 2.32(s, 3H), 2.31 (s, 3H). (Figure S1, Supplementary Materials). 13C-NMR (100 MHz, DMSO-d6) δ = 157.67,150.75, 150.07, 149.40, 148.72, 140.24, 139.84, 136.69, 136.49, 133.39, 132.27, 128.63, 124.96, 124.08, 122.98,121.81, 120.34, 117.88, 114.17, 113.24, 112.24, 56.83, 13.66, 10.73, 10.65. (Figure S2, SupplementaryMaterials). MALDI-TOFMS: m/z calculated for C33H31B2F4N7: 623.28; found: 623.47. (Figure S3,Supplementary Materials).
Sensors 2017, 17, 2517 3 of 10
removal, the crude product was purified by column chromatography (silica gel, CH2Cl2/petroleum ether, v/v = 2/1), producing a dark purple solid (0.45 g), yield 49%. 1H NMR (400 MHz, DMSO-d6) δ = 8.61–8.60 (m, 2H), 7.92 (s, 1H), 7.84 (s, 1H), 7.65–7.62 (m, 2H), 7.38 (d, J = 5.6 Hz, 2H), 7.25 (d, J = 5.2 Hz, J = 5.2 Hz, 2H), 7.20-7.18 (m, 2H), 7.17 (d, J = 2.8 Hz, 2H), 6.72 (d, J = 6.0 Hz, 2H), 6.68 (s, 1H), 6.16 (s, 1H), 4.87 (s, 4H), 2.48 (s, 3H), 2.32 (s, 3H), 2.31 (s, 3H). (Figure S1, Supplementary Materials). 13C NMR (100 MHz, DMSO-d6) δ = 157.67, 150.75, 150.07, 149.40, 148.72, 140.24, 139.84, 136.69, 136.49, 133.39, 132.27, 128.63, 124.96, 124.08, 122.98, 121.81, 120.34, 117.88, 114.17, 113.24, 112.24, 56.83, 13.66, 10.73, 10.65. (Figure S2, Supplementary Materials). MALDI-TOFMS: m/z calculated for C33H31B2F4N7: 623.28; found: 623.47. (Figure S3, Supplementary Materials).
Figure 1. The synthesis route of 1
2.3. Sample Preparation and Spectral Measurements
A stock solution (0.5 mM) of sensor 1 was prepared in acetonitrile. Metal ion solutions of Cd2+, Zn2+, Mn2+, Pb2+, Cu2+, Co2+, Mg2+, Ca2+, Ba2+, Fe2+, and Hg2+ were prepared by dissolving the corresponding nitrate salts in acetonitrile. These stock solutions were diluted to needed concentrations for sensor testing. UV-Vis and fluorescent spectra were measured under room temperature. Briefly, 2.5 mL solution of 1 (2 μM) was put into a 1 cm quartz cuvette, followed by addition of different concentrations of metal ion. The series of concentrations of metal ions were thus added and were measured for the absorption and fluorescence spectra. Since added volume of the metal ion stock solution was small (up to 8 μL), the concentration of sensor 1 would remain almost unchanged. For fluorescence spectra measurement, the excitation wavelength was set at 410 nm and slit widths at 5 nm/10 nm.
3. Results and Discussion
3.1. Spectral Change of 1 Upon Titration with Cd2+
As shown in Figure 2, the absorption spectrum of pristine 1 has two pronounced peaks around 505 nm and 550 nm. These two absorption peaks are significantly red-shifted in comparison with those of Me4BOPHY, which has the corresponding two peaks at 444 nm and 467 nm. Such spectral redshift is due to the ICT electronic transition, as previously observed in other electron donor-acceptor molecules [29]. In molecule 1 the fluorophore Me4BOPHY is in full conjugation with the aniline group of BPA through the vinyl bridge (Scheme 1), thus facilitating the ICT transition. Upon titration with Cd2+ ion, the absorption at 550 nm gradually decreased, accompanied by a rising blue-shifted absorption peak centered at 475 nm. An isosbestic point was clearly seen around 520 nm, indicating the stoichiometric conversion of molecule 1 from unbound to the Cd2+-bound state. As the concentration of Cd2+ increased, the color of the solution turned from red to bright yellow, consistent the absorption spectral change shown in Figure 2. The observed spectral change is due to the binding of Cd2+ at the BPA chelator (Scheme 2), which in turn reduces the electron-donating capability of the aniline moiety. As a result, the ICT transition of molecule 1 is
Figure 1. The synthesis route of 1.
2.3. Sample Preparation and Spectral Measurements
A stock solution (0.5 mM) of sensor 1 was prepared in acetonitrile. Metal ion solutions of Cd2+,Zn2+, Mn2+, Pb2+, Cu2+, Co2+, Mg2+, Ca2+, Ba2+, Fe2+, and Hg2+ were prepared by dissolving thecorresponding nitrate salts in acetonitrile. These stock solutions were diluted to needed concentrationsfor sensor testing. UV-Vis and fluorescent spectra were measured under room temperature. Briefly,2.5 mL solution of 1 (2 µM) was put into a 1 cm quartz cuvette, followed by addition of differentconcentrations of metal ion. The series of concentrations of metal ions were thus added and weremeasured for the absorption and fluorescence spectra. Since added volume of the metal ion stocksolution was small (up to 8 µL), the concentration of sensor 1 would remain almost unchanged.For fluorescence spectra measurement, the excitation wavelength was set at 410 nm and slit widths at5 nm/10 nm.
3. Results and Discussion
3.1. Spectral Change of 1 Upon Titration with Cd2+
As shown in Figure 2, the absorption spectrum of pristine 1 has two pronounced peaks around505 nm and 550 nm. These two absorption peaks are significantly red-shifted in comparison withthose of Me4BOPHY, which has the corresponding two peaks at 444 nm and 467 nm. Such spectralredshift is due to the ICT electronic transition, as previously observed in other electron donor-acceptormolecules [29]. In molecule 1 the fluorophore Me4BOPHY is in full conjugation with the anilinegroup of BPA through the vinyl bridge (Scheme 1), thus facilitating the ICT transition. Upon titrationwith Cd2+ ion, the absorption at 550 nm gradually decreased, accompanied by a rising blue-shiftedabsorption peak centered at 475 nm. An isosbestic point was clearly seen around 520 nm, indicating thestoichiometric conversion of molecule 1 from unbound to the Cd2+-bound state. As the concentration

Sensors 2017, 17, 2517 4 of 10
of Cd2+ increased, the color of the solution turned from red to bright yellow, consistent the absorptionspectral change shown in Figure 2. The observed spectral change is due to the binding of Cd2+ at theBPA chelator (Scheme 2), which in turn reduces the electron-donating capability of the aniline moiety.As a result, the ICT transition of molecule 1 is diminished. Indeed, as molecule 1 is fully chelated,the absorption spectrum becomes mostly characteristic of the π − π transition of the Me4BOPHY part,centered around 475 nm (Figure 2).
Sensors 2017, 17, 2517 4 of 10
diminished. Indeed, as molecule 1 is fully chelated, the absorption spectrum becomes mostly characteristic of the π − π transition of the Me4BOPHY part, centered around 475 nm (Figure 2).
Figure 2. UV-vis absorption spectral change recorded for an acetonitrile solution of sensor 1 (2 μM) upon the titration of Cd2+ ion.
Scheme 2. Sensing mechanism of 1 towards Cd2+.
The same series of titration of Figure 2 was also monitored for fluorescence spectral change, as shown in Figure 3a. The unbound molecule 1 has an emission band centered at 675 nm, which is significantly red-shifted in comparison to the two emission bands (485 nm and 518 nm) that are typically observed for the fluorophore of tetramethyl substituted BOPHY (Me4BOPHY). The strong redshift is mainly a result of the ICT transition (Scheme 2), which in turn is caused by the BPA substitution. Upon binding with the Cd2+ ion, the emission peak was blue-shifted to 570 nm, implying that the ICT transition is diminished, as discussed above. The fluorescence quantum yield of pristine 1 determined as 7.6% by using Rhodamine B in acetonitrile as a standard (φF = 0.89, λex = 495 nm). By comparing the total fluorescence intensity and the absorbance at the same excitation wavelength 495 nm between the unbound and Cd2+-bound state of 1, the fluorescence quantum yield of Cd2+-bound 1 can be estimated to be 44.2%. The spectral change shown in Figure 3a enables ratiometric sensing by plotting the ratio of fluorescent intensity at 570 nm and 730 nm (F570/F730) as a function of the concentration of Cd2+ (relative to that of 1), as shown in Figure 3b. An approximately linear relationship was obtained, allowing for determining the concentration of Cd2+
using this linear calibration. The limit of detection (LOD) can be projected by taking three times the standard deviation of measurement as the detectable signal, that is, 0.3 in this study. Using the slope of the linear fitting of Figure 3b, we can determine the LOD to be 6.9 nM, or 0.77 ppb, which is far
Figure 2. UV-vis absorption spectral change recorded for an acetonitrile solution of sensor 1 (2 µM)upon the titration of Cd2+ ion.
Sensors 2017, 17, 2517 4 of 10
diminished. Indeed, as molecule 1 is fully chelated, the absorption spectrum becomes mostly characteristic of the π − π transition of the Me4BOPHY part, centered around 475 nm (Figure 2).
Figure 2. UV-vis absorption spectral change recorded for an acetonitrile solution of sensor 1 (2 μM) upon the titration of Cd2+ ion.
Scheme 2. Sensing mechanism of 1 towards Cd2+.
The same series of titration of Figure 2 was also monitored for fluorescence spectral change, as shown in Figure 3a. The unbound molecule 1 has an emission band centered at 675 nm, which is significantly red-shifted in comparison to the two emission bands (485 nm and 518 nm) that are typically observed for the fluorophore of tetramethyl substituted BOPHY (Me4BOPHY). The strong redshift is mainly a result of the ICT transition (Scheme 2), which in turn is caused by the BPA substitution. Upon binding with the Cd2+ ion, the emission peak was blue-shifted to 570 nm, implying that the ICT transition is diminished, as discussed above. The fluorescence quantum yield of pristine 1 determined as 7.6% by using Rhodamine B in acetonitrile as a standard (φF = 0.89, λex = 495 nm). By comparing the total fluorescence intensity and the absorbance at the same excitation wavelength 495 nm between the unbound and Cd2+-bound state of 1, the fluorescence quantum yield of Cd2+-bound 1 can be estimated to be 44.2%. The spectral change shown in Figure 3a enables ratiometric sensing by plotting the ratio of fluorescent intensity at 570 nm and 730 nm (F570/F730) as a function of the concentration of Cd2+ (relative to that of 1), as shown in Figure 3b. An approximately linear relationship was obtained, allowing for determining the concentration of Cd2+
using this linear calibration. The limit of detection (LOD) can be projected by taking three times the standard deviation of measurement as the detectable signal, that is, 0.3 in this study. Using the slope of the linear fitting of Figure 3b, we can determine the LOD to be 6.9 nM, or 0.77 ppb, which is far
Scheme 2. Sensing mechanism of 1 towards Cd2+.
The same series of titration of Figure 2 was also monitored for fluorescence spectral change,as shown in Figure 3a. The unbound molecule 1 has an emission band centered at 675 nm, which issignificantly red-shifted in comparison to the two emission bands (485 nm and 518 nm) that are typicallyobserved for the fluorophore of tetramethyl substituted BOPHY (Me4BOPHY). The strong redshiftis mainly a result of the ICT transition (Scheme 2), which in turn is caused by the BPA substitution.Upon binding with the Cd2+ ion, the emission peak was blue-shifted to 570 nm, implying that the ICTtransition is diminished, as discussed above. The fluorescence quantum yield of pristine 1 determinedas 7.6% by using Rhodamine B in acetonitrile as a standard (ϕF = 0.89, λex = 495 nm). By comparingthe total fluorescence intensity and the absorbance at the same excitation wavelength 495 nm betweenthe unbound and Cd2+-bound state of 1, the fluorescence quantum yield of Cd2+-bound 1 can be

Sensors 2017, 17, 2517 5 of 10
estimated to be 44.2%. The spectral change shown in Figure 3a enables ratiometric sensing by plottingthe ratio of fluorescent intensity at 570 nm and 730 nm (F570/F730) as a function of the concentrationof Cd2+ (relative to that of 1), as shown in Figure 3b. An approximately linear relationship wasobtained, allowing for determining the concentration of Cd2+ using this linear calibration. The limitof detection (LOD) can be projected by taking three times the standard deviation of measurement asthe detectable signal, that is, 0.3 in this study. Using the slope of the linear fitting of Figure 3b, we candetermine the LOD to be 6.9 nM, or 0.77 ppb, which is far below the safety value set for drinkingwater by WHO (3 ppb), indicating a strong feasibility of using sensor 1 for trace level detection ofCd2+. The ratiometric sensing, relying on the fluorescence measurement of both bound and unboundstate of 1, could potentially improve the robustness of signal by canceling the interference from theenvironment. By comparing with other fluorescence sensors for Cd2+ reported in literature (Table 1),sensor 1 developed in this study has many advantages over other Cd2+ sensors.
Sensors 2017, 17, 2517 5 of 10
below the safety value set for drinking water by WHO (3 ppb), indicating a strong feasibility of using sensor 1 for trace level detection of Cd2+. The ratiometric sensing, relying on the fluorescence measurement of both bound and unbound state of 1, could potentially improve the robustness of signal by canceling the interference from the environment. By comparing with other fluorescence sensors for Cd2+ reported in literature (Table 1), sensor 1 developed in this study has many advantages over other Cd2+ sensors.
Figure 3. (a) Fluorescence spectral change recorded for an acetonitrile solution of sensor 1 (2 μM) upon titration of Cd2+ ion; (b) The ratio of fluorescence intensity (F570/F730) measured for the same solutions at 570 nm and 730 nm as a function of the concentration of Cd2+ (relative to that of 1), showing linear fitting as indicated in the plot.
Table 1. The comparison of 1 with other Cd2+ sensors in literature
Refs. LOD (mol L−1) Wavelength of Emission Solvent Used [7] 1.97 × 10⁻⁷ 456 nm CH2Cl2/CH3CN (1/9) [8] 2.76 × 10⁻⁷ 500 nm H2O [18] 1.76 × 10⁻⁷ 495 nm/558 nm HEPES [29] Not available 597 nm CH3COCH3/H2O (9/1)
This work 6.9 × 10⁻⁹ 570 nm/730 nm CH3CN
3.2. Sensing Mechanism and Job’s Plot
As illustrated in Scheme 2, the sensing mechanism of 1 relies on switching the fluorescence from ICT transition to local π − π transition at the BOPHY site. The BPA chelator affords strong binding to the Cd2+ ion, and this weakens the electron donating power of the aniline moiety, thus diminishing the ICT transition. The tridentate chelation of BPA forms 1:1 complex with Cd2+ ion, as also reported in other studies wherein the same chelator was used [29]. The 1:1 chelation stoichiometry was also confirmed in this study through a Job’s plot approach [44], as shown in Figure 4. Job’s plot is commonly used to determine the stoichiometry of a complex between two species, for which the total molar concentrations of the two species (here molecule 1 and Cd2+ ion) are kept constant, while their relative concentrations are varied. A measured variable (here the fluorescence intensity ratio, F570/F730) that is dependent on the complex formation can be plotted as a function of the molar fractions of the binding species. The maximum of the plot corresponds to the stoichiometry of the complex formed. In this study, the total concentration of molecule 1 and Cd2+ ion was fixed at 2 μM, and the molar ratio of the two species was changed from 1:9 to 9:1, and the fluorescence intensity ratio F570/F730 was measured under the same conditions. Clearly, as shown in Figure 4, the maximum of the plot corresponds to a 1:1 complex between 1 and Cd2+.
Figure 3. (a) Fluorescence spectral change recorded for an acetonitrile solution of sensor 1 (2 µM) upontitration of Cd2+ ion; (b) The ratio of fluorescence intensity (F570/F730) measured for the same solutionsat 570 nm and 730 nm as a function of the concentration of Cd2+ (relative to that of 1), showing linearfitting as indicated in the plot.
Table 1. The comparison of 1 with other Cd2+ sensors in literature.
Refs. LOD (mol L−1) Wavelength of Emission Solvent Used
[7] 1.97 × 10⁻⁷ 456 nm CH2Cl2/CH3CN (1/9)[8] 2.76 × 10⁻⁷ 500 nm H2O[18] 1.76 × 10⁻⁷ 495 nm/558 nm HEPES[29] Not available 597 nm CH3COCH3/H2O (9/1)
This work 6.9 × 10⁻⁹ 570 nm/730 nm CH3CN
3.2. Sensing Mechanism and Job’s Plot
As illustrated in Scheme 2, the sensing mechanism of 1 relies on switching the fluorescence fromICT transition to local π − π transition at the BOPHY site. The BPA chelator affords strong binding tothe Cd2+ ion, and this weakens the electron donating power of the aniline moiety, thus diminishingthe ICT transition. The tridentate chelation of BPA forms 1:1 complex with Cd2+ ion, as also reportedin other studies wherein the same chelator was used [29]. The 1:1 chelation stoichiometry was alsoconfirmed in this study through a Job’s plot approach [44], as shown in Figure 4. Job’s plot is commonlyused to determine the stoichiometry of a complex between two species, for which the total molarconcentrations of the two species (here molecule 1 and Cd2+ ion) are kept constant, while their relativeconcentrations are varied. A measured variable (here the fluorescence intensity ratio, F570/F730) that isdependent on the complex formation can be plotted as a function of the molar fractions of the binding

Sensors 2017, 17, 2517 6 of 10
species. The maximum of the plot corresponds to the stoichiometry of the complex formed. In thisstudy, the total concentration of molecule 1 and Cd2+ ion was fixed at 2 µM, and the molar ratio of thetwo species was changed from 1:9 to 9:1, and the fluorescence intensity ratio F570/F730 was measuredunder the same conditions. Clearly, as shown in Figure 4, the maximum of the plot corresponds toa 1:1 complex between 1 and Cd2+.Sensors 2017, 17, 2517 6 of 10
Figure 4. Job’s plot of the binding between 1 and Cd2+ in acetonitrile, with the total concentration of the two species fixed at 2 μM.
3.3. Sensing Selectivity
The high selectivity of 1 towards Cd2+ ion was examined by comparative experiments, which were conducted by repeating the same fluorescence measurements shown in Figure 3 but in the presence of 10 other common metal ions, Mn2+, Pb2+, Cu2+, Co2+, Mg2+, Ca2+, Ba2+, Fe2+, Hg2+, and Zn2+. In contrast to the efficient spectral change observed for Cd2+ (far left bar in the figure), all of the other metal ions (except for Zn2+) demonstrated almost no spectral change, as indicated by the low values of F570/F730 measured under the same experimental conditions (Figure 5a). However, upon the addition of Cd2+ ion at the same concentration, all of the 10 solutions containing the different metal ions showed dramatic fluorescence change at the same degree as that observed for the solution of 1 + Cd2+. This observation indicates good sensing selectivity for molecule 1 towards Cd2+, which in turn is largely due to the strong chelation, as illustrated in Scheme 2. The mild fluorescence response observed for Zn2+ ion is not surprised considering the similar coordination property between Zn2+ and Cd2+. However, due to the weaker electron affinity of Zn2+ ion (with standard reduction potential of −0.7 V, as compared to that of Cd2+, −0.4 V), the binding with Zn2+ cannot block the ICT transition as effectively as Cd2+. Indeed, as shown in Figure 5b, under the same concentration the solution of 1 + Cd2+ exhibited a dramatic fluorescence color change (consistent with the spectral measurement shown Figure 3), whereas the solution of 1 + Zn2+ remained about the same color as the solution of 1. Such dramatic difference in color change provides additional feature to distinguish Cd2+ from other metal ions when using 1 as sensor.
d Figure 5. (a) Fluorescence intensity ratio (F570/F730) measured for sensor 1 in acetonitrile (2 μM) in the absence of metal ions (black), and in the presence of various metal ions (2 μM), (blue), followed by addition of 2 μM Cd2+ into each of the eleven solutions (red); (b) Photographs taken for the 2 μM solution of 1, in comparison to the ones containing 2 μM of Zn2+ and Cd2+.
Figure 4. Job’s plot of the binding between 1 and Cd2+ in acetonitrile, with the total concentration ofthe two species fixed at 2 µM.
3.3. Sensing Selectivity
The high selectivity of 1 towards Cd2+ ion was examined by comparative experiments, which wereconducted by repeating the same fluorescence measurements shown in Figure 3 but in the presenceof 10 other common metal ions, Mn2+, Pb2+, Cu2+, Co2+, Mg2+, Ca2+, Ba2+, Fe2+, Hg2+, and Zn2+.In contrast to the efficient spectral change observed for Cd2+ (far left bar in the figure), all of theother metal ions (except for Zn2+) demonstrated almost no spectral change, as indicated by the lowvalues of F570/F730 measured under the same experimental conditions (Figure 5a). However, upon theaddition of Cd2+ ion at the same concentration, all of the 10 solutions containing the different metalions showed dramatic fluorescence change at the same degree as that observed for the solution of1 + Cd2+. This observation indicates good sensing selectivity for molecule 1 towards Cd2+, which inturn is largely due to the strong chelation, as illustrated in Scheme 2. The mild fluorescence responseobserved for Zn2+ ion is not surprised considering the similar coordination property between Zn2+
and Cd2+. However, due to the weaker electron affinity of Zn2+ ion (with standard reduction potentialof −0.7 V, as compared to that of Cd2+, −0.4 V), the binding with Zn2+ cannot block the ICT transitionas effectively as Cd2+. Indeed, as shown in Figure 5b, under the same concentration the solution of1 + Cd2+ exhibited a dramatic fluorescence color change (consistent with the spectral measurementshown Figure 3), whereas the solution of 1 + Zn2+ remained about the same color as the solution of 1.Such dramatic difference in color change provides additional feature to distinguish Cd2+ from othermetal ions when using 1 as sensor.

Sensors 2017, 17, 2517 7 of 10
Sensors 2017, 17, 2517 6 of 10
Figure 4. Job’s plot of the binding between 1 and Cd2+ in acetonitrile, with the total concentration of the two species fixed at 2 μM.
3.3. Sensing Selectivity
The high selectivity of 1 towards Cd2+ ion was examined by comparative experiments, which were conducted by repeating the same fluorescence measurements shown in Figure 3 but in the presence of 10 other common metal ions, Mn2+, Pb2+, Cu2+, Co2+, Mg2+, Ca2+, Ba2+, Fe2+, Hg2+, and Zn2+. In contrast to the efficient spectral change observed for Cd2+ (far left bar in the figure), all of the other metal ions (except for Zn2+) demonstrated almost no spectral change, as indicated by the low values of F570/F730 measured under the same experimental conditions (Figure 5a). However, upon the addition of Cd2+ ion at the same concentration, all of the 10 solutions containing the different metal ions showed dramatic fluorescence change at the same degree as that observed for the solution of 1 + Cd2+. This observation indicates good sensing selectivity for molecule 1 towards Cd2+, which in turn is largely due to the strong chelation, as illustrated in Scheme 2. The mild fluorescence response observed for Zn2+ ion is not surprised considering the similar coordination property between Zn2+ and Cd2+. However, due to the weaker electron affinity of Zn2+ ion (with standard reduction potential of −0.7 V, as compared to that of Cd2+, −0.4 V), the binding with Zn2+ cannot block the ICT transition as effectively as Cd2+. Indeed, as shown in Figure 5b, under the same concentration the solution of 1 + Cd2+ exhibited a dramatic fluorescence color change (consistent with the spectral measurement shown Figure 3), whereas the solution of 1 + Zn2+ remained about the same color as the solution of 1. Such dramatic difference in color change provides additional feature to distinguish Cd2+ from other metal ions when using 1 as sensor.
d Figure 5. (a) Fluorescence intensity ratio (F570/F730) measured for sensor 1 in acetonitrile (2 μM) in the absence of metal ions (black), and in the presence of various metal ions (2 μM), (blue), followed by addition of 2 μM Cd2+ into each of the eleven solutions (red); (b) Photographs taken for the 2 μM solution of 1, in comparison to the ones containing 2 μM of Zn2+ and Cd2+.
Figure 5. (a) Fluorescence intensity ratio (F570/F730) measured for sensor 1 in acetonitrile (2 µM) inthe absence of metal ions (black), and in the presence of various metal ions (2 µM), (blue), followedby addition of 2 µM Cd2+ into each of the eleven solutions (red); (b) Photographs taken for the 2 µMsolution of 1, in comparison to the ones containing 2 µM of Zn2+ and Cd2+.
3.4. Fast Sensor Response
The sensor 1 could rapidly detect Cd2+ ion, as shown in Figure 6. When we put 2 µM Cd2+ into2 µM sensor 1 solution, the fluorescence intensity ratio (F570/F730) of sensor 1 quickly increased andreached a stable value within 1 min. This is a good trait for fast and real-time determination.
Sensors 2017, 17, 2517 7 of 10
3.4. Fast Sensor Response
The sensor 1 could rapidly detect Cd2+ ion, as shown in Figure 6. When we put 2 μM Cd2+ into 2 μM sensor 1 solution, the fluorescence intensity ratio (F570/F730) of sensor 1 quickly increased and reached a stable value within 1 min. This is a good trait for fast and real-time determination.
In addition to the high sensitivity and selectivity observed above, sensor 1 also demonstrated a fast response, consistent with the strong chelation with Cd2+. As shown in Figure 6, the ratiometric fluorescence response of 1 was finished in one min upon addition of 1:1 Cd2+ ion. Due to the experimental operation limit, we could not monitor the sensor response in any faster time scale, though the real response time of 1 seems to be in seconds or even faster. This fast fluorescence response makes sensor 1 ideal for real-time monitoring, particularly for in-field detection. Also indicated from Figure 6 is the high photostability sensor 1, wherein the fluorescence of 1 was measured ten times after binding with Cd2+ ion, but no significant change in the fluorescence intensity was observed.
Figure 6. Time course of the fluorescence intensity ratio (F570/F730) change measured on an acetonitrile solution of sensor 1 (2 μM) upon addition of Cd2+ ion (2 μM).
4. Conclusions
We report on a novel fluorescence sensor 1 for the selective detection of Cd2+ ion with LOD down to 0.77 ppb. The sensor molecule is based on a fluorophore of Me4BOPHY in conjugation with an electron donor group, namely BPA, which also affords strong binding with Cd2+. The electron donor-acceptor conjugation enables ICT fluorescence at long wavelength, desired for sensor development. Upon binding with the Cd2+ ion, the fluorescence is switched from ICT transition to be the π − π transition, which dominated by the Me4BOPHY fluorophore, which is located in much shorter wavelength region. Such dramatic fluorescence change enables ratiometric sensing by measuring the relative emission intensity at the two wavelengths as a function of the concentration of Cd2+ ion, thus allowing for quantitative detection of Cd2+. High selectivity towards Cd2+ was also evidenced for the sensor as examined with ten other common metal ions.
Supplementary Materials: The Supplementary Materials are available online at http://www.mdpi.com/1424-8220/17/11/2517/s1.
Acknowledgments: This work was financially supported by the Qinghai Science & Technology Department of China (Grant No. 2016-HZ-806), the National Natural Science Foundation of China (Grant No. 21362027), the China Scholarship Council (CSC) and the Qinghai University (Grant No. 2015-QGY-5).
Figure 6. Time course of the fluorescence intensity ratio (F570/F730) change measured on an acetonitrilesolution of sensor 1 (2 µM) upon addition of Cd2+ ion (2 µM).
In addition to the high sensitivity and selectivity observed above, sensor 1 also demonstrateda fast response, consistent with the strong chelation with Cd2+. As shown in Figure 6, the ratiometricfluorescence response of 1 was finished in one min upon addition of 1:1 Cd2+ ion. Due to theexperimental operation limit, we could not monitor the sensor response in any faster time scale,though the real response time of 1 seems to be in seconds or even faster. This fast fluorescence responsemakes sensor 1 ideal for real-time monitoring, particularly for in-field detection. Also indicated from

Sensors 2017, 17, 2517 8 of 10
Figure 6 is the high photostability sensor 1, wherein the fluorescence of 1 was measured ten times afterbinding with Cd2+ ion, but no significant change in the fluorescence intensity was observed.
4. Conclusions
We report on a novel fluorescence sensor 1 for the selective detection of Cd2+ ion with LODdown to 0.77 ppb. The sensor molecule is based on a fluorophore of Me4BOPHY in conjugation withan electron donor group, namely BPA, which also affords strong binding with Cd2+. The electrondonor-acceptor conjugation enables ICT fluorescence at long wavelength, desired for sensordevelopment. Upon binding with the Cd2+ ion, the fluorescence is switched from ICT transitionto be the π − π transition, which dominated by the Me4BOPHY fluorophore, which is located inmuch shorter wavelength region. Such dramatic fluorescence change enables ratiometric sensing bymeasuring the relative emission intensity at the two wavelengths as a function of the concentration ofCd2+ ion, thus allowing for quantitative detection of Cd2+. High selectivity towards Cd2+ was alsoevidenced for the sensor as examined with ten other common metal ions.
Supplementary Materials: The Supplementary Materials are available online at http://www.mdpi.com/1424-8220/17/11/2517/s1.
Acknowledgments: This work was financially supported by the Qinghai Science & Technology Departmentof China (Grant No. 2016-HZ-806), the National Natural Science Foundation of China (Grant No. 21362027),the China Scholarship Council (CSC) and the Qinghai University (Grant No. 2015-QGY-5).
Author Contributions: Dandan Cheng carried out the majority of experiments and wrote the article; Xingliang Liudesigned and synthesized sensor 1; Yadian Xie did part of the experiments under the help of Dandan Cheng;Haitang Lv measured the fluorescent spectra; Zhaoqian Wang was responsible for UV spectra measuriment;Hongzhi Yang did part of synthesis experiments; Aixia Han was responsible for the whole work; Xiaomei Yanghelped on data analysis and manuscript editing; Ling Zang helped supervising the research design.
Conflicts of Interest: The authors declare no conflict of interest.
References
1. Huff, J.; Lunn, R.M.; Waalkes, M.P.; Tomatis, L.; Infante, P.F. Cadmium-induced Cancers in Animals and inHumans. Int. J. Occup. Environ. Health 2007, 13, 202–212. [CrossRef] [PubMed]
2. World Health Organization. Available online: http://www.who.int/water_sanitation_health/publications/drinking-water-quality-guidelines-4-including-1st-addendum/en/ (accessed on 1 November 2017).
3. Wen, X.D.; Yang, Q.L.; Yan, Z.D.; Deng, Q.W. Determination of cadmium and copper in water and foodsamples by dispersive liquid–liquid microextraction combined with UV–vis spectrophotometry. Microchem. J.2011, 97, 249–254. [CrossRef]
4. Manzoori, J.L.; Bavili-Tabrizi, A. Cloud point preconcentration and flame atomic absorption spectrometricdetermination of Cd and Pb in human hair. Anal. Chim. Acta 2002, 470, 215–221. [CrossRef]
5. Rao, K.S.; Balaji, T.; Rao, T.P.; Babu, Y.; Naidu, G.R.K. Determination of iron, cobalt, nickel, manganese, zinc,copper, cadmium and lead in human hair by inductively coupled plasma-atomic emission spectrometry.Spectrochim. Acta Part B 2002, 57, 1333–1338.
6. Xue, L.; Liu, C.; Jiang, H. Highly Sensitive and Selective Fluorescent Sensor for Distinguishing Cadmiumfrom Zinc Ions in Aqueous Media. Org. Lett. 2009, 11, 1655–1658. [CrossRef] [PubMed]
7. Zhao, Q.; Li, R.F.; Xing, S.K.; Liu, X.M.; Hu, T.L.; Bu, X.H. A Highly Selective On/Off Fluorescence Sensorfor Cadmium(II). Inorg. Chem. 2011, 50, 10041–10046. [CrossRef] [PubMed]
8. Gunnlaugsson, T.; Lee, T.C.; Parkesh, R. Highly selective fluorescent chemosensors for cadmium in water.Tetrahedron 2004, 60, 11239–11249. [CrossRef]
9. Zhang, X.X.; Wang, R.J.; Fan, C.B.; Liu, G.; Pu, S.Z. A highly selective fluorescent sensor for Cd2+ based ona new diarylethene with a 1,8-naphthyridine unit. Dyes Pigments 2017, 139, 208–217. [CrossRef]
10. Khani, R.; Ghiamati, E.; Boroujerdi, R.; Rezaeifard, A.; Zaryabi, M.H. A new and highly selective turn-onfluorescent sensor with fast response time for the monitoring of cadmium ions in cosmetic, and healthproduct samples. Spectrochim. Acta Part A 2016, 163, 120–126. [CrossRef] [PubMed]

Sensors 2017, 17, 2517 9 of 10
11. Chao, D.B. Highly selective detection of Zn2+ and Cd2+ with a simple amino-terpyridine compound insolution and solid state. J. Chem. Sci. 2016, 128, 133–139. [CrossRef]
12. Zhou, X.Y.; Li, P.X.; Shi, Z.H.; Tang, X.L.; Chen, C.Y.; Liu, W.S. A Highly Selective Fluorescent Sensor forDistinguishing Cadmium from Zinc Ions Based on a Quinoline Platform. Inorg. Chem. 2012, 51, 9226–9231.[CrossRef] [PubMed]
13. Goswami, P.; Das, D.K. A New Highly Sensitive and Selective Fluorescent Cadmium Sensor. J. Fluoresc. 2012,22, 391–395. [CrossRef] [PubMed]
14. Zhou, Y.; Xiao, Y.; Qian, X.H. A highly selective Cd2+ sensor of naphthyridine: fluorescent enhancementand red-shift by the synergistic action of forming binuclear complex. Tetrahedron Lett. 2008, 49, 3380–3384.[CrossRef]
15. Mameli, M.; Aragoni, M.C.; Arca, M.; Caltagirone, C.; Demartin, F.; Farruggia, G.; De Filippo, G.;Devillanova, F.A.; Garau, A.; Isaia, F.; et al. A Selective, Nontoxic, OFF–ON Fluorescent Molecular SensorBased on 8-Hydroxyquinoline for Probing Cd2+ in Living Cells. Chem. Eur. J. 2010, 16, 919–930. [CrossRef][PubMed]
16. Liu, Y.; Qiao, Q.L.; Zhao, M.; Yin, W.T.; Miao, L.; Wang, L.Q.; Xu, Z.C. Cd2+-triggered amide tautomerizationproduces a highly Cd2+-selective fluorescent sensor across a wide pH range. Dyes Pigments 2016, 133,339–344. [CrossRef]
17. Lu, C.L.; Xu, Z.C.; Cui, J.N.; Zhang, R.; Qian, X.H. Ratiometric and Highly Selective Fluorescent Sensor forCadmium under Physiological pH Range: A New Strategy to Discriminate Cadmium from Zinc. J. Org. Chem.2007, 72, 3554–3557. [CrossRef] [PubMed]
18. Xue, L.; Li, G.P.; Liu, Q.; Wang, H.H.; Liu, C.; Ding, X.L.; He, S.G.; Jiang, H. Ratiometric FluorescentSensor Based on Inhibition of Resonance for Detection of Cadmium in Aqueous Solution and Living Cells.Inorg. Chem. 2011, 50, 3680–3690. [CrossRef] [PubMed]
19. Taki, M.; Desaki, M.; Ojida, A.; Iyoshi, S.; Hirayama, T.; Hamachi, I.; Yamamoto, Y. Fluorescence Imagingof Intracellular Cadmium Using a Dual-Excitation Ratiometric Chemosensor. J. Am. Chem. Soc. 2008, 130,12564–12565. [CrossRef] [PubMed]
20. Chiu, T.Y.; Chen, P.H.; Chang, C.L.; Yang, D.M. Live-Cell Dynamic Sensing of Cd2+ with a FRET-BasedIndicator. PLoS ONE 2013, 8, e65853. [CrossRef] [PubMed]
21. Wang, C.; Huang, H.L.; Bunes, B.R.; Wu, N.; Xu, M.; Yang, X.M.; Yu, L.; Zang, L. Trace Detection of RDX,HMX and PETN Explosives Using a Fluorescence Spot Sensor. Sci. Rep. 2016, 6, 25015. [CrossRef] [PubMed]
22. Xu, M.; Han, J.M.; Wang, C.; Yang, X.M.; Pei, J.; Zang, L. Fluorescence Ratiometric Sensor for Trace VaporDetection of Hydrogen Peroxide. ACS Appl. Mater. Interfaces 2014, 6, 8708–8714. [CrossRef] [PubMed]
23. Kamiya, M.; Johnsson, K. Localizable and Highly Sensitive Calcium Indicator Based on a BODIPYFluorophore. Anal. Chem. 2010, 82, 6472–6479. [CrossRef] [PubMed]
24. Atilgan, S.; Kutuk, I.; Ozdemir, T. A near IR distyryl BODIPY-based ratiometric fluorescent chemosensor forHg(II). Tetrahedron Lett. 2010, 51, 892–894. [CrossRef]
25. Qi, X.; Jun, E.J.; Xu, L.; Kim, S.J.; Joong Hong, J.S.; Yoon, Y.J.; Yoon, J. New BODIPY Derivatives as OFF−ONFluorescent Chemosensor and Fluorescent Chemodosimeter for Cu2+: Cooperative Selectivity Enhancementtoward Cu2+. J. Org. Chem. 2006, 71, 2881–2884. [CrossRef] [PubMed]
26. Wu, Y.K.; Peng, X.J.; Guo, B.C.; Fan, J.L.; Zhang, Z.C.; Wang, J.Y.; Cui, A.J.; Gao, Y.L. Boron dipyrromethenefluorophore based fluorescence sensor for the selective imaging of Zn (II) in living cells. Org. Biomol. Chem.2005, 3, 1387–1392. [CrossRef] [PubMed]
27. Liu, J.; Wu, K.; Li, S.; Song, T.; Han, Y.F.; Li, X. A highly sensitive and selective fluorescent chemosensor forPb2+ ions in an aqueous solution. Dalton Trans. 2013, 42, 3854–3859. [CrossRef] [PubMed]
28. Cheng, T.Y.; Xu, Y.F.; Zhang, S.Y.; Zhu, W.P.; Qian, X.H.; Duan, L.P. A Highly Sensitive and Selective OFF-ONFluorescent Sensor for Cadmium in Aqueous Solution and Living Cell. J. Am. Chem. Soc. 2008, 130,16160–16161. [CrossRef] [PubMed]
29. Peng, X.J.; Du, J.J.; Fan, J.L.; Wang, J.Y.; Wu, Y.K.; Zhao, J.Z.; Sun, S.G.; Xu, T. A Selective Fluorescent Sensorfor Imaging Cd2+ in Living Cells. J. Am. Chem. Soc. 2007, 129, 1500–1501. [CrossRef] [PubMed]
30. Tamgho, I.S.; Hasheminasab, A.; Engle, J.T.; Nemykin, V.N.; Ziegler, C.J. A new highly fluorescent andsymmetric pyrrole–BF2 chromophore: BOPHY. J. Am. Chem. Soc. 2014, 136, 5623–5626. [CrossRef] [PubMed]
31. Yu, C.J.; Jiao, L.J.; Zhang, P.; Feng, Z.Y.; Cheng, C.; Wei, Y.; Mu, X.L.; Hao, E.H. Highly fluorescent BF2complexes of hydrazine–Schiff base linked bispyrrole. Org. Lett. 2014, 16, 3048–3051. [CrossRef] [PubMed]

Sensors 2017, 17, 2517 10 of 10
32. Huaulmé, Q.; Mirloup, A.; Retailleau, P.; Ziessel, R. Synthesis of highly functionalized BOPHY chromophoresdisplaying large stokes shifts. Org. Lett. 2015, 17, 2246–2249. [CrossRef] [PubMed]
33. Rhoda, H.M.; Chanawanno, K.; King, A.J.; Zatsikha, Y.V.; Ziegler, C.J.; Nemykin, V.N. Unusually Strong LongDistance Metal-Metal Coupling in Bis (ferrocene) Containing BOPHY: An Introduction to OrganometallicBOPHYs. Chem. Eur. J. 2015, 21, 18043–18046. [CrossRef] [PubMed]
34. Wang, L.; Tamgho, I.S.; Crandall, L.; Rack, J.; Ziegler, C. Ultrafast dynamics of a new class of highlyfluorescent boron difluoride dyes. Phys. Chem. Chem. Phys. 2015, 17, 2349–2351. [CrossRef] [PubMed]
35. Sekhar, A.R.; Sariki, S.K.; Reddy, R.V.R.; Bisai, A.; Sahu, P.K.; Tomar, R.S.; Sankar, J. Zwitterionic BODIPYswith large stokes shift: Small molecular biomarkers for live cells. Chem. Commun. 2017, 53, 1096–1099.[CrossRef] [PubMed]
36. Zhou, L.; Xu, D.F.; Gao, H.Z.; Zhang, C.; Ni, F.F.; Zhao, W.Q.; Cheng, D.D.; Liu, X.L.; Han, A.X. β-Furan-Fusedbis (Difluoroboron)-1,2-bis ((1H-pyrrol-2-yl) methylene) hydrazine Fluorescent Dyes in the Visible Deep-RedRegion. J. Org. Chem. 2016, 81, 7439–7447. [CrossRef] [PubMed]
37. Li, Y.X.; Zhou, H.P.; Yin, S.H.; Jiang, H.; Niu, N.; Huang, H.; Shahzad, S.A.; Yu, C. A BOPHY probe for thefluorescence turn-on detection of Cu2+. Sens. Actuators B 2016, 235, 33–38. [CrossRef]
38. Jiang, X.D.; Su, Y.J.; Yue, S.; Li, C.; Yu, H.F.; Zhang, H.; Sun, C.L.; Xiao, L.J. Synthesis ofmono-(p-dimethylamino)styryl-containing BOPHY dye for a turn-on pH sensor. RSC Adv. 2015, 5,16735–16739. [CrossRef]
39. Xu, Z.C.; Xiao, Y.; Qian, X.H.; Cui, J.N.; Cui, D.W. Ratiometric and selective fluorescent sensor for CuII basedon internal charge transfer (ICT). Org. Lett. 2005, 7, 889–892. [CrossRef] [PubMed]
40. Wang, J.B.; Qian, X.H.; Cui, J.N. Detecting Hg2+ ions with an ICT fluorescent sensor molecule: Remarkableemission spectra shift and unique selectivity. J. Org. Chem. 2006, 71, 4308–4311. [CrossRef] [PubMed]
41. Bozdemir, O.A.; Guliyev, R.; Buyukcakir, O.; Selcuk, S.; Kolemen, S.; Gulseren, G.; Nalbantoglu, T.; Boyaci, H.;Akkaya, E.U. Selective manipulation of ICT and PET processes in styryl-bodipy derivatives: Applications inmolecular logic and fluorescence sensing of metal ions. J. Am. Chem. Soc. 2010, 132, 8029–8036. [CrossRef][PubMed]
42. Srikun, D.; Miller, E.W.; Domaille, D.W.; Chang, C.J. An ICT-based approach to ratiometric fluorescenceimaging of hydrogen peroxide produced in living cells. J. Am. Chem. Soc. 2008, 130, 4596–4597. [CrossRef][PubMed]
43. Thiagarajan, V.; Ramamurthy, P.; Thirumalai, D.; Ramakrishnan, V.T. A novel colorimetric and fluorescentchemosensor for anions involving PET and ICT pathways. Org. Lett. 2005, 7, 657–660. [CrossRef] [PubMed]
44. Zhao, W.Q.; Liu, X.L.; Lv, H.T.; Fu, H.; Yang, Y.; Huang, Z.P.; Han, A.X. A phenothiazine–rhodamineratiometric fluorescent probe for Hg2+ based on FRET and ICT. Tetrahedron Lett. 2015, 56, 4293–4298.[CrossRef]
© 2017 by the authors. Licensee MDPI, Basel, Switzerland. This article is an open accessarticle distributed under the terms and conditions of the Creative Commons Attribution(CC BY) license (http://creativecommons.org/licenses/by/4.0/).


![[1993]City Hunter CD2](https://img.pdfslide.net/doc/110x75/56d6be561a28ab301691ae4d/1993city-hunter-cd2.jpg)