Embed Size (px)
Citation preview
Delft University of Technology
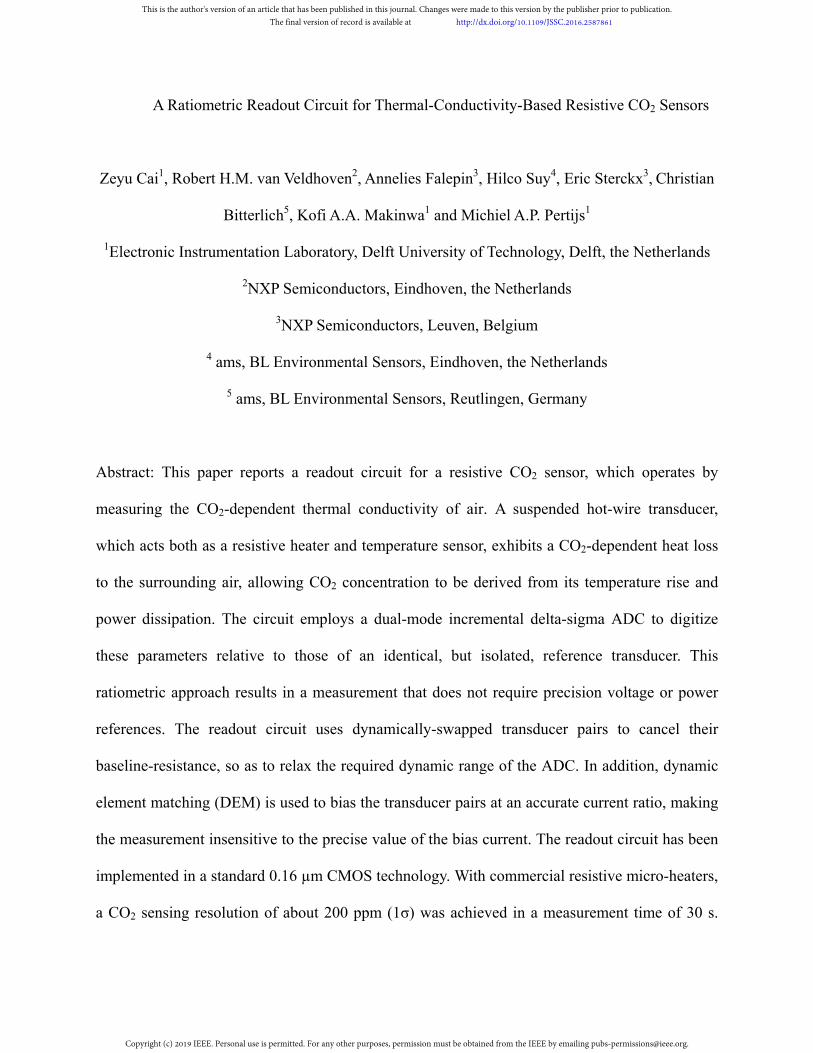
A Ratiometric Readout Circuit for Thermal-Conductivity-Based Resistive CO₂ Sensors
Cai, Z.; van Veldhoven, Robert H.M.; Falepin, A.; Suy, H.; Sterckx, E.; Bitterlich, C.; Makinwa, Kofi; Pertijs,MichielDOI10.1109/JSSC.2016.2587861Publication date2016Document VersionAccepted author manuscriptPublished inIEEE Journal of Solid State Circuits
Citation (APA)Cai, Z., van Veldhoven, R. H. M., Falepin, A., Suy, H., Sterckx, E., Bitterlich, C., ... Pertijs, M. A. P. (2016). ARatiometric Readout Circuit for Thermal-Conductivity-Based Resistive CO₂ Sensors. IEEE Journal of SolidState Circuits, 51(10), 2453‒2474. https://doi.org/10.1109/JSSC.2016.2587861
Important noteTo cite this publication, please use the final published version (if applicable).Please check the document version above.
CopyrightOther than for strictly personal use, it is not permitted to download, forward or distribute the text or part of it, without the consentof the author(s) and/or copyright holder(s), unless the work is under an open content license such as Creative Commons.
Takedown policyPlease contact us and provide details if you believe this document breaches copyrights.We will remove access to the work immediately and investigate your claim.
This work is downloaded from Delft University of Technology.For technical reasons the number of authors shown on this cover page is limited to a maximum of 10.
A Ratiometric Readout Circuit for Thermal-Conductivity-Based Resistive CO2 Sensors
Zeyu Cai1, Robert H.M. van Veldhoven2, Annelies Falepin3, Hilco Suy4, Eric Sterckx3, Christian
Bitterlich5, Kofi A.A. Makinwa1 and Michiel A.P. Pertijs1
1Electronic Instrumentation Laboratory, Delft University of Technology, Delft, the Netherlands
2NXP Semiconductors, Eindhoven, the Netherlands
3NXP Semiconductors, Leuven, Belgium
4 ams, BL Environmental Sensors, Eindhoven, the Netherlands
5 ams, BL Environmental Sensors, Reutlingen, Germany
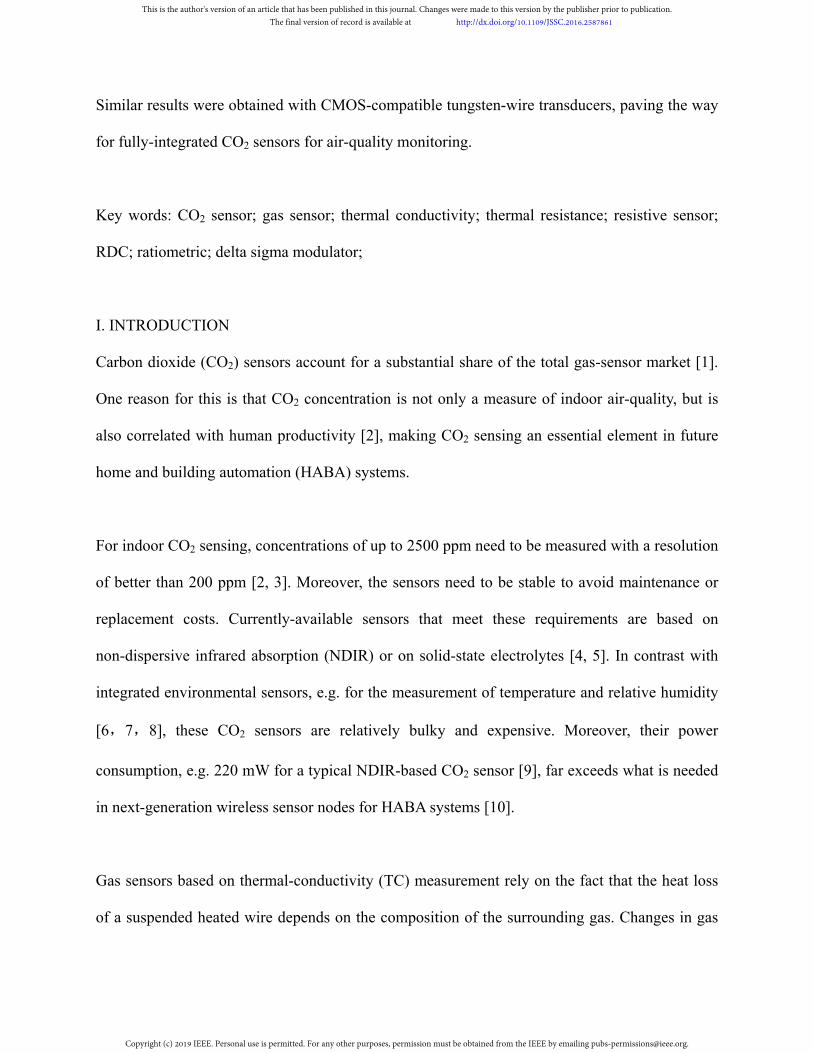
Abstract: This paper reports a readout circuit for a resistive CO2 sensor, which operates by
measuring the CO2-dependent thermal conductivity of air. A suspended hot-wire transducer,
which acts both as a resistive heater and temperature sensor, exhibits a CO2-dependent heat loss
to the surrounding air, allowing CO2 concentration to be derived from its temperature rise and
power dissipation. The circuit employs a dual-mode incremental delta-sigma ADC to digitize
these parameters relative to those of an identical, but isolated, reference transducer. This
ratiometric approach results in a measurement that does not require precision voltage or power
references. The readout circuit uses dynamically-swapped transducer pairs to cancel their
baseline-resistance, so as to relax the required dynamic range of the ADC. In addition, dynamic
element matching (DEM) is used to bias the transducer pairs at an accurate current ratio, making
the measurement insensitive to the precise value of the bias current. The readout circuit has been
implemented in a standard 0.16 µm CMOS technology. With commercial resistive micro-heaters,
a CO2 sensing resolution of about 200 ppm (1σ) was achieved in a measurement time of 30 s.
This is the author's version of an article that has been published in this journal. Changes were made to this version by the publisher prior to publication.The final version of record is available at http://dx.doi.org/10.1109/JSSC.2016.2587861
Copyright (c) 2019 IEEE. Personal use is permitted. For any other purposes, permission must be obtained from the IEEE by emailing [email protected].
Similar results were obtained with CMOS-compatible tungsten-wire transducers, paving the way
for fully-integrated CO2 sensors for air-quality monitoring.
Key words: CO2 sensor; gas sensor; thermal conductivity; thermal resistance; resistive sensor;
RDC; ratiometric; delta sigma modulator;
I. INTRODUCTION
Carbon dioxide (CO2) sensors account for a substantial share of the total gas-sensor market [1].
One reason for this is that CO2 concentration is not only a measure of indoor air-quality, but is
also correlated with human productivity [2], making CO2 sensing an essential element in future
home and building automation (HABA) systems.
For indoor CO2 sensing, concentrations of up to 2500 ppm need to be measured with a resolution
of better than 200 ppm [2, 3]. Moreover, the sensors need to be stable to avoid maintenance or
replacement costs. Currently-available sensors that meet these requirements are based on
non-dispersive infrared absorption (NDIR) or on solid-state electrolytes [4, 5]. In contrast with
integrated environmental sensors, e.g. for the measurement of temperature and relative humidity
[6,7,8], these CO2 sensors are relatively bulky and expensive. Moreover, their power
consumption, e.g. 220 mW for a typical NDIR-based CO2 sensor [9], far exceeds what is needed
in next-generation wireless sensor nodes for HABA systems [10].
Gas sensors based on thermal-conductivity (TC) measurement rely on the fact that the heat loss
of a suspended heated wire depends on the composition of the surrounding gas. Changes in gas
This is the author's version of an article that has been published in this journal. Changes were made to this version by the publisher prior to publication.The final version of record is available at http://dx.doi.org/10.1109/JSSC.2016.2587861
Copyright (c) 2019 IEEE. Personal use is permitted. For any other purposes, permission must be obtained from the IEEE by emailing [email protected].
composition can therefore be detected via changes in the wire’s temperature. This principle
forms the basis of low-cost sensors for the detection of gases such as Hydrogen, Helium, and
CO2, as the required heaters and sensors can be realized in IC technology [11, 12, 13]. Sensors
based on TC measurement are inherently nonselective, but in typical indoor scenarios, besides
the fluctuations in temperature, humidity and pressure, air composition is only altered by
exhalation, which causes a noticeable change in CO2 concentration. Cross-sensitivities to
temperature, humidity, or pressure can be compensated by integrating auxiliary environmental
sensors with the CO2 sensor. However, to realize TC-based CO2 sensors for monitoring indoor
CO2 levels is very challenging, as extremely small changes in thermal conductivity need to be
measured. Based on the thermal conductivities of air and CO2 at 25ºC (26 mW/K·m and 16.4
mW/K·m, respectively), a 200 ppm change in CO2 concentration only leads to <80 ppm change
in thermal conductivity, thus requiring a high-resolution temperature measurement, and, more
critically, an extremely stable power reference (any changes in heater power will lead to errors in
the measured temperature and thus errors in the measured thermal conductivity). As will be
detailed in Section II, for our CO2 sensor, a 50 ppm change of power corresponds to a 200 ppm
error in CO2 concentration. Unfortunately, the stability of on-chip power references is typically
not better than 4000 ppm [14,15,16], which is equivalent to 1.6% error in CO2 concentration
for our sensor. Prior TC-based CO2 sensors employ expensive off-chip circuits to control the
heating power [12, 13]. In addition, such sensors typically employ micro-machined structures
with separate transducers for heating and temperature sensing [17, 18], requiring relatively
complex and costly processing steps. Using a suspended resistor as both a heating and sensing
element significantly simplifies the fabrication process [19], but it requires a readout circuit that
is capable of accurately measuring both power dissipation and temperature.
This is the author's version of an article that has been published in this journal. Changes were made to this version by the publisher prior to publication.The final version of record is available at http://dx.doi.org/10.1109/JSSC.2016.2587861
Copyright (c) 2019 IEEE. Personal use is permitted. For any other purposes, permission must be obtained from the IEEE by emailing [email protected].
This paper presents an integrated readout circuit capable of measuring the power dissipated in a
resistive transducer, as well as its temperature. It is designed for use with the CMOS-compatible
tungsten-wire transducer reported in [19], but it has also been characterized in combination with
a more robust commercial resistive micro-heater (Figaro TGS-8100 [20]) to evaluate the
performance at power levels higher than what the CMOS-compatible transducers can handle. To
obviate the need to stabilize or accurately measure the transducer’s power dissipation, we adopt
an alternative approach in which a second transducer acts as a thermal-conductivity reference. Its
thermal properties are similar to those of the sensor, but it is shielded from the ambient air by
appropriate packaging. Our readout circuit ratiometrically digitizes the sensor’s thermal
conductivity relative to that of the reference, without relying on accurate voltage, power or
temperature references [21].
Measuring CO2 variation through the change of the transducer’s resistance is very challenging.
Measurements of our tungsten-wire transducers show that a 200 ppm CO2 variation causes a
mere 0.3 mΩ variation in a baseline resistance of 110 Ω. The measurement can be relaxed by
removing the baseline resistance, as only the change in resistance is of interest. Many approaches
have been reported to cancel baseline resistance [22-25]. They either rely on a ‘dummy’ passive
element but assume negligible mismatch errors introduced by manufacturing tolerances [22, 23],
or require a dedicated calibration phase involving extra analog-to-digital conversion steps before
measurements commence [24, 25].
This is the author's version of an article that has been published in this journal. Changes were made to this version by the publisher prior to publication.The final version of record is available at http://dx.doi.org/10.1109/JSSC.2016.2587861
Copyright (c) 2019 IEEE. Personal use is permitted. For any other purposes, permission must be obtained from the IEEE by emailing [email protected].
To cancel the baseline resistance, this work adopts a two-state measurement. The transducers in
our self-referenced system are operated alternately in ‘hot’ and ‘cold’ states by switching their
bias-current levels, allowing the change in resistance between the two states to be measured
directly. To not impose a challenging requirement on the dynamic range (DR) of the readout
circuit due to the switching between ‘hot’ and ‘cold’ states, this work presents a novel structure
employing pairs of dynamically-swapped transducers to cancel baseline resistance, thus enabling
the accurate measurement of their resistance changes without increasing the DR requirement for
the readout. In addition, dynamically-matched current sources are used to generate accurate
current ratios for the ‘hot’ and ‘cold’ states, and the paired transducers are themselves
periodically swapped to cancel errors due to transducer mismatch. Lastly, current-trimming
DACs are used to further suppress mismatch errors.
Experimental results from a prototype implemented in a standard 0.16 μm CMOS process
demonstrate the effectiveness of these techniques. In combination with the tungsten-wire
transducers, the readout circuit achieves 14-bit resolution in the measured thermal resistance
ratio, which corresponds to 228 ppm in CO2 resolution (1σ) in a 70 s measurement time, while
consuming 11.2 mW from a 1.8 V supply. An improved version of the design, in combination
with the commercial micro-heaters, achieves 202 ppm CO2 resolution in a measurement time of
30 s for the same power consumption.
The paper is organized as follows. In Section II, the operating principle of TC-based gas sensors
and the proposed ratiometric readout circuit is presented. Section III is devoted to the circuit
implementation of the readout circuit, including a switched-capacitor delta-sigma ADC,
This is the author's version of an article that has been published in this journal. Changes were made to this version by the publisher prior to publication.The final version of record is available at http://dx.doi.org/10.1109/JSSC.2016.2587861
Copyright (c) 2019 IEEE. Personal use is permitted. For any other purposes, permission must be obtained from the IEEE by emailing [email protected].
dynamically-matched current sources, and current-trimming DACs. Experimental results and
discussions are presented in Section IV, and the paper is concluded in Section V.
II. OPERATING PRINCIPLE
A. Thermal Resistance Measurement using a Resistive Transducer
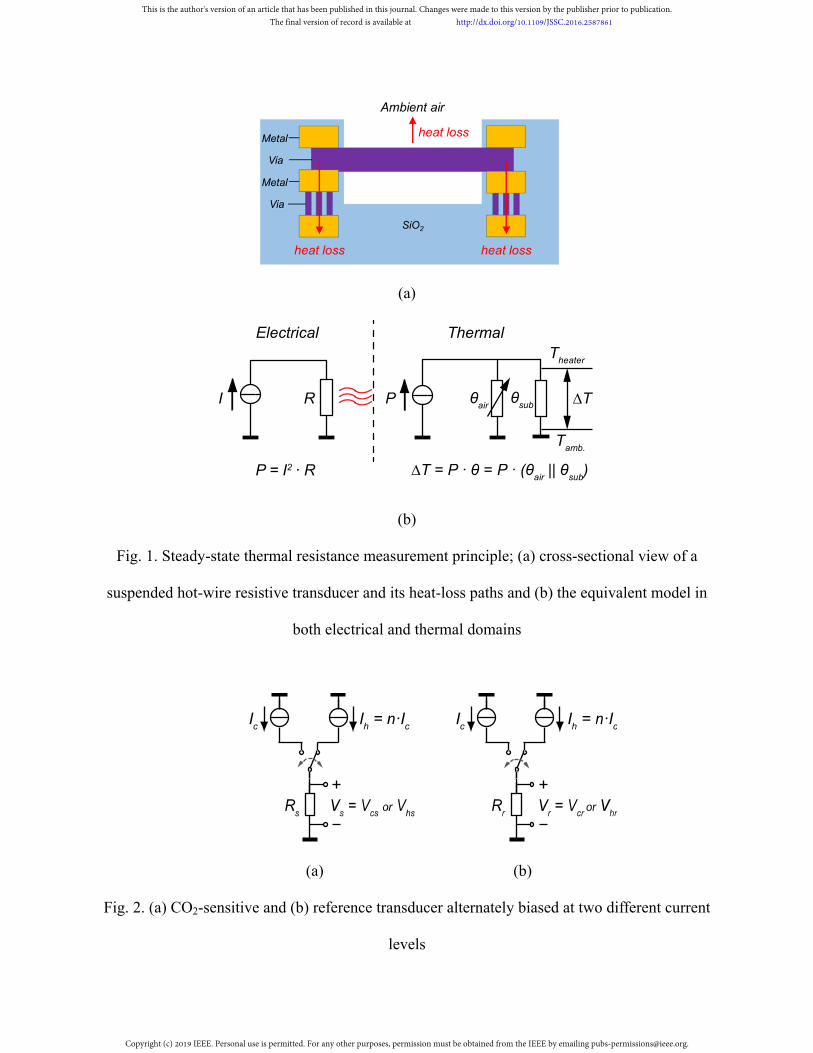
A hot-wire transducer loses heat through two main paths, both of which can be modelled as
thermal resistances, as shown in Fig. 1: one is to the surrounding air (θair), the other is to the
substrate via the anchor points (θsub). The transducer’s temperature rise relative to its ambient
(∆T) caused by the power dissipated in the transducer (P) is directly proportional to the parallel
combination θ of θair and θsub:
( )air subT P P (1)
Since the different components of air have different thermal conductivities, θair is a function of
gas composition, and hence T can be used to determine the CO2 concentration in air. Since CO2
is a better thermal insulator than air, higher CO2 concentrations will lead to (slightly) higher
values of T. To maximize sensitivity, heat loss to the substrate must be minimized. This is
typically done by using suspended transducers [11, 18].
While T in (1) can be measured using a dedicated temperature sensor (e.g., thermopiles [12]),
the use of the electrical resistance of the heater to measure its temperature greatly simplifies the
fabrication process, allowing the tungsten via material of a CMOS metal stack to be used as
heater, as shown in Fig. 1a [19]. Tungsten is preferred over aluminium as the material of the
resistive transducers for several reasons. First, in practice, aluminium is more difficult to process
due to stiction in the wet release etch step. Second, the strength of the aluminium wire is worse
This is the author's version of an article that has been published in this journal. Changes were made to this version by the publisher prior to publication.The final version of record is available at http://dx.doi.org/10.1109/JSSC.2016.2587861
Copyright (c) 2019 IEEE. Personal use is permitted. For any other purposes, permission must be obtained from the IEEE by emailing [email protected].
due to its grainy structure. Lastly, aluminium is more susceptible to electromigration.
The resistance of our tungsten transducers is in good approximation a linear function of
temperature:
0 01R R T T (2)
where R0 is the nominal electrical resistance of the transducer at room temperature T0, and its
temperature coefficient. For our tungsten transducers, R0 is 110 Ω and is 0.0017/K. The
nominal resistance R0 is set by the aspect ratio of the resistor, and was designed to allow
sufficient power to be dissipated in the resistor at the available voltage headroom.
To measure T, the transducer is alternately biased at a low current Ic and a high current Ih (Fig.
2a), corresponding to a ‘cold’ and a ‘hot’ state. The power dissipation in (1) then becomes the
difference in power dissipation between these two states (∆P) , and θ becomes:
2 2
0
h c h c
h c h h c c
T T R RT
P P P R I R I R
(3)
In order to accurately measure θ, both T and P need to be accurately measured. The nominal θ
of our tungsten transducer (at 400 ppm CO2 and 25°C) is about 53,500 K/W. A change of 200
ppm CO2 results in about 80 ppm change in the thermal resistance of air. For our transducers, the
thermal resistance to the substrate (θsub), which does not depend on the CO2 concentration, is
about two times larger than the thermal resistance to the surrounding air (θair). Since the
measured thermal resistance θ is the parallel combination of θsub and θair, the relative sensitivity
of θ to CO2 is reduced by a factor 2/3 compared to that of θair. Therefore, a CO2 change of 200
ppm corresponds to a relative change of θ of about 50 ppm. This implies that the power levels
This is the author's version of an article that has been published in this journal. Changes were made to this version by the publisher prior to publication.The final version of record is available at http://dx.doi.org/10.1109/JSSC.2016.2587861
Copyright (c) 2019 IEEE. Personal use is permitted. For any other purposes, permission must be obtained from the IEEE by emailing [email protected].
and temperature measurement should be stable to within ±25 ppm, making the measurement very
challenging.
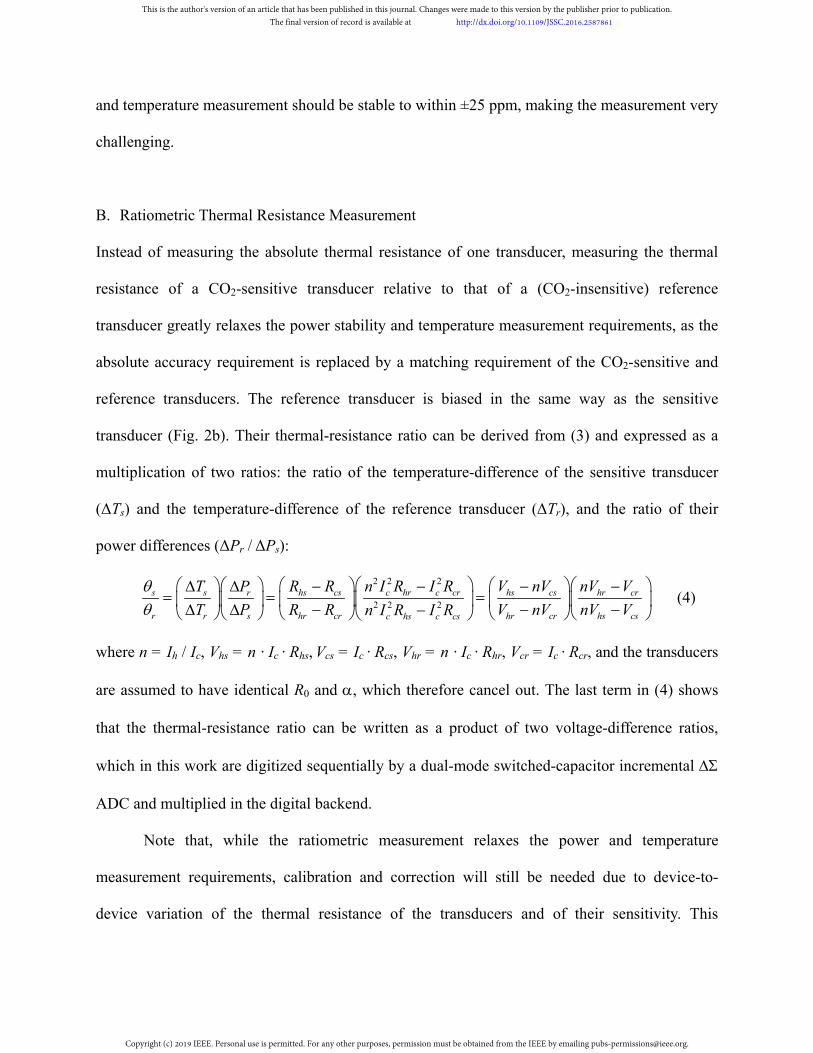
B. Ratiometric Thermal Resistance Measurement
Instead of measuring the absolute thermal resistance of one transducer, measuring the thermal
resistance of a CO2-sensitive transducer relative to that of a (CO2-insensitive) reference
transducer greatly relaxes the power stability and temperature measurement requirements, as the
absolute accuracy requirement is replaced by a matching requirement of the CO2-sensitive and
reference transducers. The reference transducer is biased in the same way as the sensitive
transducer (Fig. 2b). Their thermal-resistance ratio can be derived from (3) and expressed as a
multiplication of two ratios: the ratio of the temperature-difference of the sensitive transducer
(ΔTs) and the temperature-difference of the reference transducer (ΔTr), and the ratio of their
power differences (ΔPr / ΔPs):
2 2 2
2 2 2s s hs cs c hr c cr hs cs hr crr
r r s hr cr hr cr hs csc hs c cs
T R R n I R I R V nV nV VP
T P R R V nV nV Vn I R I R
(4)
where n = Ih / Ic, Vhs = n · Ic · Rhs, Vcs = Ic · Rcs, Vhr = n · Ic · Rhr, Vcr = Ic · Rcr, and the transducers
are assumed to have identical R0 and , which therefore cancel out. The last term in (4) shows
that the thermal-resistance ratio can be written as a product of two voltage-difference ratios,
which in this work are digitized sequentially by a dual-mode switched-capacitor incremental
ADC and multiplied in the digital backend.
Note that, while the ratiometric measurement relaxes the power and temperature
measurement requirements, calibration and correction will still be needed due to device-to-
device variation of the thermal resistance of the transducers and of their sensitivity. This
This is the author's version of an article that has been published in this journal. Changes were made to this version by the publisher prior to publication.The final version of record is available at http://dx.doi.org/10.1109/JSSC.2016.2587861
Copyright (c) 2019 IEEE. Personal use is permitted. For any other purposes, permission must be obtained from the IEEE by emailing [email protected].
calibration will involve exposing the sensor to one or more well-defined CO2 levels and
measuring the ratiometric output. Also note that compensation for cross-sensitivity will be
needed, since the transducers are also sensitive to e.g. temperature, humidity and pressure. This
will involve co-integration of sensors for these parameters and correcting the output based on
their readings. The implementation of this cross-sensitivity compensation is beyond the scope of
this paper.
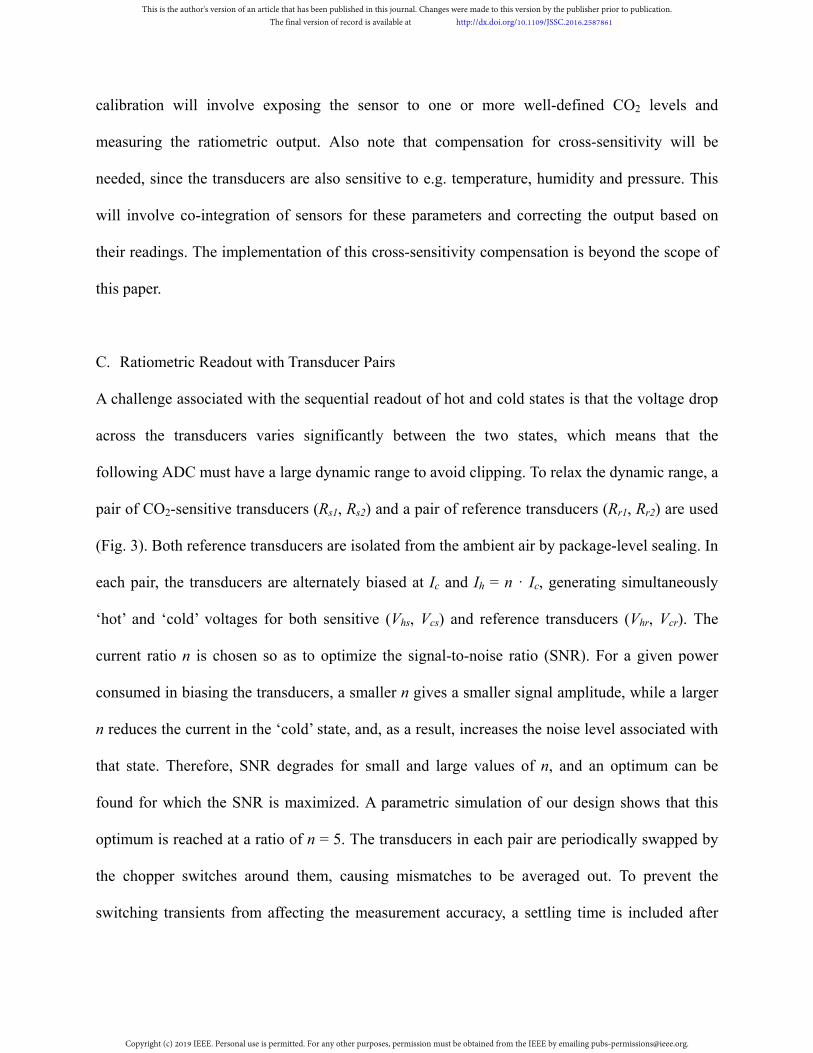
C. Ratiometric Readout with Transducer Pairs
A challenge associated with the sequential readout of hot and cold states is that the voltage drop
across the transducers varies significantly between the two states, which means that the
following ADC must have a large dynamic range to avoid clipping. To relax the dynamic range, a
pair of CO2-sensitive transducers (Rs1, Rs2) and a pair of reference transducers (Rr1, Rr2) are used
(Fig. 3). Both reference transducers are isolated from the ambient air by package-level sealing. In
each pair, the transducers are alternately biased at Ic and Ih = n · Ic, generating simultaneously
‘hot’ and ‘cold’ voltages for both sensitive (Vhs, Vcs) and reference transducers (Vhr, Vcr). The
current ratio n is chosen so as to optimize the signal-to-noise ratio (SNR). For a given power
consumed in biasing the transducers, a smaller n gives a smaller signal amplitude, while a larger
n reduces the current in the ‘cold’ state, and, as a result, increases the noise level associated with
that state. Therefore, SNR degrades for small and large values of n, and an optimum can be
found for which the SNR is maximized. A parametric simulation of our design shows that this
optimum is reached at a ratio of n = 5. The transducers in each pair are periodically swapped by
the chopper switches around them, causing mismatches to be averaged out. To prevent the
switching transients from affecting the measurement accuracy, a settling time is included after
This is the author's version of an article that has been published in this journal. Changes were made to this version by the publisher prior to publication.The final version of record is available at http://dx.doi.org/10.1109/JSSC.2016.2587861
Copyright (c) 2019 IEEE. Personal use is permitted. For any other purposes, permission must be obtained from the IEEE by emailing [email protected].
swapping during which the ADC does not sample the voltages across the transducers. Since the
thermal time constant of the transducers is relatively long (measured to be about 40 µs for our
tungsten-wire transducers), the swapping is done at a relatively low rate (approximately once
every 24 ms) to prevent the accumulated thermal settling time from significantly adding to the
total measurement time. The ‘hot’ and ‘cold’ voltages are simultaneously sampled by scaled
switched-capacitor circuits and merged together, as will be detailed in Section III.
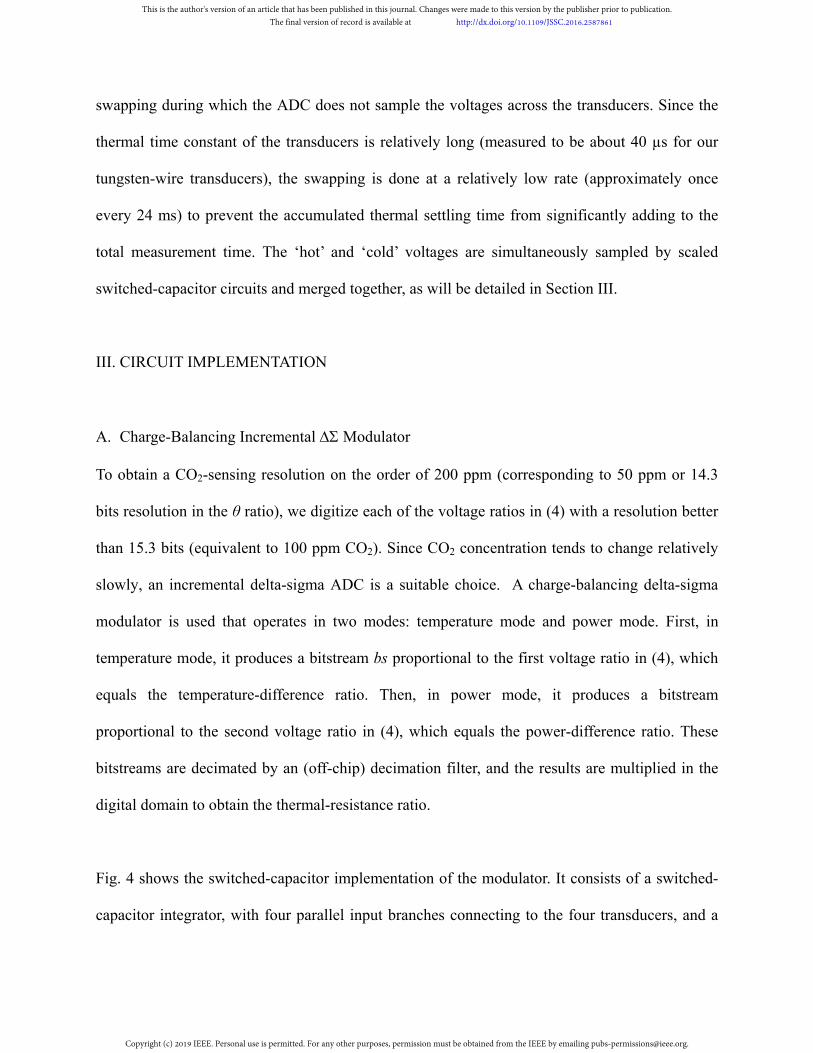
III. CIRCUIT IMPLEMENTATION
A. Charge-Balancing Incremental Modulator
To obtain a CO2-sensing resolution on the order of 200 ppm (corresponding to 50 ppm or 14.3
bits resolution in the θ ratio), we digitize each of the voltage ratios in (4) with a resolution better
than 15.3 bits (equivalent to 100 ppm CO2). Since CO2 concentration tends to change relatively
slowly, an incremental delta-sigma ADC is a suitable choice. A charge-balancing delta-sigma
modulator is used that operates in two modes: temperature mode and power mode. First, in
temperature mode, it produces a bitstream bs proportional to the first voltage ratio in (4), which
equals the temperature-difference ratio. Then, in power mode, it produces a bitstream
proportional to the second voltage ratio in (4), which equals the power-difference ratio. These
bitstreams are decimated by an (off-chip) decimation filter, and the results are multiplied in the
digital domain to obtain the thermal-resistance ratio.
Fig. 4 shows the switched-capacitor implementation of the modulator. It consists of a switched-
capacitor integrator, with four parallel input branches connecting to the four transducers, and a
This is the author's version of an article that has been published in this journal. Changes were made to this version by the publisher prior to publication.The final version of record is available at http://dx.doi.org/10.1109/JSSC.2016.2587861
Copyright (c) 2019 IEEE. Personal use is permitted. For any other purposes, permission must be obtained from the IEEE by emailing [email protected].
clocked comparator. To ensure accurate settling and to prevent integrator leakage from limiting
the resolution, the integrator employs a gain-boosted folded-cascode OTA with a unity-gain
bandwidth of about 2.5 MHz and a nominal DC gain of 140 dB [26]. The comparator is a
latched comparator using a pre-amplifier to reduce kick-back effect of the positive-feedback
latch [27]. Minimum-size switches (W/L = 0.8 µm/0.16 µm) are used to minimize charge
injection.
To quantify the impact of various error sources from the circuit (e.g., the error in current ratio
and the mismatch in capacitors) on the ADC’s output, we designed a behavioral model for the
transducer and the ADC based on a Verilog-A script and analyzed the sensitivities of the
measured θ ratio to all the error sources. This analysis shows that accurate matching is required
for the capacitors, and especially for the current sources in order to obtain accurate CO2
measurements.
B. Switched-Capacitor Circuit in Temperature Mode
In temperature mode, the first voltage ratio in (4), which equals the temperature-difference ratio,
is digitized. As shown in Fig. 4, the ‘hot’ voltages (Vhs, Vhr) are sampled by unit capacitors Cs
while the ‘cold’ voltages (Vcs, Vcr) are sampled by scaled capacitors 5Cs, to generate the ‘n’ factor
in (4). The inaccuracy of this capacitor ratio gives an error in the measurement of the thermal-
resistance ratio. Simulations show that 0.1% mismatch leads to a measurement error equivalent
to 200 ppm CO2. An accurate common-centroid layout is used to achieve this level of matching.
Each transducer uses Kelvin connections to eliminate errors due to contact resistance. During
phase φ1, the ‘hot’ and ‘cold’ voltages are connected to one plate of the sampling capacitors,
This is the author's version of an article that has been published in this journal. Changes were made to this version by the publisher prior to publication.The final version of record is available at http://dx.doi.org/10.1109/JSSC.2016.2587861
Copyright (c) 2019 IEEE. Personal use is permitted. For any other purposes, permission must be obtained from the IEEE by emailing [email protected].
while their other plate is connected to the common-mode voltage Vcm. During the subsequent
phase φ2, the connections to the transducers are reversed, while the capacitors are connected to
the virtual ground of the integrator. This double-sampling scheme causes a charge proportional to
two times the voltage drop across the transducer to be transferred to the integrator. The switches
associated with the pair of sensitive transducers are gated by the bitstream, causing a charge
proportional to (Vhs − nVcs) to be integrated when bs = 1. Similarly, the switches associated with
the reference transducers are gated by the inverse of the bitstream, causing a charge proportional
to –(Vhr − nVcr) to be integrated when bs = 0. Since the negative feedback in the modulator
ensures that the average integrated charge tends to zero, the following charge-balancing equation
applies:
1(1 ) 0 1 hs cs hs cs s
hs cs hr crhr cr hr cr r
V nV R R TV nV V nV
V nV R R T
(5)
where is the fraction of ones in the bitstream, as determined by the decimation filter, which is a
simple counter in this first-order modulator. This shows that the temperature-difference ratio can
be readily derived from the decimated value.
The signal corresponding to CO2 variations is extremely small. When the heating currents are 2.5
mA and 0.5 mA for the hot and cold states, respectively, the resulting resistance difference
between the hot and cold states is about 5.8 Ω, while a 100 ppm increase in CO2 concentration
will only add 0.15 mΩ. This corresponds to the resistance resolution mentioned earlier of about
15.3 bits relative to the resistance difference (equivalent to about 19.5 bits relative to the total
nominal resistance of 110 Ω).
To achieve this resolution, the noise in the system needs to be sufficiently small, including the
This is the author's version of an article that has been published in this journal. Changes were made to this version by the publisher prior to publication.The final version of record is available at http://dx.doi.org/10.1109/JSSC.2016.2587861
Copyright (c) 2019 IEEE. Personal use is permitted. For any other purposes, permission must be obtained from the IEEE by emailing [email protected].
quantization noise of the ADC and the thermal noise contributed by the transducers, the bias
currents, and the switched-capacitor circuit. These thermal noise sources manifest themselves as
kT/C noise in the charge-balancing process, and can be reduced by increasing the unit-capacitor
size Cs or by increasing the over-sampling ratio (OSR) of the modulator [28]. At Cs = 1 pF,
chosen to limit the total die area, an over-sampling ratio (OSR) of at least 218 is required . At this
OSR, the modulator is limited by kT/C noise, since the quantization noise is well below the
required level. The modulator is operated at a clock frequency of 83.3 kHz (one delta-sigma
clock period is 12 µs), leading to a modulator-operating time of about 3.2 s. Including additional
time for thermal settling of about 1.3 s, a total time of 4.5 s is needed to determine the
temperature-difference ratio. This time can be reduced by increasing the capacitor sizes, or by
increasing the clock frequency, both of which will translate into an increase in the power
consumption of the modulator, but will help to reduce the energy consumed per measurement,
because the overall power consumption is dominated by the transducers.
C. Switched-Capacitor Circuit in Power Mode
In power mode, the voltage ratio proportional to the power-difference ratio in (4) is digitized.
This is implemented by reconfiguring the switched-capacitor circuit with a reversed bs polarity
(which is implemented, as shown in Fig. 4, by inverting bs after the quantizer). Moreover, the
input voltages are connected through the cross-connections, so that the ‘hot’ voltages (Vhs, Vhr)
are now sampled by the scaled capacitors 5Cs, while the ‘cold’ voltages (Vcs, Vcr) are sampled by
the unit capacitors Cs, thus realizing the ‘n’ factor in the second voltage ratio of (4). Thus a
charge proportional to (nVhs − Vcs) from the sensitive transducers is continuously balanced by a
charge proportional to –(nVhr − Vcr) from the reference transducers, leading to a decimated output
This is the author's version of an article that has been published in this journal. Changes were made to this version by the publisher prior to publication.The final version of record is available at http://dx.doi.org/10.1109/JSSC.2016.2587861
Copyright (c) 2019 IEEE. Personal use is permitted. For any other purposes, permission must be obtained from the IEEE by emailing [email protected].
that is a function of the second voltage ratio in (4), similar to the relation given in (5) for
temperature mode. An important difference with temperature mode is that the signal charge that
is processed is substantially larger, as is evident from (4). As a result, the OSR needed to reduce
the thermal noise to the desired 15.3 bit level is much lower than the OSR needed in temperature
mode. At this lower OSR, the first-order ADC becomes quantization-noise limited. Since the
conversion during power mode takes only a fraction of the overall conversion time, a slightly
higher OSR of 216 is used than what is strictly required, to obtain a quantization-noise that meets
the target with margin [29]. At a clock frequency of 83.3 kHz, this leads to a modulator-operating
time of 0.8 s. Including additional time for thermal settling of about 0.7 s, a total time of 1.5 s is
needed to determine the power-difference ratio. For a complete ratiometric thermal-resistance
measurement, the modulator first spends 4.5 s in temperature mode and then 1.5 s in power
mode, giving a total measurement time of 6 s.
D. Dynamically-Matched Current Sources
Errors in the 1 : n bias current ratio lead to errors in the measured ratio. System-level
simulations have shown that to reduce the resulting error in the measured CO2 concentration to
less than 200 ppm after a one-point offset trim, the current ratio should be accurate to 0.06%. To
achieve this, dynamic element matching (DEM) is used (Fig. 5). Each transducer is associated
with a set of 5 unit-current sources, each of which can be connected to the transducer via a
switch. These switches are digitally controlled according to the DEM timing diagram shown in
Fig. 5. When one sensitive transducer is biased by all five unit current sources (in the hot state),
the other sensitive transducer is sequentially biased by one unit current source (in the cold state),
generating an accurate average current ratio of five. The same biasing approach is applied to the
This is the author's version of an article that has been published in this journal. Changes were made to this version by the publisher prior to publication.The final version of record is available at http://dx.doi.org/10.1109/JSSC.2016.2587861
Copyright (c) 2019 IEEE. Personal use is permitted. For any other purposes, permission must be obtained from the IEEE by emailing [email protected].
reference transducers. It should be noted that the current-domain chopping (indicated in Fig. 3) is
also implemented by this switching scheme (switching between Ic and 5Ic). The reason for not
physically swapping the two current outputs is that we include a current-trimming function to
compensate for the mismatch of the transducers, as described in the next section.
E. Current-Trimming DACs
In principle, the errors due to transducer mismatch are modulated to an AC signal by the periodic
chopping of the transducers. However, it may still be necessary to trim the initial mismatch so
that the ripple caused by the mismatch at the output of the first integrator will not overload the
modulator. As shown in Fig. 6, the two currents IOUT1 and IOUT2, biasing the sensitive
transducers Rs1 and Rs2 are generated using PMOS current mirrors (an identical circuit, not
shown, is used for the reference transducers). A 6-bit binary-weighted current DAC (LSB current
= 0.5% × Ic), embedded in the current source circuit, is used to trim the input current of these
current mirrors, thus effectively compensating for the resistance mismatch between Rs1 and Rs2.
Note that the current ratio between IOUT1 and IOUT2 does not need to be accurate, as long as both
IOUT1 and IOUT2 provide an accurate 1 : n current ratio sequentially to the individual transducers,
which is ensured by the current-source DEM (Fig. 5). In this way, the measured thermal-
resistance ratio is a ratio between the averaged thermal resistances of the two sensitive
transducers and that of the two reference transducers.
IV. EXPERIMENTAL RESULTS AND DISCUSSION
The readout circuit as well as the tungsten-wire transducers have been designed and fabricated in
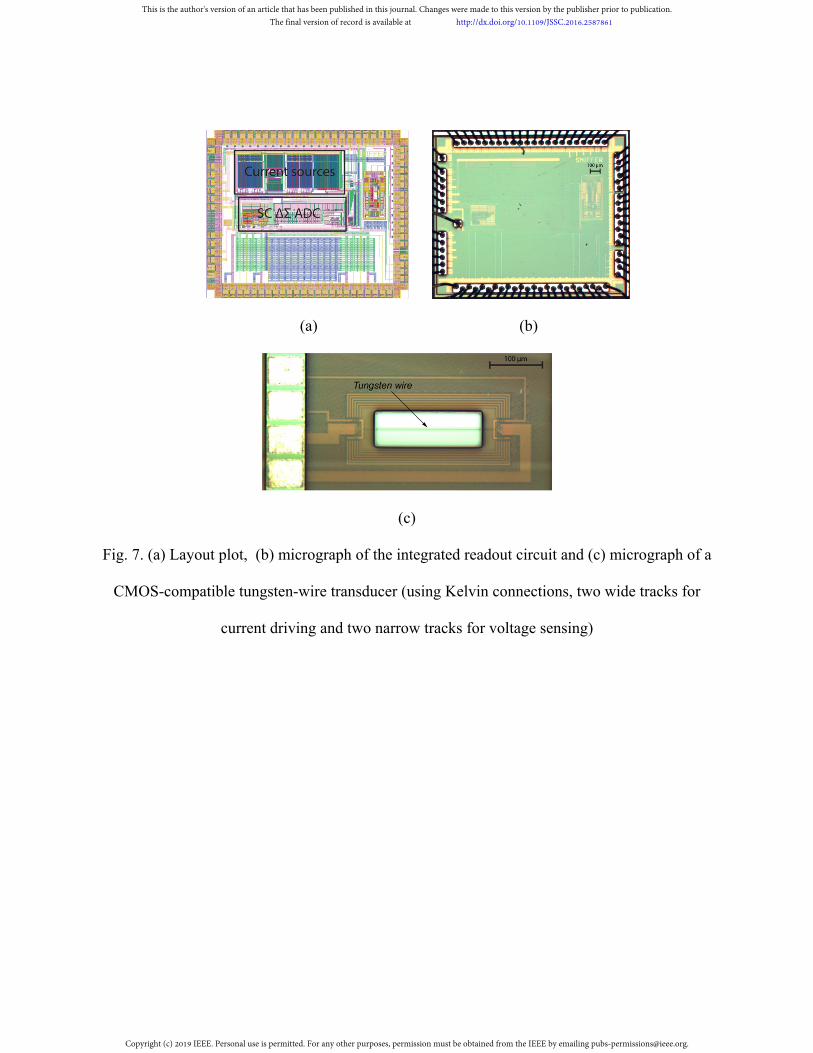
a 0.16 µm CMOS technology. Fig. 7 shows the layout plot and micrographs of the integrated
This is the author's version of an article that has been published in this journal. Changes were made to this version by the publisher prior to publication.The final version of record is available at http://dx.doi.org/10.1109/JSSC.2016.2587861
Copyright (c) 2019 IEEE. Personal use is permitted. For any other purposes, permission must be obtained from the IEEE by emailing [email protected].
readout circuit and one of the transducers. The active die area of the circuit amounts to 0.7 mm2,
of which 0.37 mm2 is occupied by the current sources and 0.33 mm2 by the switched-capacitor
modulator. The transducers are on another chip, fabricated using the same CMOS process
followed by an etch step to release the wires, so as to be able to test different implementations of
the transducers. To investigate the behavior at higher heating power levels, a commercial micro-
heater was also used (Figaro TGS-8100, a metal-oxide-semiconductor gas sensor of which we
use the integrated micro-heater) [20], which can withstand higher power and has similar
electrical and thermal characteristics as the CMOS tungsten transducers. Four micro-heaters
from four Figaro devices were connected to our readout circuits, two of which were sealed at the
package to act as reference devices. For electrical measurements, the readout IC has been
characterized in combination with this commercial micro-heater. Both the commercial heaters
and the CMOS tungsten transducers have been used for CO2 measurements.
A. Electrical measurements
Fig. 8 shows the measured current ratios of the dynamically-matched current sources for 4
samples of the readout IC. The initial mismatch of about ±0.2% is improved by an order of
magnitude with DEM (better than the required 0.06% error budget). This proves that DEM
effectively averages out the variations due to mismatch and thus improves the accuracy of
thermal-resistance measurement.
Fig. 9 shows how the resolution of the thermal-resistance measurement (and hence the equivalent
CO2 resolution) varies as a function of the measurement time. Results of two versions of the
circuit are shown. The first version employs a switched-capacitor circuit that samples the
This is the author's version of an article that has been published in this journal. Changes were made to this version by the publisher prior to publication.The final version of record is available at http://dx.doi.org/10.1109/JSSC.2016.2587861
Copyright (c) 2019 IEEE. Personal use is permitted. For any other purposes, permission must be obtained from the IEEE by emailing [email protected].
transducer voltage on only one of the two clock phases [19]. The second version corresponds to
the implementation discussed in Section III, employing the double-sampling scheme shown in
Fig. 4. This scheme doubles the signal amplitude compared to the single-sampling scheme, while
the noise level remains the same. Therefore, for the same measurement time, the SNR increases
by 6 dB. The 2 improvement in CO2 resolution observed in the experiment matches well with
this expectation. At the targeted measurement time of 6 s, the second version of the readout
circuit achieves an equivalent CO2 resolution of 250 ppm (1σ) at ambient conditions in the lab.
This is in reasonable agreement with the expectation based on a calculation of the input-referred
signal-to-noise ratio as a function of OSR (dashed curve in Fig. 9). To achieve the targeted
resolution of 200 ppm, a measurement time of 9 s is needed. For comparison, Fig. 9 also shows
the measured CO2 resolution at different controlled CO2 levels (dashed curves and dash-dot
curves), obtained from measurements performed in a climate chamber. These results will be
discussed further in Section IV-B.
To demonstrate the insensitivity of the ratiometric measurement to the absolute current and
power levels, Fig. 10 shows the measured temperature, power and thermal-resistance ratios as a
function of Ic (the bias current at the ‘cold’ state). For a ±10% change in Ic, the power ratio only
changes by about ±10 ppm. For our CO2 sensor, 200 ppm change in CO2 will result in about
50 ppm change in thermal-resistance ratio, which requires the errors of power ratio to be within
25 ppm. Thus the measured results indicate that the ratiometric measurement effectively
alleviates the dependence on the stability of the power dissipation. The measured thermal-
resistance ratio also varies by about ±10 ppm, which could be due to the secondary temperature
dependence of the thermal conductivity of air.
This is the author's version of an article that has been published in this journal. Changes were made to this version by the publisher prior to publication.The final version of record is available at http://dx.doi.org/10.1109/JSSC.2016.2587861
Copyright (c) 2019 IEEE. Personal use is permitted. For any other purposes, permission must be obtained from the IEEE by emailing [email protected].
To demonstrate the effectiveness of the trimming scheme, Fig. 11 shows the measured
temperature, power and thermal-resistance ratios, as well as the peak-to-peak voltage at the
output of the integrator, for different current-trimming levels of the current sources that bias the
sensitive transducers. The current trimming levels are indicated in LSB steps of the current DAC,
where a negative number indicates the trimming current is added to one of the sensitive
transducers (Rs1) and a positive number indicates the trimming current is added to the other
sensitive transducer (Rs2). When the trimming level is less than 4 LSBs, the integrator’s output
swing is limited. For trimming levels above 8 LSBs, the integrator starts to clip, leading to large
errors in the measured ratios. Note that in this particular case, the transducers are quite well
matched, leading to an optimum for trimming level 0. In the case where transducers have larger
mismatch, this current trimming function will suppress the initial mismatch between the
transducers and thus prevent the modulator from clipping. Note that there is still some variation
in the measured ratios when the trimming level is less than 4 LSBs. This is to be expected, since
the trimming scheme always adds current to either of the two transducers and hence increases the
power dissipation of the sensitive transducers. This will lead to a gain error in (4). In practice,
such a gain error will be compensated for by the overall calibration of the sensor, along with the
gain errors due to the tolerances on the nominal thermal resistances of the transducers.
To quantify the chip-to-chip variation introduced by the readout circuit, 18 samples of the chip
have been measured in combination with the same set of off-chip fixed resistors. To exclude the
effect of ambient variations, non-suspended resistors with a low temperature coefficient were
used. To allow the circuit to operate with these resistors, the dynamic switching of the current
This is the author's version of an article that has been published in this journal. Changes were made to this version by the publisher prior to publication.The final version of record is available at http://dx.doi.org/10.1109/JSSC.2016.2587861
Copyright (c) 2019 IEEE. Personal use is permitted. For any other purposes, permission must be obtained from the IEEE by emailing [email protected].
level was disabled, i.e. two resistors emulated a ‘hot’ resistance of about 120 and two a ‘cold’
resistance of about 100 . Since this mode of operation precludes the use of dynamic element
matching, the measured spread includes the effect of current-source mismatch. In spite of this,
the measured standard deviation of the decimated output is less than 0.6%. This is much less than
the expected processing spread of the tungsten transducers, indicating that the spread due to the
readout circuit is non-dominant and can be corrected for in the calibration procedure that will be
needed for the transducers.
B. CO2 measurements
The first version of the readout circuit has been measured in combination with tungsten-wire
transducers implemented in the back-end of a standard 0.16 µm CMOS process [19]. The
sensitive and reference wires have a length of 250 µm. The cavity opening of the sensitive
transducer is 200 µm, while that of the reference transducers is 50 µm. Both the approach of
using a narrower etch window and the approach of package-level sealing to achieve a lower
sensitivity of the thermal resistance to CO2 in the reference device have been explored. Two
transducer chips, each with a pair of transducers, were used. One chip, with the sensitive
transducers, was packaged in a ceramic DIL package of which the cavity is exposed to the
ambient air, and the other, with the reference transducers, was packaged in a DIL package of
which the cavity is sealed. Note that there are potential solutions for sealing the reference
transducers at the wafer-level, such as wafer-to-wafer capping, die-to-wafer bonding and wafer-
level thin-film capping [30]. In this way, both types of transducers can in the future be integrated
in the same package.
This is the author's version of an article that has been published in this journal. Changes were made to this version by the publisher prior to publication.The final version of record is available at http://dx.doi.org/10.1109/JSSC.2016.2587861
Copyright (c) 2019 IEEE. Personal use is permitted. For any other purposes, permission must be obtained from the IEEE by emailing [email protected].
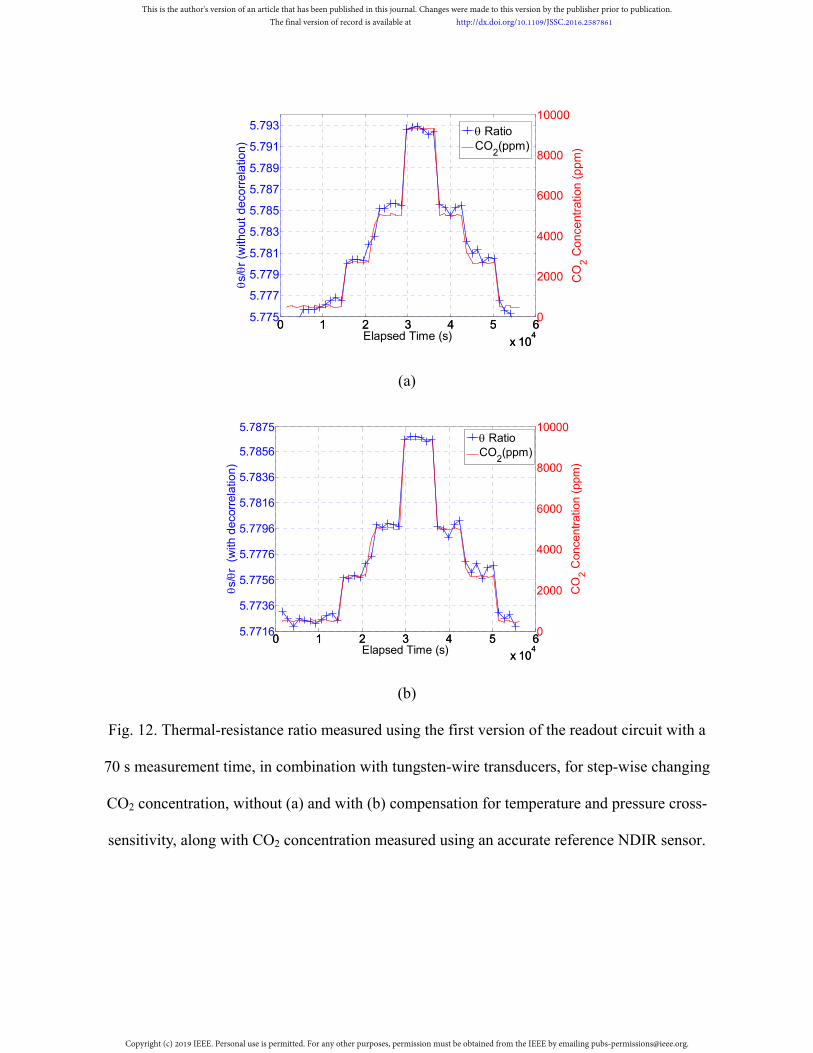
Fig. 12 shows the thermal-resistance ratio measured using the first version of the readout circuit
while the CO2 concentration was changed step-wise from 500 ppm to 9000 ppm. To reduce the
noise level, which, as mentioned, is relatively high for the first version of the circuit, the
measurement time was increased to 70 s for this experiment, at which the measured resolution is
equivalent to 228 ppm CO2 (1σ). The thermal-resistance ratio measured using the readout circuit
has a sensitivity of 0.29 ppm/ppm CO2, and shows good correlation with the CO2 level measured
using an NDIR-based reference sensor (Fig. 12a). Note that at the highest CO2 level, this
reference sensor was operated just beyond its full scale, causing its output to clip, but the
parameters of the mass flow controllers that set the CO2 concentration were correct.
As thermal-conductivity is not only sensitive to the change of CO2, but is also highly influenced
by environmental variations, we use reference temperature, humidity and pressure sensors to
accurately measure the changes in ambient conditions, and determine the cross-sensitivities and
then de-correlate the influences of these ambient variations by least-square curve fitting on the
measurement results. The results after de-correlation are shown in Fig. 12b. These measurements
were performed using a 2.5 mA bias current (hot state), at which the temperature rise of the
tungsten transducer (ΔT) is about 35°C above ambient temperature. When the bias current was
increased to 5 mA (ΔT >100°C), a drifting behavior was observed.
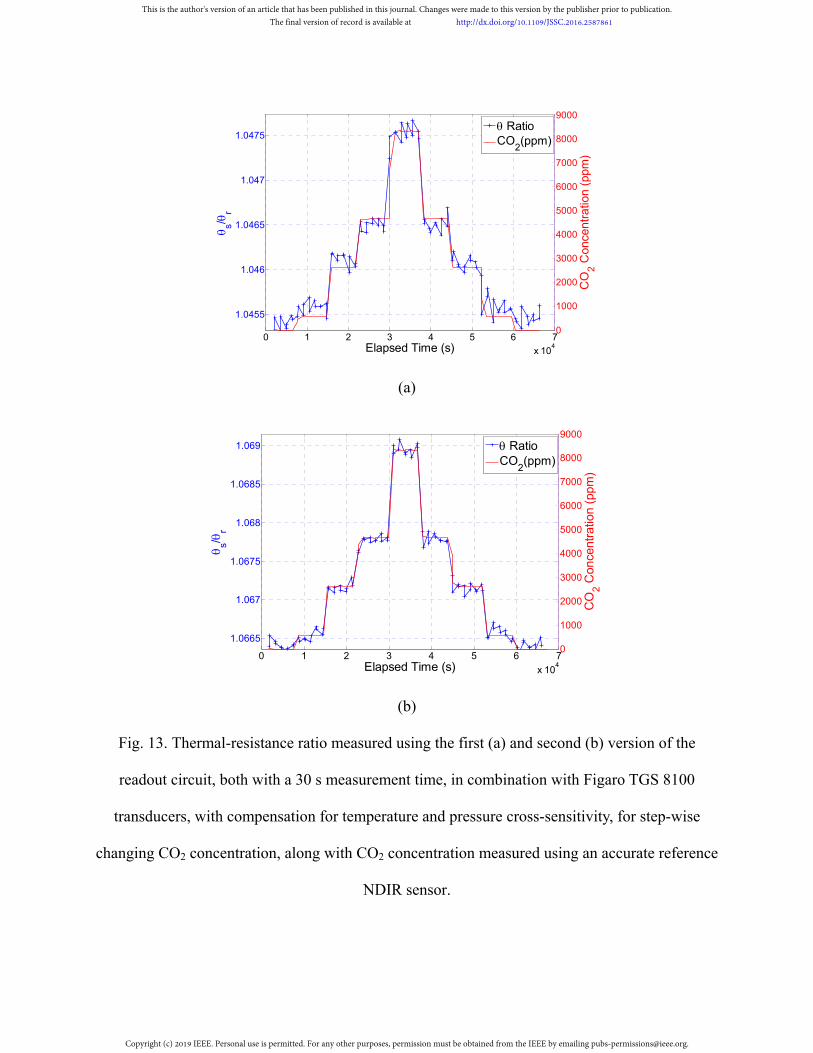
The readout circuit has also been tested with discrete heaters: the micro-heaters in Figaro TGS-
8100. The results are shown in Fig. 13, for both versions of the readout circuit. Four different
CO2 levels (500 ppm, 2500 ppm, 4500 ppm, 9000 ppm) and a baseline (pure air) were used in
This is the author's version of an article that has been published in this journal. Changes were made to this version by the publisher prior to publication.The final version of record is available at http://dx.doi.org/10.1109/JSSC.2016.2587861
Copyright (c) 2019 IEEE. Personal use is permitted. For any other purposes, permission must be obtained from the IEEE by emailing [email protected].
this experiment. The thermal-resistance ratio measured has a sensitivity of 0.27 ppm/ppm CO2,
and shows good correlation with the reference CO2 measurements.
In these experiments, a measurement time of 30 s was used, at which the second version of the
readout circuit meets the targeted resolution of 200 ppm (Fig. 13b). As shown in Fig. 9, the CO2
resolution measured at controlled CO2 levels is about 370 ppm in a measurement time of 6 s,
which is worse than the previous measurement at (uncontrolled) ambient conditions (250 ppm).
This difference could be due to noise associated with airflow in the setup. As a result, a
measurement time of 30 s is needed to meet the targeted resolution of 200 ppm. As expected, the
resolution obtained with the first version of the circuit is approximately two times worse.
While the micro-heaters used can support higher power levels (the temperature rise at 2.5 mA
bias current is about 20°C), only a very modest improvement in resolution was found when the
power was increased. This is probably due to the fact that, while a higher power level gives a
higher signal amplitude, it also reduces the sensitivity of the thermal conductivity of air to CO2
concentration, due to the temperature dependency of this sensitivity.
A performance summary and comparison with other CO2 sensors reported in literature as well as
with a commercial product is shown in Table I. Compared with other TC-based CO2 sensors, the
CO2 transducer (tungsten wire) and readout circuit in this work are both implemented in standard
CMOS technology with minimum post-processing steps, unlike the special MEMS processes
required to fabricate the other transducers. The active die area of the sensor including readout
circuit is about 3 mm2 which is much smaller than that of the sensor in [12] or [13]. The first
This is the author's version of an article that has been published in this journal. Changes were made to this version by the publisher prior to publication.The final version of record is available at http://dx.doi.org/10.1109/JSSC.2016.2587861
Copyright (c) 2019 IEEE. Personal use is permitted. For any other purposes, permission must be obtained from the IEEE by emailing [email protected].
version of the chip in combination with the CMOS tungsten-wire transducers achieves 228 ppm
CO2 resolution in 70 s in the indoor CO2 range (at 500 ppm level), which is 2 better than the
resolution reported in [13]. In combination with the commercial heaters (Figaro TGS-8100), the
same readout achieves 400 ppm resolution in 30 s. The second version of the chip (with double
sampling) in combination with commercial heaters (Figaro TGS-8100) achieves 202 ppm
resolution in 30 s. As most of the power is used for heating the transducer, reducing the power
consumption of readout circuit would only lead to a minor improvement. To optimize the design
for energy efficiency, further improvement can be made in decreasing the measurement time,
which can be done by increasing the size of the switches and operating the modulator at a clock
frequency. Alternatively, the capacitor size can be further increased to reduce the circuit noise, at
the cost of increased die size. Note that in the latter case, the size of switches should also be
increased in order to meet the settling requirement of the switched-capacitor circuit.
V. CONCLUSIONS
In this work, we have reported a novel readout circuit for ratiometric thermal-conductivity
measurement. The circuit digitizes both the temperature rise and the power dissipation of CO2-
sensitive transducers relative to that of reference transducers, from which their thermal-resistance
ratio can be calculated, thus circumventing an accurate power reference. Experimental results
have shown that for a ±10% change in bias current, the measured power ratio between sensitive
and reference transducers only changes by about ±10 ppm. A pair of gas-sensitive transducers is
combined with a pair of reference transducers to cancel baseline resistance, thus greatly relaxing
the dynamic range requirement of the ADC. The transducers are dynamically swapped during a
conversion to dynamically cancel out the errors due to transducer mismatch. An accurate current
This is the author's version of an article that has been published in this journal. Changes were made to this version by the publisher prior to publication.The final version of record is available at http://dx.doi.org/10.1109/JSSC.2016.2587861
Copyright (c) 2019 IEEE. Personal use is permitted. For any other purposes, permission must be obtained from the IEEE by emailing [email protected].
ratio between ‘hot’ and ‘cold’ states is generated by dynamically-matched current sources, and
furthermore, a 6-bit current DAC is used to trim the transducers to ensure that the residual
mismatch will not overload the modulator. Experimental results show that the applied
techniques are effective, and using this ratiometric readout circuit, a CMOS-compatible thermal-
conductivity-based CO2 sensor achieves 228 ppm (1σ) CO2 resolution. To further evaluate the
capability of the readout circuit, we use micro-heaters in Figaro TGS 8100 as a substitute for
tungsten-wire transducers. The second version of the design achieves 200 ppm resolution over a
CO2 range of 500 to 9000 ppm, which indicates that high-resolution TC-based CO2 sensing is
attainable even with on-chip electronics, thus facilitating the realization of fully-integrated CO2
sensors for air-quality monitoring, which are much smaller and less expensive than current CO2
sensors.
ACKNOWLEDGMENT
This work is supported by NXP Semiconductors and austriamicrosystems AG (AMS). The
authors want to thank Zu-yao Chang and Lukasz Pakula for their technical support.
REFERENCES
[1] “Gas Sensors Market - Global Industry Size, Share, Trends, Analysis and Forecast 2012 –
2018”, Transparency Market Research [Online]. Available:
http://www.transparencymarketresearch.com/gas-sensors-market.html.
[2] U. Satish, et al., "Is CO2 an indoor pollutant? direct effects of low to moderate CO2
concentrations on human decision-making performance," Environmental health perspectives,
2014.
This is the author's version of an article that has been published in this journal. Changes were made to this version by the publisher prior to publication.The final version of record is available at http://dx.doi.org/10.1109/JSSC.2016.2587861
Copyright (c) 2019 IEEE. Personal use is permitted. For any other purposes, permission must be obtained from the IEEE by emailing [email protected].
[3] S.J. Emmerich, A.K. Persily, “Literature review on CO2-based demand-controlled
ventilation,” ASHRAE Transaction, vol. 103, pp. 229–243, 1997.
[4] K. Kaneyasu, et al., "A carbon dioxide gas sensor based on solid electrolyte for air quality
control," Sens. Actuators B: Chem., vol. 66, pp. 56-58, Jul. 2000.
[5] S. Yi, et al., "Novel NDIR CO2 sensor for indoor air quality monitoring," in Proc. IEEE
Int. Conf. on Solid-State Sensors, Actuators and Microsystems (Transducers '05), 2005, pp.
1211-1214.
[6] K. Souri, Y. Chae and K.A.A. Makinwa, “A CMOS Temperature Sensor With a Voltage-
Calibrated Inaccuracy of ±0.15°C (3σ) From -55 °C to 125 °C”, IEEE J. Solid-State Circuits,
vol. 48, no. 1, pp. 292-301, Jan. 2013.
[7] M. A. P. Pertijs, K. A. A. Makinwa, and J. H. Huijsing, "A CMOS smart temperature
sensor with a 3σ inaccuracy of ±0.1 °C from -55 °C to 125 °C," IEEE J. Solid-State Circuits, vol.
40, no. 12, pp. 2805-2815, Dec. 2005.
[8] Z. Tan, et al., "A 1.2-V 8.3-nJ CMOS humidity sensor for RFID applications," IEEE J.
Solid-State Circuits, vol. 48, no. 10, pp. 2469-2477, Oct. 2013.
[9] SenseAir K30 datasheet, SenseAir [Online]. Available: http://www.senseair.com/.
[10] G. U. Gamm, et al., "Low power wireless sensor node for use in building automation," in
Proc. 12th IEEE Wireless and Microwave Technology Conference (WAMICON), 2011, pp. 1-6.
[11] I. Simon and M. Arndt, "Thermal and gas-sensing properties of a micromachined thermal
conductivity sensor for the detection of hydrogen in automotive applications," Sens. Actuators A:
Phys., vol. 97–98, pp. 104-108, Apr. 2002.
[12] K. Kliche, et al., "Sensor for gas analysis based on thermal conductivity, specific heat
capacity and thermal diffusivity," in Proc. IEEE Int. Conf. on MEMS, 2011, pp. 1189-1192.
This is the author's version of an article that has been published in this journal. Changes were made to this version by the publisher prior to publication.The final version of record is available at http://dx.doi.org/10.1109/JSSC.2016.2587861
Copyright (c) 2019 IEEE. Personal use is permitted. For any other purposes, permission must be obtained from the IEEE by emailing [email protected].
[13] K. Kliche, et al., "Sensor for thermal gas analysis based on micromachined silicon-
microwires," IEEE Sensors J., vol. 13, pp. 2626-2635, Jul. 2013.
[14] N. Tadic, M. Zogovic, and D. Gobovic, "A CMOS controllable constant-power source for
variable resistive loads using resistive mirror with large load resistance dynamic range," IEEE
Sensors J., vol. 14, pp. 1988-1996, Jun. 2014.
[15] S. Chan and P. C. Chan, “A resistance-variation-tolerant constant-power heating circuit
for integrated sensor applications,” IEEE J. Solid-State Circuits, vol. 34, no. 4, pp. 432–439, Apr.
1999.
[16] C.A. Leme, R. Lenggenhager, I. Filanovsky, H. Baltes, "Linear CMOS power controller
for precision sensor applications," in Proc. IEEE Int. Symp. Circuits Syst., 1992, pp. 1844-1846.
[17] S. Sarfraz, R. V. Kumar, and F. Udrea, "A high temperature and low power SOI CMOS
MEMS based thermal conductivity gas sensor," in Proc. IEEE Int. Semiconductor Conf., 2013,
pp. 51-54.
[18] S. Z. Ali, et al., "Tungsten-based SOI microhotplates for smart gas sensors," J.
Microelectromech. Syst., vol. 17, pp. 1408-1417, Dec. 2008.
[19] Z. Cai, et al., "An integrated carbon dioxide sensor based on ratiometric thermal-
conductivity measurement," in Proc. IEEE Int. Conf. on Solid-State Sensors, Actuators and
Microsystems (Transducers '15), 2015, pp. 622-625.
[20] FIGARO TGS8100 datasheet (rev06), FIGARO [Online]. Available:
http://www.figaro.co.jp/.
[21] Z. Cai, et al., "A ratiometric readout circuit for thermal-conductivity-based resistive gas
sensors," in Proc. ESSCIRC, 2015, pp. 275-278.
[22] N.M. Mohan, B. George and V.J. Kumar, "A novel dual-slope resistance-to-digital
This is the author's version of an article that has been published in this journal. Changes were made to this version by the publisher prior to publication.The final version of record is available at http://dx.doi.org/10.1109/JSSC.2016.2587861
Copyright (c) 2019 IEEE. Personal use is permitted. For any other purposes, permission must be obtained from the IEEE by emailing [email protected].
converter," IEEE Trans. Instrum. Meas., vol. 59, no. 5, pp. 1013-1018, May 2010.
[23] C. K. Leung and D. M. Wilson, "Integrated interface circuits for chemiresistor arrays," in
Proc. IEEE Int. Symp. Circuits Syst., 2005, pp. 5914-5917.
[24] X. Mu, et al., "CMOS monolithic nanoparticle-coated chemiresistor array for micro-scale
gas chromatography," IEEE Sensors J., vol. 12, no. 7, pp. 2444-2452, Jul. 2012.
[25] M. Grassi, P. Malcovati, and A. Baschirotto, "A 160 dB equivalent dynamic range auto-
scaling interface for resistive gas sensors arrays," IEEE J. Solid-State Circuits, vol. 42, no. 3, pp.
518-528, Mar. 2007.
[26] K. Bult and G. J. G. M. Geelen, "A fast-settling CMOS op amp for SC circuits with 90-
dB DC gain," IEEE J. Solid-State Circuits, vol. 25, no. 6, pp. 1379-1384, Dec 1990.
[27] H. Fiedler, et al., “A 5-bit building block for 20 MHz A/D converters,” IEEE J. Solid-
State Circuits, vol. 16, no. 3, pp. 151–155, Jun. 1981.
[28] R. Schreier, J. Silva, J. Steensgaard and G. C. Temes, "Design-oriented estimation of
thermal noise in switched-capacitor circuits," IEEE Trans. Circuits Syst., I, Regular papers, vol.
52, no. 11, pp. 2358-2368, Nov. 2005.
[29] J. Markus, J. Silva, and G. C. Temes, “Theory and applications of incremental ΔΣ
converters,” IEEE Trans. Circuits Syst. I, Fundam. Theory Applicat., vol. 51, no. 4, pp. 678–690,
Apr. 2004.
[30] K. Seetharaman, et al., "A robust thin-film wafer-level packaging approach for MEMS
devices." J. Microelectronics and Electronic Packaging, vol. 7, pp. 175-180, Jul. 2010.
This is the author's version of an article that has been published in this journal. Changes were made to this version by the publisher prior to publication.The final version of record is available at http://dx.doi.org/10.1109/JSSC.2016.2587861
Copyright (c) 2019 IEEE. Personal use is permitted. For any other purposes, permission must be obtained from the IEEE by emailing [email protected].
(a)
(b)
Fig. 1. Steady-state thermal resistance measurement principle; (a) cross-sectional view of a
suspended hot-wire resistive transducer and its heat-loss paths and (b) the equivalent model in
both electrical and thermal domains
(a) (b)
Fig. 2. (a) CO2-sensitive and (b) reference transducer alternately biased at two different current
levels
Electrical Thermal
R P ∆TI θair
Theater
Tamb.
P = I2 · R ∆T = P · θ = P · (θair
|| θsub
)
θsub
Ic
Ih = ·I
cIc
Ih = ·I
c
This is the author's version of an article that has been published in this journal. Changes were made to this version by the publisher prior to publication.The final version of record is available at http://dx.doi.org/10.1109/JSSC.2016.2587861
Copyright (c) 2019 IEEE. Personal use is permitted. For any other purposes, permission must be obtained from the IEEE by emailing [email protected].
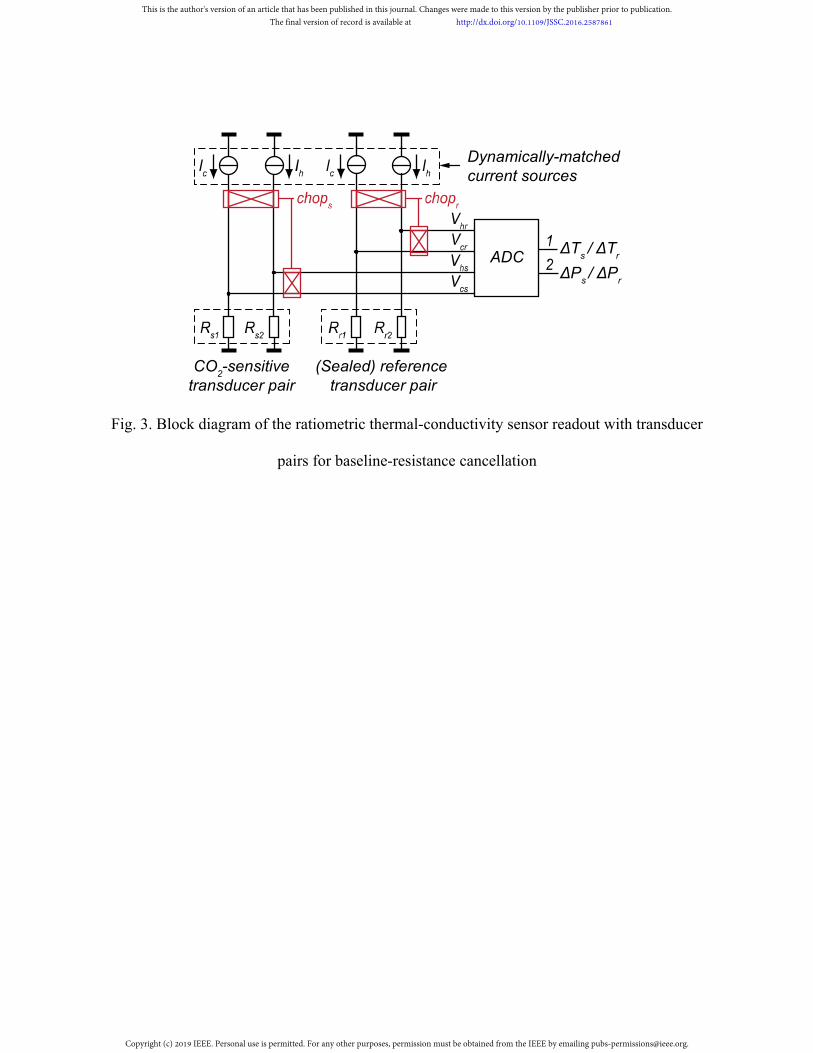
Fig. 3. Block diagram of the ratiometric thermal-conductivity sensor readout with transducer
pairs for baseline-resistance cancellation
∆Ts/ ∆T
r
∆Ps/ ∆P
r
ADC
CO2-sensitive
transducer pair(Sealed) reference
transducer pair
Dynamically-matchedcurrent sources
This is the author's version of an article that has been published in this journal. Changes were made to this version by the publisher prior to publication.The final version of record is available at http://dx.doi.org/10.1109/JSSC.2016.2587861
Copyright (c) 2019 IEEE. Personal use is permitted. For any other purposes, permission must be obtained from the IEEE by emailing [email protected].
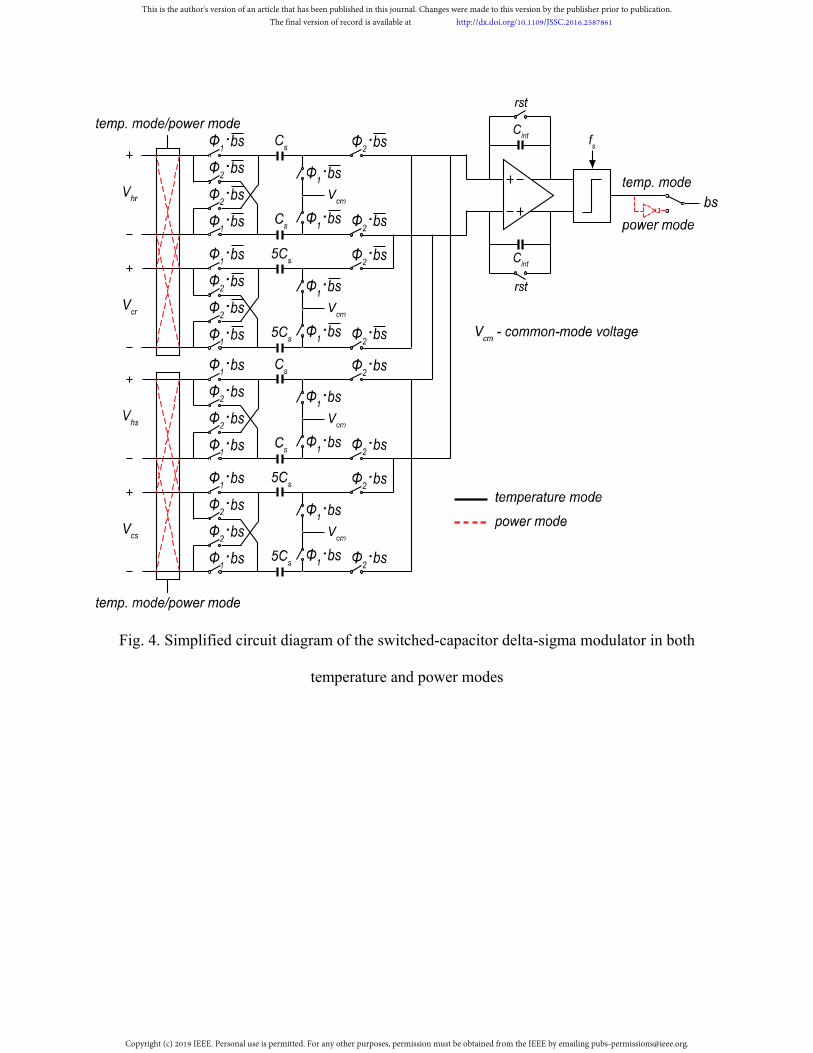
Fig. 4. Simplified circuit diagram of the switched-capacitor delta-sigma modulator in both
temperature and power modes
·
·
··
·
·
·
·
·
·
··
·
·
·
·
·
·
··
·
·
·
·
·
·
··
·
·
·
·
This is the author's version of an article that has been published in this journal. Changes were made to this version by the publisher prior to publication.The final version of record is available at http://dx.doi.org/10.1109/JSSC.2016.2587861
Copyright (c) 2019 IEEE. Personal use is permitted. For any other purposes, permission must be obtained from the IEEE by emailing [email protected].
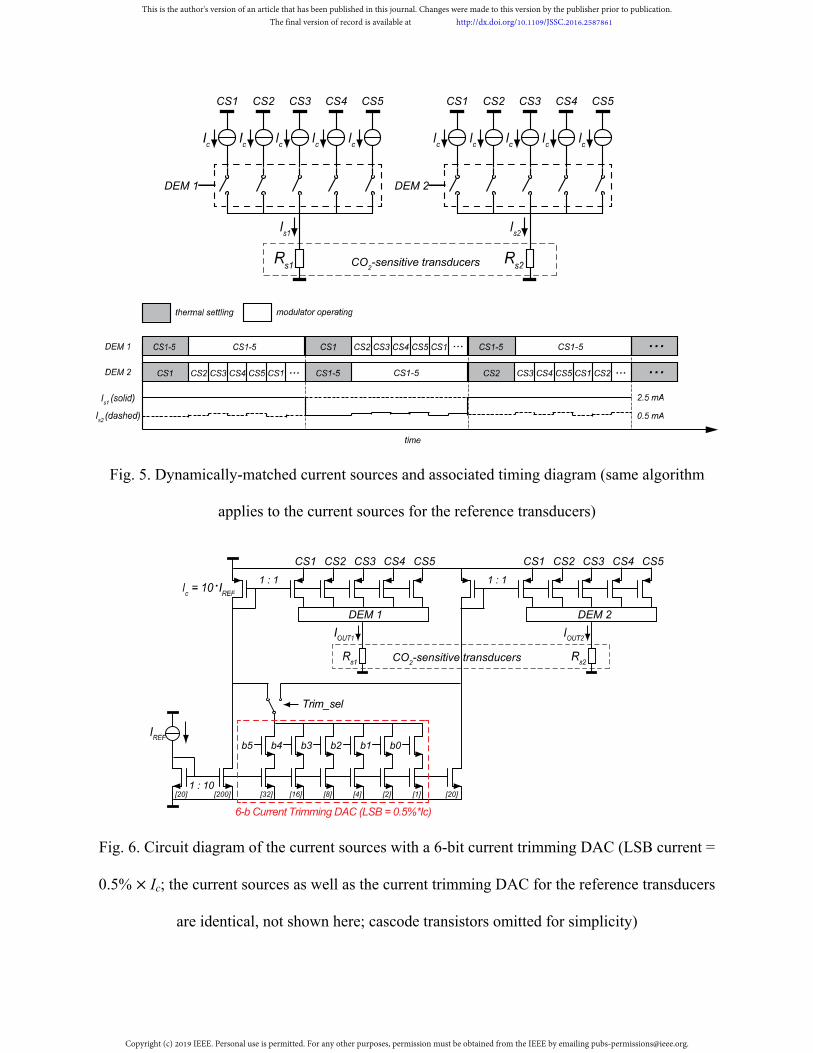
Fig. 5. Dynamically-matched current sources and associated timing diagram (same algorithm
applies to the current sources for the reference transducers)
Fig. 6. Circuit diagram of the current sources with a 6-bit current trimming DAC (LSB current =
0.5% Ic; the current sources as well as the current trimming DAC for the reference transducers
are identical, not shown here; cascode transistors omitted for simplicity)
CO2-sensitive transducers
...
...
CS1-5
CS1-5
...
...
...
CS1 CS2 CS3 CS4 CS5
DEM 1
CS1 CS2 CS3 CS4 CS5
DEM 2
CO2-sensitive transducers
b5 b4 b3 b2 b1 b0
6-b Current Trimming DAC (LSB = 0.5%*Ic)
Trim_sel
·
1 : 10
1 : 1
[20] [200] [1][2][4][8][16][32]
DEM 1 DEM 2
CS1 CS2 CS3 CS4 CS5 CS1 CS2 CS3 CS4 CS5
[20]
1 : 1
This is the author's version of an article that has been published in this journal. Changes were made to this version by the publisher prior to publication.The final version of record is available at http://dx.doi.org/10.1109/JSSC.2016.2587861
Copyright (c) 2019 IEEE. Personal use is permitted. For any other purposes, permission must be obtained from the IEEE by emailing [email protected].
(a) (b)
(c)
Fig. 7. (a) Layout plot, (b) micrograph of the integrated readout circuit and (c) micrograph of a
CMOS-compatible tungsten-wire transducer (using Kelvin connections, two wide tracks for
current driving and two narrow tracks for voltage sensing)
This is the author's version of an article that has been published in this journal. Changes were made to this version by the publisher prior to publication.The final version of record is available at http://dx.doi.org/10.1109/JSSC.2016.2587861
Copyright (c) 2019 IEEE. Personal use is permitted. For any other purposes, permission must be obtained from the IEEE by emailing [email protected].
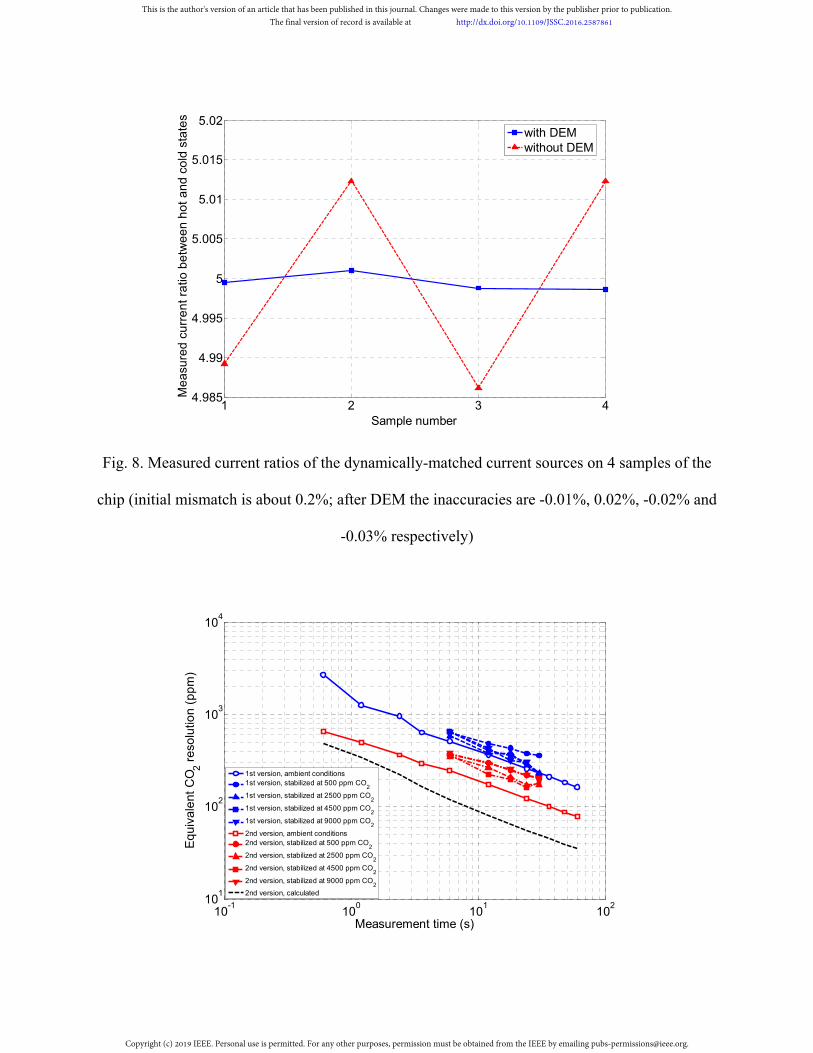
Fig. 8. Measured current ratios of the dynamically-matched current sources on 4 samples of the
chip (initial mismatch is about 0.2%; after DEM the inaccuracies are -0.01%, 0.02%, -0.02% and
-0.03% respectively)
1 2 3 44.985
4.99
4.995
5
5.005
5.01
5.015
5.02
Sample number
Me
asu
red
cu
rre
nt
ratio
be
twe
en
ho
t a
nd
co
ld s
tate
s
with DEMwithout DEM
10-1
100
101
10210
1
102
103
104
Measurement time (s)
Eq
uiva
lent
CO
2 r
eso
lutio
n (
pp
m)
1st version, ambient conditions1st version, stabilized at 500 ppm CO
2
1st version, stabilized at 2500 ppm CO2
1st version, stabilized at 4500 ppm CO2
1st version, stabilized at 9000 ppm CO2
2nd version, ambient conditions2nd version, stabilized at 500 ppm CO
2
2nd version, stabilized at 2500 ppm CO2
2nd version, stabilized at 4500 ppm CO2
2nd version, stabilized at 9000 ppm CO2
2nd version, calculated
This is the author's version of an article that has been published in this journal. Changes were made to this version by the publisher prior to publication.The final version of record is available at http://dx.doi.org/10.1109/JSSC.2016.2587861
Copyright (c) 2019 IEEE. Personal use is permitted. For any other purposes, permission must be obtained from the IEEE by emailing [email protected].
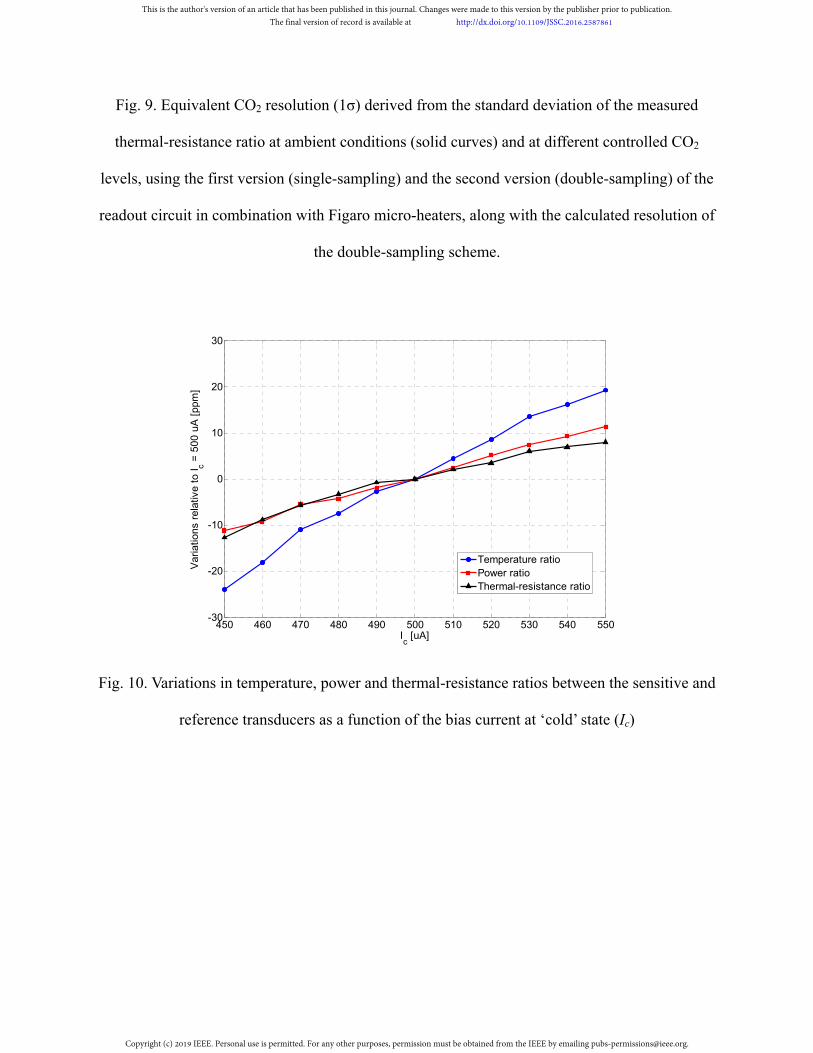
Fig. 9. Equivalent CO2 resolution (1σ) derived from the standard deviation of the measured
thermal-resistance ratio at ambient conditions (solid curves) and at different controlled CO2
levels, using the first version (single-sampling) and the second version (double-sampling) of the
readout circuit in combination with Figaro micro-heaters, along with the calculated resolution of
the double-sampling scheme.
Fig. 10. Variations in temperature, power and thermal-resistance ratios between the sensitive and
reference transducers as a function of the bias current at ‘cold’ state (Ic)
450 460 470 480 490 500 510 520 530 540 550-30
-20
-10
0
10
20
30
Ic [uA]
Var
iatio
ns r
elat
ive
to I c =
500
uA
[pp
m]
Temperature ratioPower ratioThermal-resistance ratio
This is the author's version of an article that has been published in this journal. Changes were made to this version by the publisher prior to publication.The final version of record is available at http://dx.doi.org/10.1109/JSSC.2016.2587861
Copyright (c) 2019 IEEE. Personal use is permitted. For any other purposes, permission must be obtained from the IEEE by emailing [email protected].
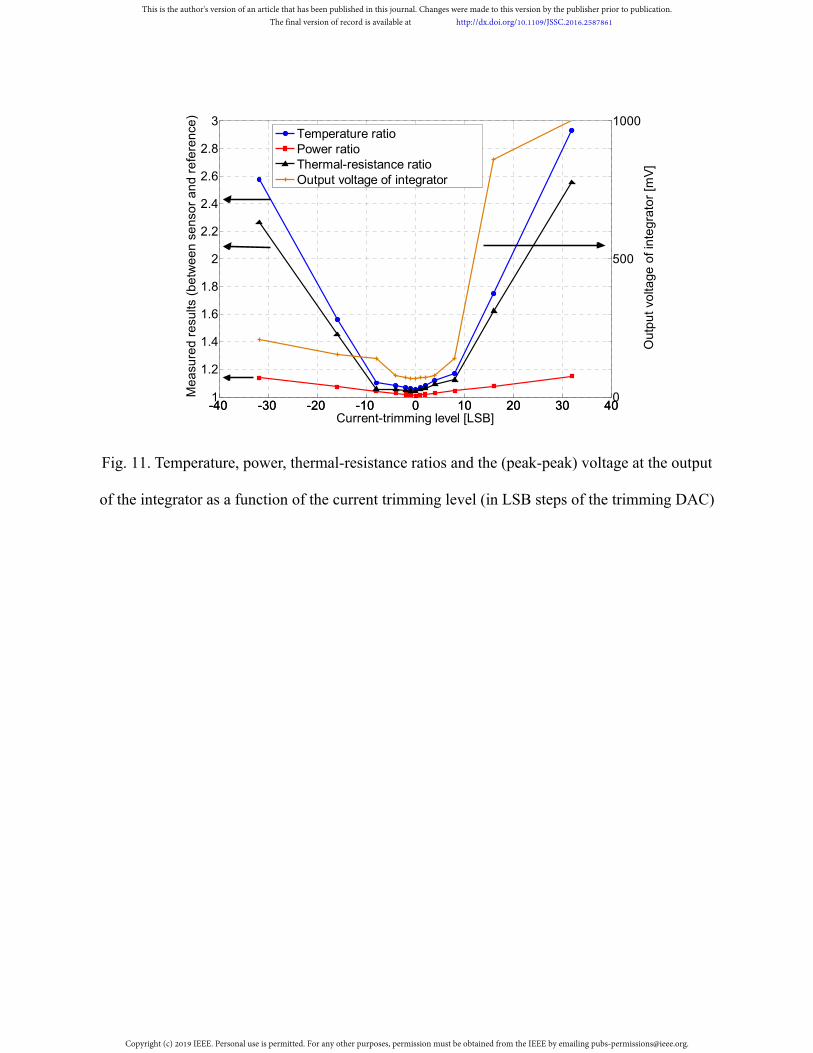
Fig. 11. Temperature, power, thermal-resistance ratios and the (peak-peak) voltage at the output
of the integrator as a function of the current trimming level (in LSB steps of the trimming DAC)
-40 -30 -20 -10 0 10 20 30 401
1.2
1.4
1.6
1.8
2
2.2
2.4
2.6
2.8
3
Me
asu
red
re
sults
(b
etw
ee
n s
en
sor
an
d r
efe
ren
ce)
Current-trimming level [LSB]
-40 -30 -20 -10 0 10 20 30 400
500
1000
Ou
tpu
t vo
ltage
of i
nte
gra
tor
[mV
]
Temperature ratioPower ratioThermal-resistance ratioOutput voltage of integrator
This is the author's version of an article that has been published in this journal. Changes were made to this version by the publisher prior to publication.The final version of record is available at http://dx.doi.org/10.1109/JSSC.2016.2587861
Copyright (c) 2019 IEEE. Personal use is permitted. For any other purposes, permission must be obtained from the IEEE by emailing [email protected].
(a)
(b)
Fig. 12. Thermal-resistance ratio measured using the first version of the readout circuit with a
70 s measurement time, in combination with tungsten-wire transducers, for step-wise changing
CO2 concentration, without (a) and with (b) compensation for temperature and pressure cross-
sensitivity, along with CO2 concentration measured using an accurate reference NDIR sensor.
0 1 2 3 4 5 6
x 104
5.775
5.777
5.779
5.781
5.783
5.785
5.787
5.789
5.791
5.793
s/
r (w
ithou
t dec
orre
latio
n)
Elapsed Time (s)
0 1 2 3 4 5 6
x 104
0
2000
4000
6000
8000
10000
CO
2 C
once
ntra
tion
(ppm
)
RatioCO
2(ppm)
0 1 2 3 4 5 6
x 104
5.7716
5.7736
5.7756
5.7776
5.7796
5.7816
5.7836
5.7856
5.7875
s/
r (
with
dec
orre
latio
n)
Elapsed Time (s)
0 1 2 3 4 5 6
x 104
0
2000
4000
6000
8000
10000
CO
2 C
once
ntra
tion
(ppm
)
RatioCO
2(ppm)
This is the author's version of an article that has been published in this journal. Changes were made to this version by the publisher prior to publication.The final version of record is available at http://dx.doi.org/10.1109/JSSC.2016.2587861
Copyright (c) 2019 IEEE. Personal use is permitted. For any other purposes, permission must be obtained from the IEEE by emailing [email protected].
(a)
(b)
Fig. 13. Thermal-resistance ratio measured using the first (a) and second (b) version of the
readout circuit, both with a 30 s measurement time, in combination with Figaro TGS 8100
transducers, with compensation for temperature and pressure cross-sensitivity, for step-wise
changing CO2 concentration, along with CO2 concentration measured using an accurate reference
NDIR sensor.
0 1 2 3 4 5 6 7
x 104
1.0455
1.046
1.0465
1.047
1.0475
s/r
Elapsed Time (s)
0
1000
2000
3000
4000
5000
6000
7000
8000
9000
CO
2 C
once
ntra
tion
(ppm
)
RatioCO
2(ppm)
0 1 2 3 4 5 6 7
x 104
1.0665
1.067
1.0675
1.068
1.0685
1.069
s/r
Elapsed Time (s)
0
1000
2000
3000
4000
5000
6000
7000
8000
9000
CO
2 C
once
ntra
tion
(ppm
)
RatioCO
2(ppm)
This is the author's version of an article that has been published in this journal. Changes were made to this version by the publisher prior to publication.The final version of record is available at http://dx.doi.org/10.1109/JSSC.2016.2587861
Copyright (c) 2019 IEEE. Personal use is permitted. For any other purposes, permission must be obtained from the IEEE by emailing [email protected].
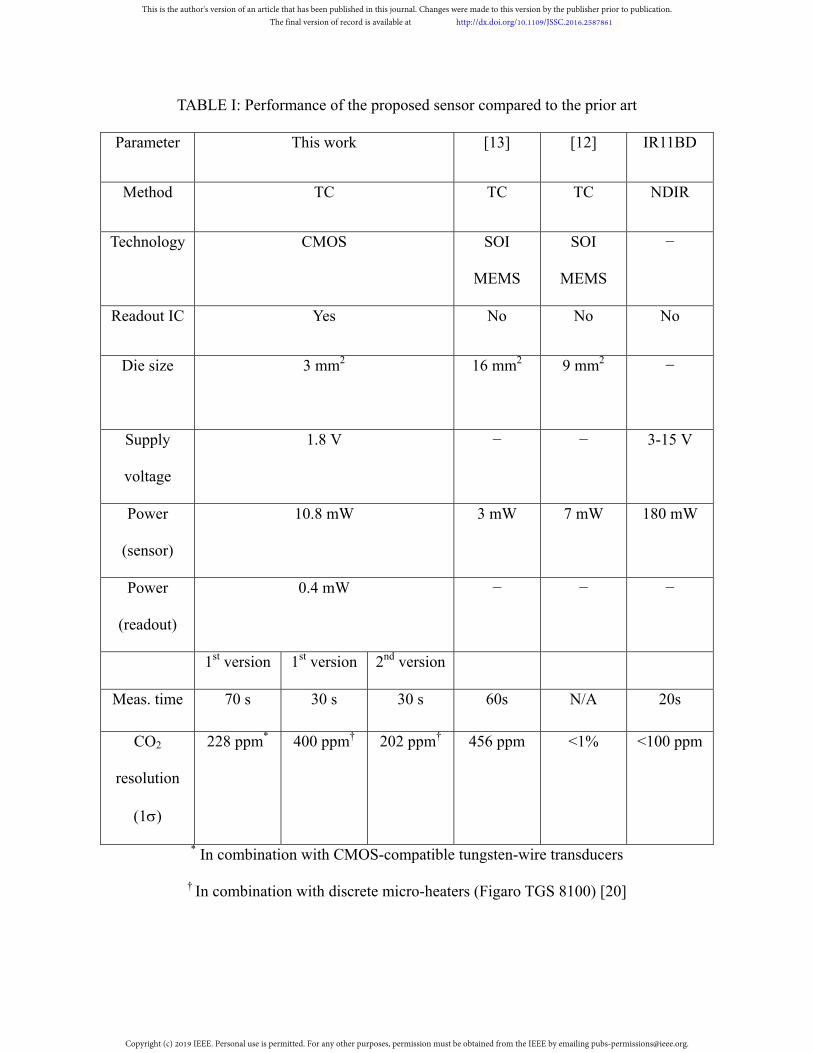
TABLE I: Performance of the proposed sensor compared to the prior art
Parameter This work [13] [12] IR11BD
Method TC TC TC NDIR
Technology CMOS SOI
MEMS
SOI
MEMS
−
Readout IC Yes No No No
Die size 3 mm2
16 mm2 9 mm2 −
Supply
voltage
1.8 V
− − 3-15 V
Power
(sensor)
10.8 mW
3 mW 7 mW 180 mW
Power
(readout)
0.4 mW
− − −
1st version 1st version 2nd version
Meas. time 70 s 30 s 30 s 60s N/A 20s
CO2
resolution
(1)
228 ppm* 400 ppm† 202 ppm† 456 ppm <1% <100 ppm
* In combination with CMOS-compatible tungsten-wire transducers
† In combination with discrete micro-heaters (Figaro TGS 8100) [20]
This is the author's version of an article that has been published in this journal. Changes were made to this version by the publisher prior to publication.The final version of record is available at http://dx.doi.org/10.1109/JSSC.2016.2587861
Copyright (c) 2019 IEEE. Personal use is permitted. For any other purposes, permission must be obtained from the IEEE by emailing [email protected].