Embed Size (px)
Citation preview
APPLICATION OF VIBRATIONAL SPECTROSCOPIC TECHNIQUES TO SILCRETE ANALYSIS 1541
Copyright © 2004 John Wiley & Sons, Ltd. Earth Surf. Process. Landforms 29, 1541–1558 (2004)
Earth Surface Processes and Landforms
Earth Surf. Process. Landforms 29, 1541–1558 (2004)Published online 8 October 2004 in Wiley InterScience (www.interscience.wiley.com). DOI: 10.1002/esp.1137
A RECONNAISSANCE LASER RAMAN AND FOURIER TRANSFORM
INFRARED SURVEY OF SILCRETES FROM THE KALAHARI DESERT,
BOTSWANA
DAVID J. NASH* AND LAURENCE HOPKINSON
School of the Environment, University of Brighton, Lewes Road, Brighton BN2 4GJ, UK
Received 15 July 2003; Revised 8 October 2003; Accepted 20 October 2003
ABSTRACT
This paper documents the first application of laser Raman and Fourier transform infrared vibrational spectroscopic techniques(Raman/FT-IR) to the analysis of silcrete. Analyses are undertaken at a reconnaissance level on bulk silcrete samples ofvarying ages, drawn from a range of geomorphological settings across the Kalahari Desert of Botswana. Results suggest thatRaman/FT-IR, combined with inspection of petrographic thin-sections, provides an effective tool for establishing the rangeand type of silica polymorphs present within samples. Analyses of Raman and mid-infrared spectra indicate that the majorityof silcretes are dominated by α-quartz with subordinate moganite. There is, however, considerable inter-sample variability,ranging from silcretes consisting of almost pure quartz to those containing complex admixtures of disordered microcrystallineor non-crystalline silica in association with quartz and clays. Taken as a whole, the results are supportive of a similarenvironment of formation for all samples, with development taking place under broadly semi-arid conditions. Raman/FT-IR is also shown to have a number of benefits over other conventional techniques for silcrete analysis, such as X-raydiffraction. Firstly, inspection of the OH region of the infrared spectrum of bulk samples is shown to have potential forestablishing the provenance of quartz clasts within silcrete host sediments, through the identification of high-temperatureconditions of crystal growth in detrital quartz grains. Raman and mid-infrared analyses also permit clay identification withinsilcrete samples where such minerals are not readily resolvable in thin-section. The technique further allows the relativematurity of silcrete cements to be established, particularly for recently formed silcretes. These are found typically to containless mature silica polymorphs and incorporate larger quantities of molecular water than α-quartz dominated silcretes. Com-parisons of the range of silica polymorphs identified using Raman/FT-IR with those established by petrographic investigationcan also reveal evidence of silica paragenesis. This is the case in two stratigraphically older samples from the Kalaharimargin in which less stable silica polymorphs appear to have transformed over time to chalcedony and microquartz. Whilstthe ‘whole-rock’ approach used in this survey generates some problems of interpretation, the overall results suggest thatthe use of micro-Raman and micro-FT-IR techniques should allow even more precise information about the environmentsof formation and developmental histories of silcrete profiles to be produced in the future. Copyright © 2004 John Wiley &Sons, Ltd.
KEY WORDS: silcrete; Kalahari; laser Raman; FT-IR; silica
INTRODUCTION
Silcretes are highly indurated terrestrial geochemical sediments formed as a product of low temperature surficial
and penesurficial physico-chemical processes, wherein silica cements and/or replaces pre-existing sediment, soil,
rock or weathered material. Silcretes are defined as containing >85 wt per cent silica (Summerfield, 1983), with
some exceptionally pure examples comprising >95 per cent wt SiO2 (Nash et al., 1994a). This definition is,
however, based upon the bulk chemistry of powdered samples and masks the relative proportions of host
sediments and silica-cementing agents. It also disguises the variety of silica species (polymorphs) present in a
sample, which may, together with analyses of the silcrete fabric, provide an indication of the environment of
formation and any post-formational diagenetic transformation. Most silcretes will include a range of silica
polymorphs within their cement in addition to species such as quartz inherited from the host rock or regolith
* Correspondence to: D. J. Nash, School of the Environment, University of Brighton, Lewes Road, Brighton BN2 4GJ, UK.E-mail: [email protected]
1542 D. J. NASH AND L. HOPKINSON
Copyright © 2004 John Wiley & Sons, Ltd. Earth Surf. Process. Landforms 29, 1541–1558 (2004)
(Milnes and Thiry, 1992). These commonly comprise primary and secondary opal, chalcedony and quartz which
may be present as part of the cement, or within cutans and void-fills, and may have developed as a primary
precipitate or via paragenesis from a pre-existing silica polymorph.
The most common approach employed to identify the variety and type of silica polymorphs within a silcrete
is to use petrographic investigations of thin-sections and/or X-ray diffraction (XRD) analyses. The analysis of
silcrete thin-sections is a relatively effective technique for identifying the range of silica species present. It can,
however, produce misleading results, especially for silcretes which have undergone paragenesis but have re-
tained their original fabric and texture (Heaney, 1995; see below). Conventional XRD analyses can be used to
provide a more accurate indication of the variety of silica polymorphs present. However, this approach also has
its weaknesses. Firstly, determining the presence of any mineral using XRD is reliant upon the recognition of
diagnostic X-ray scattering angle patterns produced by different minerals. The technique only works effectively
for crystalline minerals and is less successful in identifying minerals with a lower degree of crystal order. Linked
to this are difficulties which occur where peaks in the X-ray scattering angle spectra associated with one
dominant mineral coincide with those of other minerals. This is a major problem with silcretes containing
crystalline quartz which has characteristic diffraction peaks which overlap with those associated with the silica
polymorph moganite (Heaney, 1995). The refinement of powder XRD data by Rietveld methods can overcome
this problem (Heaney, 1995) but is beyond the scope of many investigations.
In addition to thin-section and XRD analyses, there are, however, other techniques that can provide informa-
tion on the physical and chemical nature of silica polymorphs, both individually and in combination, within
geological materials. Foremost amongst these are Raman and Fourier transform infrared spectroscopy, hereafter
referred to as Raman/FT-IR, which can be used to identify the range of polymorphs present and to characterize
the nature of hydrogen speciation within silica species. These techniques have been successfully employed on
samples from a variety of settings (e.g. Kingma and Hemley, 1994; Hopkinson et al., 1998, 1999), but have not,
to date, been applied to silcretes. As such, the aim of this study is to demonstrate how Raman/FT-IR can be
used, in combination with thin-section investigations, to rapidly characterize the range of silica species within
bulk samples. The paper, firstly, reviews recent developments in our understanding of the factors controlling the
variety of low temperature silica polymorphs present within silcretes, and outlines the Raman/FT-IR spectroscopic
signatures of these polymorphs. It then applies Raman/FT-IR to silcretes sampled from across the Kalahari
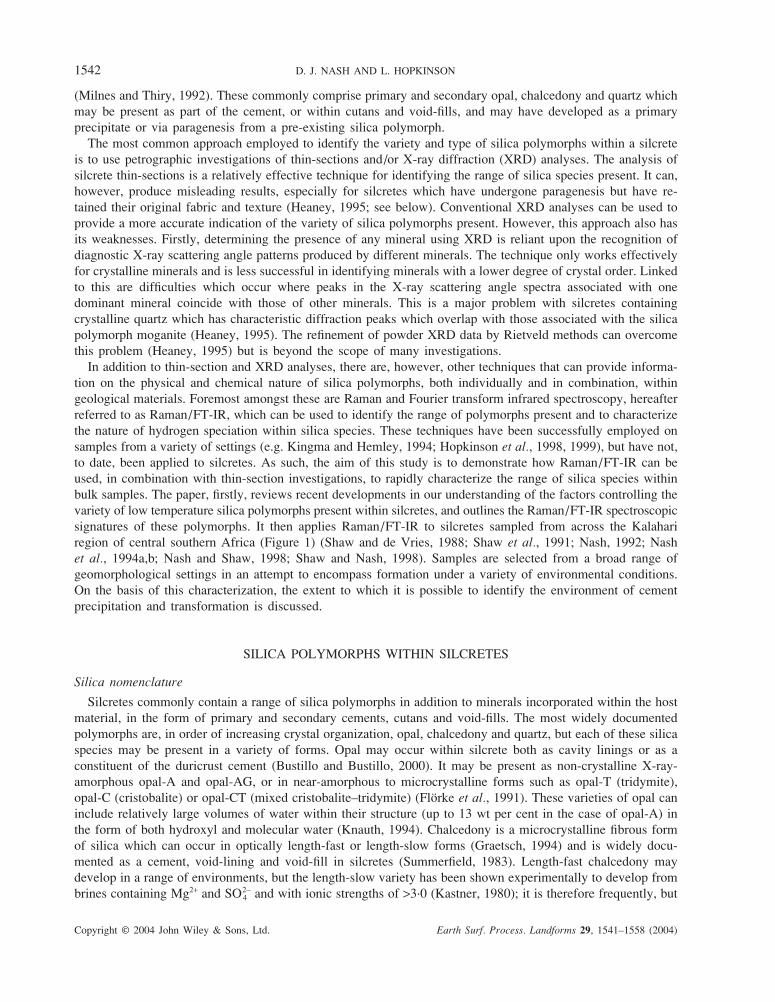
region of central southern Africa (Figure 1) (Shaw and de Vries, 1988; Shaw et al., 1991; Nash, 1992; Nash
et al., 1994a,b; Nash and Shaw, 1998; Shaw and Nash, 1998). Samples are selected from a broad range of
geomorphological settings in an attempt to encompass formation under a variety of environmental conditions.
On the basis of this characterization, the extent to which it is possible to identify the environment of cement
precipitation and transformation is discussed.
SILICA POLYMORPHS WITHIN SILCRETES
Silica nomenclature
Silcretes commonly contain a range of silica polymorphs in addition to minerals incorporated within the host
material, in the form of primary and secondary cements, cutans and void-fills. The most widely documented
polymorphs are, in order of increasing crystal organization, opal, chalcedony and quartz, but each of these silica
species may be present in a variety of forms. Opal may occur within silcrete both as cavity linings or as a
constituent of the duricrust cement (Bustillo and Bustillo, 2000). It may be present as non-crystalline X-ray-
amorphous opal-A and opal-AG, or in near-amorphous to microcrystalline forms such as opal-T (tridymite),
opal-C (cristobalite) or opal-CT (mixed cristobalite–tridymite) (Flörke et al., 1991). These varieties of opal can
include relatively large volumes of water within their structure (up to 13 wt per cent in the case of opal-A) in
the form of both hydroxyl and molecular water (Knauth, 1994). Chalcedony is a microcrystalline fibrous form
of silica which can occur in optically length-fast or length-slow forms (Graetsch, 1994) and is widely docu-
mented as a cement, void-lining and void-fill in silcretes (Summerfield, 1983). Length-fast chalcedony may
develop in a range of environments, but the length-slow variety has been shown experimentally to develop from
brines containing Mg2+ and SO42− and with ionic strengths of >3·0 (Kastner, 1980); it is therefore frequently, but
APPLICATION OF VIBRATIONAL SPECTROSCOPIC TECHNIQUES TO SILCRETE ANALYSIS 1543
Copyright © 2004 John Wiley & Sons, Ltd. Earth Surf. Process. Landforms 29, 1541–1558 (2004)
Figure 1. Sample locations across the Kalahari Desert of Botswana
not exclusively, used as an indicator of formation in evaporitic settings (Folk and Pittman, 1971; Heaney, 1995).
Chalcedony consists of nanoscale intergrowths of quartz and the optically length-slow fibrous silica polymorph
moganite (Heaney, 1993, 1995), itself comprising lattice slabs of left- and right-handed α-quartz which are
twinned at the unit cell scale (Flörke et al., 1976, 1984; Miehe and Graetsch, 1992; Heaney and Post, 1992).
The presence of enhanced concentrations of moganite (>20 wt per cent) within siliceous accumulations may
also provide an indication of precipitation under an evaporitic regime (Heaney, 1995). Quartz occurs as two
types: type A includes all natural and smoky crystals that form at relatively high temperatures, whilst type B
includes chert, agate, associated single α-quartz crystals, amethyst and low temperature synthetic quartz (Frondel,
1982). Quartz may be present within silcrete as microcrystalline microquartz or as well-defined crystals of
1544 D. J. NASH AND L. HOPKINSON
Copyright © 2004 John Wiley & Sons, Ltd. Earth Surf. Process. Landforms 29, 1541–1558 (2004)
authigenic α-quartz, termed megaquartz. Microquartz is present both as a cement and as a void-lining, commonly
overlying opal or chalcedony, whilst megaquartz commonly occurs as clasts, intergrown microscopic grains and
overgrowths, as well as subhedral quartz crystals towards the centre of cavities.
Controls upon silica distribution within silcretes: solubility and paragenesis
The variety of silica polymorphs present within a silcrete depends not only upon the silica species initially
precipitated but also the diagenetic history of the material, both of which are controlled by a range of interacting
factors. The likelihood of silica precipitation occurring in near-surface environments is strongly controlled by
the concentration of SiO2 in solution, itself related to the availability of suitable local or distant silica sources
and the duration of drying and wetting cycles. In contrast to many other minerals, the most soluble silica
polymorph will be precipitated first from any supersaturated solution. This is commonly amorphous silica due
to its higher aqueous solubility under neutral conditions (60–130 ppm) compared to other silica species such as
cristobalite (20–30 ppm) and quartz (6–10 ppm) (Williams et al., 1985). Precipitation is also controlled by other
factors, including temperature, pressure, pH, Eh, and the presence of other dissolved constituents. The effects
of changing temperature and pressure are negligible in most near-surface environments. However, variations in
pH, Eh and cation concentration may significantly affect solubility.
Silica solubility is relatively stable under weakly acidic to neutral pH, but increases rapidly above pH 9 (Dove
and Rimstidt, 1994). Such high pH levels are not uncommon in arid environments where alkaline conditions may
occur as a result of extensive evaporation and interactions between Na+ and other soluble salts (Chadwick et al.,
1989). Silica entering solution as a result of such enhanced pH, or which moves vertically or laterally in solution
into a higher pH zone, is likely to precipitate if pH subsequently drops to below 9. Environmental Eh has a more
complex effect upon solubility. Experiments by Morris and Fletcher (1987) have shown that fine-grained quartz
placed in solutions containing ferrous iron for 1 to 9 days became more soluble following exposure to oxidizing
conditions. This is most probably due to surface reactions of iron with silica under alternating reducing and
oxidizing environments. The presence of dissolved constituents may affect silica solubility in two ways. Firstly,
some solutes (including Fe3+, UO2+, Mg2+, Ca2+, Na2+ and F−) react with dissolved silica to form complexes,
leading to the dissolution of solids and increasing silica solubility. Secondly, some solutes, such as NaCl, change
the solvent properties of the solution and also enhance solubility due to the ionic strength effect (Dove and
Rimstidt, 1994). In all of these reactions the most soluble forms of silica are likely to precipitate first, with the
crystal size and degree of crystal order controlled by the speed of precipitation (Millot, 1960, 1970), itself
determined by the host material porosity and permeability and the influence of evaporation. Silica monomers are
known to polymerize and form colloidal particles from solutions containing 100–200 ppm silica (Thiry and
Millot, 1987). If this polymerization takes place in the presence of salts, aggregation may occur leading to the
formation of hydrated opaline silica gels (Iler, 1979). However, under highly saline conditions it is possible for
chalcedony to precipitate directly (Heaney, 1993).
Silica polymorphs may transform by dissolution and subsequent recrystallization into other silica species over
time, making the determination of the sequence of silica cement development within any silcrete extremely
complex. In general, the most soluble silica polymorph present within a silcrete cement will transform in a
stepwise manner to less soluble polymorphs until the most stable polymorph forms (Dove and Rimstidt, 1994).
In the case of silica, amorphous opal-A transforms to near-amorphous opal-CT, better-ordered opal-CT,
cryptocrystalline quartz or chalcedony and finally microcrystalline quartz. The sequence of transformation is
determined by a range of processes which influence the degree of supersaturation of any solutions present with
respect to all silica polymorphs, the most significant being complexation of silica, adsorption by clays and other
high-area solids, and the neoformation of clays, zeolites and other silicates (Williams et al., 1985). As a result
of such processes, for example, it is possible for the steady-state dissolved silica concentration to fall to below
the solubility level of opal-A and opal-CT but not that of quartz, so that opal-A could transform directly into
quartz. Silica paragenesis may be accompanied by textural changes but often the transformed minerals retain the
original silcrete fabric and textures through a process of grain-by-grain replacement (Williams et al., 1985). This
can lead to confusion when identifying minerals in thin-section. Studies by Heaney (1995) of silica species
within samples known to have formed in evaporitic settings showed that, despite the identification of optically
length-slow silica in thin-section, the samples contained little or no moganite. XRD analyses of these samples,
APPLICATION OF VIBRATIONAL SPECTROSCOPIC TECHNIQUES TO SILCRETE ANALYSIS 1545
Copyright © 2004 John Wiley & Sons, Ltd. Earth Surf. Process. Landforms 29, 1541–1558 (2004)
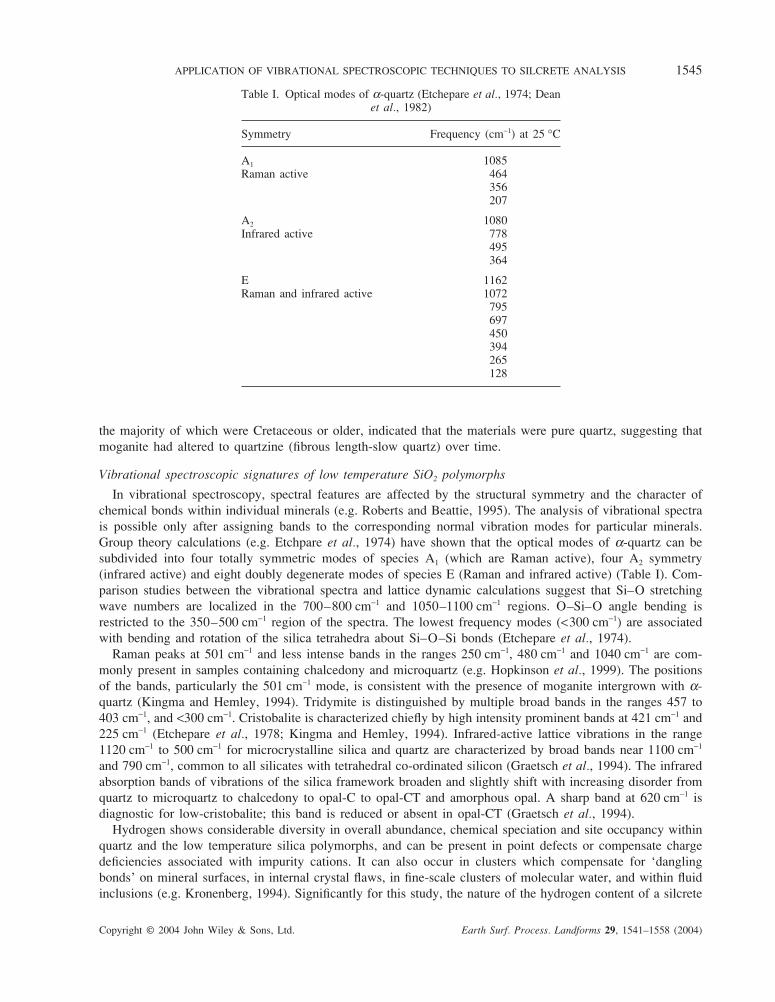
Table I. Optical modes of α-quartz (Etchepare et al., 1974; Deanet al., 1982)
Symmetry Frequency (cm−1) at 25 °C
A1 1085Raman active 464
356207
A2 1080Infrared active 778
495364
E 1162Raman and infrared active 1072
795697450394265128
the majority of which were Cretaceous or older, indicated that the materials were pure quartz, suggesting that
moganite had altered to quartzine (fibrous length-slow quartz) over time.
Vibrational spectroscopic signatures of low temperature SiO2 polymorphs
In vibrational spectroscopy, spectral features are affected by the structural symmetry and the character of
chemical bonds within individual minerals (e.g. Roberts and Beattie, 1995). The analysis of vibrational spectra
is possible only after assigning bands to the corresponding normal vibration modes for particular minerals.
Group theory calculations (e.g. Etchpare et al., 1974) have shown that the optical modes of α-quartz can be
subdivided into four totally symmetric modes of species A1 (which are Raman active), four A2 symmetry
(infrared active) and eight doubly degenerate modes of species E (Raman and infrared active) (Table I). Com-
parison studies between the vibrational spectra and lattice dynamic calculations suggest that Si–O stretching
wave numbers are localized in the 700–800 cm−1 and 1050–1100 cm−1 regions. O–Si–O angle bending is
restricted to the 350–500 cm−1 region of the spectra. The lowest frequency modes (<300 cm−1) are associated
with bending and rotation of the silica tetrahedra about Si–O–Si bonds (Etchepare et al., 1974).
Raman peaks at 501 cm−1 and less intense bands in the ranges 250 cm−1, 480 cm−1 and 1040 cm−1 are com-
monly present in samples containing chalcedony and microquartz (e.g. Hopkinson et al., 1999). The positions
of the bands, particularly the 501 cm−1 mode, is consistent with the presence of moganite intergrown with α-
quartz (Kingma and Hemley, 1994). Tridymite is distinguished by multiple broad bands in the ranges 457 to
403 cm−1, and <300 cm−1. Cristobalite is characterized chiefly by high intensity prominent bands at 421 cm−1 and
225 cm−1 (Etchepare et al., 1978; Kingma and Hemley, 1994). Infrared-active lattice vibrations in the range
1120 cm−1 to 500 cm−1 for microcrystalline silica and quartz are characterized by broad bands near 1100 cm−1
and 790 cm−1, common to all silicates with tetrahedral co-ordinated silicon (Graetsch et al., 1994). The infrared
absorption bands of vibrations of the silica framework broaden and slightly shift with increasing disorder from
quartz to microquartz to chalcedony to opal-C to opal-CT and amorphous opal. A sharp band at 620 cm−1 is
diagnostic for low-cristobalite; this band is reduced or absent in opal-CT (Graetsch et al., 1994).
Hydrogen shows considerable diversity in overall abundance, chemical speciation and site occupancy within
quartz and the low temperature silica polymorphs, and can be present in point defects or compensate charge
deficiencies associated with impurity cations. It can also occur in clusters which compensate for ‘dangling
bonds’ on mineral surfaces, in internal crystal flaws, in fine-scale clusters of molecular water, and within fluid
inclusions (e.g. Kronenberg, 1994). Significantly for this study, the nature of the hydrogen content of a silcrete
1546 D. J. NASH AND L. HOPKINSON
Copyright © 2004 John Wiley & Sons, Ltd. Earth Surf. Process. Landforms 29, 1541–1558 (2004)
is likely to be peculiar to, and therefore diagnostic of, the type(s) of low temperature silica polymorphs within
the sample. It may also provide an indication of the provenance of any detrital quartz grains that may be present.
Much of our information regarding hydrogen defects in SiO2 comes from infrared analyses (e.g. Kronenberg,
1994), through inspection of the portion of the spectrum between 3200 cm−1 and 3600 cm−1. The infrared spectra
of α-quartz crystals within this range can be subdivided into two types (Frondel, 1982). High temperature natural
quartz (type A) may show a variety of sharp bands, most of which are assigned to hydroxyl groups associated
with alkali ions; commonly these include a band at 3370 cm−1. In contrast, chalcedony and associated low
temperature type B α-quartz crystals are characterized by broad band absorption centred at about 3500 cm−1, a
band at 3430 cm−1 superimposed upon this broad band, and a relatively sharp band near 3600 cm−1. The latter
consists of two components at about 3615 cm−1 and 3585 cm−1. The sharp bands are assigned to structural silanol
(Si–OH) groups, whilst the broad continuous absorption is attributed to stretching vibrations of molecular water
and surface silanols (Graetsch, 1994). Moganite shows an infrared spectrum comparable to chalcedony and
associated low temperature α-quartz crystals, i.e. an absorption band due to the presence of structural silanol at
3600 cm−1, and of surface silanols at 3430 cm−1. The overall water content of moganite is slightly higher than
for chalcedony, which typically contains 0·5 to 1·4 per cent molecular water and 0·2 to 0·9 per cent silanol group
water (Graetsch, 1994). In crystalline opals, the amount of water ranges from about 1·5 per cent for opal-C to
more than 10 per cent in some opal-CT samples. Most of this is liquid water, with isolated water molecules
forming a small component (Langer and Flörke, 1974; Aines et al., 1984; Graetsch, 1994). The content of silanol
water is lower than in microcrystalline quartz and non-crystalline opals, though a shoulder at 3650 cm−1 in the
range of fundamental O–H stretching vibrations may be present, indicating the presence of some silanols located
at structural defects (Graetsch, 1994).
METHODS
Samples were selected to represent the broad range of environments of surface silcrete exposure across the
Kalahari (cf. Summerfield, 1982). In common with other duricrusts in the area, silcretes are thickest and most
extensive in association with landscape depressions such as valleys and pans, which act as natural conduits for
surface and subsurface water movement (Mallick et al., 1981; Nash et al., 1994b). These also tend to be the
areas within the relatively flat Kalahari landscape where the greatest exposures of silcrete occur. As such, it is
probable that various groundwater or drainage-line silicification processes are the dominant mechanism for
Kalahari silcrete formation (Nash et al., 1998; Shaw and Nash, 1998; Ullyott et al., 1998). However, silcrete
also occurs in other landscape contexts, such as within escarpments at the margin of the Kalahari Group
sediments (Summerfield, 1982). These silcretes have not been investigated in such detail but may either have
developed due to pedogenic silicification (Ullyott et al., 1998) or may represent the remnants of groundwater
or drainage-line silcretes exposed as a result of relief inversion (cf. Pain and Ollier, 1995).
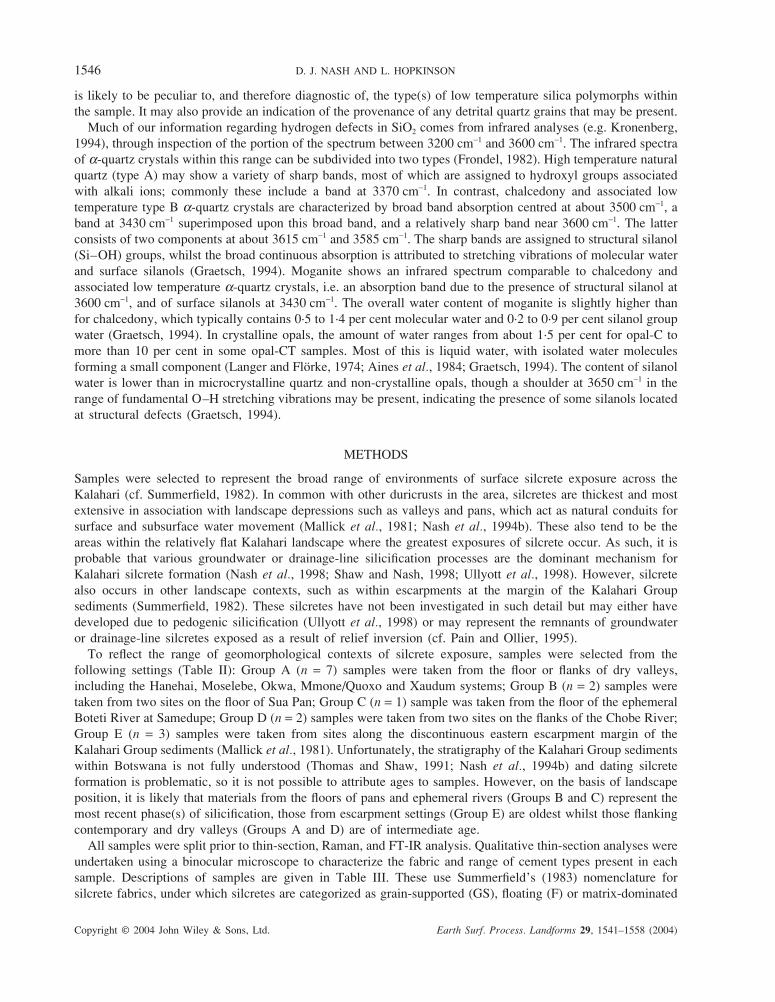
To reflect the range of geomorphological contexts of silcrete exposure, samples were selected from the
following settings (Table II): Group A (n = 7) samples were taken from the floor or flanks of dry valleys,
including the Hanehai, Moselebe, Okwa, Mmone/Quoxo and Xaudum systems; Group B (n = 2) samples were
taken from two sites on the floor of Sua Pan; Group C (n = 1) sample was taken from the floor of the ephemeral
Boteti River at Samedupe; Group D (n = 2) samples were taken from two sites on the flanks of the Chobe River;
Group E (n = 3) samples were taken from sites along the discontinuous eastern escarpment margin of the
Kalahari Group sediments (Mallick et al., 1981). Unfortunately, the stratigraphy of the Kalahari Group sediments
within Botswana is not fully understood (Thomas and Shaw, 1991; Nash et al., 1994b) and dating silcrete
formation is problematic, so it is not possible to attribute ages to samples. However, on the basis of landscape
position, it is likely that materials from the floors of pans and ephemeral rivers (Groups B and C) represent the
most recent phase(s) of silicification, those from escarpment settings (Group E) are oldest whilst those flanking
contemporary and dry valleys (Groups A and D) are of intermediate age.
All samples were split prior to thin-section, Raman, and FT-IR analysis. Qualitative thin-section analyses were
undertaken using a binocular microscope to characterize the fabric and range of cement types present in each
sample. Descriptions of samples are given in Table III. These use Summerfield’s (1983) nomenclature for
silcrete fabrics, under which silcretes are categorized as grain-supported (GS), floating (F) or matrix-dominated
AP
PL
ICA
TIO
N O
F V
IBR
AT
ION
AL
SP
EC
TR
OS
CO
PIC
TE
CH
NIQ
UE
S T
O S
ILC
RE
TE
AN
AL
YS
IS1547
Copyrig
ht ©
2004 Jo
hn W
iley &
Sons, L
td.
Earth
Surf. P
rocess. L
andfo
rms
29, 1
541–1558 (2
004)
Table II. Details of sample sites within the Kalahari Desert of Botswana
Group Sample Geomorphological setting
A BOT98/8 Floor of dry valley
A 1 Flank of dry valley
A 107 Flank of dry valley
A 108 Flank of dry valley
A 117B Flank of dry valley
A 121B Flank of dry valley
A 324 Flank of dry valley
B 305 Playa or pan surfaceB 306 Playa or pan surfaceC 304 Floor of ephemeral river
D 328 Flank of contemporary valley
D 331 Flank of contemporary valley
E 100 Plateau escarpment
E 310 Plateau escarpmentE BOS Plateau escarpment
Sample site location and characteristics
Sample collected from upper surface of silcrete on southern edge of floor ofXaudum valley, 2 km west of NxaunxauSample collected from 2·0 m height on north side of valley head at knickpointin Gaotlhobogwe valley, southeast of LetlhakengSample collected from upper surface of silcrete exposed in southern flank ofMoselebe valley at TshelwaneSample collected from upper surface of silcrete exposure on southern flank ofMoselebe valley, 10 km northwest of MosepetseSample collected from sil-calcrete exposure on southern flank of Okwa valley,4 km east of TswaaneSample collected from sil-calcrete pit on northern flank of Hanehai valley,6 km east of West HanehaiSample collected from 1·5 m height on south side of valley head at knickpointin Gaotlhobogwe valley, southeast of LetlhakengLoose sample collected from surface of Sua Pan near NataLoose sample collected from surface of Sua Pan at Sua Pit near NataSample collected from upper surface of silcrete exposed in the floor of theBoteti River at SamedupeSample collected from upper section of silcrete outcrop on southern flank ofChobe River close to Ngoma BridgeSample collected from upper section of silcrete outcrop on northern flank ofChobe River close to Ngoma BridgeSample collected from upper section of silcrete escarpment 30 km southeast ofLephepheSample collected from upper section of silcrete-capped basaltic outlier at SesaseSample collected from upper section of silcrete-capped basaltic outlier atBosutswe
Previous description orrelated samples
n/a
Nash (1992)
Nash (1992)
Nash (1992)
Nash and Shaw (1998)
Nash (1992)
n/a
n/an/aShaw and Nash (1998)
n/a
n/a
Nash (1992)
n/an/a
1548 D. J. NASH AND L. HOPKINSON
Copyright © 2004 John Wiley & Sons, Ltd. Earth Surf. Process. Landforms 29, 1541–1558 (2004)
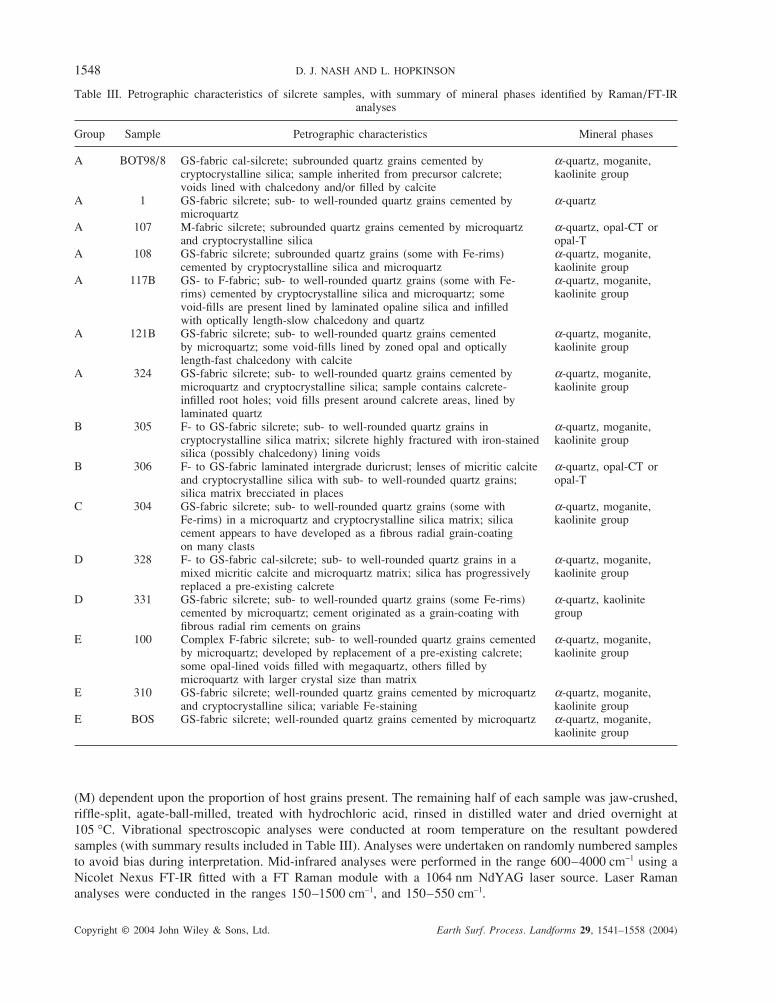
Table III. Petrographic characteristics of silcrete samples, with summary of mineral phases identified by Raman/FT-IRanalyses
Group Sample
A BOT98/8
A 1
A 107
A 108
A 117B
A 121B
A 324
B 305
B 306
C 304
D 328
D 331
E 100
E 310
E BOS
Mineral phases
α-quartz, moganite,kaolinite group
α-quartz
α-quartz, opal-CT oropal-Tα-quartz, moganite,kaolinite groupα-quartz, moganite,kaolinite group
α-quartz, moganite,kaolinite group
α-quartz, moganite,kaolinite group
α-quartz, moganite,kaolinite group
α-quartz, opal-CT oropal-T
α-quartz, moganite,kaolinite group
α-quartz, moganite,kaolinite group
α-quartz, kaolinitegroup
α-quartz, moganite,kaolinite group
α-quartz, moganite,kaolinite groupα-quartz, moganite,kaolinite group
Petrographic characteristics
GS-fabric cal-silcrete; subrounded quartz grains cemented bycryptocrystalline silica; sample inherited from precursor calcrete;voids lined with chalcedony and/or filled by calciteGS-fabric silcrete; sub- to well-rounded quartz grains cemented bymicroquartzM-fabric silcrete; subrounded quartz grains cemented by microquartzand cryptocrystalline silicaGS-fabric silcrete; subrounded quartz grains (some with Fe-rims)cemented by cryptocrystalline silica and microquartzGS- to F-fabric; sub- to well-rounded quartz grains (some with Fe-rims) cemented by cryptocrystalline silica and microquartz; somevoid-fills are present lined by laminated opaline silica and infilledwith optically length-slow chalcedony and quartzGS-fabric silcrete; sub- to well-rounded quartz grains cementedby microquartz; some void-fills lined by zoned opal and opticallylength-fast chalcedony with calciteGS-fabric silcrete; sub- to well-rounded quartz grains cemented bymicroquartz and cryptocrystalline silica; sample contains calcrete-infilled root holes; void fills present around calcrete areas, lined bylaminated quartzF- to GS-fabric silcrete; sub- to well-rounded quartz grains incryptocrystalline silica matrix; silcrete highly fractured with iron-stainedsilica (possibly chalcedony) lining voidsF- to GS-fabric laminated intergrade duricrust; lenses of micritic calciteand cryptocrystalline silica with sub- to well-rounded quartz grains;silica matrix brecciated in placesGS-fabric silcrete; sub- to well-rounded quartz grains (some withFe-rims) in a microquartz and cryptocrystalline silica matrix; silicacement appears to have developed as a fibrous radial grain-coatingon many clastsF- to GS-fabric cal-silcrete; sub- to well-rounded quartz grains in amixed micritic calcite and microquartz matrix; silica has progressivelyreplaced a pre-existing calcreteGS-fabric silcrete; sub- to well-rounded quartz grains (some Fe-rims)cemented by microquartz; cement originated as a grain-coating withfibrous radial rim cements on grainsComplex F-fabric silcrete; sub- to well-rounded quartz grains cementedby microquartz; developed by replacement of a pre-existing calcrete;some opal-lined voids filled with megaquartz, others filled bymicroquartz with larger crystal size than matrixGS-fabric silcrete; well-rounded quartz grains cemented by microquartzand cryptocrystalline silica; variable Fe-stainingGS-fabric silcrete; well-rounded quartz grains cemented by microquartz
(M) dependent upon the proportion of host grains present. The remaining half of each sample was jaw-crushed,
riffle-split, agate-ball-milled, treated with hydrochloric acid, rinsed in distilled water and dried overnight at
105 °C. Vibrational spectroscopic analyses were conducted at room temperature on the resultant powdered
samples (with summary results included in Table III). Analyses were undertaken on randomly numbered samples
to avoid bias during interpretation. Mid-infrared analyses were performed in the range 600–4000 cm−1 using a
Nicolet Nexus FT-IR fitted with a FT Raman module with a 1064 nm NdYAG laser source. Laser Raman
analyses were conducted in the ranges 150–1500 cm−1, and 150–550 cm−1.
APPLICATION OF VIBRATIONAL SPECTROSCOPIC TECHNIQUES TO SILCRETE ANALYSIS 1549
Copyright © 2004 John Wiley & Sons, Ltd. Earth Surf. Process. Landforms 29, 1541–1558 (2004)
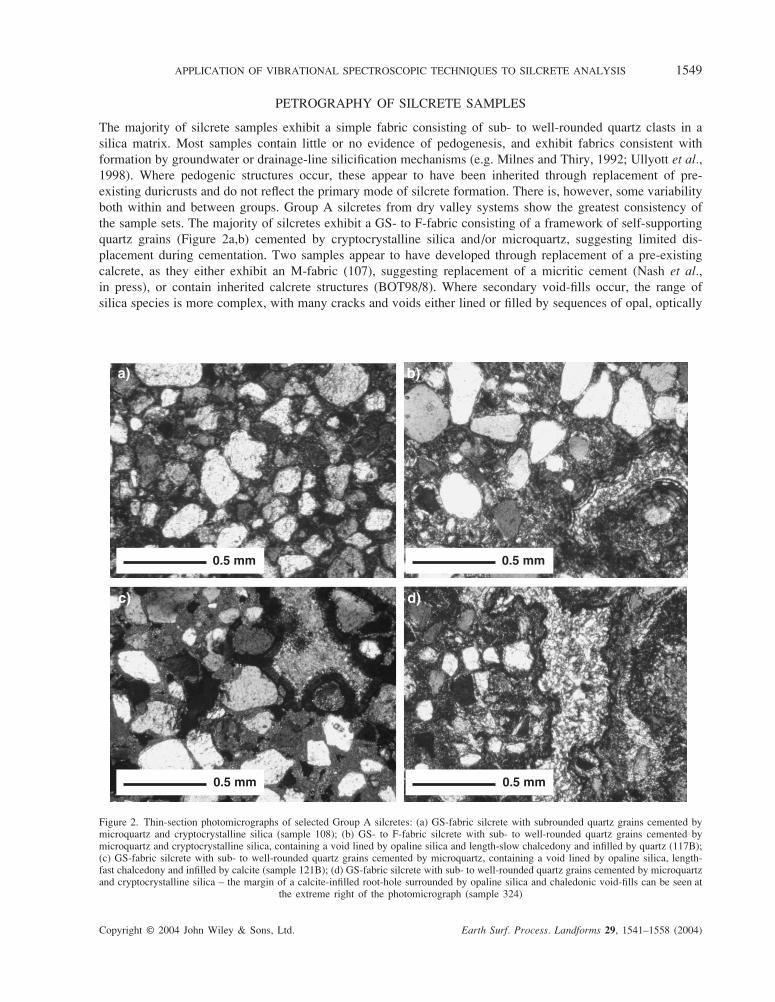
Figure 2. Thin-section photomicrographs of selected Group A silcretes: (a) GS-fabric silcrete with subrounded quartz grains cemented bymicroquartz and cryptocrystalline silica (sample 108); (b) GS- to F-fabric silcrete with sub- to well-rounded quartz grains cemented bymicroquartz and cryptocrystalline silica, containing a void lined by opaline silica and length-slow chalcedony and infilled by quartz (117B);(c) GS-fabric silcrete with sub- to well-rounded quartz grains cemented by microquartz, containing a void lined by opaline silica, length-fast chalcedony and infilled by calcite (sample 121B); (d) GS-fabric silcrete with sub- to well-rounded quartz grains cemented by microquartzand cryptocrystalline silica – the margin of a calcite-infilled root-hole surrounded by opaline silica and chaledonic void-fills can be seen at
the extreme right of the photomicrograph (sample 324)
PETROGRAPHY OF SILCRETE SAMPLES
The majority of silcrete samples exhibit a simple fabric consisting of sub- to well-rounded quartz clasts in a
silica matrix. Most samples contain little or no evidence of pedogenesis, and exhibit fabrics consistent with
formation by groundwater or drainage-line silicification mechanisms (e.g. Milnes and Thiry, 1992; Ullyott et al.,
1998). Where pedogenic structures occur, these appear to have been inherited through replacement of pre-
existing duricrusts and do not reflect the primary mode of silcrete formation. There is, however, some variability
both within and between groups. Group A silcretes from dry valley systems show the greatest consistency of
the sample sets. The majority of silcretes exhibit a GS- to F-fabric consisting of a framework of self-supporting
quartz grains (Figure 2a,b) cemented by cryptocrystalline silica and/or microquartz, suggesting limited dis-
placement during cementation. Two samples appear to have developed through replacement of a pre-existing
calcrete, as they either exhibit an M-fabric (107), suggesting replacement of a micritic cement (Nash et al.,
in press), or contain inherited calcrete structures (BOT98/8). Where secondary void-fills occur, the range of
silica species is more complex, with many cracks and voids either lined or filled by sequences of opal, optically
1550 D. J. NASH AND L. HOPKINSON
Copyright © 2004 John Wiley & Sons, Ltd. Earth Surf. Process. Landforms 29, 1541–1558 (2004)
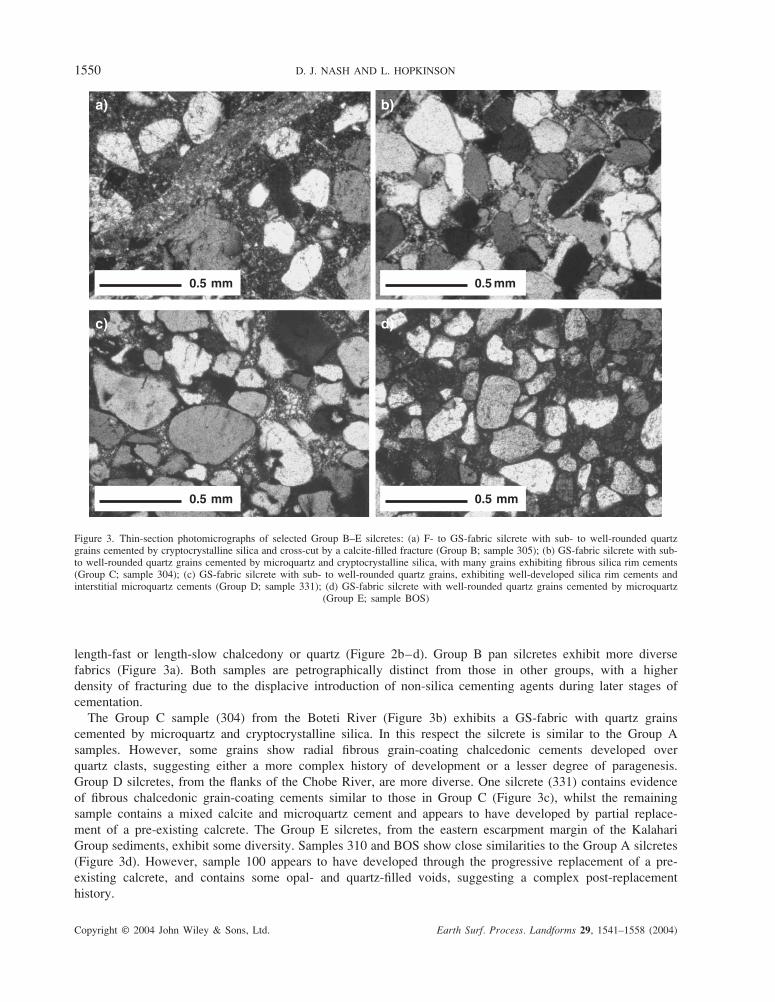
Figure 3. Thin-section photomicrographs of selected Group B–E silcretes: (a) F- to GS-fabric silcrete with sub- to well-rounded quartzgrains cemented by cryptocrystalline silica and cross-cut by a calcite-filled fracture (Group B; sample 305); (b) GS-fabric silcrete with sub-to well-rounded quartz grains cemented by microquartz and cryptocrystalline silica, with many grains exhibiting fibrous silica rim cements(Group C; sample 304); (c) GS-fabric silcrete with sub- to well-rounded quartz grains, exhibiting well-developed silica rim cements andinterstitial microquartz cements (Group D; sample 331); (d) GS-fabric silcrete with well-rounded quartz grains cemented by microquartz
(Group E; sample BOS)
length-fast or length-slow chalcedony or quartz (Figure 2b–d). Group B pan silcretes exhibit more diverse
fabrics (Figure 3a). Both samples are petrographically distinct from those in other groups, with a higher
density of fracturing due to the displacive introduction of non-silica cementing agents during later stages of
cementation.
The Group C sample (304) from the Boteti River (Figure 3b) exhibits a GS-fabric with quartz grains
cemented by microquartz and cryptocrystalline silica. In this respect the silcrete is similar to the Group A
samples. However, some grains show radial fibrous grain-coating chalcedonic cements developed over
quartz clasts, suggesting either a more complex history of development or a lesser degree of paragenesis.
Group D silcretes, from the flanks of the Chobe River, are more diverse. One silcrete (331) contains evidence
of fibrous chalcedonic grain-coating cements similar to those in Group C (Figure 3c), whilst the remaining
sample contains a mixed calcite and microquartz cement and appears to have developed by partial replace-
ment of a pre-existing calcrete. The Group E silcretes, from the eastern escarpment margin of the Kalahari
Group sediments, exhibit some diversity. Samples 310 and BOS show close similarities to the Group A silcretes
(Figure 3d). However, sample 100 appears to have developed through the progressive replacement of a pre-
existing calcrete, and contains some opal- and quartz-filled voids, suggesting a complex post-replacement
history.
APPLICATION OF VIBRATIONAL SPECTROSCOPIC TECHNIQUES TO SILCRETE ANALYSIS 1551
Copyright © 2004 John Wiley & Sons, Ltd. Earth Surf. Process. Landforms 29, 1541–1558 (2004)
RAMAN AND MID-INFRARED EXPERIMENTAL RESULTS
Group A silcretes ( from the floors or flanks of dry valleys)
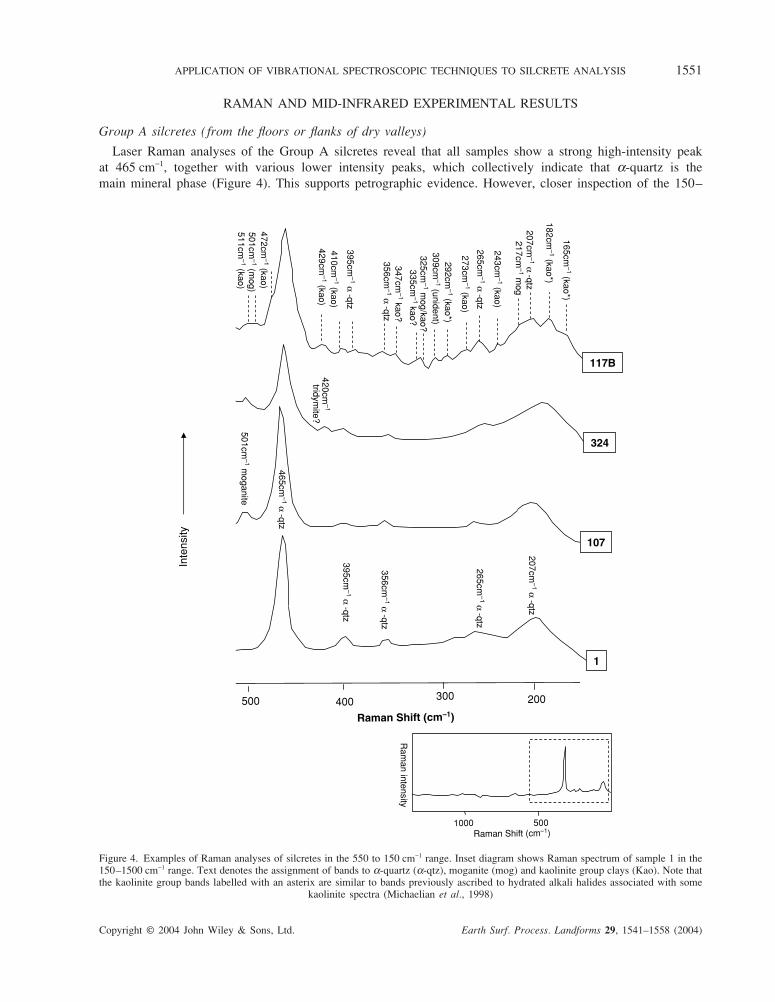
Laser Raman analyses of the Group A silcretes reveal that all samples show a strong high-intensity peak
at 465 cm−1, together with various lower intensity peaks, which collectively indicate that α-quartz is the
main mineral phase (Figure 4). This supports petrographic evidence. However, closer inspection of the 150–
Figure 4. Examples of Raman analyses of silcretes in the 550 to 150 cm−1 range. Inset diagram shows Raman spectrum of sample 1 in the150–1500 cm−1 range. Text denotes the assignment of bands to α-quartz (α-qtz), moganite (mog) and kaolinite group clays (Kao). Note thatthe kaolinite group bands labelled with an asterix are similar to bands previously ascribed to hydrated alkali halides associated with some
kaolinite spectra (Michaelian et al., 1998)
1552 D. J. NASH AND L. HOPKINSON
Copyright © 2004 John Wiley & Sons, Ltd. Earth Surf. Process. Landforms 29, 1541–1558 (2004)
550 cm−1 region reveals that only sample 1 shows exclusively Raman-active α-quartz bands. Raman spectra for
the remaining silcretes show an additional moganite-active peak centred at 501 cm−1, together with several
weaker low intensity peaks, superimposed on the α-quartz spectra (Figure 4). In all moganite-bearing samples,
the α-quartz active 465 cm−1 band is of greater intensity than the 501 cm−1 band, indicating the dominance of
α-quartz relative to moganite (Kingma and Hemley, 1994).
Raman spectra for samples BOT98/8, 108, 117B, 121B and 324 show significant numbers of weak peaks
between 150 cm−1 and 550 cm−1 which cannot be ascribed to quartz or any of the low temperature metastable
silica polymorphs. These include low intensity bands superimposed on the shoulders of the 207 cm−1 α-quartz
A1 peak. In sample 117B, these bands are accompanied by numerous others (e.g. at 429 cm−1 and 472 cm−1)
which closely correspond to the Raman-active spectra for kaolinite group clays (Frost et al., 1997; Michaelian
et al., 1998) (Figure 4). Kaolinite has been documented previously within Kalahari Group sediments (e.g.
McCarthy et al., 1991), but is not optically resolvable within the sampled silcretes. It is likely that clay minerals
are incorporated into the Fe-rich rims coating some mineral grains (e.g. sample 117B) or are dispersed as a result
of clay replacement during silicification. Comparison of the relative abundance and intensities of the Raman-
active clay bands for these samples suggests a variable clay content, in the order: 117B > BOT98/8 ≥ 121B >108 ≥ 324. Unambiguous detection of opaline phases within the clay-bearing samples using Raman data is
prohibited due to the overlap between diagnostic opaline bands and kaolinite bands within the range 400 to
430 cm−1 (Figure 4).
The Raman results for the Group A silcretes are supported by analyses of mid-infrared spectra. These show
that, in addition to displaying a complete set of Raman-active α-quartz bands, sample 1 also exhibits the full
suite of complementary infrared-active A2 and E-mode bands associated with α-quartz (Table I, Figure 5). This
indicates that sample 1 consists entirely of quartz. The clay-bearing samples noted above show a variably
resolved shoulder on the quartz 1072 cm−1 band, centred around 1000 cm−1, consistent with the presence of a
range of possible kaolinite minerals, smectites, micas and/or chlorites. Analysis of the mid-infrared spectrum of
sample 117B, in particular, indicates that the shoulder is produced by the superposition of two bands upon the
α-quartz spectrum (between 1040 cm−1 and 990 cm−1), compatible with Raman findings for the presence of
kaolinite group clays.
Raman and mid-infrared analyses of the remaining Group A sample (107) indicate the apparent absence of
clays. Comparison of the mid-infrared spectrum of this silcrete with that of sample 1 indicates a loss of
resolution of the 1072 cm−1 and 1082 cm−1 bands, combined with a slight shift to lower wave numbers of the
broad absorbance to c. 1060 cm−1. This is consistent with sample 107 containing admixtures of disordered
microcrystalline or non-crystalline SiO2 in association with quartz (Graetsch et al., 1994). A second set of
infrared analyses in the 600 to 650 cm−1 region failed to reveal a band at 620 cm−1, which suggests that, if opaline
silica phase(s) are present within the sample, they are most likely opal-CT or opal-T (Graetsch et al., 1994).
Inspections of the OH vibration region of the infrared spectra (from c. 3100 cm−1 to 3700 cm−1) for the Group
A silcretes reveal considerable sample-dependent variation in hydrogen concentration, speciation and abundance
(Figure 6). Sample 1 shows very limited broad band absorbance in the OH region, with a small shoulder located
at 3600 cm−1, suggesting that the sample contains a dominant low temperature type B signature. Sample 107
shows strong absorbance in the OH region centred around c. 3400 cm−1 (indicating the presence of hydrogen-
bonded H2O), with a broad shoulder at c. 3320 cm−1 (suggesting OH stretch); no evidence for silanols was
detected. The data are consistent with the presence of opals and associated single quartz crystals within the
silcrete (e.g. Graetsch, 1994). Sample 117B shows a variably defined peak at c. 3676 cm−1 superimposed upon
broad band absorption in the OH region. Similar spectra have previously been reported for some kaolinite group
clays (van der Marel and Beutelspacher, 1976).
Group B silcretes ( from the floors of pans or ephemeral lakes)
Sample 305 exhibits a Raman spectrum dominated by the characteristic α-quartz lines previously noted within
the Group A silcretes. Superimposed upon this are bands indicative of abundant kaolinite group clays, with an
additional low intensity peak at 501 cm−1 suggesting the presence of moganite. The mid-infrared spectrum of the
sample verifies these findings. This is mostly in keeping with petrographic evidence although, again, the clay
minerals identified by Raman/FT-IR are not resolvable in thin-section. Raman analysis of sample 306 was
APPLICATION OF VIBRATIONAL SPECTROSCOPIC TECHNIQUES TO SILCRETE ANALYSIS 1553
Copyright © 2004 John Wiley & Sons, Ltd. Earth Surf. Process. Landforms 29, 1541–1558 (2004)
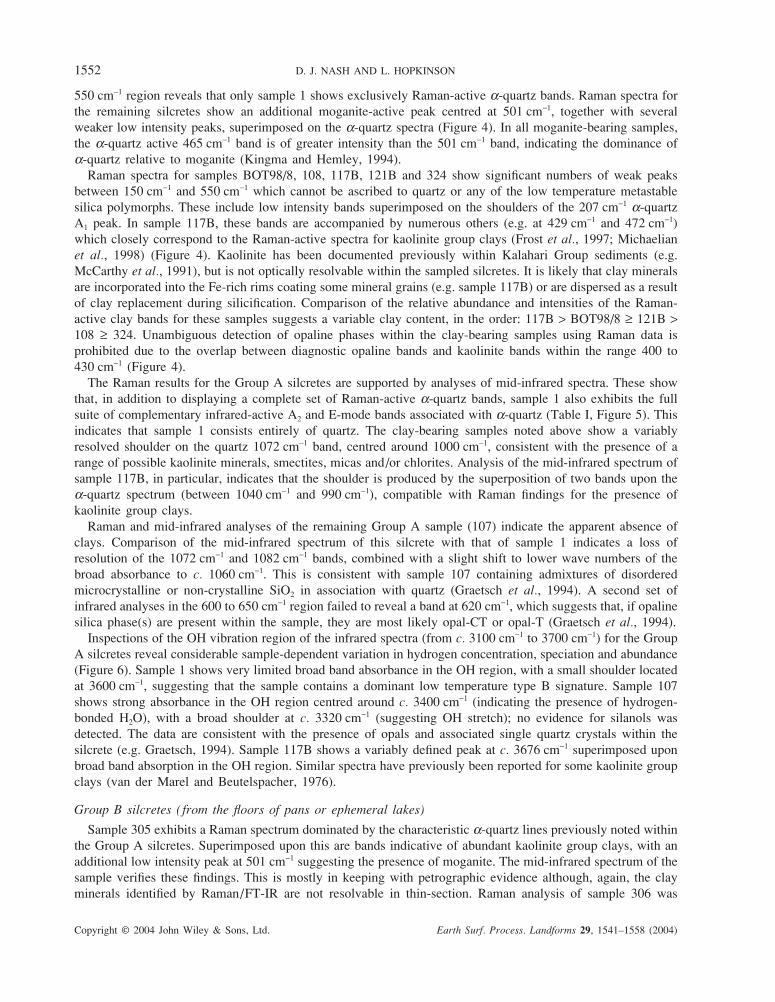
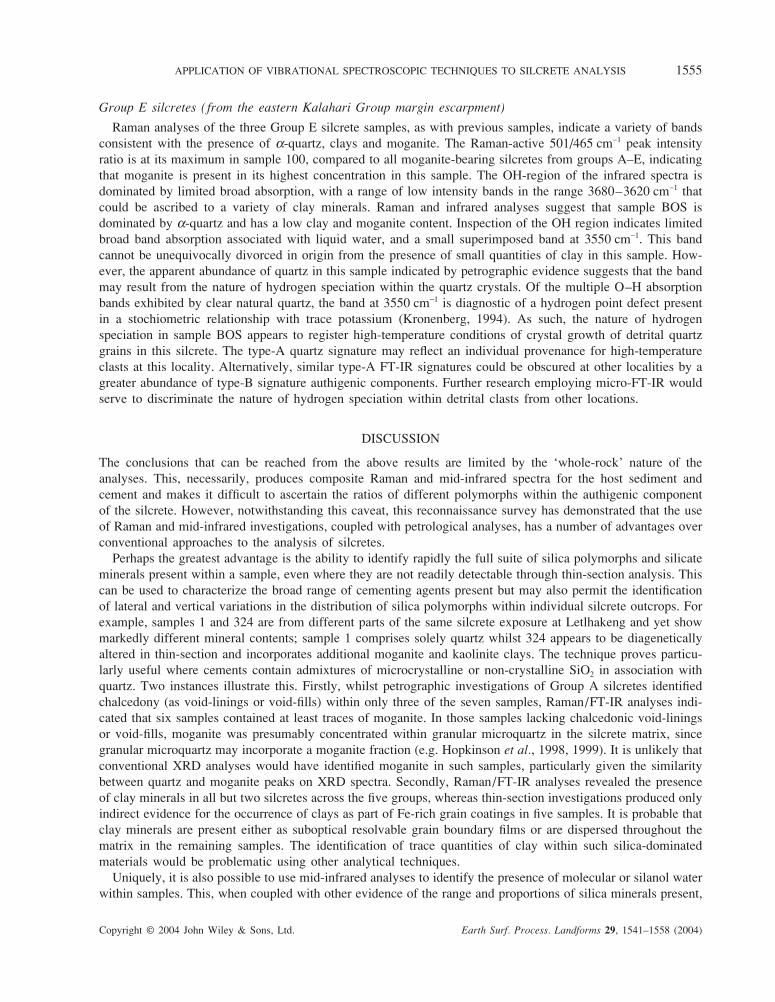
Figure 5. Examples of FT-IR spectra of silcretes in the 1500–500 cm−1 lattice vibration region. Text denotes assignment of bands toα-quartz (α-qtz) and unidentified clay-related bands in the 1050–981 cm−1 region (see text for details)
prohibited by the rapidity of beam damage. However, FT-IR analysis indicates an apparent absence of clays, and
instead of showing two clear absorbance bands at 1072 cm−1 and 1082 cm−1 characteristic of α-quartz, a single
broad absorbance band centred around 1055 cm−1 is evident (Figure 5). This is in keeping with the presence of
abundant disordered microcrystalline and/or amorphous SiO2 phase(s) within the sample, as suggested from thin-
section analyses. No evidence for absorbance at 620 cm−1 was found, suggesting that any crystalline opals present
are most likely opal-CT or opal-T (Graetsch et al., 1994). Inspection of the OH region of the infrared spectrum
1554 D. J. NASH AND L. HOPKINSON
Copyright © 2004 John Wiley & Sons, Ltd. Earth Surf. Process. Landforms 29, 1541–1558 (2004)
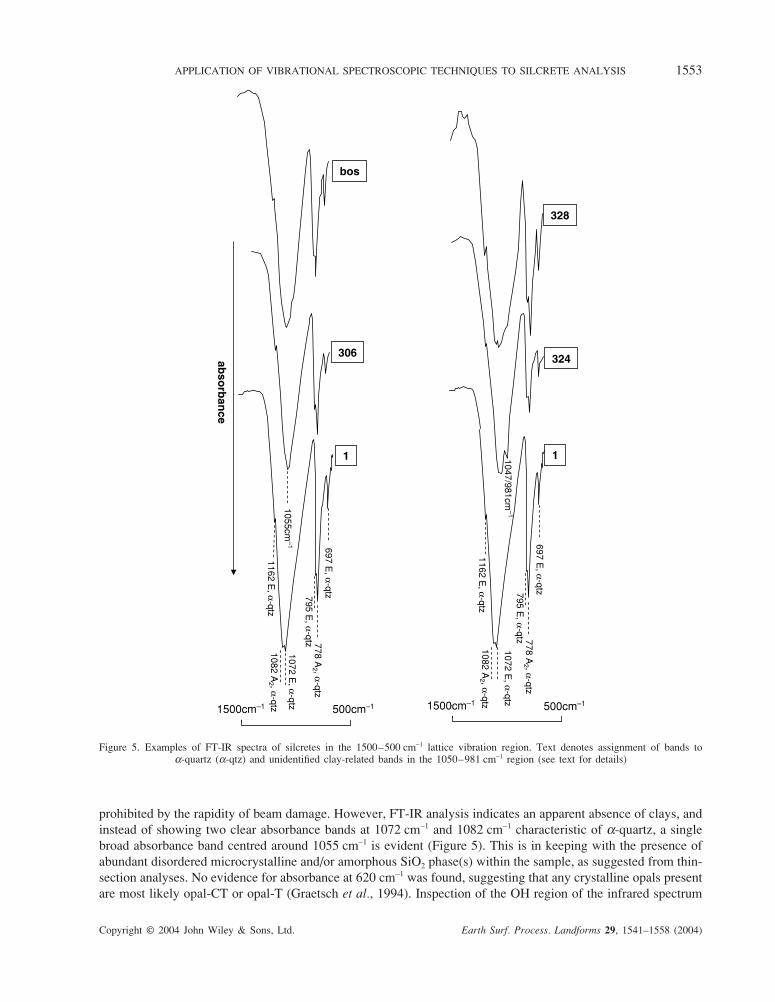
Figure 6. Examples of FT-IR spectra in the OH-region for various silcretes. The potential significance of the various bands/shoulders whichare superimposed on the broad band absorption are discussed in the text
indicates strong absorbance centred around c. 3400 cm−1 with a broad shoulder at c. 3320 cm−1 (Figure 6).
Furthermore, there is no evidence for silanol-bound hydrogen (e.g. Kronenberg, 1994). As such, the mid-infrared
data in the OH and lattice vibration regions are consistent with a silcrete cemented by abundant poorly crys-
talline opal-CT or opal-T and containing relatively high amounts of molecular water. Of all the samples analysed
across the five groups, sample 306 is by far the least mature in terms of silica mineralogy.
Group C silcretes ( from the floor of an ephemeral channel)
Laser Raman analysis of sample 304 reveals the presence of Raman-active lines of α-quartz, as described for
the Group A samples, together with a low intensity peak at 501 cm−1 suggesting a minor moganite content. This
is broadly consistent with petrographic evidence. An asymmetric shoulder in the FT-IR spectrum centred around
c. 990 cm−1, together with weak shoulders on the Raman-active 207 cm−1 A1 α-quartz line, are consistent with
the presence of trace clays. Inspection of the OH-region of the mid-infrared spectrum shows limited broad band
absorption, and a very weak band at 3676 cm−1, which most likely reflects the presence of clays. Again, clay
minerals are not widely evident in thin-sections other than in localized Fe-rich grain coatings, although it is
possible that clays are present as suboptical resolvable grain boundary films. Given the occurrence of fibrous
silica rim cements on many quartz clasts it is more likely that most precursor clays minerals were replaced
during silicification.
Group D silcretes ( from the flanks of contemporary channels)
Raman/FT-IR analyses of the two Group D silcretes show spectra dominated by the superposition of α-quartz
and minor quantities of clays (Figure 5). The Raman-active 501 cm−1 band, indicative of moganite, is present
in the spectrum for sample 328, which developed through the replacement of a pre-existing calcrete, but not in
sample 331. No Raman-active lines associated with opaline phases were detected for either sample. Furthermore,
the infrared-active 1072 cm−1 and 1082 cm−1 A2 and E-mode peaks associated with α-quartz are prominent,
suggesting low concentrations of disordered microcrystalline silica phase(s). The OH region of the mid-infrared
spectra is dominated by limited broad absorption, with a weak peak centred at 3620 cm−1, which could be
ascribed to a range of clay minerals (van der Marel and Beutelspacher, 1976). These results are largely support-
ive of petrographic data, although the lack of moganite in sample 331 is unexpected given the occurrence of
fibrous chalcedonic rim cements identified in thin-section.
APPLICATION OF VIBRATIONAL SPECTROSCOPIC TECHNIQUES TO SILCRETE ANALYSIS 1555
Copyright © 2004 John Wiley & Sons, Ltd. Earth Surf. Process. Landforms 29, 1541–1558 (2004)
Group E silcretes ( from the eastern Kalahari Group margin escarpment)
Raman analyses of the three Group E silcrete samples, as with previous samples, indicate a variety of bands
consistent with the presence of α-quartz, clays and moganite. The Raman-active 501/465 cm−1 peak intensity
ratio is at its maximum in sample 100, compared to all moganite-bearing silcretes from groups A–E, indicating
that moganite is present in its highest concentration in this sample. The OH-region of the infrared spectra is
dominated by limited broad absorption, with a range of low intensity bands in the range 3680–3620 cm−1 that
could be ascribed to a variety of clay minerals. Raman and infrared analyses suggest that sample BOS is
dominated by α-quartz and has a low clay and moganite content. Inspection of the OH region indicates limited
broad band absorption associated with liquid water, and a small superimposed band at 3550 cm−1. This band
cannot be unequivocally divorced in origin from the presence of small quantities of clay in this sample. How-
ever, the apparent abundance of quartz in this sample indicated by petrographic evidence suggests that the band
may result from the nature of hydrogen speciation within the quartz crystals. Of the multiple O–H absorption
bands exhibited by clear natural quartz, the band at 3550 cm−1 is diagnostic of a hydrogen point defect present
in a stochiometric relationship with trace potassium (Kronenberg, 1994). As such, the nature of hydrogen
speciation in sample BOS appears to register high-temperature conditions of crystal growth of detrital quartz
grains in this silcrete. The type-A quartz signature may reflect an individual provenance for high-temperature
clasts at this locality. Alternatively, similar type-A FT-IR signatures could be obscured at other localities by a
greater abundance of type-B signature authigenic components. Further research employing micro-FT-IR would
serve to discriminate the nature of hydrogen speciation within detrital clasts from other locations.
DISCUSSION
The conclusions that can be reached from the above results are limited by the ‘whole-rock’ nature of the
analyses. This, necessarily, produces composite Raman and mid-infrared spectra for the host sediment and
cement and makes it difficult to ascertain the ratios of different polymorphs within the authigenic component
of the silcrete. However, notwithstanding this caveat, this reconnaissance survey has demonstrated that the use
of Raman and mid-infrared investigations, coupled with petrological analyses, has a number of advantages over
conventional approaches to the analysis of silcretes.
Perhaps the greatest advantage is the ability to identify rapidly the full suite of silica polymorphs and silicate
minerals present within a sample, even where they are not readily detectable through thin-section analysis. This
can be used to characterize the broad range of cementing agents present but may also permit the identification
of lateral and vertical variations in the distribution of silica polymorphs within individual silcrete outcrops. For
example, samples 1 and 324 are from different parts of the same silcrete exposure at Letlhakeng and yet show
markedly different mineral contents; sample 1 comprises solely quartz whilst 324 appears to be diagenetically
altered in thin-section and incorporates additional moganite and kaolinite clays. The technique proves particu-
larly useful where cements contain admixtures of microcrystalline or non-crystalline SiO2 in association with
quartz. Two instances illustrate this. Firstly, whilst petrographic investigations of Group A silcretes identified
chalcedony (as void-linings or void-fills) within only three of the seven samples, Raman/FT-IR analyses indi-
cated that six samples contained at least traces of moganite. In those samples lacking chalcedonic void-linings
or void-fills, moganite was presumably concentrated within granular microquartz in the silcrete matrix, since
granular microquartz may incorporate a moganite fraction (e.g. Hopkinson et al., 1998, 1999). It is unlikely that
conventional XRD analyses would have identified moganite in such samples, particularly given the similarity
between quartz and moganite peaks on XRD spectra. Secondly, Raman/FT-IR analyses revealed the presence
of clay minerals in all but two silcretes across the five groups, whereas thin-section investigations produced only
indirect evidence for the occurrence of clays as part of Fe-rich grain coatings in five samples. It is probable that
clay minerals are present either as suboptical resolvable grain boundary films or are dispersed throughout the
matrix in the remaining samples. The identification of trace quantities of clay within such silica-dominated
materials would be problematic using other analytical techniques.
Uniquely, it is also possible to use mid-infrared analyses to identify the presence of molecular or silanol water
within samples. This, when coupled with other evidence of the range and proportions of silica minerals present,
1556 D. J. NASH AND L. HOPKINSON
Copyright © 2004 John Wiley & Sons, Ltd. Earth Surf. Process. Landforms 29, 1541–1558 (2004)
may be used to identify relatively recently formed silcretes. This is clearly illustrated by Raman/FT-IR analyses
of the silica component of the laminated silcrete–calcrete intergrade duricrust sample from the margin of Sua
Pit on Sua Pan (sample 306). Results for this sample indicated that the silcrete contained abundant opal-CT or
opal-T and high amounts of molecular water, suggesting relative immaturity. This independently derived result
supports the proposition made by Shaw et al. (1991) that these duricrusts are either forming contemporaneously
or developed in the recent past. It also suggests that the silcretes are less mature than those sampled from
elsewhere on the surface of Sua Pan (sample 305). This is surprising given their similar geomorphic setting, but
may simply reflect spatial variations in the extent of silica polymerization within antecedent solutions at or near
the pan surface.
Although less significant in terms of understanding silcrete genesis, Raman/FT-IR analyses may also be used
to identify the provenance of detrital grains within individual samples, specifically through the analysis of the
nature of hydrogen speciation. This has been illustrated within silcrete sample BOS which appears to incorporate
high-temperature type-A quartz grains. Furthermore, given that sample 1 shows a type-B signature and is
petrographically similar to sample BOS (specifically in terms of the relative proportions of detrital grains to
matrix) it is possible that quartz clasts of more than one provenance are identified in this study.
Combined Raman/FT-IR and petrographic investigations additionally provide the potential to identify evid-
ence of silica paragenesis within silcrete samples. This is exemplified by the results for samples 100 and 331.
Sample 100 is a complex F-fabric silcrete collected from an outcrop along the escarpment margin of the Kalahari
Group sediments in eastern Botswana. Thin-section analysis of this sample clearly identified the presence of
laminated opaline silica within void-linings throughout the silcrete (Table III), and yet Raman/FT-IR investiga-
tions revealed only the occurrence of quartz and moganite. The inference from these results is that the opaline
silica lining voids has transformed over time to chalcedony or microquartz. Similarly, thin-section investigations
of sample 331, a comparatively old GS-fabric silcrete from a flank of the Chobe River, indicated the presence
of fibrous chalcedonic rim cements. However, Raman analysis suggested an apparent absence or paucity of
moganite. Given the high solubility of moganite relative to quartz (Heaney, 1993; Dove and Rimstidt, 1994) it
is possible that this reflects progressive diagenetic transformation of the cement with time. This type of evidence
has potential use as a method for establishing the relative ages and degree of maturation of silcretes in compara-
tive geomorphological settings. However, as noted above, it must be remembered that the sequence and rate of
silica paragenesis is dependent upon a range of other environmental factors in addition to time.
Finally, whilst this survey has yielded interesting data about the composition and history of selected Kalahari
silcretes, perhaps the greatest potential for vibrational spectroscopy will come through the microscale application
of micro-Raman and mid-infrared techniques. Taken as a whole, the Raman/FT-IR analyses presented here
suggest, with notable exceptions, a broad similarity in the range and variety of silica species within Kalahari
silcretes. This may be taken to imply a uniformity in the environments of silcrete formation represented, with
silicification most probably occurring under semi-arid conditions. However, the composite spectra also provide
tantalizing evidence, for example, of the presence of high ratios of moganite to quartz within some silcretes. In
the case of sample 100, now exposed as part of a silcrete escarpment, moganite levels may be sufficiently high
to suggest formation under a strongly evaporitic regime, and, therefore, implicate either climate change or relief
inversion since formation. However, it is not possible on the basis of the ‘whole-rock’ analyses discussed here
to identify whether the high moganite to quartz ratios within the silcrete indicate elevated levels of authigenic
moganite or simply reflect a high ratio of cement to host grains. In the future, microscale investigations of the
types and relative quantities of silica polymorphs within silcrete cements, void-linings and void-fills could be
used to provide key information about the environment of silcrete formation. Such data have, to date, been
significantly lacking from silcrete studies.
CONCLUSION
This paper has demonstrated, using examples from a range of environmental settings across the Kalahari Desert,
how Raman/FT-IR coupled with petrological analyses can be employed in the analysis of silcretes. The tech-
niques have proven particularly effective in establishing the range of silica polymorphs present in samples, even
in those silcretes which appear from thin-section to be cemented by admixtures of relatively uniform poorly
APPLICATION OF VIBRATIONAL SPECTROSCOPIC TECHNIQUES TO SILCRETE ANALYSIS 1557
Copyright © 2004 John Wiley & Sons, Ltd. Earth Surf. Process. Landforms 29, 1541–1558 (2004)
crystalline silica. It has also permitted the presence of clay minerals to be identified within silcretes in which
clays are not readily resolvable from petrographic analyses. The application of Raman/FT-IR may allow the
maturity of silcrete cements to be established, and appears to be especially effective for highlighting relatively
young materials which may incorporate larger quantities of molecular water into their cement and contain less
mature silica polymorphs. Combined analyses of thin-sections and Raman/FT-IR spectra further allow evidence
of silica paragenesis within samples to be rapidly identified, through the simple comparison of the range of silica
polymorphs identified in thin-section with those characterized by vibrational spectroscopy. Finally, the method
also has potential use as a tool for establishing the provenance of quartz clasts within silcrete host sediments.
The ‘whole-rock’ approach used in this study introduces some difficulties, but refinement of the technique
through the use of micro-Raman and micro-FT-IR, may, in future, allow both the environments and histories
of development of individual silcrete profiles to be established.
ACKNOWLEDGEMENTS
Samples for this paper were collected during fieldwork between 1989 and 1998 funded and otherwise supported
by a variety of sources. Foremost amongst these were Barclays Bank plc, the University of Brighton, British
Airways plc, the Explorer’s Club (New York), Gilchrist Educational Trust, Manchester Geographical Society,
Palmer’s College Trust, the Royal Society, the Royal Geographical Society, Tate & Lyle plc and the University
of Sheffield. Fieldwork was undertaken with a variety of colleagues including Sue McLaren, Paul Shaw and
David Thomas. Assistance with laboratory work and sample preparation was provided by Ken Rutt, John Bollard
and Jim Robertson (University of Brighton).
REFERENCES
Aines RD, Kirby SH, Rossman GR. 1984. Hydrogen speciation in synthetic quartz. Physics and Chemistry of Minerals 11: 204–212.Bustillo MA, Bustillo M. 2000. Miocene silcretes in argillaceous playa deposits, Madrid Basin, Spain: petrological and geochemical features.
Sedimentology 47: 1023–1037.Chadwick OA, Hendricks DM, Nettleton WD. 1989. Silicification of Holocene soils in Northern Monitor Valley, Nevada. Soil Science
Society of America Journal 53: 158–164.Dean KJ, Sherman WF, Wilkinson GR. 1982. Temperature and pressure dependence of Raman active modes of vibration of α-quartz.
Spectrochimica Acta 38A: 1105–1108.Dove PM, Rimstidt JD. 1994. Silica-water interactions. In Silica: Physical Behaviour, Geochemistry and Materials Applications, Heaney
PJ, Prewitt CT, Gibbs GV (eds). Reviews in Mineralogy 29. Mineralogical Society of America: Washington; 259–308.Etchepare J, Merian M, Smetankine L. 1974. Vibrational normal modes of SiO2. I. α and β quartz. Journal of Chemical Physics 60: 1873–
1876.Etchepare J, Merian M, Kaplan P. 1978. Vibrational normal modes of SiO2. II. Cristobalite and tridymite. Journal of Chemical Physics 68:
1531–1537.Flörke OW, Jones JB, Schmincke HU. 1976. A new microcrystalline silica from Gran Canaria. Zeitschrift für Kristallographie 143: 156–
165.Flörke OW, Flörke U, Giese U. 1984. Moganite: a new microcrystalline silica-mineral. Neues Jahrbuch für Mineralogie, Abhandlungen 149:
325–226.Flörke OW, Graetsch B, Martin B, Röller K, Wirth R. 1991. Nomenclature of micro- and non-crystalline silica minerals, based on structure
and microstructure. Neues Jahrbuch für Mineralogie, Abhandlungen 163: 19–42.Folk RL, Pittman JS. 1971. Length-slow chalcedony: a new testament for vanished evaporites. Journal of Sedimentary Petrology 41: 1045–
1058.Frondel C. 1982. Structural Hydroxyl in Chalcedony (7th edition), Volume III. Wiley: New York.Frost RL, Tran TH, Kristof J. 1997. FT-Raman spectroscopy of the lattice region of kaolinite and its intercalates. Vibrational Spectroscopy
13: 175–186.Graetsch H. 1994. Structural characteristics of opaline and microcrystalline silica minerals. In Silica: Physical Behaviour, Geochemistry and
Materials Applications, Heaney PJ, Prewitt CT, Gibbs GV (eds). Reviews in Mineralogy 29. Mineralogical Society of America: Wash-ington; 209–232.
Graetsch H, Gies H, Topaloviæ I. 1994. NMR, XRD and IR study of microcrystalline opals. Physics and Chemistry of Minerals 21: 166–175.
Heaney PJ. 1993. A proposed mechanism for the growth of chalcedony. Contributions to Mineralogy and Petrology 115: 66–74.Heaney PJ. 1995. Moganite as an indicator for vanished evaporites: a testament reborn? Journal of Sedimentary Research A65: 633–
638.Heaney PJ, Post JE. 1992. The widespread distribution of a novel silica polymorph in microcrystalline quartz varieties. Science 255: 441–
443.Hopkinson L, Roberts S, Herrington R, Wilkinson J. 1998. Self-organisation of submarine hydrothermal siliceous deposits: evidence from
the TAG hydrothermal mound, 26 °N Mid-Atlantic Ridge. Geology 26: 347–350.
1558 D. J. NASH AND L. HOPKINSON
Copyright © 2004 John Wiley & Sons, Ltd. Earth Surf. Process. Landforms 29, 1541–1558 (2004)
Hopkinson L, Roberts S, Herrington R, Wilkinson J. 1999. The nature of crystalline silica from the TAG submarine hydrothermal mound,26 °N Mid Atlantic Ridge. Contributions in Mineralogy and Petrology 137: 342–350.
Iler R. 1979. The Chemistry of Silica. Wiley: New York.Kastner M. 1980. Length-slow chalcedony: the end of the new testament (abstract). EOS 61: 399.Kingma KJ, Hemley PJ. 1994. Raman spectroscopic study of microcrystalline silica. American Mineralogist 79: 269–273.Knauth LP. 1994. Petrogenesis of chert. In Silica: Physical Behaviour, Geochemistry and Materials Applications, Heaney PJ, Prewitt CT,
Gibbs GV (eds). Reviews in Mineralogy 29. Mineralogical Society of America: Washington; 233–258.Kronenberg H. 1994. H-speciation and chemical weakening of quartz. In Silica: Physical Behaviour, Geochemistry and Materials Appli-
cations, Heaney PJ, Prewitt CT, Gibbs GV (eds). Reviews in Mineralogy 29. Mineralogical Society of America: Washington; 123–176.Langer K, Flörke OW. 1974. Near infrared absorption spectra (4000–9000 cm−1) of opals and the role of water in these SiO2.nH2O minerals.
Fortschritte der Mineralogie 52: 17–51.McCarthy TS, McIver JR, Verhagen BT. 1991. Groundwater evolution, chemical sedimentation and carbonate brine formation on an island
in the Okavango Delta swamp, Botswana. Applied Geochemistry 6: 577–595.Mallick DIJ, Habgood F, Skinner AC. 1981. A Geological Interpretation of Landsat Imagery and Air Photography of Botswana. Institute
of Geological Sciences, Overseas Geology and Mineral Resources 56. HMSO: London.Michaelian KH, Zhang SL, Yariv S, Lapides I. 1998. Low-frequency Raman spectra of kaolinite/alkali halide complexes. Applied Clay
Science 13: 233–243.Miehe G, Graetsch H. 1992. Crystal structure of moganite: a new structure type for silica. European Journal of Mineralogy 4: 693–706.Millot G. 1960. Silice, silex, silicifications et croissance des cristaux. Bulletin de Service Carte Geologique, Alsace Lorraine 13: 129–146.Millot G. 1970. Geology of Clays: Weathering, Sedimentology, Geochemistry (translated by Farrand, WR, Paquet, H). Springer-Verlag: New
York.Milnes AR, Thiry M. 1992. Silcretes. In Weathering, Soils and Paleosols, Martini IP, Chesworth W (eds). Developments in Earth Surface
Processes 2. Elsevier: Amsterdam; 349–377.Morris BA, Fletcher IA. 1987. Increased solubility of quartz following ferrous-ferric iron reactions. Nature 330: 558–561.Nash DJ. 1992. The development and environmental significance of the dry valley systems (mekgacha) in the Kalahari, central southern
Africa. PhD Thesis, University of Sheffield.Nash DJ, Shaw PA. 1998. Silica and carbonate relationships in silcrete-calcrete intergrade duricrusts from the Kalahari of Botswana and
Namibia. Journal of African Earth Sciences 27: 11–25.Nash DJ, Thomas DSG, Shaw PA. 1994a. Siliceous duricrusts as palaeoclimatic indicators: evidence from the Kalahari Desert of Botswana.
Palaeogeography, Palaeoclimatology, Palaeoecology 112: 279–295.Nash DJ, Shaw PA, Thomas DSG. 1994b. Duricrust development and valley evolution: process-landform links in the Kalahari. Earth
Surface Processes and Landforms 19: 299–317.Nash DJ, Shaw PA, Ullyott JS. 1998. Drainage-line silcretes of the Middle Kalahari – an analogue for Cenozoic sarsen trains? Proceedings
of the Geologists’ Association 109: 241–254.Nash DJ, McLaren SJ, Webb JA. 2004. Petrology, geochemistry and environmental significance of silcrete-calcrete intergrade duricrusts at
Kang Pan and Tswaane, central Kalahari, Botswana. Earth Surface Processes and Landforms. 29: 1559–1586; this issue. DOI: 10.1002/esp.1138
Pain CF, Ollier CD. 1995. Inversion of relief – a component of landscape evolution. Geomorphology 12: 151–165.Roberts S, Beattie IR. 1995. Micro-Raman spectroscopy in the Earth Sciences. In Micro-analytical Techniques in the Earth Sciences, Potts
PJ, Bowles JFW, Reed SJB, Cave MR (eds). Mineralogical Society Series No. 6. Chapman and Hall: London; 387–406.Shaw PA, de Vries JJ. 1988. Duricrust, groundwater and valley development in the Kalahari of south-east Botswana. Journal of Arid
Environments 14: 245–254.Shaw PA, Nash DJ. 1998. Dual mechanisms for the formation of fluvial silcretes in the distal reaches of the Okavango Delta Fan, Botswana.
Earth Surface Processes and Landforms 23: 705–714.Shaw PA, Cooke HJ, Perry CC 1991. Microbialitic silcretes in highly alkaline environments: some observations from Sua Pan, Botswana.
South African Journal of Geology 93: 803–808.Summerfield MA. 1982. Distribution, nature and genesis of silcrete in arid and semi-arid southern Africa. Catena, Supplement 1: 37–65.Summerfield MA. 1983. Silcrete. In Chemical Sediments and Geomorphology, Goudie AS, Pye K (eds). Academic Press: London; 59–91.Thiry M, Millot G. 1987. Mineralogical forms of silica and their sequence of formation in silcretes. Journal of Sedimentary Petrology 57:
343–352.Thomas DSG, Shaw PA. 1991. The Kalahari Environment. Cambridge University Press: Cambridge.Ullyott JS, Nash DJ, Shaw PA. 1998. Recent advances in silcrete research and their implications for the origin and palaeoenvironmental
significance of sarsens. Proceedings of the Geologists’ Association 109: 255–270.Van der Marel HW, Beutelspacher H. 1976. Atlas of Infrared Spectroscopy of Clay Minerals and their Admixtures. Elsevier Scientific: New
York.Williams LA, Parks GA, Crerar DA. 1985. Silica diagenesis, I. Solubility controls. Journal of Sedimentary Petrology 55: 301–311.