Embed Size (px)
Citation preview
A reliability study of a Deepwater Vertical Xmas Tree with attention to XT retrieval rate
Oda Ingeborg Stendebakken
Marine Technology
Supervisor: Jan Erik Vinnem, IMTCo-supervisor: Endre Willmann, GE Oil & Gas
Department of Marine Technology
Submission date: June 2014
Norwegian University of Science and Technology

i
Faculty of Engineering Science and Technology Department of Marine Technology
MASTER THESIS 2014
for
M.Sc. student Oda I. Giske Stendebakken
Department of Marine Technology
RELIABILITY STUDY OF A DEEPWATER VERTICAL XMAS TREE WITH ATTENTION TO XMAS TREE RETRIEVAL RATE
Pålitelighetsstudie av dypvannsvertikalt tre med fokus på trekkerate av treet
Thousands of subsea Xmas trees have been installed since first introduced subsea in the 1950’s. Now, there are a number of subsea tree variations, including vertical, horizontal, dual bore, mono bore, TFL (Through Flow Line), drill-thru horizontal, vertical with tubing head spool, mudline vertical and mudline horizontal trees.
The primary function is control of flow, usually hydrocarbons from the well, but also injection of gas or water to maintain reservoir pressure, or injection of lift gas to assist the flow of hydrocarbons. A tree often provides numerous additional functions including chemical injection, monitoring (such as valve positions, pressure, temperature, corrosion, erosion, sand detection, flow rate, flow composition, etc.) and well intervention means. Tree complexity and functionality has increased over the last few decades.
In relation to subsea development projects, reliability and availability performance targets are normally part of the contractual requirements. As a general requirement, the subsea contractors are also responsible for optimizing the system design, in a life cycle perspective, taking account of various aspects including production availability, installation/intervention risks as well as ability to support reservoir management operations.
In order to optimize the tree system design/configuration with respect to reliability and availability performance, there is a need for proper reliability models that are able to differentiate between different options and variants.
ii
There are two main approaches to predicting the reliability of subsea Xmas trees:
1. Bottom-up: Reliability modeling of system, component by component, using component reliability data available in industry recognized sources such as the OREDA Handbooks.
2. Top-down: High-level reliability data for systems, captured from actual field experience/operations, typically reflecting the reliability performance as seen from the operators point of view.
The two approaches results in totally different results. For instance, an attempt to model a conventional tree using component data from OREDA may typically predict an “Xmas tree retrieval rate” in the order of once per 15-20 Xmas tree years, as opposed to once per 150-200 years expected or experienced by the operators/customers.
The idea is to use actual in-field performance data to calibrate the ‘bottom-up models’, such that the top-level predictions are in accordance with field experience. Although GE Oil & Gas have a good understanding of the overall reliability and availability performance as seen from the customers, they do not really have a well-documented understanding of actual field experience for their Xmas trees (number of trees installed, years in operation, number of failures, corresponding repair activity etc.).
The main objective is to study a specific Xmas Tree (XT) system and to estimate the retrieval rate due to tree failures based on commercially available reliability data. Further this shall be compared to high level experience data presented. This is to initiate the process to alleviate the gap seen between generic calculations of the tree retrieval rate compared to known field experience.
The master thesis shall cover the following tasks:
1. Literature study: The candidate shall perform a literature survey and, on the basis of this survey, describe:
a) Main types of Xmas trees, and main Xmas tree sub-systems and components b) Describe the most important differentiating factors with respect to reliability
and availability performance of Xmas Tree Systems (including installation/intervention issued and downhole operations).
c) Essential terms, definitions and industry standards for performing probabilistic analysis of subsea tree systems, and describe main methodologies
d) Relevant reliability data source(s), with emphasize on limitations and applicability in relation to the current topic.
2. Component-level FMECA of a selected Xmas tree configuration (excluding control module).
a) Develop an understanding of main components with essential functional requirements and criticality and effect resulting from functional failures.
3. Probabilistic Reliability Analysis of the selected Xmas Tree System a) Bottom-up approach:
i. Based on reliability data sources, develop a Xmas Tree specific database containing component reliability data for Xmas Tree components/items.
ii. Use this to develop a first pass reliability model for the Xmas Tree System.

iii
b) Top-down approach: i. View statistics on the high level reliability and availability
performance of subsea trees. ii. Seek literature for relevant comparative information.
iii. Use this information to develop a ‘simplified’ top down reliability model for the selected Xmas Tree configuration.
c) Comparative assessment: Derived from a comparative assessment of results, recommend a baseline set of component reliability data, additional model parameters, modifications factors and other refinements as required for calibration of the bottom-up model
Outlook: We are currently struggling to obtain Reliability Targets for the next generation of subsea trees and associated sub components. We believe this should be driven by a Systems top-down approach rather than assigning arbitrary values at the component level (bottom-up approach).
In the process of identifying Design Practices for 2014, the thesis work will be seen in relation to this. This will include methodologies for collection of field statistics on subsea trees.
The main objective is to establish a standard benchmark model (simple probabilistic rather than time-based) and associated process (Design Practice) for the allocation of component reliability targets based on goals for overall system reliability and availability.
The thesis must be written like a research report, with an abstract, conclusions, contents list, reference list, etc.
During preparation of the thesis it is important that the candidate emphasizes easily understood and well-written text. For ease of reading, the thesis should contain adequate references at appropriate places to related text, tables and figures. On evaluation, a lot of weight is put on thorough preparation of results, their clear presentation in the form of tables and/or graphs, and on comprehensive discussion.
The thesis is to be handed in electronically.
Thesis supervisors:
Prof. Jan-Erik Vinnem, NTNU Endre Willmann, GE Oil & Gas
Deadline: 10th June 2014


I
PREFACE This work comprises my master thesis for the Department of Marine Technology at the Norwegian University of Science and Technology, NTNU, spring 2014. The master thesis account for 30 credits in the last semester of the final year, and completes a Master of Science degree in Marine Technology, within the specialization Marine Operations and Maintenance. The master thesis has been executed in collaboration with GE Oil & Gas. The main purpose of this thesis is to estimate the retrieval rate of a specific tree system due to tree failures based on commercially available data and further compare the results to experiential data presented. This is to initiate a process alleviating the gap seen between generic calculations of the tree retrieval rate compared to known field experience. As I did not have any significant knowledge about XTs, a part of the thesis was to gain knowledge about different XT systems, their function and reliability issues thereof. The work has been awarding and exciting. It has been especially interesting to work with an actual problem and to get insight into the reliability engineering industry. I would like to give my most genuine thanks to my responsible supervisor at NTNU, Jan-Erik Vinnem, for valuable help, input and for always being online, even when he was not campus. I would also like to give my most sincere thanks for my supervisor in GE Oil & Gas, Endre Willmann, for taking the time and for this give valuable insight, feedback and patience throughout the thesis. Finally, I would like to thank Oline Giske Stendebakken for moral support and input on my writing. Trondheim 10th
June 2014
__________________________ Oda Ingeborg Stendebakken

III
EXECUTIVE SUMMARY The first subsea XT was installed in the Gulf of Mexico in 1961. Since then, the XTs are an essential part of the subsea fields. Now there are a number of XT variations with technology modified to fit each unique well. Tree complexity and functionality has increased over the last few decades.
The focus of this thesis is towards the subsea Xmas Tree (XT) system. The XT is recognized by the industry as an overall reliable configuration, but as in all development projects, it is a constant battle to optimize the design in a life cycle perspective taking account of several aspects such as safety, availability, maintainability and reliability. The ambient seabed conditions and continuously increasing intervention cost require a higher standard on the equipment and keep pushing the technology development.
There are two main approaches for predicting reliability of tress:
• Bottom-‐up: Reliability modeling of system, component by component, using component reliability data available in industry recognized sources, such as the OREDA handbook.
• Top-‐down: High-‐level reliability data for systems, captured from actual field experience/operations, typically reflecting the reliability performance as seen from the operators point of view.
The main objective is to study a specific XT system and to estimate the retrieval rate due to tree failures based on commercially available reliability data. Further this has been compared to high-‐level experience data presented. This is to initiate the process to alleviate the gap seen between generic calculations of the tree retrieval rate compared to known field experience. The XT configuration chosen to evaluate, is the Deepwater Vertical Xmas Tree (DVXT). A generalized case was constructed as the DVXT with help from Endre Willmann, the supervisor in GE Oil & Gas.
The scope is limited in this context to the DVXT system and systems that influence the DVXT system in terms of tree retrieval rate and downtime due to failures in the tree system. Therefore, the subsea control systems with associated monitoring equipment are excluded from the analysis.
To assess the DVXT system, a reliability analysis is performed. The reliability analysis is achieved in the following steps with proven methods from the reliability engineering discipline:
1. FMECA/Failure analysis 2. RBD/Reliability analysis
IV
A component-‐level FMECA is conducted to develop an understanding of main components with essential functional requirements, criticality and effect resulting from functional failure. The results from the reliability analysis, conducted as a bottom-‐up approach, indicate a retrieval rate of the production tree near 22 years.
Through the performed reliability analysis, the DVXT system has confirmed its reputation as a reliable configuration with high operating reliability and associated low risk. Nonetheless, several assumptions have been made. The focus of this thesis is not at the absolute result, but to illustrate a reliability issue experienced by GE Oil & Gas in the calculation of reliability based on generic reliability data versus field experience data. The OREDA-‐2009 Handbook is deliberately used as a sole source for raw data to illustrate this issue, as the handbook is known to give conservative results when calculations is performed purely based on it. However, it can well be seen as desirable that calculations are more cautious than a real situation, but a natural question here is to what extend.
It is shown a significant gap between the bottom-‐up approach and the field experience data presented. Based on the field experience collected it is indicated a MTTF for XT retrieval on the top-‐down approach between 100 to 200 years. This implies a factor of 5 to 10 between the bottom-‐up and the top-‐down approach. It should be noted that the estimates for retrieval rate is meant for a population of trees in operation. A tree will obviously not be able to operate for 200 years.
Further, it is indicated by GE Oil & Gas that a Pareto-‐rule seem to apply when deciding if failures require heavy workover such as XT retrieval or light intervention means such as ROV remedial actions upon repair. Applied to the sensitivity case to the bottom-‐up approach, assuming that in fact 80% of XT critical failures can be restored by light intervention means, the total MTBF of 15 years predicted for XT critical failures then results in an XT retrieval rate of 75 years. This is closer to the expectations indicated by the top-‐down approach, but still not close to the levels indicated by recent field experience.
This indicate that the bottom-‐up model should be calibrated with input data that is based on experience data rather than solely based on generic to alleviate some of the distance between the two approaches. This can be performed in shape of additional model parameters, modification factors or other refinements. The solution to this is however not presented in this thesis. The Pareto-‐rule can be utilized in order to calibrate this gap, if shown applicable based on comprehensive historic data. This has to be studied further thoroughly.

V
SAMMENDRAG Det første juletreet på havbunnen ble installert i Mexicogolfen i 1961. Siden da har treet vært en essensiell del av havbunnsfelt. I dag eksisterer det en rekke varianter av trær med teknologi modifisert til å passe hvert unike felt. Kompleksitet og funksjonalitet til trærne har økt de siste tiårene.
Fokuset i denne masteroppgaven er rettet mot juletresystemet på havbunnen. Treet er anerkjent av industrien som en pålitelig konfigurasjon, men som i alle utviklingsprosjekter er det en konstant kamp å optimalisere designet i et livsløpsperspektiv hvor det blir tatt hensyn til aspekter som sikkerhet, tilgjengelighet, vedlikehold og pålitelighet. Omgivelsene på havbunnen og de stadig økende kostandene for intervensjon krever en høyere standard på utstyr, og fortsetter å drive teknologiutviklingen. .
Det er to hovedtilnærminger for å forutsi påliteligheten til et tre:
• ”Bottom-‐up”: Pålitelighetsmodellering av systemet, komponent for komponent, basert på pålitelighetsdata på komponentnivå tilgjengelige kilder anerkjent av bransjen, slik som OREDA-‐2009 håndboken.
• ”Top-‐down”: Pålitelighetsdata for systemer på et overordnet nivå, tatt fra felterfaring/drift. Disse dataene reflekterer vanligvis pålitelighetskrav sett fra operatørenes synspunkt.
Hovedmålet med oppgaven er å studere et bestemt tre og estimere trekkerate for dette treet på grunn av feil i treet. Trekkerate vil si hvor ofte en skal påregne å erstatte et tre; ta det opp og sette inn et nytt tre. Beregningene er basert på kommersielt tilgjengelige pålitelighetsdata. Videre skal dette sammenlignes med erfaringsdata fra oljefelt presentert i oppgaven. Dette blir gjort fordi GE Oil & Gas har erfart en signifikant avstand mellom beregnet trekkerate og den reelle trekkeraten i felt. Hensikten med denne masteroppgaven er å sette i gang prosessen med å minske gapet mellom generiske beregninger og presentert felterfaring. Den konfigurasjonen som ble valgt som case er et dypvannsvertikalt tre. En generell case av det vertikale dypvannstreet ble konstruert ved hjelp av Endre Willmann, veileder i GE Oil & Gas.
Omfanget av oppgaven er begrenset i denne sammenheng til det vertikale dypvannstresystemet og systemer som påvirker treet i form av trekkerate og nedetid på grunn av svikt i selve treet. Derfor er kontrollsystemet på havbunnen med tilhørende overvåkningsutstyr for trykk og temperatur ekskludert fra analysen.
En pålitelighetsanalyse er utført for å vurdere treet. Analysen er utført i følgende trinn:
1. Feilanalyse (med feil, modus, effekt og kritikalitetsanalyse (FMECA))

VI
2. Pålitelighetsanalyse (med pålitelighetsblokkdiagram)
Feilanalysen er utført med en feil, modus, effekt og kritikalitetsanalyse på komponentnivå. Denne er gjennomført for å utvikle en forståelse av hovedkomponenter med essensielle funksjonelle krav og kritikalitet, og videre virkning som følge av funksjonssvikt. Pålitelighetsanalysen er gjennomført med rådata fra den kommersielt tilgjengelige OREDA håndboken. Resultatene fra denne analysen predikterer en trekkerate på treet til å være lik 22 år.
Gjennom de utførte pålitelighetsanalysene har treet bekreftet sitt omdømme som en pålitelig konfigurasjon med høy driftssikkerhet og en tilhørende lav risiko. Fokuset på denne oppgaven er ikke rettet mot et absolutt resultat på pålitelighet av treet, men er ment å illustrere det GE Oil & Gas oppfatter som et pålitelighetsnøyaktighetsproblem ved beregning av pålitelighet basert på generiske pålitelighetstall kontra erfaringsdata. OREDA-‐2009 håndboken er bevisst brukt som eneste kilde til rådata for å illustrere dette problemet, siden håndboken er kjent for å gi konservative resultater når beregninger er utført utelukkende basert på den. Det er naturlig og kan godt sees som ønskelig at beregninger er mer forbeholdne enn real situasjonen, men i denne konteksten er det et naturlig spørsmål å stille seg i hvilken grad.
Det er påvist et betydelig gap mellom den beregnete og den erfaringsbaserte trekkeraten på treet. Basert på samlet felterfaring presentert, er det indikert et estimat på tid til feil for trekkerate mellom 100 til 200 år. Dette innebærer en faktor på 5 til 10 mellom den beregnete og den erfaringsbaserte tilnærmingen. Det bør bemerkes at anslagene for trekkerate er ment for en populasjon av trær i drift. Et tre vil selvsagt ikke kunne operere i 200 år.
Videre er det gitt av GE Oil & Gas at en Pareto-‐regel tilsynelatende gjelder når en bestemmer om en potensiell feil krever tung brønnoverhaling i form av å trekke treet eller en lettere intervensjon med fjernstyrt maskineri (ROV) på stedet. Hvis Pareto-‐regelen gjelder, vil den beregnede totale tid til feil på det beregnede treet lik 15 år resultere i at 80 % av kritiske feil på treet kan repareres ved lettere intervensjon, mens de resterende 20 % vil kreve trekking av treet. Dette vil da reflektere en trekkerate på treet lik 75 år. Dette er nærmere forventingene fra de erfaringsbaserte tallene presentert, men fortsatt ikke i nærheten av nivåene angitt av nyere felterfaring.
Dette tyder på at konvensjonelle data bør kalibreres med erfaringsdata for å minske avstanden mellom de to tilnærmingene. Dette kan utføres i form av modellparametere, modifiseringsfaktorer eller andre forbedringer. Resultatene i denne oppgaven gir ingen klare svare på hva slike modellparametere bør være. Pareto-‐regelen kan muligens benyttes for å oppnå mer realistiske beregninger, dersom en slik omregning finner støtte i omfattende historiske data. Dette kreves det i så fall grundig videre forskning på.
VII
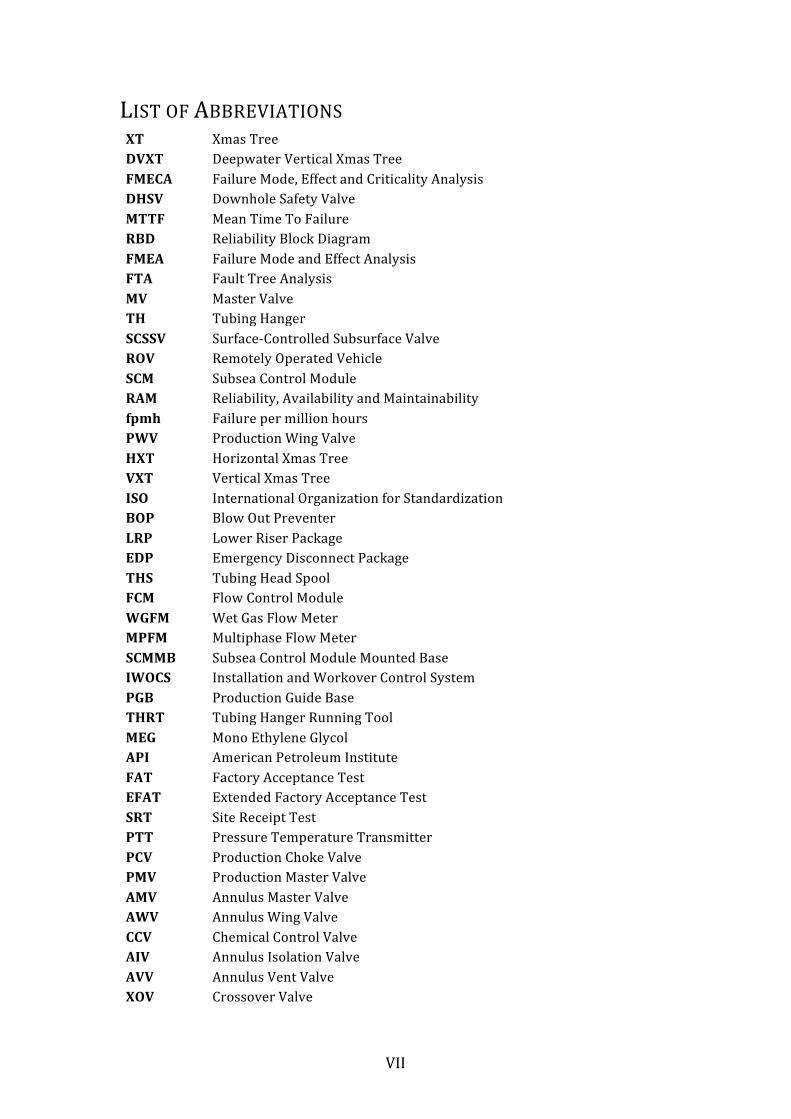
LIST OF ABBREVIATIONS XT Xmas Tree DVXT Deepwater Vertical Xmas Tree FMECA Failure Mode, Effect and Criticality Analysis DHSV Downhole Safety Valve MTTF Mean Time To Failure RBD Reliability Block Diagram FMEA Failure Mode and Effect Analysis FTA Fault Tree Analysis MV Master Valve TH Tubing Hanger SCSSV Surface-‐Controlled Subsurface Valve ROV Remotely Operated Vehicle SCM Subsea Control Module RAM Reliability, Availability and Maintainability fpmh Failure per million hours PWV Production Wing Valve HXT Horizontal Xmas Tree VXT Vertical Xmas Tree ISO International Organization for Standardization BOP Blow Out Preventer LRP Lower Riser Package EDP Emergency Disconnect Package THS Tubing Head Spool FCM Flow Control Module WGFM Wet Gas Flow Meter MPFM Multiphase Flow Meter SCMMB Subsea Control Module Mounted Base IWOCS Installation and Workover Control System PGB Production Guide Base THRT Tubing Hanger Running Tool MEG Mono Ethylene Glycol API American Petroleum Institute FAT Factory Acceptance Test EFAT Extended Factory Acceptance Test SRT Site Receipt Test PTT Pressure Temperature Transmitter PCV Production Choke Valve PMV Production Master Valve AMV Annulus Master Valve AWV Annulus Wing Valve CCV Chemical Control Valve AIV Annulus Isolation Valve AVV Annulus Vent Valve XOV Crossover Valve
VIII
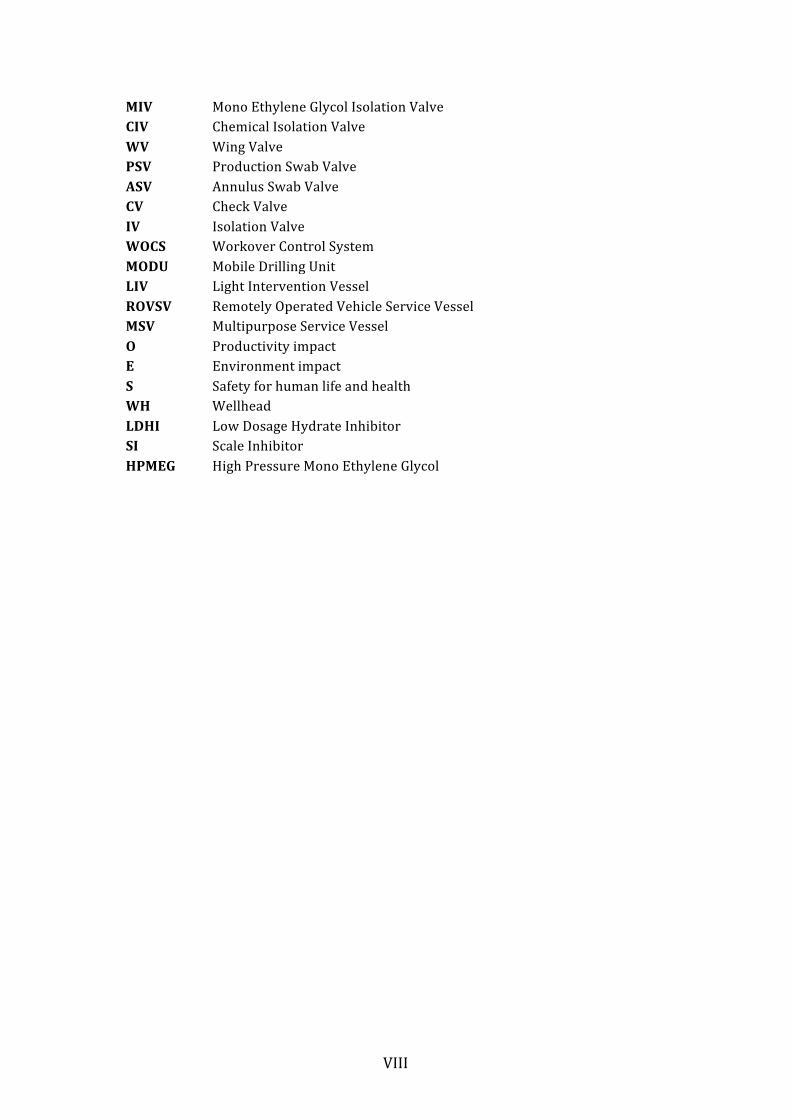
MIV Mono Ethylene Glycol Isolation Valve CIV Chemical Isolation Valve WV Wing Valve PSV Production Swab Valve ASV Annulus Swab Valve CV Check Valve IV Isolation Valve WOCS Workover Control System MODU Mobile Drilling Unit LIV Light Intervention Vessel ROVSV Remotely Operated Vehicle Service Vessel MSV Multipurpose Service Vessel O Productivity impact E Environment impact S Safety for human life and health WH Wellhead LDHI Low Dosage Hydrate Inhibitor SI Scale Inhibitor HPMEG High Pressure Mono Ethylene Glycol
IX
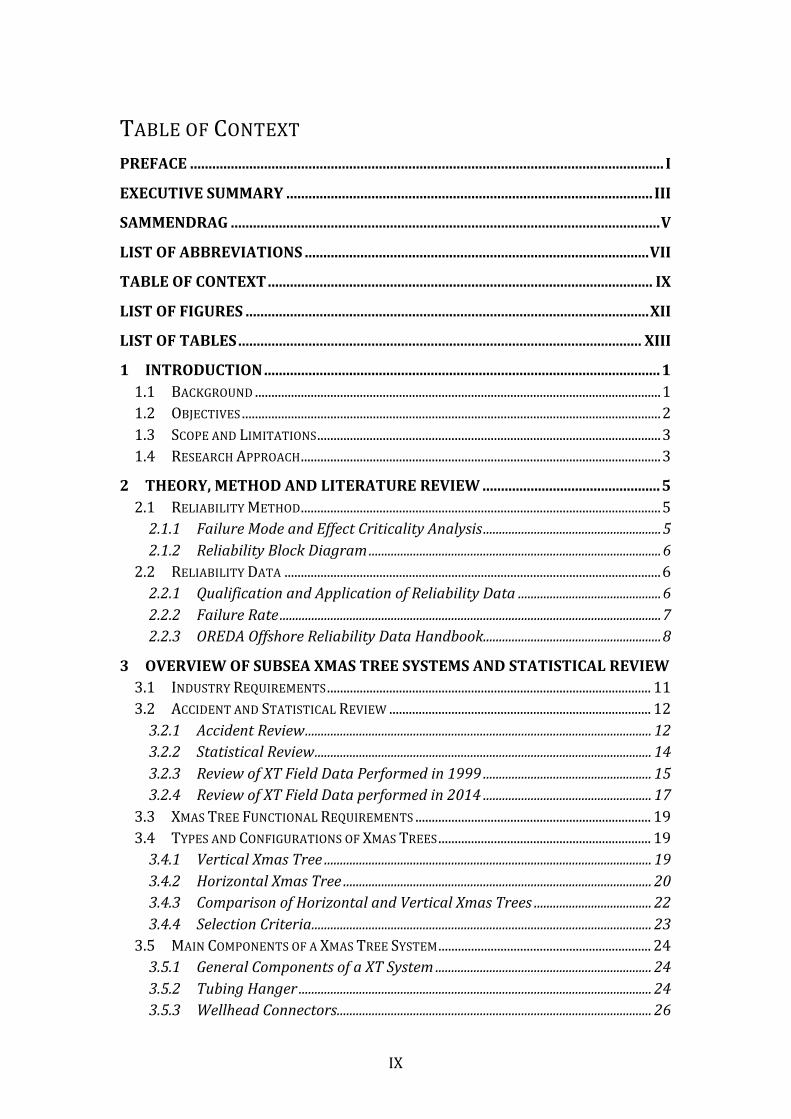
TABLE OF CONTEXT PREFACE ................................................................................................................................ I
EXECUTIVE SUMMARY ................................................................................................... III
SAMMENDRAG .................................................................................................................... V
LIST OF ABBREVIATIONS ............................................................................................. VII
TABLE OF CONTEXT ........................................................................................................ IX
LIST OF FIGURES ............................................................................................................. XII
LIST OF TABLES ............................................................................................................. XIII
1 INTRODUCTION ........................................................................................................... 1 1.1 BACKGROUND ............................................................................................................................ 1 1.2 OBJECTIVES ................................................................................................................................ 2 1.3 SCOPE AND LIMITATIONS ......................................................................................................... 3 1.4 RESEARCH APPROACH .............................................................................................................. 3
2 THEORY, METHOD AND LITERATURE REVIEW ................................................ 5 2.1 RELIABILITY METHOD .............................................................................................................. 5 2.1.1 Failure Mode and Effect Criticality Analysis ........................................................ 5 2.1.2 Reliability Block Diagram ............................................................................................ 6
2.2 RELIABILITY DATA ................................................................................................................... 6 2.2.1 Qualification and Application of Reliability Data ............................................. 6 2.2.2 Failure Rate ........................................................................................................................ 7 2.2.3 OREDA Offshore Reliability Data Handbook ........................................................ 8
3 OVERVIEW OF SUBSEA XMAS TREE SYSTEMS AND STATISTICAL REVIEW 3.1 INDUSTRY REQUIREMENTS ................................................................................................... 11 3.2 ACCIDENT AND STATISTICAL REVIEW ................................................................................ 12 3.2.1 Accident Review ............................................................................................................. 12 3.2.2 Statistical Review .......................................................................................................... 14 3.2.3 Review of XT Field Data Performed in 1999 ..................................................... 15 3.2.4 Review of XT Field Data performed in 2014 ..................................................... 17
3.3 XMAS TREE FUNCTIONAL REQUIREMENTS ........................................................................ 19 3.4 TYPES AND CONFIGURATIONS OF XMAS TREES ................................................................. 19 3.4.1 Vertical Xmas Tree ....................................................................................................... 19 3.4.2 Horizontal Xmas Tree ................................................................................................. 20 3.4.3 Comparison of Horizontal and Vertical Xmas Trees ..................................... 22 3.4.4 Selection Criteria ........................................................................................................... 23
3.5 MAIN COMPONENTS OF A XMAS TREE SYSTEM ................................................................. 24 3.5.1 General Components of a XT System .................................................................... 24 3.5.2 Tubing Hanger ............................................................................................................... 24 3.5.3 Wellhead Connectors ................................................................................................... 26

X
3.5.4 Valves ................................................................................................................................. 27 3.5.5 Flow Control Module ................................................................................................... 28 3.5.6 Main Components That Vary Between HXTs and VXTs ................................ 28 3.5.7 Xmas Tree-‐Mounted Controls .................................................................................. 29
3.6 XMAS TREE INSTALLATION AND SERVICE CONDITIONS ................................................... 29 3.6.1 Xmas Tree Installation ............................................................................................... 29 3.6.2 Service Conditions ......................................................................................................... 31
3.7 XMAS TREE DESIGN AND ANALYSIS .................................................................................... 31 3.8 TEST PROGRAM FOR XMAS TREES ...................................................................................... 32
4 CASE STUDY: DEEPWATER VERTICAL XMAS TREE ...................................... 33 4.1 DESCRIPTION OF A DEEPWATER VERTICAL XMAS TREE ................................................. 33 4.2 BASE CASE DEFINITION ........................................................................................................ 34 4.3 BOUNDARY DEFINITION ........................................................................................................ 35 4.4 KEY SYSTEM ELEMENTS AND CHARACTERISTICS .............................................................. 36 4.4.1 General .............................................................................................................................. 36 4.4.2 Tubing Head Spool ....................................................................................................... 37 4.4.3 Tubing Hanger ............................................................................................................... 38 4.4.4 Production Xmas Tree ................................................................................................ 39 4.4.5 Flow Control Module ................................................................................................... 41 4.4.6 Xmas Tree Installation and Workover Control System ................................ 42
4.5 MAIN ASSUMPTIONS AND LIMITATIONS ............................................................................. 42 4.5.1 Analysis Level .................................................................................................................. 42 4.5.2 Operational Phases ...................................................................................................... 42 4.5.3 Analysis Assumptions .................................................................................................. 42
5 RELIABILITY ANALYSIS APPROACH APPLIED TO CASE .............................. 44 5.1 XT FAILURES .......................................................................................................................... 44 5.2 WELL INTERVENTION MEANS ............................................................................................. 45 5.2.1 Heavy workover ............................................................................................................. 45 5.2.2 Light Intervention ......................................................................................................... 46
5.3 FAILURE CRITICALITY CLASSIFICATION .............................................................................. 46 5.4 FAILURE MODE EFFECT AND CRITICALITY ANALYSIS ...................................................... 47 5.4.1 Risk Evaluation of the Components ...................................................................... 49 5.4.2 Identification of Component Failures .................................................................. 51
5.5 RELIABILITY BLOCK DIAGRAM ............................................................................................. 54
6 RESULTS ...................................................................................................................... 57 6.1 FMECA/FAILURE ANALYSIS ............................................................................................... 57 6.1.1 Failure Criticality Assessment of Components and Sub-‐Systems ............. 57 6.1.2 FMECA ................................................................................................................................ 59
6.2 RBD/RELIABILITY ANALYSIS .............................................................................................. 64 6.3 COMPARISON OF BOTTOM-‐UP AND TOP-‐DOWN RESULTS .............................................. 66
7 DISCUSSION ................................................................................................................ 69

XI
7.1 DISCUSSION OF RESULTS ....................................................................................................... 69 7.2 DISCUSSION OF THE FRAMEWORK USED TO OBTAIN THE RESULTS ............................... 70 7.2.1 Simplification of the System ..................................................................................... 72 7.2.2 Simplifications and Weaknesses of the FMECA ............................................... 73 7.2.3 Simplifications and Weaknesses of the RBD ..................................................... 73
8 CONCLUSION AND FURTHER WORK .................................................................. 75 8.1 SUMMARY AND CONCLUSION ................................................................................................ 75 8.2 FURTHER WORK .................................................................................................................... 76
BIBLIOGRAPHY ................................................................................................................ 78
APPENDICES ..................................................................................................................... 79
A. RELIABILITY DATA ................................................................................................ 81
B. MOBILIZATION AND REPAIR TIME ................................................................... 85
C. FAILURE MODE AND EFFECT CRITICALITY ANALYSIS ................................ 87
D. RELIABILITY BLOCK DIAGRAMS ..................................................................... 113 D.1 PRODUCTION XMAS TREE .................................................................................................. 113 D.2 FLOW CONTROL MODULE .................................................................................................. 116
XII
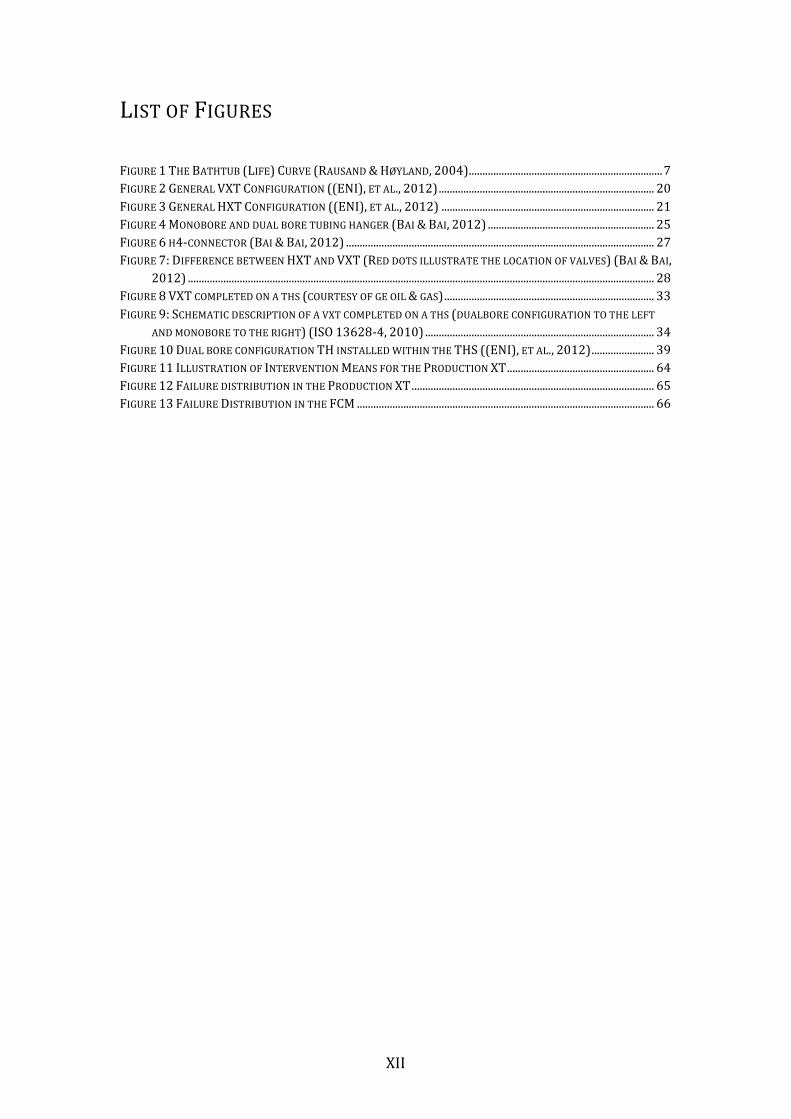
LIST OF FIGURES
FIGURE 1 THE BATHTUB (LIFE) CURVE (RAUSAND & HØYLAND, 2004) ....................................................................... 7 FIGURE 2 GENERAL VXT CONFIGURATION ((ENI), ET AL., 2012) ............................................................................... 20 FIGURE 3 GENERAL HXT CONFIGURATION ((ENI), ET AL., 2012) .............................................................................. 21 FIGURE 4 MONOBORE AND DUAL BORE TUBING HANGER (BAI & BAI, 2012) ............................................................. 25 FIGURE 6 H4-‐CONNECTOR (BAI & BAI, 2012) ................................................................................................................. 27 FIGURE 7: DIFFERENCE BETWEEN HXT AND VXT (RED DOTS ILLUSTRATE THE LOCATION OF VALVES) (BAI & BAI,
2012) ........................................................................................................................................................................... 28 FIGURE 8 VXT COMPLETED ON A THS (COURTESY OF GE OIL & GAS) ............................................................................. 33 FIGURE 9: SCHEMATIC DESCRIPTION OF A VXT COMPLETED ON A THS (DUALBORE CONFIGURATION TO THE LEFT
AND MONOBORE TO THE RIGHT) (ISO 13628-‐4, 2010) .................................................................................... 34 FIGURE 10 DUAL BORE CONFIGURATION TH INSTALLED WITHIN THE THS ((ENI), ET AL., 2012) ....................... 39 FIGURE 11 ILLUSTRATION OF INTERVENTION MEANS FOR THE PRODUCTION XT ...................................................... 64 FIGURE 12 FAILURE DISTRIBUTION IN THE PRODUCTION XT ......................................................................................... 65 FIGURE 13 FAILURE DISTRIBUTION IN THE FCM ............................................................................................................. 66
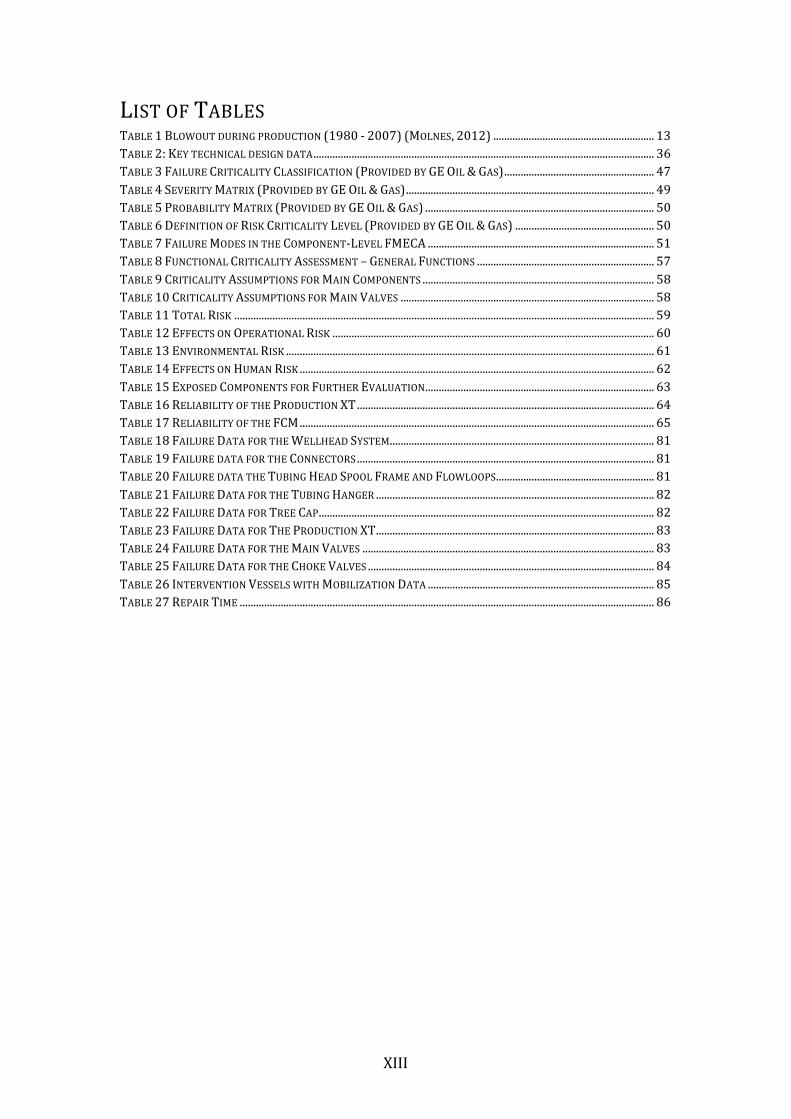
XIII
LIST OF TABLES TABLE 1 BLOWOUT DURING PRODUCTION (1980 -‐ 2007) (MOLNES, 2012) ........................................................... 13 TABLE 2: KEY TECHNICAL DESIGN DATA ............................................................................................................................. 36 TABLE 3 FAILURE CRITICALITY CLASSIFICATION (PROVIDED BY GE OIL & GAS) ....................................................... 47 TABLE 4 SEVERITY MATRIX (PROVIDED BY GE OIL & GAS) ........................................................................................... 49 TABLE 5 PROBABILITY MATRIX (PROVIDED BY GE OIL & GAS) .................................................................................... 50 TABLE 6 DEFINITION OF RISK CRITICALITY LEVEL (PROVIDED BY GE OIL & GAS) ................................................... 50 TABLE 7 FAILURE MODES IN THE COMPONENT-‐LEVEL FMECA ................................................................................... 51 TABLE 8 FUNCTIONAL CRITICALITY ASSESSMENT – GENERAL FUNCTIONS ................................................................. 57 TABLE 9 CRITICALITY ASSUMPTIONS FOR MAIN COMPONENTS ..................................................................................... 58 TABLE 10 CRITICALITY ASSUMPTIONS FOR MAIN VALVES ............................................................................................. 58 TABLE 11 TOTAL RISK .......................................................................................................................................................... 59 TABLE 12 EFFECTS ON OPERATIONAL RISK ...................................................................................................................... 60 TABLE 13 ENVIRONMENTAL RISK ....................................................................................................................................... 61 TABLE 14 EFFECTS ON HUMAN RISK .................................................................................................................................. 62 TABLE 15 EXPOSED COMPONENTS FOR FURTHER EVALUATION .................................................................................... 63 TABLE 16 RELIABILITY OF THE PRODUCTION XT ............................................................................................................. 64 TABLE 17 RELIABILITY OF THE FCM .................................................................................................................................. 65 TABLE 18 FAILURE DATA FOR THE WELLHEAD SYSTEM ................................................................................................. 81 TABLE 19 FAILURE DATA FOR THE CONNECTORS ............................................................................................................. 81 TABLE 20 FAILURE DATA THE TUBING HEAD SPOOL FRAME AND FLOWLOOPS .......................................................... 81 TABLE 21 FAILURE DATA FOR THE TUBING HANGER ...................................................................................................... 82 TABLE 22 FAILURE DATA FOR TREE CAP ........................................................................................................................... 82 TABLE 23 FAILURE DATA FOR THE PRODUCTION XT ...................................................................................................... 83 TABLE 24 FAILURE DATA FOR THE MAIN VALVES ........................................................................................................... 83 TABLE 25 FAILURE DATA FOR THE CHOKE VALVES ......................................................................................................... 84 TABLE 26 INTERVENTION VESSELS WITH MOBILIZATION DATA ................................................................................... 85 TABLE 27 REPAIR TIME ........................................................................................................................................................ 86

Introduction
1
1 INTRODUCTION
1.1 BACKGROUND As offshore technologies have advanced, more and more of the operations previously performed on the surface are moved down to the seabed. Today’s subsea technology encircles a wide range of subsea components, i.e. XTs, manifolds, risers, templates, flowlines, ROVs, hydraulic and electric power systems, control systems, fluid pumping, reinjection and separation.
The first subsea XT was installed in the Gulf of Mexico in 1961. Since then, the XTs are an essential part of the subsea fields. Now there are a number of XT variations with technology modified to fit each unique well. Tree complexity and functionality has increased over the last few decades.
The XT is recognized by the industry as an overall reliable configuration. With the demand for production of hydrocarbons from deeper water with higher pressures and temperatures, the XTs meet additional design constraints. These keep pushing the technology to evolve to meet the challenges coming both now and in the future. The ambient seabed conditions and continuously increasing intervention cost require a higher standard on the equipment and keep pushing the technology development.
As in all development projects, it is a constant battle to optimize the system design in a life cycle perspective taking account of various aspects such as safety, availability, maintainability and reliability. In subsea development projects, reliability and availability performance targets are normally part of the contractual requirements.
Generally, unplanned stoppage of equipment result in high equipment downtime, high cost of repair, extensive repair time and high penalty associated with loss of production.
In order to optimize the tree system design with respect to safety, availability, maintainability and reliability performance, there is a need for proper reliability models that are able to differentiate between different options and variants.
There are two main approaches for predicting reliability of XTs:
• Bottom-‐up: Reliability modeling of system, component by component, using component reliability data available in industry recognized sources, such as the OREDA handbook.
Chapter 1
2
• Top-‐down: High-‐level reliability data for systems, captured from actual field experience/operations, typically reflecting the reliability performance as seen from the operators point of view.
The two approaches results in totally different results. For instance, an attempt to model a conventional tree using component data from OREDA may typically predict a retrieval rate of XTs in the order of once per 15-‐20 years, as opposed to once per 150-‐200 years estimated MTBF based on experience implied by the operators/customers.
The idea is that the bottom-‐up model should be calibrated with input data that is experiential rather than generic to alleviate some of the distance between the two approaches. Although GE Oil & Gas have a good understanding of the overall reliability and availability performance as seen from the customers, there is an unrealized potential regarding a structured data-‐collecting and organizing tool of actual field experience for their Xmas trees (number of trees installed, years in operation, number of failures, corresponding repair activity etc.). In its absence, the generic and therefore misleading retrieval rate are emphasized to a higher degree than one might wish.
1.2 OBJECTIVES In this master thesis, the main objective is to study a specific Xmas Tree (XT) system and to estimate the retrieval rate due to tree failures based on commercially available reliability data. Further this shall be compared to high level experience data presented. This is to initiate the process to alleviate the gap seen between generic calculations of the tree retrieval rate compared to known field experience. The elected tree system to study is the Deepwater Vertical Xmas Tree (DVXT).
More specifically, the objectives are too:
1) Perform a literature survey and, on the basis of this survey, describe: a) Main types of Xmas trees, and main Xmas tree sub-‐systems and
components b) Describe the most important differentiating factors with respect to
reliability and availability performance of Xmas Tree Systems (including installation/intervention issued and downhole operations).
c) Essential terms, definitions and industry standards for performing probabilistic analysis of subsea tree systems, and describe main methodologies
d) Relevant reliability data sources, with emphasize on limitations and applicability in relation to the current topic.
2) Conduct a component-‐level FMECA of a DVXT configuration (excluding control module, see Chapter 1.3).
Introduction
3
a) Develop an understanding of main components with essential functional requirements and criticality and effect resulting from functional failures
3) Conduct a Probabilistic Reliability Analysis of the Deepwater Vertical Xmas Tree System a) Bottom-‐up approach:
i) Based on reliability data sources, develop an Xmas Tree specific database containing component reliability data for Xmas Tree components/items.
ii) Use this to develop a first pass reliability model for the Xmas Tree System
b) Top-‐down approach: i) View statistics on the high level reliability and availability
performance of subsea trees. ii) Seek literature for relevant comparative information.
4) Comparative assessment: Derived from a comparative assessment of results,
recommend a baseline set of component reliability data, additional model parameters, modifications factors and other refinements as required for calibration of the bottom-‐up model
1.3 SCOPE AND LIMITATIONS The scope is limited in this context to the XT system and systems that influence the XT system in terms of XT retrieval rate and downtime due to XT failures. Therefor, the control systems with associated monitoring equipment are excluded from the analysis conducted.
1.4 RESEARCH APPROACH The work has mainly consisted of two activities;
1. Acquiring through relevant theory with regard to reliability data (commercially available data and field experience data), applicable standards, reliability theory and XT accidents.
2. Gain detailed knowledge about the XT system and variations within to be able to perform a proper reliability assessment followed by analysis of the system through proven methods from the reliability engineering discipline.
A component-‐level FMECA have been conducted to evaluate failure modes relevant for the Deepwater Vertical Xmas Tree (DVXT) in order to estimate the Mean Time To Failure (MTTF) through Reliability Block Diagram’s (RBD’s). The focus is directed to the retrieval rate of trees, found through the RBD’s. This retrieval rate is compared to field experience to initiate the process to find a sound strategy to alleviate the distance between the bottom-‐up and top-‐down approach.

Theory, Method and Literature Review
5
2 THEORY, METHOD AND LITERATURE REVIEW In this chapter relevant theory, method and literature review are presented. The literature review executed on tree variations and its components are presented in Chapter 3.
2.1 RELIABILITY METHOD
2.1.1 FAILURE MODE AND EFFECT CRITICALITY ANALYSIS A Failure Mode and Effect Analysis (FMEA) is normally the starting point of a systems reliability study and is used as a systematic technique to identify and evaluate potential failure modes in a system and the further effects these failures may have on the system. An FMEA becomes a Failure Mode and Effect Criticality Analysis (FMECA) if the failure modes are ranked in terms of criticality. A FMECA is usually carried out during the design phase to identify possible weaknesses so that corrections and potential extra barriers might be added at a relatively early stage in a project. FMECA is also used for maintenance planning and as a basis for more detailed reliability analysis.
The main objective of a FMECA is to identify areas where improvements are needed to meet safety and reliability requirements. This is achieved through systematic assessment of the likelihood that faults might occur and the severity of the potential consequences. Main elements of the system and their relationship, such as series, redundancy and the like, shall be identified as part of the analysis. Based on the output form the FMECA, effects on system availability and maintenance planning may be established. A FMECA can provide a basis for a more detailed, tailored reliability analysis.
Largely, a FMECA can be divided into several levels of accuracy: The following breakdown structure is used by GE Oil & Gas for subsea application:
i. Level 1: System-‐level FMECA with project/application specific conditions and requirements applied.
ii. Level 2: Subsystem-‐level FMECA, also with project/application specific conditions and requirements.
iii. Level 3: Component-‐level FMECA; with generic component conditions and functional requirements applied.
A FMECA can be conducted both using bottom-‐up and top-‐down approach. In a bottom-‐up approach one evaluates the system by identifying all potential failure modes on a component level and precede upwards in the hierarchy. This is distinct from the top-‐down approach, where the analysis is carried out by splitting the system into a number of subsystems and then identifying possible
Chapter 2
6
failure modes and failure effects of each subsystem based on knowledge of the subsystem’s required functions, or from experience from similar equipment.
The top-‐down approach tends to be more accurate than bottom-‐up, but also demands input of higher quality, and thus demands more resources. This might be one of the reasons to choose a bottom-‐up approach.
2.1.2 RELIABILITY BLOCK DIAGRAM A Reliability Block Diagram (RBD) illustrates the functioning of various functional blocks that may secure success, or failure, of a complex system. The structure in the RBD is described mathematically by structure functions, considering redundancy and the like in the system.
RBD’s can be utilized to calculate risk values and to identify where the most effective modifications should be included for mitigation of risk.
Credible reliability data may not be obtainable at a system level. In that case the systems or modules may consist of general components such as connectors and frame, where reliability data is more comprehensive.
The RBD method is comparable in certain respects to a fault tree analysis (FTA). The main difference is that the RBD starts out from the system functionality instead of a potential system failure.
2.2 RELIABILITY DATA
2.2.1 QUALIFICATION AND APPLICATION OF RELIABILITY DATA The principles from NORSOK Z-‐016 shall be applied for qualification and application of reliability data. The standard underlines the following principles:
”The establishment of correct and relevant reliability data (i.e. failure and associated repair/downtime data) requires a data qualification process which involves conscious attention to original source of data, interpretation of any available statistics and estimation method for analysis usage. Selection of data shall be based on the following principles:
• Data should originate from the same type of equipment. • Data should originate from equipment using similar technology. • Data should if possible originate from identical equipment models. • Data should originate from periods of stable operation, although 1st year
start-‐up problems should be given due consideration. • Data should if possible originate from equipment, which has been exposed,
to comparable operating and maintenance conditions. • The basis for the data used should be sufficiently extensive.
Theory, Method and Literature Review
7
• The amount of inventories and failure events used to estimate or predict reliability parameters should be sufficiently large to avoid bias resulting from ’outliers’.
• The repair and downtime data should reflect site-‐specific conditions. • The equipment boundary for originating data source and analysis element
should match as far as possible. Study assumptions should otherwise be given.
• Population data (e.g. operating time, observation period) should be indicated to reflect statistical significance (uncertainty related to estimate/predictions) and ”technology window”.
• Data sources shall be quoted.
Data from event databases, e.g. OREDA database, provide relevant basis for meeting the requirements above. In case of scarce data, proper engineering judgement is needed and sensitivity analysis of input data shall be done.” (NORSOK Z-‐016)
2.2.2 FAILURE RATE According to NORSOK Z-‐016 a failure is “termination of an ability an item have to perform a required function”. The failure rate function express the likelihood that an item that has survived up to time t, will fail during the next period of time. If the item is deteriorating, this likelihood will increase with age t.
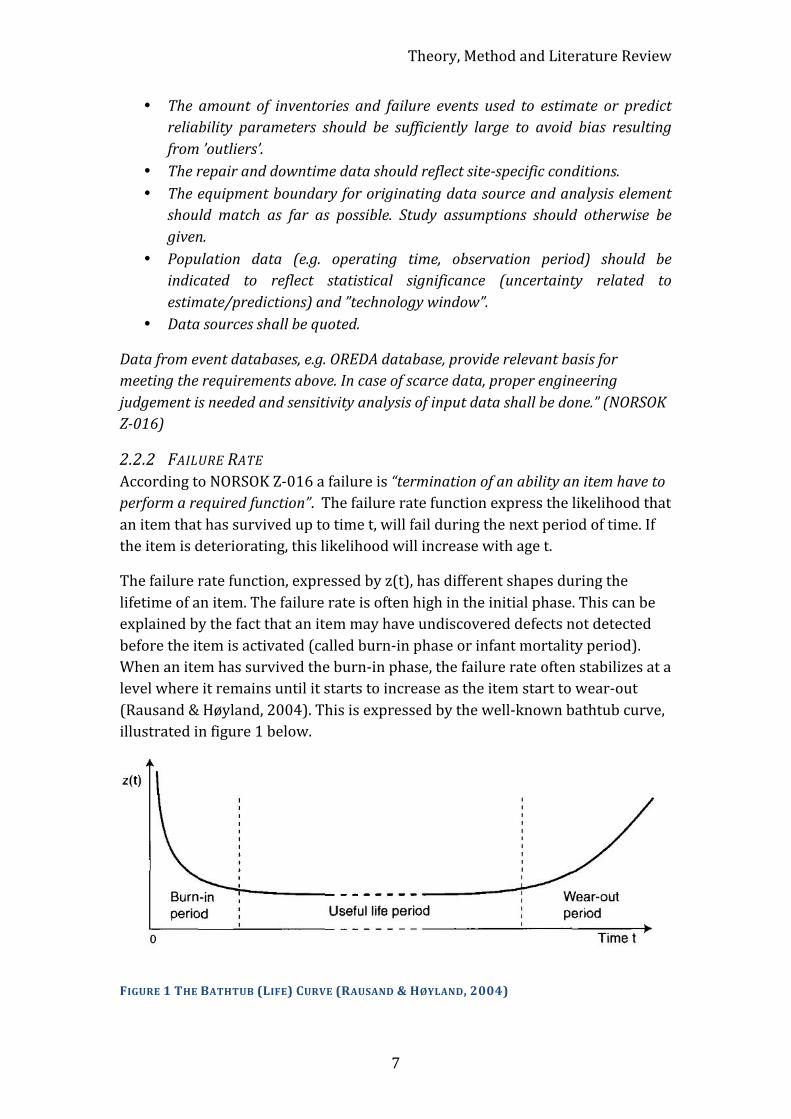
The failure rate function, expressed by z(t), has different shapes during the lifetime of an item. The failure rate is often high in the initial phase. This can be explained by the fact that an item may have undiscovered defects not detected before the item is activated (called burn-‐in phase or infant mortality period). When an item has survived the burn-‐in phase, the failure rate often stabilizes at a level where it remains until it starts to increase as the item start to wear-‐out (Rausand & Høyland, 2004). This is expressed by the well-‐known bathtub curve, illustrated in figure 1 below.
FIGURE 1 THE BATHTUB (LIFE) CURVE (RAUSAND & HØYLAND, 2004)
Chapter 2
8
For a technical item for subsea purposes, it is generally recognized that the comprehensive quality testing before installation eliminates most of the infant mortalities. Also, strict maintenance or replacement policies ensure the components to not reach the wear-‐out period. From these assumptions, it is reasonable to assume the failure rate function is constant and independent of time, in which case the z(t) = λ for subsea technical items (SINTEF, 2009). The failure rate λ is exponentially distributed.
An important implication of the constant failure rate is that an item is considered “as good as new” as long as it is functioning.
Based on the assumption of constant failure rate, the Mean Time To Failure (MTTF), may be calculated as:
𝑀𝑇𝑇𝐹 =1𝜆
With failure data from identical items that have been operating under the same operational and environmental conditions, the failure rate λ is calculated by dividing the total number of failures by the total time in service:
𝜆 =𝑁𝑢𝑚𝑏𝑒𝑟 𝑜𝑓 𝑓𝑎𝑖𝑙𝑢𝑟𝑒𝑠
𝐴𝑔𝑔𝑟𝑒𝑔𝑎𝑡𝑒𝑑 𝑡𝑖𝑚𝑒 𝑖𝑛 𝑠𝑒𝑟𝑣𝑖𝑐𝑒 =𝑛𝜏
For further details, see (Rausand & Høyland, 2004).
2.2.3 OREDA OFFSHORE RELIABILITY DATA HANDBOOK The main data source for this thesis is the OREDA database, which is the most comprehensive database commercially available. It is a project sponsored by several companies in the oil and gas industry operating multinational. The main purpose of the project is to exchange and collect reliability data from the participants and act as a forum to co-‐ordinate the reliability data collection within the oil and gas industry.
The database is a generic component reliability database where the participating parties can see the manufacturers and makes of the components represented, otherwise the data available are components classified under groups such as connectors, valves, chokes and the like. The equipment is primarily divided into topside and subsea equipment, but some onshore equipment is also included.
Each equipment class, such as XT or manifold, is defined with a boundary drawing that encompasses all subunits and components belonging to that equipment class. Each failure is linked to the component that failed, reflecting failure modes for the equipment. The failure modes identified are further classified, standard equipment level, sub-‐unit and component level, as critical, degraded, or incipient:
9
• “Critical failure: A failure which causes immediate and complete loss of an equipment/sub-‐item or components unit’s capability of providing its output.
• Degraded failure: A failure which is not critical, but it prevents the equipment unit/sub-‐item or component from providing its output within specifications. Such a failure would usually, but not necessarily, be gradual or partial, and may develop into a critical failure in time.
• Incipient failure: A failure which does not immediately cause loss of an equipment unit/sub-‐item or components capability of providing its output, but which, if not attended to, could result in a critical or degraded failure in the near future.” (SINTEF, 2009)
Failure modes of the components are not registered before 3 months of operation in the purpose to eliminate infant mortalities, since the data is exponentially distributed.
With the failure data mainly collected from maintenance records, both component specific failures and common cause failures are included. This also implies that failures such as spurious trips are not included, because such false alarms should not require any maintenance.

Overview of Subsea Xmas Tree Systems and Statistical Review
11
3 OVERVIEW OF SUBSEA XMAS TREE SYSTEMS AND STATISTICAL REVIEW
3.1 INDUSTRY REQUIREMENTS When a manufacturer is involved in a new project, the first step is to define the requirements and specifications relevant for that particular project. The requirements are specified in the laws and regulations of the countries involved, the standards are stipulated in the customer requirements and in internal standards and requirements within the organization involved. Subsea production system poses a hazard. It is therefor vital to have standards that give guidance to maintain secure operations and prevent major accidents.
Applicable standards for the XT requirements include:
1. API 6A: Specification for Wellhead and Christmas Tree Equipment; 2. API 17D: Design and Operation of Subsea Production Systems-‐Subsea
Wellhead and Tree Equipment; 3. ISO 13628-‐4: Petroleum and natural gas industries – Design and operation
of subsea production systems. Part 4: Subsea wellhead and tree equipment; 4. ISO 10423:2009: Petroleum and natural gas industries -‐ Drilling and
production equipment -‐ Wellhead and christmas tree equipment.
Additionally, three standards have been considered for the use of reliability data and for well integrity:
5. ISO 14224: Petroleum, petrochemical and natural gas industries -‐ Collection and exchange of reliability and maintenance data for equipment;
6. NORSOK Z-‐016: Regularity management & reliability technology; 7. NORSOK D-‐010: Well integrity in drilling and well operations.
The standards stippled has been reviewed and actively used throughout the thesis to understand and to get knowledge about the XTs and the associated functions and requirements.
Chapter 3
12
3.2 ACCIDENT AND STATISTICAL REVIEW
3.2.1 ACCIDENT REVIEW History shows that uncontrolled release of hydrocarbons has caused several major accidents. Experience from major accidents is an important source of information to prevent similar accidents in the future. Incidents that potentially could have led to a major accident are also important in the preventive work. Unfortunately, incidents with the potential of a major accident are often unreported and well hidden by operators.
A damaged WH or XT is a serious incident, which potentially can evolve into an uncontrolled release of hydrocarbons. An XT may be damaged by external impact, such as dropped objects, trawling activities and anchors or by wear over time or immediately, such as corrosion, internal overpressure, erosion and so on. With subsea WH and XTs being located without immediate well access from a host topside facility, a leakage may cause environmental and commercial impact, but usually no safety impact.
In-‐field experiences contain information regarding failures that have occurred and the potential consequences. There is a big amount of learning potential in accidents or other unwanted events to improve safety and reliability of a system. As an example, this was demonstrated for the major Macondo blowout in 2010 for the BOP system. Worldwide, the XT alone have not had any failures during production that have led to major accidents. This does not mean that major accidents cannot happen due to XT failures – even more so, with no major accident to learn from or even remember, operators may become inattentive and incidents may occur leading to a major accident due to lack of awareness.
Overview of Subsea Xmas Tree Systems and Statistical Review
13
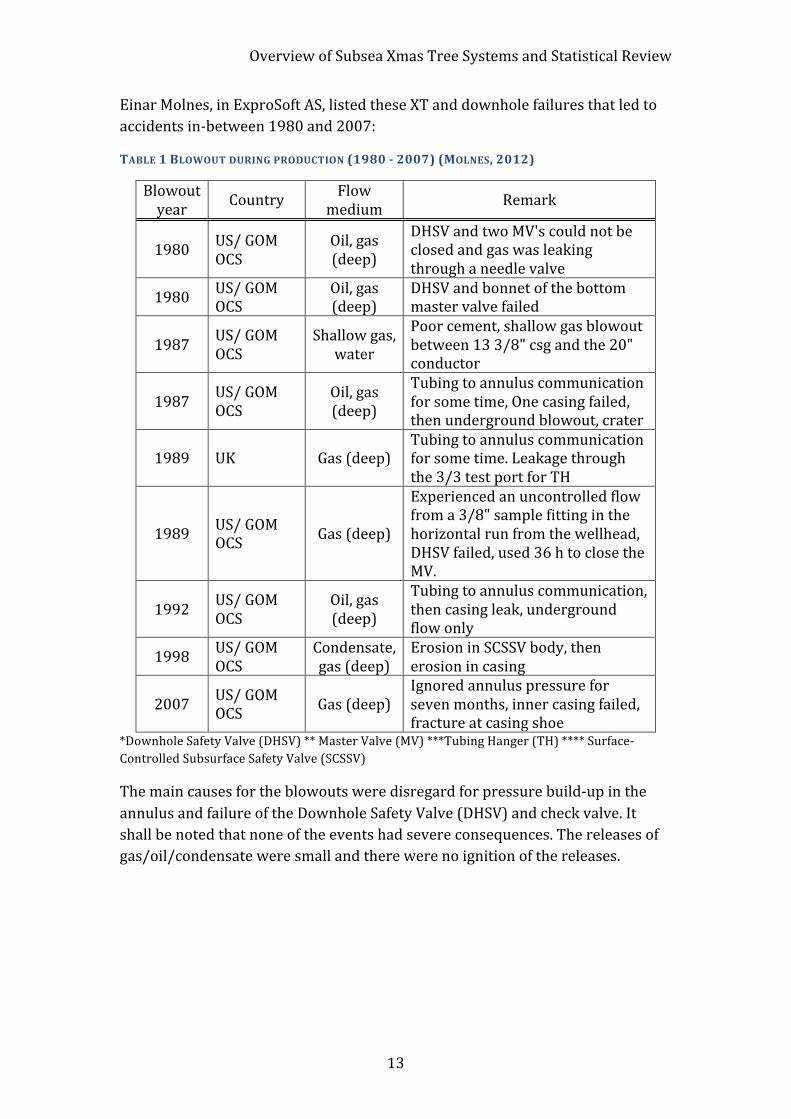
Einar Molnes, in ExproSoft AS, listed these XT and downhole failures that led to accidents in-‐between 1980 and 2007:
TABLE 1 BLOWOUT DURING PRODUCTION (1980 -‐ 2007) (MOLNES, 2012)
Blowout year Country Flow
medium Remark
1980 US/ GOM OCS
Oil, gas (deep)
DHSV and two MV's could not be closed and gas was leaking through a needle valve
1980 US/ GOM OCS
Oil, gas (deep)
DHSV and bonnet of the bottom master valve failed
1987 US/ GOM OCS
Shallow gas, water
Poor cement, shallow gas blowout between 13 3/8" csg and the 20" conductor
1987 US/ GOM OCS
Oil, gas (deep)
Tubing to annulus communication for some time, One casing failed, then underground blowout, crater
1989 UK Gas (deep) Tubing to annulus communication for some time. Leakage through the 3/3 test port for TH
1989 US/ GOM OCS Gas (deep)
Experienced an uncontrolled flow from a 3/8" sample fitting in the horizontal run from the wellhead, DHSV failed, used 36 h to close the MV.
1992 US/ GOM OCS
Oil, gas (deep)
Tubing to annulus communication, then casing leak, underground flow only
1998 US/ GOM OCS
Condensate, gas (deep)
Erosion in SCSSV body, then erosion in casing
2007 US/ GOM OCS Gas (deep)
Ignored annulus pressure for seven months, inner casing failed, fracture at casing shoe
*Downhole Safety Valve (DHSV) ** Master Valve (MV) ***Tubing Hanger (TH) **** Surface-‐Controlled Subsurface Safety Valve (SCSSV)
The main causes for the blowouts were disregard for pressure build-‐up in the annulus and failure of the Downhole Safety Valve (DHSV) and check valve. It shall be noted that none of the events had severe consequences. The releases of gas/oil/condensate were small and there were no ignition of the releases.
Chapter 3
14
3.2.2 STATISTICAL REVIEW The suppliers of equipment reflect upon the accuracy of the databases established, such as OREDA.
There is a gap in-‐between contractors and third party verification when calculating reliability on XT equipment and the like. If reliability is calculated purely based on the OREDA handbook, one typically finds a MTTF for XT retrieval between 15 to 25 years. If one calculates the reliability by meeting the databases with field experience and professional engineering judgement, one applies a more detailed information set and unsurprisingly get another result, tending to give a more realistic reliability picture. Out of a population of XTs, the MTTF may be in-‐between 100-‐150 years when looking at a population of XTs spanning more or less 15 years in operation. Of the failure occurring on XTs, GE Oil & Gas, which has initiated this theme for a thesis, has indicated that a Pareto-‐type rule seems to apply to partition. This mean that the majority (80 %) of the failures can be restored by light intervention means such as Remotely Operated Vehicle (ROV) override, while only the minority (20 %) of the failures would require XT retrieval and thus represents the more costly failures.
There is an understanding among engineers with massive experience on XTs that maximum 1/3 of the XTs that returns to yard/factory for refurbishment are actually caused by XT equipment failures. It is believed that downhole workover operations, sidetrack drilling and the like would cause the majority of XT retrievals. The source for this information is a written, but informal, mail correspondence within chief engineers in GE Oil & Gas based on their experience on trees globally. Although this is not information new calculations can be based directly on, but it is natural to raise the question whether some equipment failures that is included in reliability data collecting tools such as OREDA is a result of failures not yet occurred?
Once the XT is retrieved to the surface due to downhole workover operations, the operators install a spare XT instead of re-‐installing the originally operating XT. Further, the XT that was operating and functioning is sent to the yard/factory for refurbishment and repaired upon failures not yet occurred. These incidents may have been recorded as XT equipment critical failures in reliability databases such as OREDA, but is not likely to be a significant error source. However, that is misleading information, originating in a lack of interference between contractor, operator and service centers. This is more likely related to inaccurate information on criticality/effect of failure and the resulting activities required to resolve the problem.
There are few (none) public available reports found on this subject. This is not a surprising finding due to confidentiality practices on such issues. A review of Xmas Tree experience provided by GE Oil & Gas is elaborated on in the two
Overview of Subsea Xmas Tree Systems and Statistical Review
15
followed sections. These experience data is used for top-‐down calculations for XT retrieval for comparison of the results on the bottom-‐up approach conducted on the case study.
3.2.3 REVIEW OF XT FIELD DATA PERFORMED IN 1999 A study conducted by Endre Willmann in ABB (now GE Oil & Gas) in 1999 reviewed three different studies evaluating in-‐field XT experiences, which is elaborated underneath:
UKCS Well Intervention Experience – BP study BP conducted an analysis of the subsea operational experiences of UKCS Operators. The survey that was carried out included experiences from 22 subsea fields from 1975 to 1990, from eight operators in the UK Sector of the North Sea. The study was initiated due to doubtful accuracy regarding operating cost estimates for new subsea fields. The survey aimed at providing source operating data in order to improve accuracy of operating cost forecasts for subsea fields.
The study concluded that the average intervention frequency per well year is 0.2, corresponding to a MTBF of 5 years per well.
Out of the subsea fields investigated, the main reasons for the well interventions are:
1. 55% Voluntary interventions for reservoir reasons such as logging, re-‐perforation, gas lift repositioning and water shutoff.
2. 23% Downhole failure, generally SCSSV replacement (85%), including replacement by wireline set valve.
3. 15% Seafloor failure, normally Xmas tree (50%), Subsea Control Module (SCM) (30%) and pipelines and umbilicals (20%).
4. 7% Consequential failure where workover must be repeated.
By relating the numbers above to the average intervention frequency per well (0.2), indicative MTBF estimates are:
• Downhole failure: MTBF = 22 years • SCSSV failure: MTBF = 26 years • Xmas tree replacement: MTBF = 67 years
The tree replacement is calculated based on that all of the tree failures resulted in tree retrieval, because the information was not obtained otherwise. It is a conservative approach to assume that all tree failures resulted in tree retrieval.
Over a period of 646 well years, spanning 15 years of operation, the average frequency of subsea interventions per well year stayed surprisingly constant. No distinct wear-‐out was identified.

Chapter 3
16
In general, the interventions were carried out in order to improve/restore production of a failing well. Hence, for the subsea equipment, intervention was only registered if the failure that occurred affected production.
Xmas Tree Experience – Tordis and Vigdis As a part of a Technology Agreement between Sage Petroleum and ABB, a study on Reliability, Availability and Maintainability (RAM) optimization of subsea production systems has been established. The objective was to analyze the collected reliability data from Tordis and Vigdis (now operated by Statoil) and recommend improvements with respect to design, testing, organization and supplier/customer interaction.
For the subsea equipment at Tordis and Vigdis, a total of 31 well years are reviewed with 38 failures recorded, whereof none critical (i.e. no XT retrieval recorded). The data is collected for failures both prior to and during production.
When the study was conducted, Tordis and Vigdis were rather new installations, meaning that the bulk of data collected relates to early-‐life history.
The study concludes that for the steady-‐state operation period for the XTs, an MTBF of 46 years can be recommended. The estimate is a 50/50 estimate based on no critical failures experienced from the 31 well years registered.
Xmas Tree Experience – Snorre Evaluation The XT experience on Snorre was evaluated by looking at data registered for the field in the OREDA IV and III database.
According to the OREDA IV database, the total failure rate for the XT system is 31.3 failure per million hours (fpmh), where 10% (3 out of 31 failures) of the failures are classified as critical.
For the OREDA III database, the corresponding number is 14.26 fpmh, where 13 % (2 out of 16 failures) failures were classified as critical.
By combining the OREDA III and IV data, weighting the experienced data to both sets with 50%, yields a critical failure rate of 2.43 fpmh for the XT system. This corresponds to a MTBF of 47 years.
The estimate corresponds to five critical XT failures for the total of 241 well years registered. However, none of these failures required XT retrieval in order to maintain production. The least significant downtime related to these five failures was on an incident related to spurious operation of the Production Wing Valve (PWV), resulting in a one-‐hour downtime.
Overview of Subsea Xmas Tree Systems and Statistical Review
17
ABB summarize the OREDA data registered in the database by:
• “Failure rate contribution classified by sub system: 52 % valves, 3 % subsea wellhead and 45 % other XT components
• Failure rate contribution classified by criticality at equipment unit level: 10 % critical, 45 % degraded and 45 % incipient.
• Spurious closure of a WV due to an actuator failure has been registered, yielding a MTBF of 156 years. However, due to scarce experience, this value may well be under/over estimated.
• Typical actual repair time for XT failures is in the order of 80-‐100 hours. • The total problem rate for a XT (incl. uncritical failures) is 31 fpmh (3.6
years MTBF).”
Xmas Tree Experience – Snorre and BP Study By combining the OREDA III/IV data and the BP-‐study data (conservatively assuming all nine critical XT failures did result in XT retrieval) weighting the experienced data to both sets equally with 50 %, yields nine XT retrievals within the total of 887 well years. This corresponds to 1.16 fpmh and a MTBF of 98.6 years.
3.2.4 REVIEW OF XT FIELD DATA PERFORMED IN 2014 The source for this information is a written, but informal, mail correspondence within chief engineers in GE Oil & Gas, the XT statistics were treated for GE Oil & Gas projects offshore in Angola and four reference fields in the North Sea. This is not information that can be based directly on, but it is natural to raise the question of the amount of XT failures that result in XT retrieval when reviewing the estimated MTTF’s.
Xmas Tree Experience – Offshore in Angola The three reference fields offshore in Angola are posting strong figures for the XT retrieval rate.
For the CVXTs in Angola these are the XTs accounted for:
• Ref. Project 1 ≈ 30 XTs Average start-‐up 2002 ≈ 360 years total • Ref. Project 2 ≈ 20 XTs Average start-‐up 2006 ≈ 160 years total • Ref. Project 3 ≈ 10 XTs Average start-‐up 2008 ≈ 60 years total • Total ≈ 60 XTs ≈ 580 years total
Chapter 3
18
For the last 12 years, approximately 10 XTs has been recovered from these fields in Angola. Whereas;
• Five recovered due to side-‐track drilling • One recovered due to leak between the master valve block and the
production wing block • One recovered after installation as the ROV sheared the S.I.V extension
rod • Three recovered as well was being re-‐spudded
This is groundbreaking good numbers that indicate a MTBF of 580 years. Only 10 % (one out of ten retrievals) of the failures that occurred were due to critical XT failures. 10 % of the other failures were due to downhole failure, whilst 80 % of the retrievals were due to voluntary interventions for reservoir reasons.
Xmas Tree Experience – North Sea For the four North Sea reference projects, all operated by Statoil, it is installed approximately 75 XTs. During the last four years, 23 XTs have been overhauled for these fields.
More specifically, the overhauls for these three fields the last 4 years are:
• 2010: 5 XTs • 2011: 5 XTs • 2012: 5 XTs • 2013: 8 XTs
Also included in these numbers are unutilized XTs that have been overhauled due to they have been stored since 2000 to 2002.
Overview of Subsea Xmas Tree Systems and Statistical Review
19
3.3 XMAS TREE FUNCTIONAL REQUIREMENTS The subsea Xmas Tree (XT) is located on the top of the wellhead, providing an interface between the completion string and the piping towards the process system. At its simplest, an XT can be defined as an assembly of valves and fittings used for production or injection to control the flow of product, chemicals, water or gas from a well. The injection system, production control system, downhole control system and monitoring and flow control system are all systems controlled through the XT assembly.
Typical functional requirements include:
• Control of flow by directing hydrocarbons from the well to the flowline (called production tree) or by canalizing water or gas into the reservoir to maintain reservoir pressure (called injection tree);
• Regulate the fluid flow through a choke; • Monitor well parameters, such as temperature, annulus pressure, well
pressure and flow composition; • Act as a barrier between the reservoir and the environment; • Safely open and shut down the fluid flow through the assembly of valves; • Inject protection fluids, such as inhibitors for corrosion and hydrate
prevention, to protect the subsea equipment and to assist the flow;
Each XT is designed for the individual reservoir conditions and for the possible facility solutions available, which means that the configuration, size, weight and cost for a XT will differ from one offshore field to another due to the specific design requirements. The optimum XT will be driven by reservoir requirements and therefor never completely standardized. However, there is a strong trend towards smaller, more compact XTs in the industry.
3.4 TYPES AND CONFIGURATIONS OF XMAS TREES XTs may be segmented into two main types: Vertical Xmas Tree (VXT) and Horizontal Xmas Tree (HXT). The Subsea Engineering Handbook, written by Yong Bai and Qjang Bai in 2012, is the main source for the background information about the trees in the following sections.
3.4.1 VERTICAL XMAS TREE The conventional XT, which is the VXT, is the earliest and most extensively used XT. A VXT are installed either on a wellhead or on a tubing head, after the subsea tubing-‐hanger has been installed through the drilling BOP stack and landed and locked into the wellhead or in the tubing head. The production flow path is through the valves mounted in the vertical bore(s) and out of the top of the tree during workover and testing or during production (injection) via the production outlet that branches off the vertical bore (ISO 13628-‐4, 2010).
Chapter 3
20
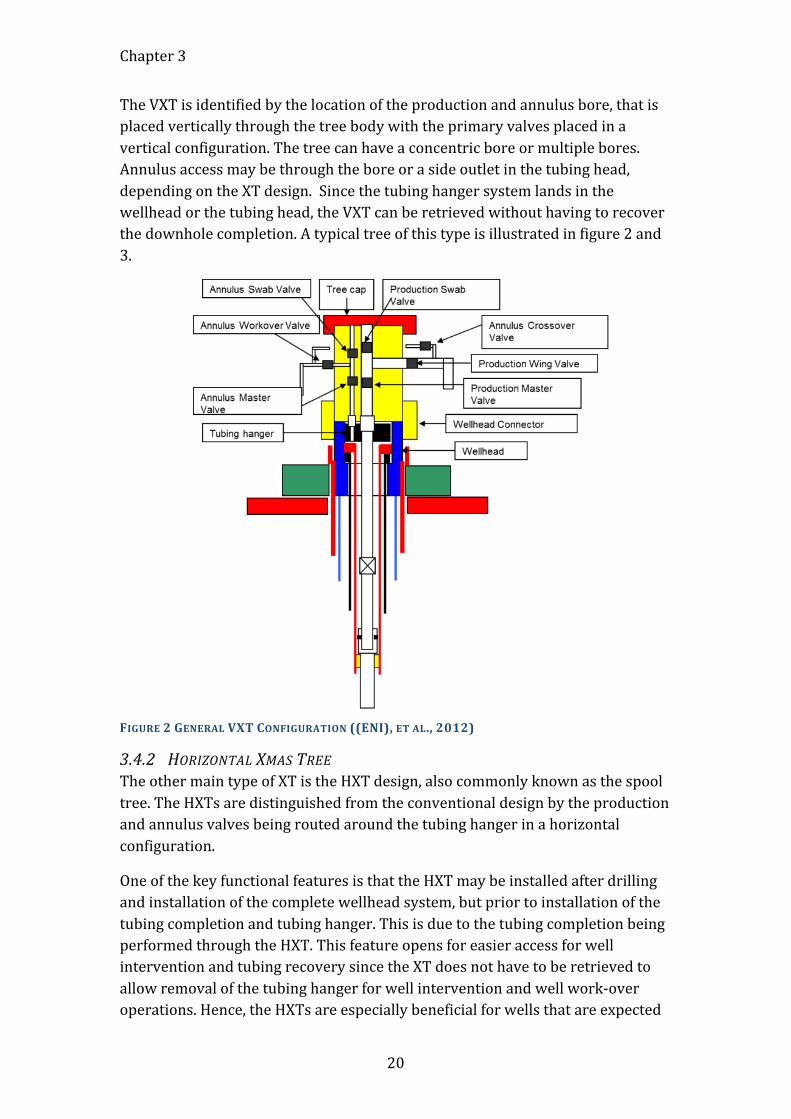
The VXT is identified by the location of the production and annulus bore, that is placed vertically through the tree body with the primary valves placed in a vertical configuration. The tree can have a concentric bore or multiple bores. Annulus access may be through the bore or a side outlet in the tubing head, depending on the XT design. Since the tubing hanger system lands in the wellhead or the tubing head, the VXT can be retrieved without having to recover the downhole completion. A typical tree of this type is illustrated in figure 2 and 3.
FIGURE 2 GENERAL VXT CONFIGURATION ((ENI), ET AL., 2012)
3.4.2 HORIZONTAL XMAS TREE The other main type of XT is the HXT design, also commonly known as the spool tree. The HXTs are distinguished from the conventional design by the production and annulus valves being routed around the tubing hanger in a horizontal configuration.
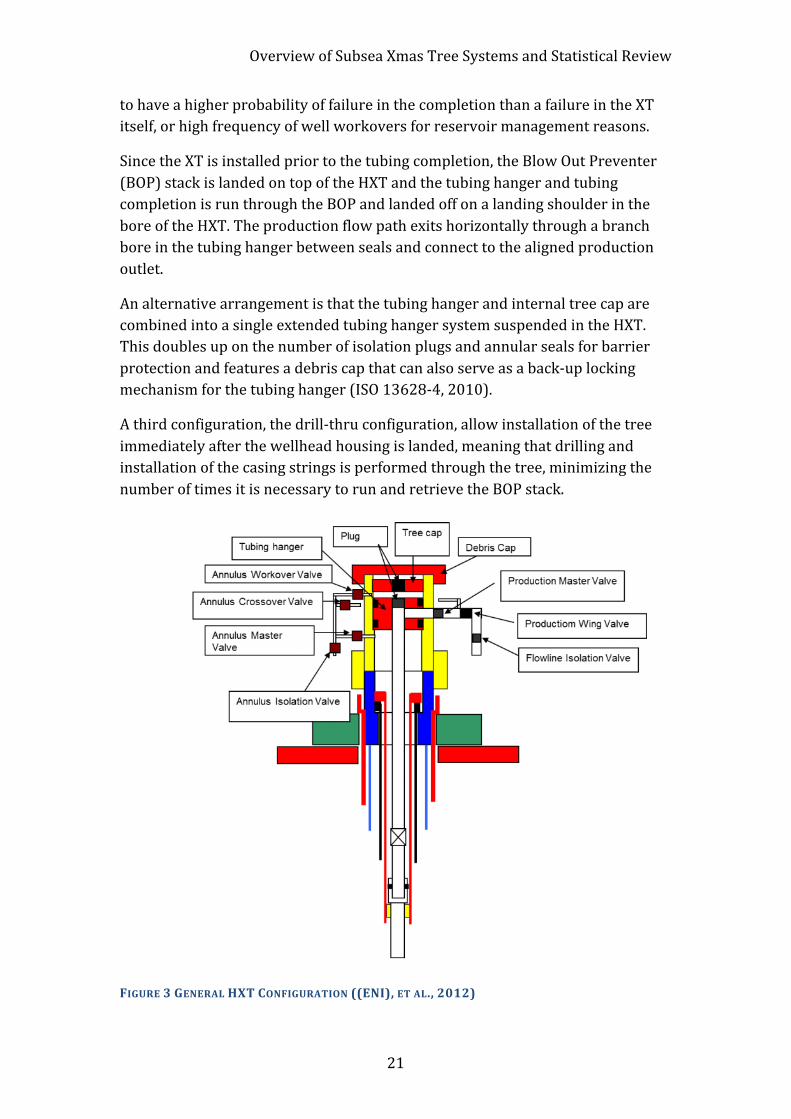
One of the key functional features is that the HXT may be installed after drilling and installation of the complete wellhead system, but prior to installation of the tubing completion and tubing hanger. This is due to the tubing completion being performed through the HXT. This feature opens for easier access for well intervention and tubing recovery since the XT does not have to be retrieved to allow removal of the tubing hanger for well intervention and well work-‐over operations. Hence, the HXTs are especially beneficial for wells that are expected
Overview of Subsea Xmas Tree Systems and Statistical Review
21
to have a higher probability of failure in the completion than a failure in the XT itself, or high frequency of well workovers for reservoir management reasons.
Since the XT is installed prior to the tubing completion, the Blow Out Preventer (BOP) stack is landed on top of the HXT and the tubing hanger and tubing completion is run through the BOP and landed off on a landing shoulder in the bore of the HXT. The production flow path exits horizontally through a branch bore in the tubing hanger between seals and connect to the aligned production outlet.
An alternative arrangement is that the tubing hanger and internal tree cap are combined into a single extended tubing hanger system suspended in the HXT. This doubles up on the number of isolation plugs and annular seals for barrier protection and features a debris cap that can also serve as a back-‐up locking mechanism for the tubing hanger (ISO 13628-‐4, 2010).
A third configuration, the drill-‐thru configuration, allow installation of the tree immediately after the wellhead housing is landed, meaning that drilling and installation of the casing strings is performed through the tree, minimizing the number of times it is necessary to run and retrieve the BOP stack.
FIGURE 3 GENERAL HXT CONFIGURATION ((ENI), ET AL., 2012)
Chapter 3
22
3.4.3 COMPARISON OF HORIZONTAL AND VERTICAL XMAS TREES An ongoing debate within the XT industry is comparing the relative merits of VXT and HXT systems. For the last 20 years the HXT has been the preferred design for deepwater fields, while in recent years the focus in the industry is returning to the conventional VXT system.
A key requirement when designing a XT is that access to the annulus is enabled between the production bore and the casing. This is an important feature for a number of reasons, such as pressure monitoring and gas lift means. As an example, any pressure build-‐up in the annulus may be bled into the production bore via a crossover loop.
The original design of the VXT and the Tubing Hanger (TH) were a dual-‐bore configuration. Prior to removal of the BOP it was then necessary to set plugs in both the production bore and the annulus bore. Access to the bores is handled with a dual-‐bore riser or a landing string. The handling and operation with dual-‐bore systems compared to monobore systems are more complex and time-‐consuming, and then again more costly.
In an HXT configuration access to the annulus is incorporated in the tree design and controlled by valves rather than plugs. This enables operation with monobore systems, which means less complex riser or landing string. Easier access to the annulus enables operations that can deliver significant advantages, particularly in deepwater (White, 2013).
Regarding installation and intervention, both VXT and HXT systems use a landing string to run the completion through the BOP. In the HXT configuration, the tree is normally run on a subsea test tree within the marine riser to carry out a number of critical functions. Once the hanger is landed inside the landing shoulders in the tree, it is critical to ensure communication of electric and hydraulic downhole functions. The TH is landed passively inside the tree without relying on external input using an orientation sleeve.
Before production, after a well is completed, it is common practice to flow the well fluid to the drilling rig to clean up the well or to carry out a well test. For the HXT systems this is carried out through the subsea test tree and a marine riser. The primary function of the test tree ensures that, if necessary to disconnect the rig from the BOP during testing or cleanup, the test tree will close the valves and an emergency disconnect will be performed safely.
In the case of the VXT system, the completion is run on a landing string incorporating a tool that run, lock and orientate the TH. This orientation requires a tool to interface with a pin installed inside the BOP. Once the TH is oriented and installed inside the wellhead, with the understanding that when the tree is oriented and landed on the wellhead, the communication of all electric and
Overview of Subsea Xmas Tree Systems and Statistical Review
23
hydraulic downhole functions will function. Well cleanup and testing is then carried out after a dedicated test package and an open-‐water riser replace the BOP. This test package comprises a Lower Riser Package (LRP) and an Emergency Disconnect Package (EDP), enabling the rig or vessel to disconnect safely in the case of an emergency in the same way as a test tree.
It is worth mentioning that such test packages and open-‐water riser systems represent considerable capital investments, typically in order tens of million dollars (White, 2013). Test trees can be rented on the open marked on a per-‐day or per-‐well basis, resulting in a much lower capital investment.
Currently, most tree systems are being installed on cable (tree on wire) and do not require either open water riser or marine riser and subsea BOP. This is dependent on the completion method (Statoil ASA, 2013)
These logics led to the introduction of Tubing Head Spools (THS) for use with a conventional tree, thereby giving many of the advantages earlier only available with the HXTs.
A special configuration is called a Deepwater Vertical Xmas Tree (DVXT) and is the XT used in further analysis in this thesis. The DVXT is elaborated on in chapter 4: Case Study.
3.4.4 SELECTION CRITERIA When selecting between a HXT or a VXT for a given project, several considerations have to be made.
If the well is completed before the XT configuration is selected, the design need to be VXT, since the TH already will be installed in the wellhead. If a HXT is preferred, the well cannot be completed before installation of the XT.
Complex wells that will require frequent workovers that require retrieval of the TH, the HXT configuration is beneficial. This means that the HXT is preferred if the well will have a lower reliability then the XT. Conversely, the VXT is preferred for simple reservoirs where the risk of tubing retrieval is low over the life span of the well. Gas reservoirs are an example where well interventions are rarely needed and the VXT should be the preferred design.
It should also be noted that the VXT is larger and heavier then the HXT, whilst the HXT is more expensive. The size and weight of the XT is an important factor since the vessel used for installation and intervention might have a limited moonpool and/or crane.
Chapter 3
24
3.5 MAIN COMPONENTS OF A XMAS TREE SYSTEM
3.5.1 GENERAL COMPONENTS OF A XT SYSTEM Typical main components in an XT assembly required to perform its functions include:
• Tubing Hanger • Tubing Head Spool (Not mandatory unless the configuration is a DVXT) • Tree piping • Flowline connector • Wellhead connector • Valves and fittings • Choke • Tree cap • Tree frame
The components are further described in chapter 4: Case Study: Deepwater Vertical Xmas T.
The tubing hanger, wellhead connector and the valves are described underneath for an introduction to different variations of these components that is not a part of the case study.
3.5.2 TUBING HANGER The Tubing Hanger (TH) system is designed to suspend and seal the downhole tubing. The TH shall be possible to be installed through a BOP stack and locked into the internal landing profile of either the casing hanger in the wellhead, the tree bore or in the THS.
The TH shall provide the means of communication between the XT and the downhole hydraulic and electric functionalities. Wet mate couplers/connectors are located on the top and bottom of the hanger and engage with the XT and the downhole equipment.
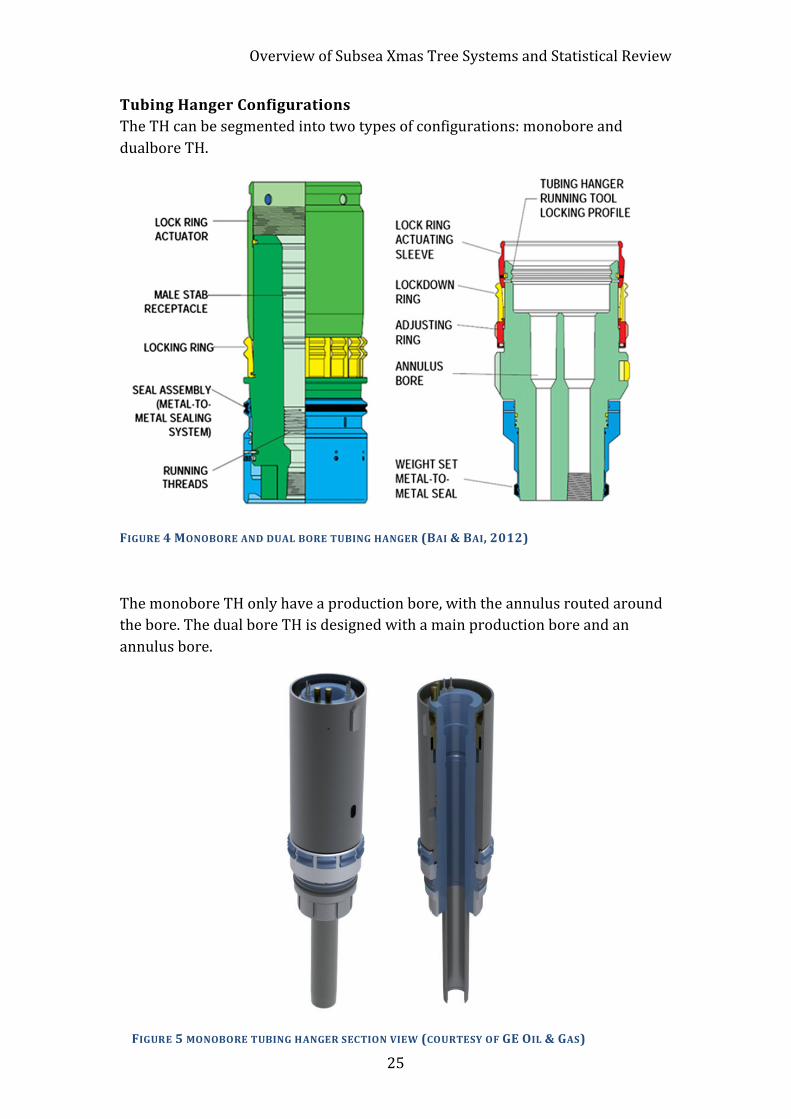
Overview of Subsea Xmas Tree Systems and Statistical Review
25
Tubing Hanger Configurations The TH can be segmented into two types of configurations: monobore and dualbore TH.
FIGURE 4 MONOBORE AND DUAL BORE TUBING HANGER (BAI & BAI, 2012)
The monobore TH only have a production bore, with the annulus routed around the bore. The dual bore TH is designed with a main production bore and an annulus bore.
FIGURE 5 MONOBORE TUBING HANGER SECTION VIEW (COURTESY OF GE OIL & GAS)
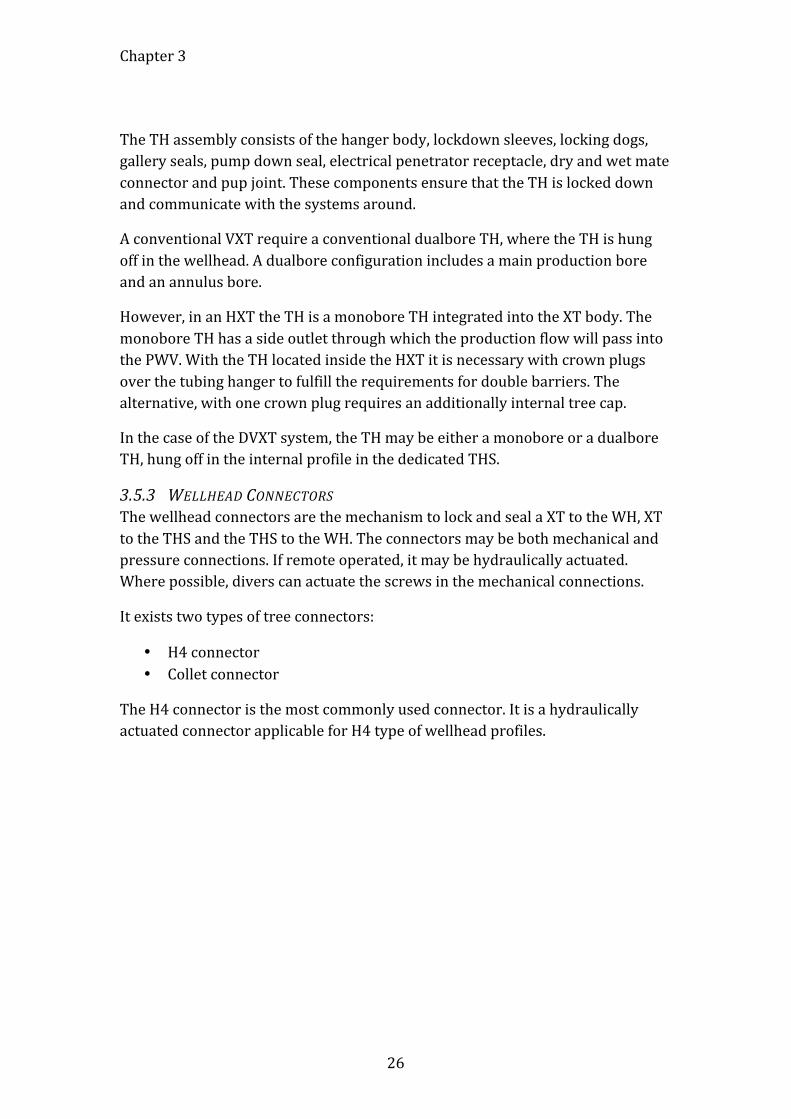
Chapter 3
26
The TH assembly consists of the hanger body, lockdown sleeves, locking dogs, gallery seals, pump down seal, electrical penetrator receptacle, dry and wet mate connector and pup joint. These components ensure that the TH is locked down and communicate with the systems around.
A conventional VXT require a conventional dualbore TH, where the TH is hung off in the wellhead. A dualbore configuration includes a main production bore and an annulus bore.
However, in an HXT the TH is a monobore TH integrated into the XT body. The monobore TH has a side outlet through which the production flow will pass into the PWV. With the TH located inside the HXT it is necessary with crown plugs over the tubing hanger to fulfill the requirements for double barriers. The alternative, with one crown plug requires an additionally internal tree cap.
In the case of the DVXT system, the TH may be either a monobore or a dualbore TH, hung off in the internal profile in the dedicated THS.
3.5.3 WELLHEAD CONNECTORS The wellhead connectors are the mechanism to lock and seal a XT to the WH, XT to the THS and the THS to the WH. The connectors may be both mechanical and pressure connections. If remote operated, it may be hydraulically actuated. Where possible, divers can actuate the screws in the mechanical connections.
It exists two types of tree connectors:
• H4 connector • Collet connector
The H4 connector is the most commonly used connector. It is a hydraulically actuated connector applicable for H4 type of wellhead profiles.
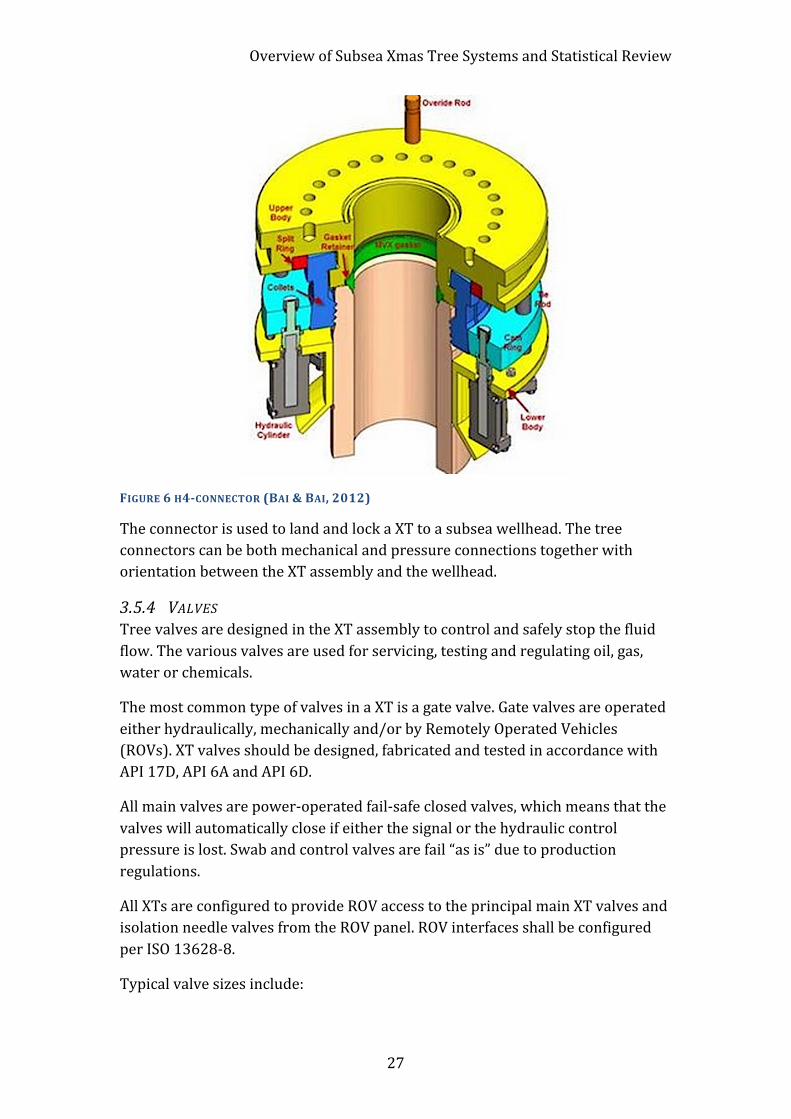
Overview of Subsea Xmas Tree Systems and Statistical Review
27
FIGURE 6 H4-‐CONNECTOR (BAI & BAI, 2012)
The connector is used to land and lock a XT to a subsea wellhead. The tree connectors can be both mechanical and pressure connections together with orientation between the XT assembly and the wellhead.
3.5.4 VALVES Tree valves are designed in the XT assembly to control and safely stop the fluid flow. The various valves are used for servicing, testing and regulating oil, gas, water or chemicals.
The most common type of valves in a XT is a gate valve. Gate valves are operated either hydraulically, mechanically and/or by Remotely Operated Vehicles (ROVs). XT valves should be designed, fabricated and tested in accordance with API 17D, API 6A and API 6D.
All main valves are power-‐operated fail-‐safe closed valves, which means that the valves will automatically close if either the signal or the hydraulic control pressure is lost. Swab and control valves are fail “as is” due to production regulations.
All XTs are configured to provide ROV access to the principal main XT valves and isolation needle valves from the ROV panel. ROV interfaces shall be configured per ISO 13628-‐8.
Typical valve sizes include:
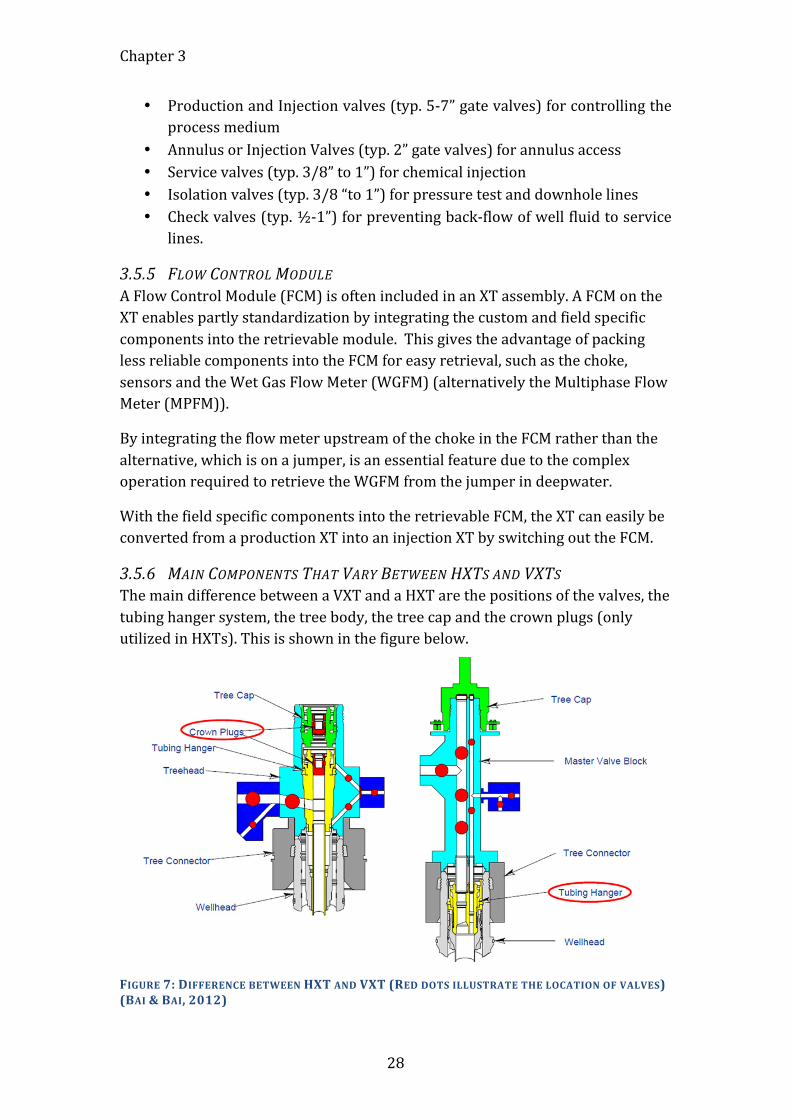
Chapter 3
28
• Production and Injection valves (typ. 5-‐7” gate valves) for controlling the process medium
• Annulus or Injection Valves (typ. 2” gate valves) for annulus access • Service valves (typ. 3/8” to 1”) for chemical injection • Isolation valves (typ. 3/8 “to 1”) for pressure test and downhole lines • Check valves (typ. ½-‐1”) for preventing back-‐flow of well fluid to service
lines.
3.5.5 FLOW CONTROL MODULE A Flow Control Module (FCM) is often included in an XT assembly. A FCM on the XT enables partly standardization by integrating the custom and field specific components into the retrievable module. This gives the advantage of packing less reliable components into the FCM for easy retrieval, such as the choke, sensors and the Wet Gas Flow Meter (WGFM) (alternatively the Multiphase Flow Meter (MPFM)).
By integrating the flow meter upstream of the choke in the FCM rather than the alternative, which is on a jumper, is an essential feature due to the complex operation required to retrieve the WGFM from the jumper in deepwater.
With the field specific components into the retrievable FCM, the XT can easily be converted from a production XT into an injection XT by switching out the FCM.
3.5.6 MAIN COMPONENTS THAT VARY BETWEEN HXTS AND VXTS The main difference between a VXT and a HXT are the positions of the valves, the tubing hanger system, the tree body, the tree cap and the crown plugs (only utilized in HXTs). This is shown in the figure below.
FIGURE 7: DIFFERENCE BETWEEN HXT AND VXT (RED DOTS ILLUSTRATE THE LOCATION OF VALVES) (BAI & BAI, 2012)
Overview of Subsea Xmas Tree Systems and Statistical Review
29
3.5.7 XMAS TREE-‐MOUNTED CONTROLS The Subsea Control Module (SCM) is a part of the production control system and controls all hydraulically actuated valves and monitoring equipment located on the XT and downhole in the well. In addition, the SCM collects signals from manifold and topside/onshore (FMC Technologies, 2013).
The SCM contains all control valves, hydraulic pressure monitoring transducers and electronics. The SCM is located on XT and/or manifold, depending the field design. The SCM is landed and locked onto the SCM Mounted Base (SCMMB), located on the XT or the manifold body.
ISO 14224:2006 stipulates that the SCM and other control system parts can be considered outside the scope of the XT system or as subunits or maintainable units of the XT system.
3.6 XMAS TREE INSTALLATION AND SERVICE CONDITIONS
3.6.1 XMAS TREE INSTALLATION An XT can be installed either by a drill-‐pipe or by a crane through a moon pool at a rig or a vessel, depending on the size of the XT. The vessel may be a jack-‐up, semisubmersible or a drillship. Both VXT and HXT systems use a landing string through the BOP stack to run the completion.
Typical procedures for installing the VXT and the HXT system are as follows (Bai & Bai, 2012):
Chapter 3
30
VXT:
• Perform pre-‐installation tree tests.
• Skid tree to moon pool. • Push guide wired into tree
guide arms. • Install lower riser package
and emergency disconnect package (EDP) on tree at moon pool area.
• Connect the installation and workover control system (IWOCS)
• Lower the tree to the guide base with tubing risers
• Lock the tree onto the guide base. Test the seal gasket.
• Perform tree valve functions with the Installation and Workover Control System (IWOCS).
• Retrieve the tree running tool.
• Rune the tree cap on the drill pipe with the utility running tool system.
• Lower the tree cap to the subsea tree.
• Land and lock the tree cap onto the tree mandrel.
• Lower the corrosion cap onto the tree cap with a drill pipe (or lifting wires). Some suppliers have developed ROV-‐installed corrosion caps.
HXT:
• Complete drilling • Retrieve the drilling riser and
BOP stack; move the rig off • Retrieve drilling guide base • Run the Production Guide
Base (PGB) and latch onto the wellhead
• Run the subsea HXT • Land tree, lock connector,
test seal function valves with an ROV, release tree running tool.
• Run the BOP stack onto the HXT; lock the connector
• Run the tubing hanger; perform subsea well completion; unlatch the Tubing Hanger Running Tool (THRT).
• Run the internal tree cap by wireline through the riser and BOP; retrieve THRT.
• Retrieve BOP stack. • Install debris cap. • Prepare to start the well.
Overview of Subsea Xmas Tree Systems and Statistical Review
31
3.6.2 SERVICE CONDITIONS The pressure ratings for XTs are standardized to 5000 psi, 10000 psi and 15000 psi. Recently there are also XTs constructed to apply for 20000 psi (ISO 13628-‐4, 2010).
Equipment shall be designed according to the material classes and temperature ratings required. These ratings are specified in API SPEC 6A and 17D. For further information, see these standards.
3.7 XMAS TREE DESIGN AND ANALYSIS Each XT design is driven by reservoir requirements, such as type of chemical injection needed. As an example, a gas reservoir is in the need of a constant stream of Mono Ethylene Glycol (MEG) to avoid formation of hydrates, while an oil reservoir require artificial lift methods to be able to recover the full potential of the well as the pressure decrease along with the extraction of hydrocarbons.
For each reservoir, it is necessary to conduct analyses for protection of the equipment. The analyses shall include the means of:
• Chemical injection • Cathodic protection • Insulation and coating • Structural loads • Thermal analysis
The kind of chemical injection chosen for a well depend upon the reservoir type and the fluid characteristics. The final objective is to be certain that the equipment produces economically from the reservoir to the production facilities throughout the whole lifecycle of the field development.
With the XT assembly constantly being exposed to the ambient sea conditions, it is crucial with sufficient anodes for cathodic protection. Detailed design of cathodic protection shall be carried out in accordance with the recommended practice DNV RP B401.
Thermal insulation is needed to ensure sufficient cooldown time in the event of a production stoppage. The main objective of thermal insulation is to have sufficient time to solve a shutdown problem and avoid the burden of the launching preservation sequence with associated production losses and to avoid dramatic consequences of hydrate formation with associated production losses.
Included in the insulation is a layer of corrosion coating suitable for working pressure, specified by project requirements.
The structures have to be designed so that they withstand internal and external structural loads imposed during installation and operation.
Chapter 3
32
According to the standard API RP 17D special XT load considerations should be analyzed for:
• “Dropped objects; • Marine riser and BOP loads; • Flowline connection loads; • Lifting loads; • Snagged tree frame, umbilicals or flowline; • Pressure induced loads.” (American Petroleum Institute (API), 2011)
3.8 TEST PROGRAM FOR XMAS TREES Factory Acceptance Test (FAT) shall be executed of all units pre-‐installation to ensure that the components of a unit and the unit itself satisfy all specified requirements to strength and functional performance (ISO 13628-‐4, 2010).
All assemblies are required to pass FAT before they are passed to stock, prepared for Extended Factory Acceptance Test (EFAT) or delivered directly to site for installation. Whenever equipment is moved from one site to another it will be subjected to a Site Receipt Test (SRT). The aim is to verify equipment received at site is in the same as before transportation state, with no deterioration occurred during transportation.
The comprehensive testing prior to installation largely eliminate early-‐life failure of equipment if executed thoroughly.
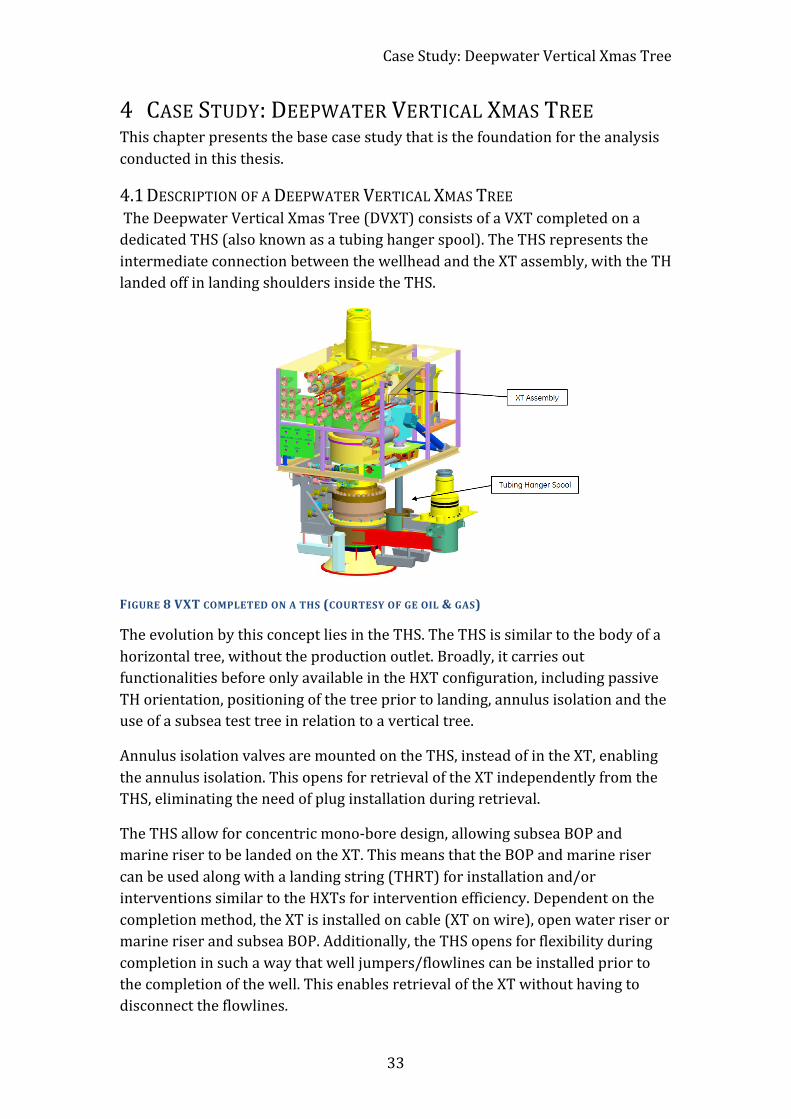
Case Study: Deepwater Vertical Xmas Tree
33
4 CASE STUDY: DEEPWATER VERTICAL XMAS TREE This chapter presents the base case study that is the foundation for the analysis conducted in this thesis.
4.1 DESCRIPTION OF A DEEPWATER VERTICAL XMAS TREE The Deepwater Vertical Xmas Tree (DVXT) consists of a VXT completed on a dedicated THS (also known as a tubing hanger spool). The THS represents the intermediate connection between the wellhead and the XT assembly, with the TH landed off in landing shoulders inside the THS.
FIGURE 8 VXT COMPLETED ON A THS (COURTESY OF GE OIL & GAS)
The evolution by this concept lies in the THS. The THS is similar to the body of a horizontal tree, without the production outlet. Broadly, it carries out functionalities before only available in the HXT configuration, including passive TH orientation, positioning of the tree prior to landing, annulus isolation and the use of a subsea test tree in relation to a vertical tree.
Annulus isolation valves are mounted on the THS, instead of in the XT, enabling the annulus isolation. This opens for retrieval of the XT independently from the THS, eliminating the need of plug installation during retrieval.
The THS allow for concentric mono-‐bore design, allowing subsea BOP and marine riser to be landed on the XT. This means that the BOP and marine riser can be used along with a landing string (THRT) for installation and/or interventions similar to the HXTs for intervention efficiency. Dependent on the completion method, the XT is installed on cable (XT on wire), open water riser or marine riser and subsea BOP. Additionally, the THS opens for flexibility during completion in such a way that well jumpers/flowlines can be installed prior to the completion of the well. This enables retrieval of the XT without having to disconnect the flowlines.
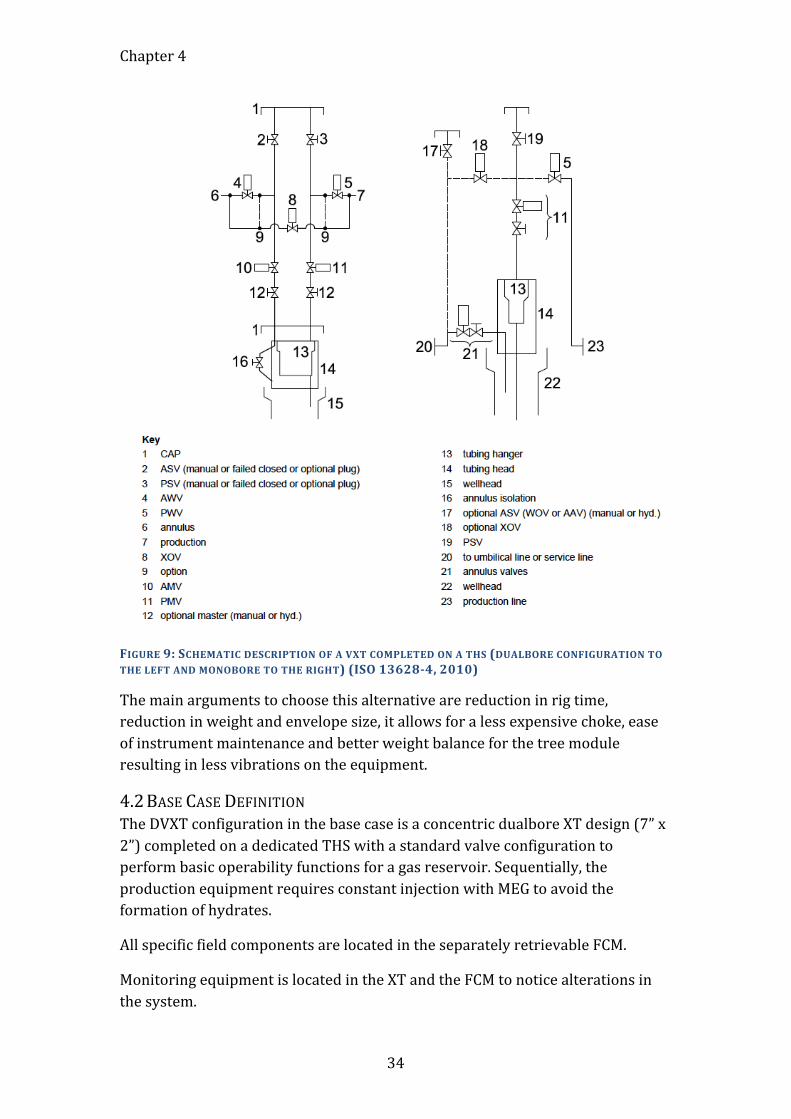
Chapter 4
34
FIGURE 9: SCHEMATIC DESCRIPTION OF A VXT COMPLETED ON A THS (DUALBORE CONFIGURATION TO THE LEFT AND MONOBORE TO THE RIGHT) (ISO 13628-‐4, 2010)
The main arguments to choose this alternative are reduction in rig time, reduction in weight and envelope size, it allows for a less expensive choke, ease of instrument maintenance and better weight balance for the tree module resulting in less vibrations on the equipment.
4.2 BASE CASE DEFINITION The DVXT configuration in the base case is a concentric dualbore XT design (7” x 2”) completed on a dedicated THS with a standard valve configuration to perform basic operability functions for a gas reservoir. Sequentially, the production equipment requires constant injection with MEG to avoid the formation of hydrates.
All specific field components are located in the separately retrievable FCM.
Monitoring equipment is located in the XT and the FCM to notice alterations in the system.
Case Study: Deepwater Vertical Xmas Tree
35
4.3 BOUNDARY DEFINITION A reliability analysis benefits from a thorough study of all parts of the XT system. One must still set priorities to perform an expedient analysis also with regards to use of resources.
The system boundaries for the analytical part are defined as:
• The valves and equipment of the production XT • The valves and equipment of the FCM • The valves and equipment of the THS • TH • Wellhead (WH)
The SCM has been ruled out for the scope of this assessment. That is to achieve predictability in the results. The SCM cause noise in the data set so that the focus is removed from the XT itself and may complicate the fault isolation. Thus, the SCM and the associated monitoring equipment are beyond the scope of this work.
The WGFM can both be permanently installed or separately retrievable in the XT. In this case the WGFM is assumed permanently installed in the FCM and it is therefor included in further analysis.
Also, the Subsea Control Module Mounted Base (SCMMB) that is located at the XT body is included due to the possibility of XT retrieval if it fails.
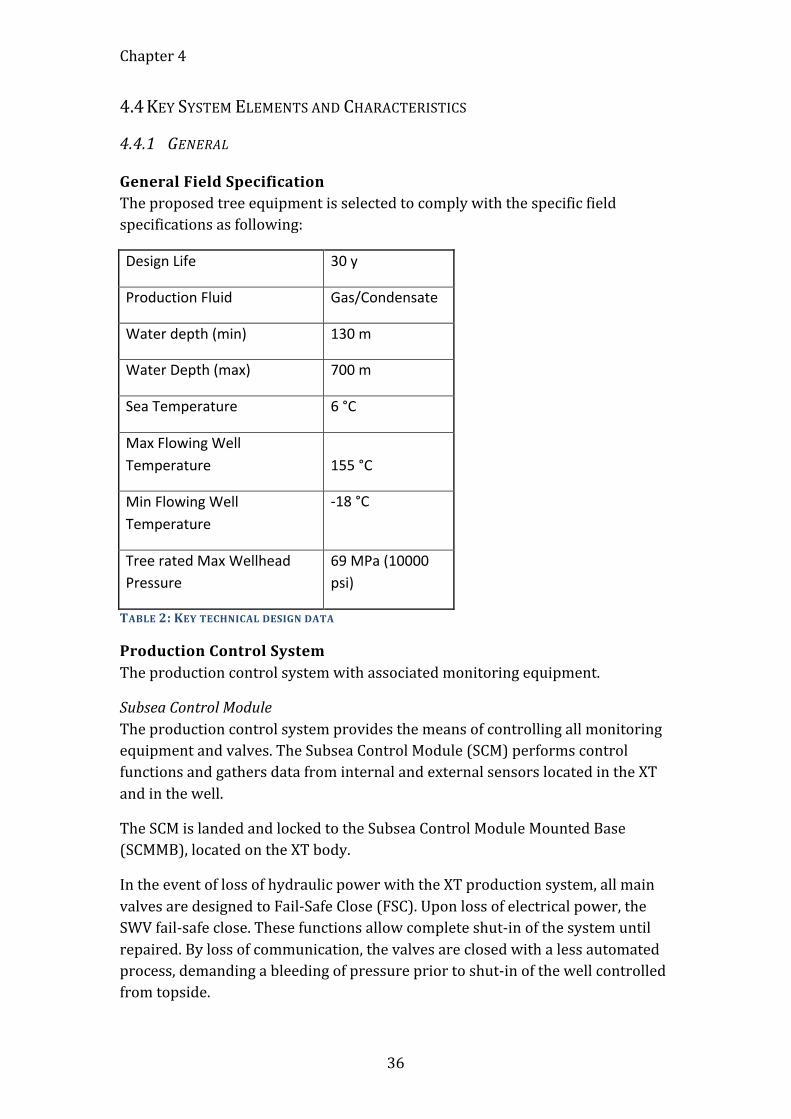
Chapter 4
36
4.4 KEY SYSTEM ELEMENTS AND CHARACTERISTICS
4.4.1 GENERAL
General Field Specification The proposed tree equipment is selected to comply with the specific field specifications as following:
Design Life 30 y
Production Fluid Gas/Condensate
Water depth (min) 130 m
Water Depth (max) 700 m
Sea Temperature 6 °C
Max Flowing Well Temperature 155 °C
Min Flowing Well Temperature
-‐18 °C
Tree rated Max Wellhead Pressure
69 MPa (10000 psi)
TABLE 2: KEY TECHNICAL DESIGN DATA
Production Control System The production control system with associated monitoring equipment.
Subsea Control Module The production control system provides the means of controlling all monitoring equipment and valves. The Subsea Control Module (SCM) performs control functions and gathers data from internal and external sensors located in the XT and in the well.
The SCM is landed and locked to the Subsea Control Module Mounted Base (SCMMB), located on the XT body.
In the event of loss of hydraulic power with the XT production system, all main valves are designed to Fail-‐Safe Close (FSC). Upon loss of electrical power, the SWV fail-‐safe close. These functions allow complete shut-‐in of the system until repaired. By loss of communication, the valves are closed with a less automated process, demanding a bleeding of pressure prior to shut-‐in of the well controlled from topside.
Case Study: Deepwater Vertical Xmas Tree
37
Monitoring Equipment Instrumentation will consist of dual Pressure Temperature Transmitters (PTTs) in the following locations:
1. Production bore, upstream for the Production Choke Valve (PCV): Between Production Master Valve (PMV) and Production Wing Valve (PWV).
2. Production bore, downstream for the PCV in the FCM. 3. Annulus bore: Between Annulus Master Valve (AMV) and Annulus Wing
Valve (AWV). 4. On the MEG Chemical Control Valve (CCV) in the FCM.
Alterations such as not maintained pressure indicates a leak in the system and should be investigated immediately.
A WGFM, located upstream for the PCV in the FCM, shall provide measurement of the flow composition of water, gas and condensate that is vital information for flow assurance and reservoir management. The WGFM can be either permanent on the XT assembly or a separately retrievable component, depending on the field design.
Failures of sensors and selected monitoring equipment do not necessarily result in an active intervention, since the measuring and monitoring often can be achieved through alternative means. Therefor, the sensors are beyond the scope of this assessment. When not assessed within the scope of the tree system, they should be included in analysis for the production control system.
System interfaces Within the analysis of the system failure modes, the production XT system has been configured into four main subassemblies for the failure mode identification process. To provide the full reliability picture of the XT system, the TH, THS system and the flowline jumper connection is added in the analysis, which means that the four main subassemblies are the THS, the TH, the production XT and the FCM. Each subassembly is elaborated in the following sections.
4.4.2 TUBING HEAD SPOOL The THS connects the XT by means of a 18-‐¾” H4 mandrel to connect up with the XT H4 connector and a H4 connector down to interface with the wellhead 18-‐¾” H4 mandrel.
The THS housing carries the production spool connecting the XT to the production jumper. Installation of an isolation sleeve into the bore of the THS allows drilling operations to be performed while it is installed on the wellhead.
Chapter 4
38
The THS mandrel body has a concentric bore to facilitate the TH installation. Housed in the THS are two Annulus Isolation Valves (AIVs) set in series to isolate the annulus when the XT is not connected to the top of the spool.
The THS is run subsea on wire using the TRT with the assistance of a ROV. A funnel down is designed into the frame to allow guidelineless installation onto the wellhead.
4.4.3 TUBING HANGER The Tubing Hanger (TH) system is designed to suspend and seal the downhole tubing. The TH shall provide the means of communication between the XT and the downhole hydraulic and electric functionalities. Wet mate couplers/connectors are located on the top and bottom of the hanger and engage with the XT and the downhole equipment.
The tubing hanger system is a conventional dual bore configuration (7” x 2”) rated for 69 MPa (10000 psi) and is installed and tested via marine riser and subsea BOP stack along with a landing string (the THRT). The tubing hanger is landed off in the THS in a lockdown profile, as illustrated in Figure 10. Once the metal-‐to-‐metal contact seal is set, the THRT drives the locking dogs into mating grooves in the THS. The TH cannot be unlocked without the assistance of a THRT.
Downhole hydraulic lines, chemical injection mandrel and Surface-‐Controlled Subsurface Safety Valve (SCSSV) lines will penetrate through the TH system. The THRT provides the means to run, retrieve, orientate, lock and unlock the TH in the THS. It also provides downhole communication through hydraulic and electrical connections to downhole sensors and valves.
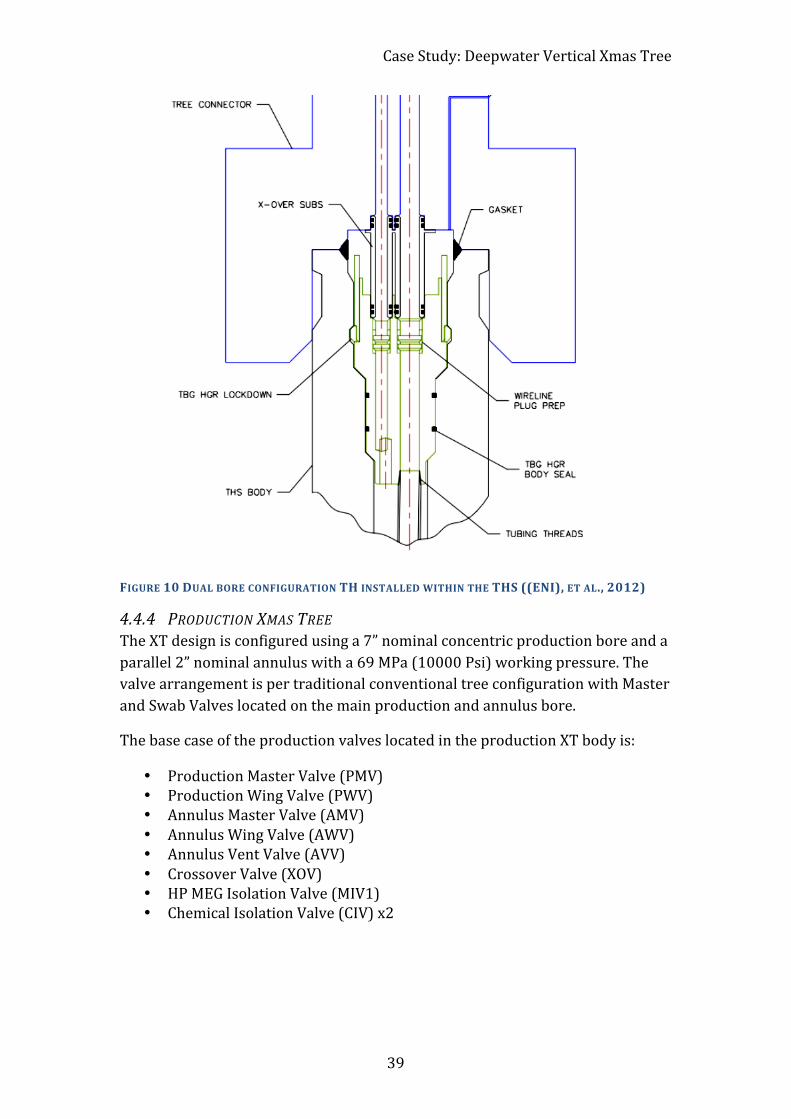
Case Study: Deepwater Vertical Xmas Tree
39
FIGURE 10 DUAL BORE CONFIGURATION TH INSTALLED WITHIN THE THS ((ENI), ET AL., 2012)
4.4.4 PRODUCTION XMAS TREE The XT design is configured using a 7” nominal concentric production bore and a parallel 2” nominal annulus with a 69 MPa (10000 Psi) working pressure. The valve arrangement is per traditional conventional tree configuration with Master and Swab Valves located on the main production and annulus bore.
The base case of the production valves located in the production XT body is:
• Production Master Valve (PMV) • Production Wing Valve (PWV) • Annulus Master Valve (AMV) • Annulus Wing Valve (AWV) • Annulus Vent Valve (AVV) • Crossover Valve (XOV) • HP MEG Isolation Valve (MIV1) • Chemical Isolation Valve (CIV) x2
Chapter 4
40
The XT body is designed to interface with an H4 connector (18-‐¾”). A VX gasket located at the bottom of the treehead interfaces with the TH mounted in the THS. The dedicated THS allows the XT system to be compatible with guidelineless operations. All XT connectors are tested by the VX gasket test to ensure operability.
A wing block, bolted on the master valve block, contains the PWV and a High-‐pressure MEG Injection Valve (MIV1). High-‐pressure MEG with low dosage is injected into the production tree, while low-‐pressure and high dosage is injected into the FCM.
The tree frame provides protection to the tree components from external impact. The frame funnel down provides the means of initial guidance and alignment of the tree to the THS. The tree is orientated by using fins located on the THS for accurate alignment of the tree coupling.
Production XT Valves All XT valves and stab will be designed using metal-‐to-‐metal seals. Testing of all seals and valves are required prior to installation. The main valves will have ROV override. If leakage occurs between seals, the seals might be repairable by ROV action. Such ROV actions include cleaning and filling to prevent leakage.
The main valves explained in a brief:
• Master valve (MV): Used to completely shut down the production tubing and/or the annulus. The Production Master Valve (PMV) is situated between the production bore and the wellhead, while the Annulus Master Valve (AMV) is situated at the bore into the annulus. The AMV is used to shut down any injection or production in annulus, i.e. gas lift and pressure monitoring.
• Wing Valve (WV): Controls the production of hydrocarbons (PWV), the injection of fluids or gas for reservoir control or the annulus bore (AWV). If necessary to shut down the fluid stream through the well, the wing valves are the first valves to close. The WVs is located downstream for the PMV and the AMV respectively.
• Crossover Valve (XOV): Allows communication between the annulus and the production bore via a crossover service line, which is normally isolated. An XOV may be used for fluid passage for well kill operations or to overcome obstructions caused by hydrate formation and pressure build-‐up.
• Annulus Access Valve (AAV): Used together with the AMV to equalize the pressure between the upper and the lower space of the tubing hanger during normal production.
Case Study: Deepwater Vertical Xmas Tree
41
Additionally, these valves are utilized in the XT case:
• Swab Valves: The Production Swab Valve (PSV) and Annulus Swab Valve (ASV) are used to control access to the wellbore when interventions in the well are necessary, to perform safe re-‐entries into the tree and into the well. They are located on the vertical bore above the wing valves and isolates the production flow from the tree cap. The SV’s are fail “as is”.
• Check Valves (CV): Prevent back-‐flow of well to service lines. • Isolation Valves (IV): utilized for pressure test and downhole lines.
Tree Cap An ROV operable tree cap provides the secondary barrier during operations. It is designed to prevent fluid from leaking into the environment and to protect the equipment against dropped objects that may cause injury to the equipment.
The tree cap is landed and locked into the tree head via dog interface in the production bore.
4.4.5 FLOW CONTROL MODULE A retrievable FCM will be designed with given specific field components. The module is landed on the XT frame and connected by a multibore hub connector. All required hydraulic and production lines are connected in the same joining. The production flowspool is routed from the XT to the FCM, returns back to XT again in the common multibore connector, and continues through the XT to the THS connector. To complete the production flowloop the spool is routed from the THS connection to the THS mounted flowline jumper connection.
The valves mounted in the FCM include:
• Production Choke Valve (PCV): Flow control device located downstream for the PMV and the PWV. It is used to minimize choking across the valves during start-‐up and shutdown of the well. It is an exposed component to failures such as sand erosion, debris and degradations. A hydraulic stepping actuator controls the choke valve, mounted on the choke body.
• MEG Isolation Valve (MIV2): Safely stops and opens for MEG injection. • MEG Control Valve (MEGCV): Flow control device for MEG injection
located upstream for the MIV. It inhabits the same functions as choke valves.
• Sacrificial Wing Valve (SWV): Safely stops and opens for the production flow. It is a sacrificial valve for the PWV and the PMV. If the flow in the production bore is being stopped, the SWV will close first to relieve the PWV of wear.
The monitoring equipment located in the FCM is described in section 4.4.1. The monitoring equipment is considered outside the scope of the assessment, but is presented in the case in order to present the full picture of the tree equipment.
Chapter 4
42
Failures of sensors and selected monitoring equipment do not necessarily result in an active intervention, since the measuring and monitoring often can be achieved through alternative means. Also, if the monitoring equipment is considered critical for a tree, the monitoring equipment is made redundant to the point that it can be considered close-‐to negligible. Therefore, the sensors are beyond the scope of this assessment. The WGFM is included in further analysis, because it is a complex component that contributes significant to failures.
4.4.6 XMAS TREE INSTALLATION AND WORKOVER CONTROL SYSTEM The tree has a concentric dual-‐bore design, allowing subsea BOP and marine riser to be landed on the XT. This means that the BOP and marine riser can be used along with a Tubing Hanger Running tool (THRT) for installation and intervention. After landing the XT onto the THS, the XT connector is locked via ROV hot stab.
A Workover Control System (WOCS) is assumed to be configured so that it may operate all workover control functions for intervention means.
4.5 MAIN ASSUMPTIONS AND LIMITATIONS
4.5.1 ANALYSIS LEVEL The overall level of the analysis performed is a specific reliability analysis for components in the tree system, including systems such as TH and THS, to provide the full reliability picture for the XT production system.
The analysis level considers the steady-‐state operational mode, i.e. a constant failure rate. This means that the infant mortality is assumed eliminated and that the equipment will not reach the wear-‐out phase (ref. ch. 2.2.2).
4.5.2 OPERATIONAL PHASES The focus of the analysis is on the operational phase, with limited focus on the installation and intervention phase of the XT system. Even so, it is essential to identify installation/ intervention means when conducting the FMECA.
4.5.3 ANALYSIS ASSUMPTIONS
Operator errors Any failure caused by inappropriate actions by the operator, such as failures caused by inadequate operation and handling of the system, are not included in the analysis.
Reliability data The reliability data for the bottom-‐up approach are from OREDA-‐2009. See Reliability Data. It should be noted that use of OREDA-‐2009 handbook is deliberately selected as single source for reliability in the current study. The

Case Study: Deepwater Vertical Xmas Tree
43
reliability data used is listed in Attachment A. Mobilization and repair data are listed in Attachment B.
Failure Criticality assessment For the failure criticality assessment, assumptions have been made to evaluate proper criticalities of the components in the XT assembly.
The assumptions for the failure criticalities, for the system as a whole and for components are listed in Chapter 6.1.1.
Chapter 5
44
5 RELIABILITY ANALYSIS APPROACH APPLIED TO CASE
5.1 XT FAILURES A component has failed at the instant it stops to perform its required function. Due to the operating environment of a XT, failures may occur either sudden or gradually. As an example, complete loss of flow control capability in a valve may occur due to actuation system failure due to spring breakage. Degradation can be leakage through a valve in closed position due to erosion/debris of the valve stem. This occurs gradually over time before it escalates to complete failure unless sufficient maintenance/replacement is conducted. Sudden failures usually occur without warning and can cause complete loss of function with significant financial, environmental and operational consequences.
The most crucial failure of the XT assembly is external leakage. A leakage would cause contamination of environment and commercial losses. It may also result in seawater entering the system. Seawater contains salt that increase corrosion, which is crucial failure in itself and may lead to a series of new problems.
Four identified events leading to damage of WH and XTs, and which may develop into external leakage/entering of seawater, are further described below:
-‐ Leakage in valves: Valves are mechanical instruments that are weak points. Leakage may occur due to heavy structural loads or mechanisms acting over time, such as corrosion and erosion.
-‐ Leakage from endpoints in the system: The endpoints are considered as structural weak spots where leakage could possibly occur.
-‐ Leakage from annulus: If the pressure builds up in annulus, hydrocarbons may enter annulus and create wellhead leakages.
-‐ Internal overpressure: If the DHSV is closed during injection of chemicals, it may result in increased pressures in the annulus that exceed the XT design pressure (10,000 psi).
Failures of XT components are unlikely to cause a large quantity of leakage (ref: Chapter 3.2.1: Accident Review). Potential leakages are limited by quick response through the valve and sensors on the XT, so the main consequence of a potential failure is on production availability and thereby economic losses.
The failure effects of potential component failures must be significant if they are to be included in a risk analysis, in terms of safety, environmental consequences, production loss, or maintenance costs. Reliability data or operating experience from the actual part, or similar parts, must be obtainable.
An important step of identifying failures for the components in the XT is to specify consequences or effects of equipment failures. Due to general level of

Reliability Analysis Approach Applied to Case
45
uncertainty and complexity, it is necessary to state several assumptions. The failure modes for the equipment applied to the case study of the DVXT in this study is elaborated in ch. 5.4.2.
The effect of component failures on the total system varies, from shutdown of the well to negligible or no effect (as a result of redundancy or low equipment criticality). Some failures cause immediate shutdown of the affected well, some failures lead to production hold due to shutdown during repair; while some failures have no observable impact on production.
Concerning the component failures that require shutdown of the well, the intervention means of different failures may result in extensively different downtimes, as elaborated on further underneath.
5.2 WELL INTERVENTION MEANS Well intervention can be segmented into light and heavy intervention. Both require the services of a vessel or a rig. The subsea well interventions are costly, especially in deepwater. The vessel has to be rented and mobilized to the site together with equipment for repair. Outside planned interventions this may take months. Generally, unplanned stoppage of equipment result in high equipment downtime, high cost of repair, extensive repair time and high penalty associated with loss of production.
The mobilization and repair data is given detailed in appendix B, provided by GE Oil & Gas. The data will depend on how contracts/field are organized particularly related to intervention and service. Consequently, the maintenance characteristics assumed is based on approved information from previous relevant projects and studies conducted by GE Oil & Gas.
Equipment failures in the XT assembly can be segmented into two types of repairs reflecting extensively different downtimes:
• Failures that demand XT retrieval; • Failures that is repairable by light intervention means such as ROV
remedial actions and replacement of light modules such as choke insert, SCM, CCV or FCM.
5.2.1 HEAVY WORKOVER Heavy workovers can be defined as extensive operations that require the services of a Mobile Drilling Unit (MODU). Such operations include retrieval and replacement of the XT, TH and THS. The mobilization time of a MODU typically vary between 120 to 240 days, reflecting in-‐between 4 to 8 months of downtime before it is possible to initiate retrieval of the XT. When the MODU is mobilized, the XT replacement requires between 5 to 10 days.
Chapter 5
46
5.2.2 LIGHT INTERVENTION Light interventions for the XT assembly include failures that are repairable by ROV operations. ROV actions are a less extensive maintenance operation, mainly due to the absence of a MODU. ROV repairable failures require the services of a Light Intervention Vessel (LIV) or a ROV Service Vessel (ROVSV) depending on the repair.
As a simplification for the reliability analysis, all failures that do not require tree retrieval is assumed to require the services of a Multipurpose Service Vessel (MSV) to cover ROV operations in addition to retrieval of light modules.
The mobilization time of a MSV is typically mobilized within 20 to 30 days. The repair time for simple ROV action would typically take half a day. Retrieval of light modules normally takes between a half and one day.
5.3 FAILURE CRITICALITY CLASSIFICATION The importance of a given function or component depends on the systems ability to function without it if it fails. Failures that occur have different effect on the systems ability to function and its consequences may vary from staying unnoticed in the system, weaken the system or cause downtime for the whole system. A measure can help rank the components and the subsystem based on their effect on the system if they fail. This is an important step before initiating a FMECA to understand the system effects that loss of a function or component will have on the overall system.
Both the system functions and the components have been classified according to the table underneath, provided by GE Oil & Gas.
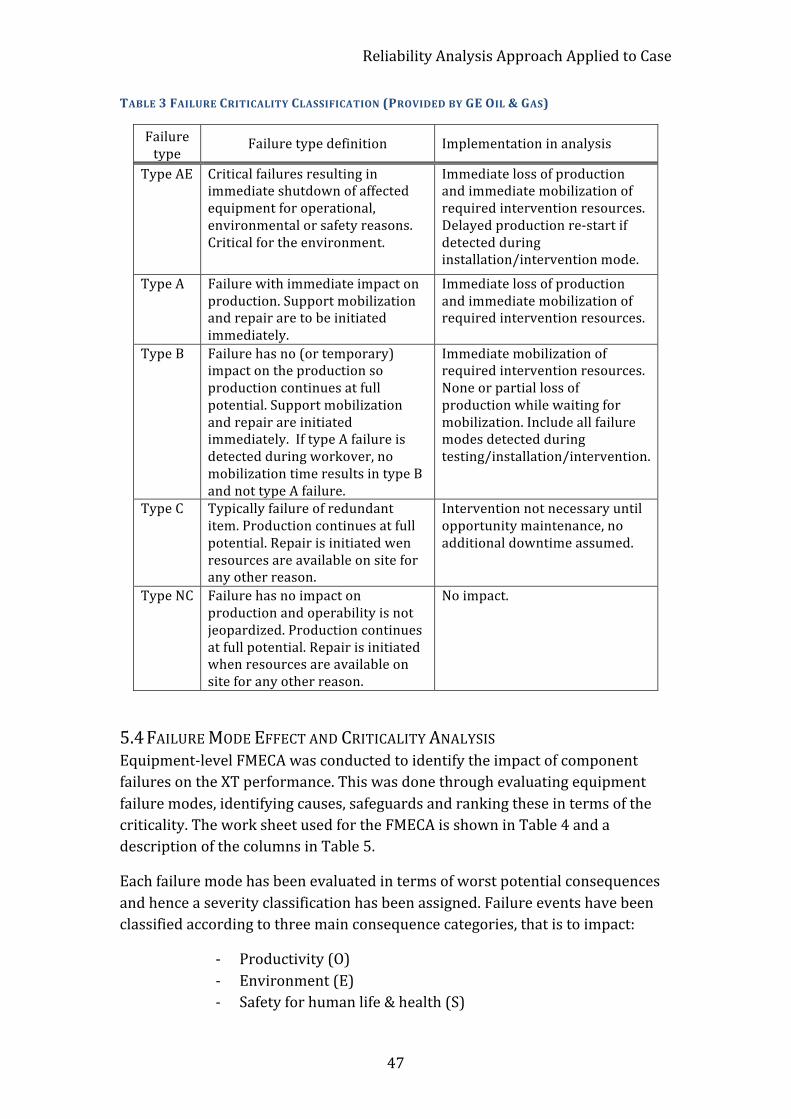
Reliability Analysis Approach Applied to Case
47
TABLE 3 FAILURE CRITICALITY CLASSIFICATION (PROVIDED BY GE OIL & GAS)
Failure type
Failure type definition Implementation in analysis
Type AE Critical failures resulting in immediate shutdown of affected equipment for operational, environmental or safety reasons. Critical for the environment.
Immediate loss of production and immediate mobilization of required intervention resources. Delayed production re-‐start if detected during installation/intervention mode.
Type A Failure with immediate impact on production. Support mobilization and repair are to be initiated immediately.
Immediate loss of production and immediate mobilization of required intervention resources.
Type B Failure has no (or temporary) impact on the production so production continues at full potential. Support mobilization and repair are initiated immediately. If type A failure is detected during workover, no mobilization time results in type B and not type A failure.
Immediate mobilization of required intervention resources. None or partial loss of production while waiting for mobilization. Include all failure modes detected during testing/installation/intervention.
Type C Typically failure of redundant item. Production continues at full potential. Repair is initiated wen resources are available on site for any other reason.
Intervention not necessary until opportunity maintenance, no additional downtime assumed.
Type NC Failure has no impact on production and operability is not jeopardized. Production continues at full potential. Repair is initiated when resources are available on site for any other reason.
No impact.
5.4 FAILURE MODE EFFECT AND CRITICALITY ANALYSIS Equipment-‐level FMECA was conducted to identify the impact of component failures on the XT performance. This was done through evaluating equipment failure modes, identifying causes, safeguards and ranking these in terms of the criticality. The work sheet used for the FMECA is shown in Table 4 and a description of the columns in Table 5.
Each failure mode has been evaluated in terms of worst potential consequences and hence a severity classification has been assigned. Failure events have been classified according to three main consequence categories, that is to impact:
-‐ Productivity (O) -‐ Environment (E) -‐ Safety for human life & health (S)
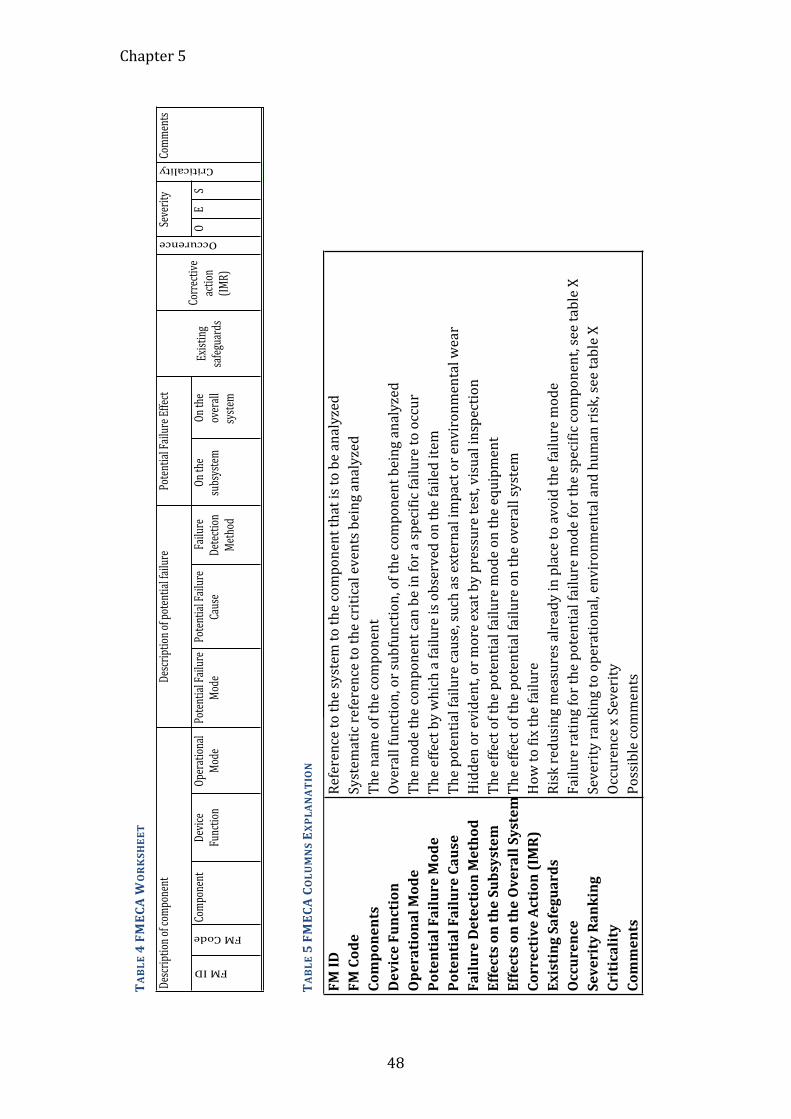
Chapter 5
48
FM#ID
Reference'to'the'system
'to'the'com
ponent'that'is'to'be'analyzed
FM#Code
Systema
tic'reference'to'the'critical'events'bein
g'analyzed
Components
The'nam
e'of'the'comp
onent
Device#Function
Overall'function,'or'subfunction,'of'the'comp
onent'bein
g'analyzed
Operational#Mode
The'm
ode'the'comp
onent'can'be'in'for'a'specific'failure'to'occur
Potential#Failure#Mode
The'effect'by'which'a'failure'is'observed'on'the'failed'ite
mPotential#Failure#Cause
The'potential'failure'cause,'such'as'external'im
pact'or'environme
ntal'wear
Failure#Detection#Method
Hidden'or'evide
nt,'or'm
ore'exat'by'pressure'test,'visual'inspection
Effects#on#the#Subsystem
The'effect'of'the'potential'failure'mode'on'the'equip
ment
Effects#on#the#Overall#System
The'effect'of'the'potential'failure'on'the'overall'system
Corrective#Action#(IMR)
How'to'fix'the'failure
Existing#Safeguards
Risk'redusing'm
easures'already'in'p
lace'to'avoid'the'failure'm
ode
Occurence
Failure'rating'for'the'potential'failure'mode'for'the'specific'comp
onent,'see'table'X
Severity#Ranking
Severity'rankin
g'to'operational,'environm
ental'and'h
uman'risk,'see'table'X
Criticality
Occurence'x'Severity
Comments
Possible'com
ments
TABLE 4 FMECA W
ORKSHEET
TABLE 5 FMECA COLU
MNS EX
PLANATION
OSeverity
Device++++++
Funct
ionCorrectiv
e+action
+(IM
R)Exi
sting+
safegu
ards
Comp
onent
ES
Opera
tional
+Mo
dePoten
tial+Fa
ilure+
Mode
Poten
tial+Fa
ilure+
Cause
Failure+
Detection+
Metho
d
On+the+
overall+
system
Comm
ents
Occurence
Criticality
Description
+of+com
ponen
tDescription
+of+poten
tial+failure
On+the+
subsys
tem
Poten
tial+Fa
ilure+Effect
FM+ID
FM+Code
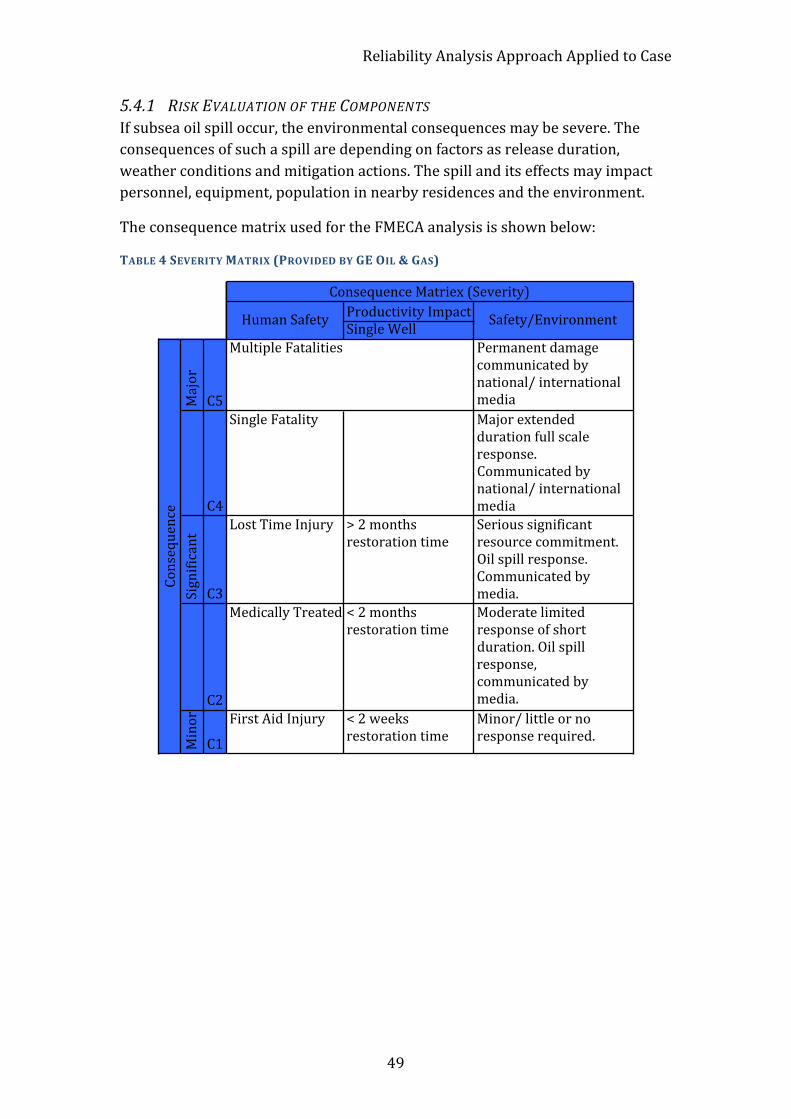
Reliability Analysis Approach Applied to Case
49
5.4.1 RISK EVALUATION OF THE COMPONENTS If subsea oil spill occur, the environmental consequences may be severe. The consequences of such a spill are depending on factors as release duration, weather conditions and mitigation actions. The spill and its effects may impact personnel, equipment, population in nearby residences and the environment.
The consequence matrix used for the FMECA analysis is shown below:
TABLE 4 SEVERITY MATRIX (PROVIDED BY GE OIL & GAS)
Productivity+ImpactSingle+Well
Major
C5
Multiple+Fatalities Permanent+damage+communicated+by+national/+international+media
C4
Single+Fatality Major+extended+duration+full+scale+response.+Communicated+by+national/+international+media
Significant
C3
Lost+Time+Injury >+2+months+restoration+time
Serious+significant+resource+commitment.+Oil+spill+response.+Communicated+by+media.+
C2
Medically+Treated+Injury<+2+months+restoration+time
Moderate+limited+response+of+short+duration.+Oil+spill+response,+communicated+by+media.
Minor
C1
First+Aid+Injury <+2+weeks+restoration+time
Minor/+little+or+no+response+required.
Human+Safety Safety/Environment
Consequence
Consequence+Matriex+(Severity)
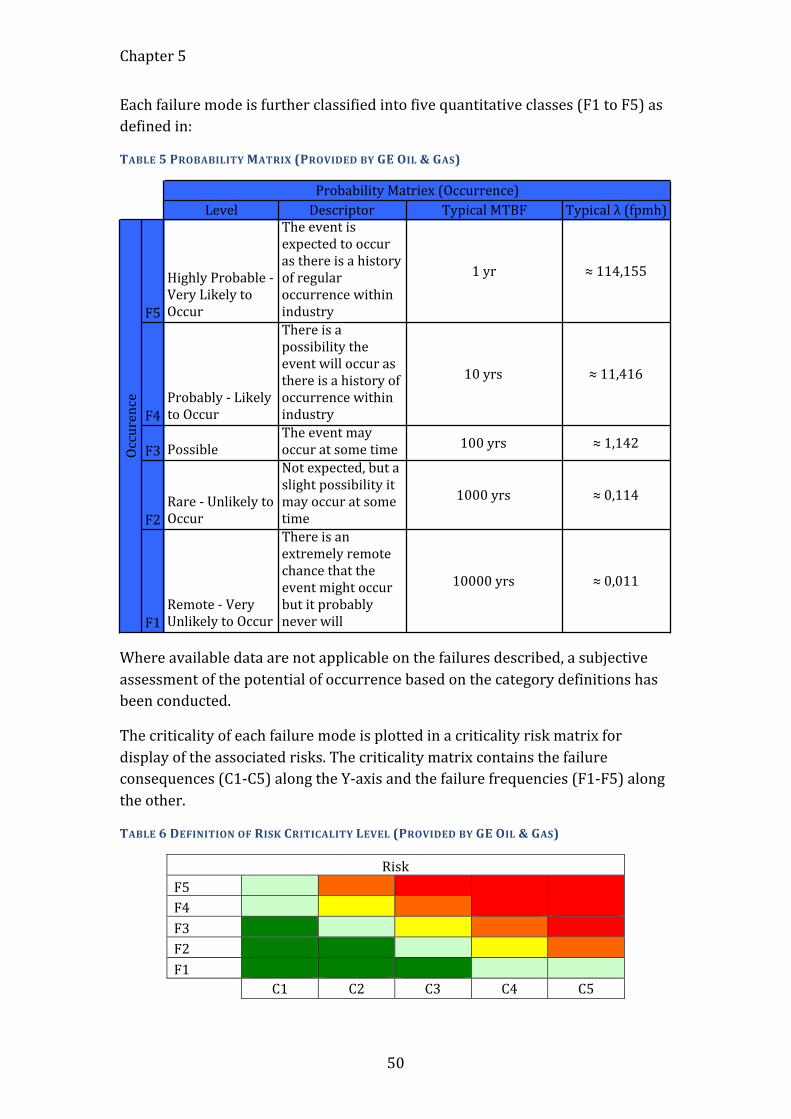
Chapter 5
50
Each failure mode is further classified into five quantitative classes (F1 to F5) as defined in:
TABLE 5 PROBABILITY MATRIX (PROVIDED BY GE OIL & GAS)
Where available data are not applicable on the failures described, a subjective assessment of the potential of occurrence based on the category definitions has been conducted.
The criticality of each failure mode is plotted in a criticality risk matrix for display of the associated risks. The criticality matrix contains the failure consequences (C1-‐C5) along the Y-‐axis and the failure frequencies (F1-‐F5) along the other.
TABLE 6 DEFINITION OF RISK CRITICALITY LEVEL (PROVIDED BY GE OIL & GAS)
Risk F5 F4 F3 F2 F1
C1 C2 C3 C4 C5
Level Descriptor Typical0MTBF Typical0λ0(fpmh)
F5
Highly0Probable0?0Very0Likely0to0Occur
The0event0is0expected0to0occur0as0there0is0a0history0of0regular0occurrence0within0industry
10yr ≈0114,155
F4Probably0?0Likely0to0Occur
There0is0a0possibility0the0event0will0occur0as0there0is0a0history0of0occurrence0within0industry
100yrs ≈011,416
F3 PossibleThe0event0may0occur0at0some0time 1000yrs ≈01,142
F2Rare0?0Unlikely0to0Occur
Not0expected,0but0a0slight0possibility0it0may0occur0at0some0time
10000yrs ≈00,114
F1Remote0?0Very0Unlikely0to0Occur
There0is0an0extremely0remote0chance0that0the0event0might0occur0but0it0probably0never0will
100000yrs ≈00,011
Occurence
Probability0Matriex0(Occurrence)
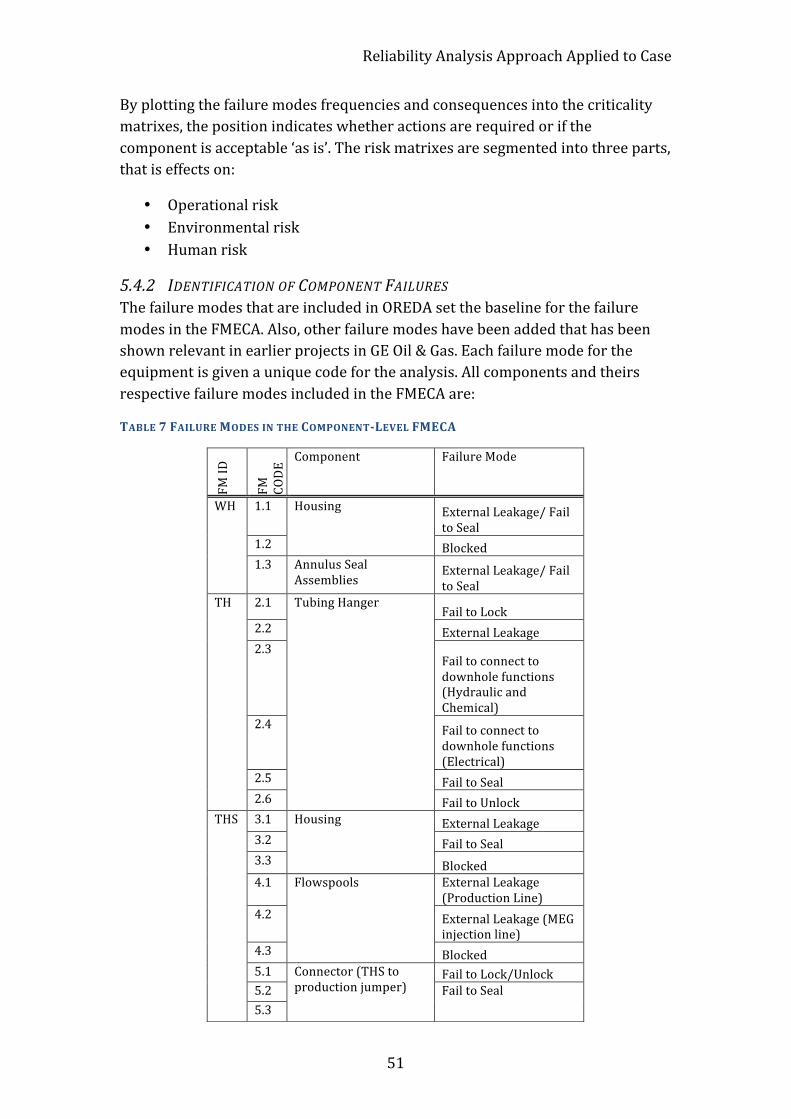
Reliability Analysis Approach Applied to Case
51
By plotting the failure modes frequencies and consequences into the criticality matrixes, the position indicates whether actions are required or if the component is acceptable ‘as is’. The risk matrixes are segmented into three parts, that is effects on:
• Operational risk • Environmental risk • Human risk
5.4.2 IDENTIFICATION OF COMPONENT FAILURES The failure modes that are included in OREDA set the baseline for the failure modes in the FMECA. Also, other failure modes have been added that has been shown relevant in earlier projects in GE Oil & Gas. Each failure mode for the equipment is given a unique code for the analysis. All components and theirs respective failure modes included in the FMECA are:
TABLE 7 FAILURE MODES IN THE COMPONENT-‐LEVEL FMECA
FM ID
FM
CODE
Component Failure Mode
WH 1.1 Housing External Leakage/ Fail to Seal
1.2 Blocked 1.3 Annulus Seal
Assemblies External Leakage/ Fail to Seal
TH 2.1 Tubing Hanger Fail to Lock
2.2 External Leakage 2.3
Fail to connect to downhole functions (Hydraulic and Chemical)
2.4 Fail to connect to downhole functions (Electrical)
2.5 Fail to Seal 2.6 Fail to Unlock
THS 3.1 Housing External Leakage 3.2 Fail to Seal 3.3 Blocked 4.1 Flowspools External Leakage
(Production Line) 4.2 External Leakage (MEG
injection line) 4.3 Blocked 5.1 Connector (THS to
production jumper) Fail to Lock/Unlock
5.2 Fail to Seal 5.3
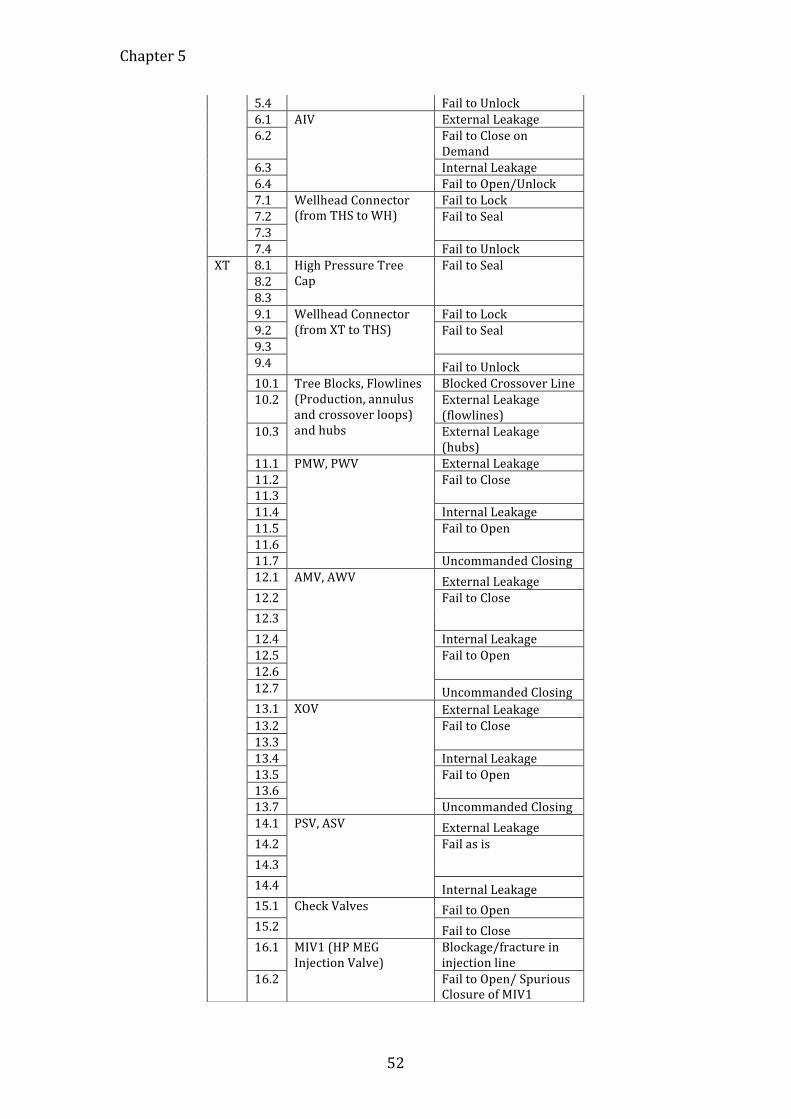
Chapter 5
52
5.4 Fail to Unlock 6.1 AIV External Leakage 6.2 Fail to Close on
Demand 6.3 Internal Leakage 6.4 Fail to Open/Unlock 7.1 Wellhead Connector
(from THS to WH) Fail to Lock
7.2 Fail to Seal 7.3 7.4 Fail to Unlock
XT 8.1 High Pressure Tree Cap
Fail to Seal 8.2 8.3 9.1 Wellhead Connector
(from XT to THS) Fail to Lock
9.2 Fail to Seal 9.3 9.4 Fail to Unlock 10.1 Tree Blocks, Flowlines
(Production, annulus and crossover loops) and hubs
Blocked Crossover Line 10.2 External Leakage
(flowlines) 10.3 External Leakage
(hubs) 11.1 PMW, PWV External Leakage 11.2 Fail to Close 11.3 11.4 Internal Leakage 11.5 Fail to Open 11.6 11.7 Uncommanded Closing 12.1 AMV, AWV External Leakage 12.2 Fail to Close 12.3 12.4 Internal Leakage 12.5 Fail to Open 12.6 12.7 Uncommanded Closing 13.1 XOV External Leakage 13.2 Fail to Close 13.3 13.4 Internal Leakage 13.5 Fail to Open 13.6 13.7 Uncommanded Closing 14.1 PSV, ASV External Leakage 14.2 Fail as is 14.3 14.4 Internal Leakage 15.1 Check Valves Fail to Open 15.2 Fail to Close 16.1 MIV1 (HP MEG
Injection Valve) Blockage/fracture in injection line
16.2 Fail to Open/ Spurious Closure of MIV1
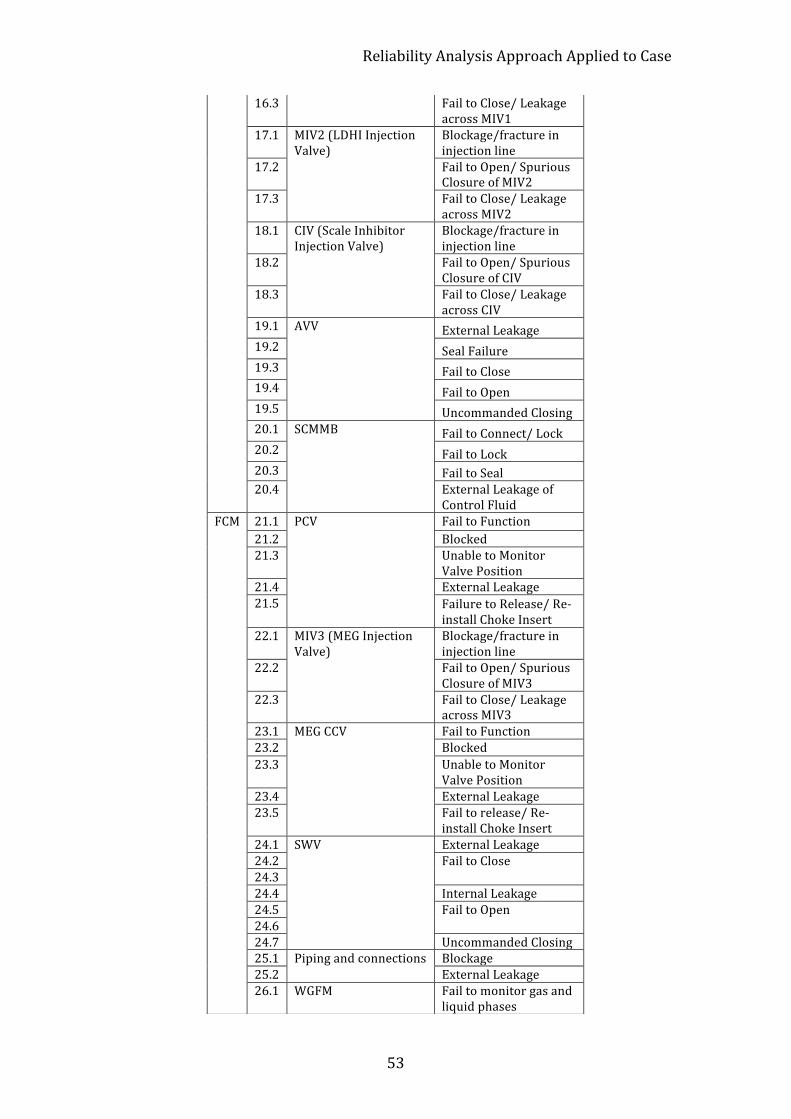
Reliability Analysis Approach Applied to Case
53
16.3 Fail to Close/ Leakage across MIV1
17.1 MIV2 (LDHI Injection Valve)
Blockage/fracture in injection line
17.2 Fail to Open/ Spurious Closure of MIV2
17.3 Fail to Close/ Leakage across MIV2
18.1 CIV (Scale Inhibitor Injection Valve)
Blockage/fracture in injection line
18.2 Fail to Open/ Spurious Closure of CIV
18.3 Fail to Close/ Leakage across CIV
19.1 AVV External Leakage 19.2 Seal Failure 19.3 Fail to Close 19.4 Fail to Open 19.5 Uncommanded Closing 20.1 SCMMB Fail to Connect/ Lock 20.2 Fail to Lock 20.3 Fail to Seal 20.4 External Leakage of
Control Fluid FCM 21.1 PCV Fail to Function
21.2 Blocked 21.3 Unable to Monitor
Valve Position 21.4 External Leakage 21.5 Failure to Release/ Re-‐
install Choke Insert 22.1 MIV3 (MEG Injection
Valve) Blockage/fracture in injection line
22.2 Fail to Open/ Spurious Closure of MIV3
22.3 Fail to Close/ Leakage across MIV3
23.1 MEG CCV Fail to Function 23.2 Blocked 23.3 Unable to Monitor
Valve Position 23.4 External Leakage 23.5 Fail to release/ Re-‐
install Choke Insert 24.1 SWV External Leakage 24.2 Fail to Close 24.3 24.4 Internal Leakage 24.5 Fail to Open 24.6 24.7 Uncommanded Closing 25.1 Piping and connections Blockage 25.2 External Leakage 26.1 WGFM Fail to monitor gas and
liquid phases
Chapter 5
54
5.5 RELIABILITY BLOCK DIAGRAM Reliability Block Diagram’s (RBD’s) have been applied to estimate the reliability for the XT items, using a consistent set of component reliability data (Bottom-‐up approach).
In the RBD’s the components are described for how they interact to fulfill the functions of the XT system. The components in the WH, TH, THS and the XT all need to function for the XT system to satisfy the requirements as a safety barrier and to control and monitor the flow from and into the well. The RBD’s is enclosed in Attachment D.
The pertinence of the RBD’s is to calculate the MTBF for XT retrieval. Therefor, two RBD’s have been conducted:
1. Production XT (Include WH, TH and THS) 2. FCM
The FCM is in a separate RBD due to the module being separately retrieved, without the requirement of services from a MODU. The TH, THS and WH are included in the RBD for the production XT, as severe failures in these elements require XT retrieval before the ability to retrieve other modules. Failures that can be fixed by ROV actions are indicated in the RBD’s.
The RBDs is based on the FMECA, but with some data only available at higher level/component level without possibility for breakdown into failure mode level, not all failure modes from the FMECA are carried out in the RBD’s.
The components have been defined in failure categories to provide a criticality that is wide enough to give proper evaluation of the components by the author’s evaluation.
In the RBD’s, it may seem as though redundancy is not reflected in the system, but the tree system has tolerance for errors built into the design (see below for a list of examples). In particular, this is reflected in back-‐up solutions for problems that might occur, which primarily reduce the need for retrieval of the tree if an error first occurs.
Fault tolerance/redundancy that is built into the tree design may include:
• Contingency modes of operation, which means that components can adopt a function if another component loose its function. Examples of this include:
Reliability Analysis Approach Applied to Case
55
i. If the annulus cannot be vented through the annulus vent line, it can be performed through the crossover (XOV) production line (and vice versa).
ii. If the Wet Gas Flowmeter (WGFM) fail to monitor the gas flow rate of the production fluid, the flow rate can be calculated by fluid dynamics through the position of the choke valve combined with the pressure measurements upstream and downstream of the production choke. If unable to measure the position of the choke valve, one can find this through the pressure gauges in the SCM. However, it should be noted, that there is limited fault tolerance with respect to measurement of the water rate in the WGFM. Consequently, the WGFM is assumed Type A critical in this study.
iii. If the pressure monitoring downstream of the choke valve in the tree system fail, the pressure can be measured through the manifold, or other trees nearby if these trees produce to the same production pipeline.
iv. Often, there are two-‐three different chemical injection lines in a XT with different chemicals or compositions thereof, with separate CIV/MIV and dedicated injection points at separate locations in the system. However, if one of them fails, it is often possible to inject a chemical cocktail via the injection lines that do function. If the MEG cannot be injected in an area of the system, one can often inject via a detour by for example opening the XOV production line. This is an argument for including the CIV/MEG injection lines as redundant in the RBD.
• For failure critical components fallback systems are included, such as: i. ROV Override on all valves. If a valve fails to close or open, ROV
Remedial Actions such as repeated opening and closing of valve possibly combined with flushing with chemicals can often solve a problem if for example the valve is partly/fully blocked. With failures upon non-‐critical actuated valves the operator would typically continue operation with the valve as a “ROV valve”.
ii. As for the wellhead connector, the greatest concern is to not be able to disconnect the tree/spool from the wellhead when retrieving the tree. The workover system/wellhead connector is therefore equipped with one or two primary systems for disconnection, as well as cutting-‐loops where a ROV can cut the hydraulic lines and thereby release the tree/spool from the wellhead.
iii. It is necessary to retrieve the tree if the SCM do not unlock from the SCMMB. Thus, the SCM has primary and secondary release from the SCMMB.
Chapter 5
56
Most of the components in the XT system have individual failure modes that are critical and therefore they are put in series in the reliability analysis, even though some of the failure modes in the component are failure tolerant with solutions that prevent the error to have an impact.

Results
57
6 RESULTS
6.1 FMECA/FAILURE ANALYSIS
6.1.1 FAILURE CRITICALITY ASSESSMENT OF COMPONENTS AND SUB-‐SYSTEMS The system functions and the components in the XT system have been classified according to
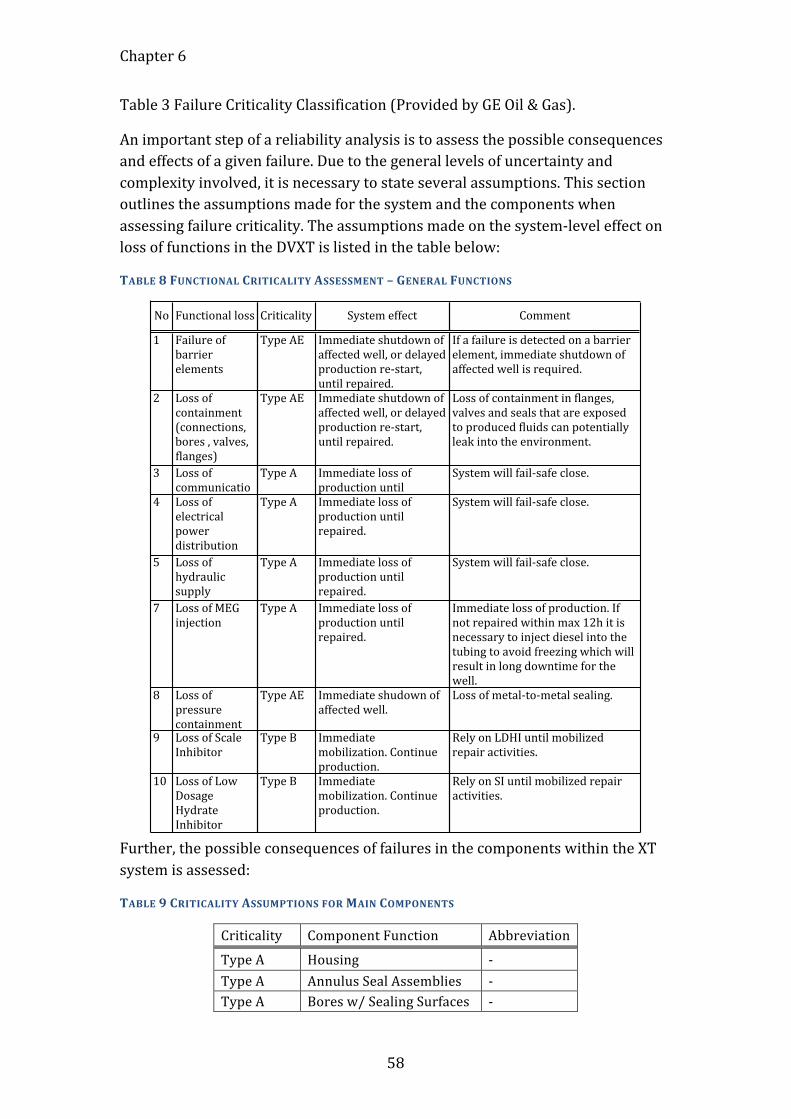
Chapter 6
58
Table 3 Failure Criticality Classification (Provided by GE Oil & Gas).
An important step of a reliability analysis is to assess the possible consequences and effects of a given failure. Due to the general levels of uncertainty and complexity involved, it is necessary to state several assumptions. This section outlines the assumptions made for the system and the components when assessing failure criticality. The assumptions made on the system-‐level effect on loss of functions in the DVXT is listed in the table below:
TABLE 8 FUNCTIONAL CRITICALITY ASSESSMENT – GENERAL FUNCTIONS
Further, the possible consequences of failures in the components within the XT system is assessed:
TABLE 9 CRITICALITY ASSUMPTIONS FOR MAIN COMPONENTS
Criticality Component Function Abbreviation
Type A Housing -‐ Type A Annulus Seal Assemblies -‐ Type A Bores w/ Sealing Surfaces -‐
9 Loss%of%Scale%Inhibitor
10 Loss%of%Low%Dosage%Hydrate%Inhibitor
1 Failure%of%barrier%elements
No Functional%loss
3 Loss%of%communicatio
2 Loss%of%containment%%%%%%%%%%%%%%%%%%%%%%%%%%%%%%%%%%%%%%%%%%%%%%%%%%%%%%%%%%%%%%%%%%%%%%%%%%%%%%%%%%%%%%%%%%(connections,%bores%,%valves,%flanges)
5 Loss%of%hydraulic%supply
4 Loss%of%electrical%power%distribution
7 Loss%of%MEG%injection
8 Loss%of%pressure%containment
Type%B Immediate%mobilization.%Continue%production.
Type%B Immediate%mobilization.%Continue%production.
Type%AE Immediate%shutdown%of%affected%well,%or%delayed%production%reTstart,%until%repaired.
Criticality System%effect
Type%A Immediate%loss%of%production%until%
Type%AE Immediate%shutdown%of%affected%well,%or%delayed%production%reTstart,%until%repaired.
Type%A Immediate%loss%of%production%until%repaired.
Type%A Immediate%loss%of%production%until%repaired.
Type%A Immediate%loss%of%production%until%repaired.
Type%AE Immediate%shudown%of%affected%well.
Rely%on%LDHI%until%mobilized%repair%activities.
Rely%on%SI%until%mobilized%repair%activities.
If%a%failure%is%detected%on%a%barrier%element,%immediate%shutdown%of%affected%well%is%required.
Comment
System%will%failTsafe%close.
Loss%of%containment%in%flanges,%valves%and%seals%that%are%exposed%to%produced%fluids%can%potentially%leak%into%the%environment.
System%will%failTsafe%close.
System%will%failTsafe%close.
Immediate%loss%of%production.%If%not%repaired%within%max%12h%it%is%necessary%to%inject%diesel%into%the%tubing%to%avoid%freezing%which%will%result%in%long%downtime%for%the%well.%Loss%of%metalTtoTmetal%sealing.
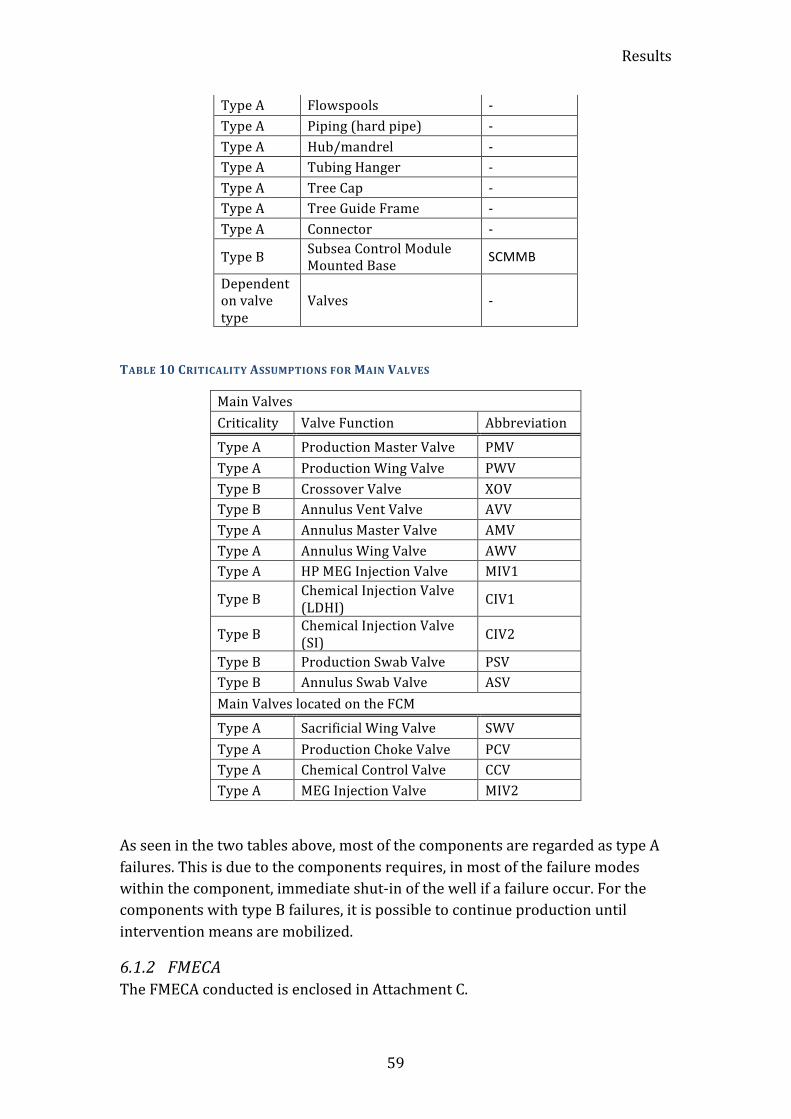
Results
59
Type A Flowspools -‐ Type A Piping (hard pipe) -‐ Type A Hub/mandrel -‐ Type A Tubing Hanger -‐ Type A Tree Cap -‐ Type A Tree Guide Frame -‐ Type A Connector -‐
Type B Subsea Control Module Mounted Base SCMMB
Dependent on valve type
Valves -‐
TABLE 10 CRITICALITY ASSUMPTIONS FOR MAIN VALVES
Main Valves Criticality Valve Function Abbreviation
Type A Production Master Valve PMV Type A Production Wing Valve PWV Type B Crossover Valve XOV Type B Annulus Vent Valve AVV Type A Annulus Master Valve AMV Type A Annulus Wing Valve AWV Type A HP MEG Injection Valve MIV1
Type B Chemical Injection Valve (LDHI) CIV1
Type B Chemical Injection Valve (SI) CIV2
Type B Production Swab Valve PSV Type B Annulus Swab Valve ASV Main Valves located on the FCM
Type A Sacrificial Wing Valve SWV Type A Production Choke Valve PCV Type A Chemical Control Valve CCV Type A MEG Injection Valve MIV2
As seen in the two tables above, most of the components are regarded as type A failures. This is due to the components requires, in most of the failure modes within the component, immediate shut-‐in of the well if a failure occur. For the components with type B failures, it is possible to continue production until intervention means are mobilized.
6.1.2 FMECA The FMECA conducted is enclosed in Attachment C.
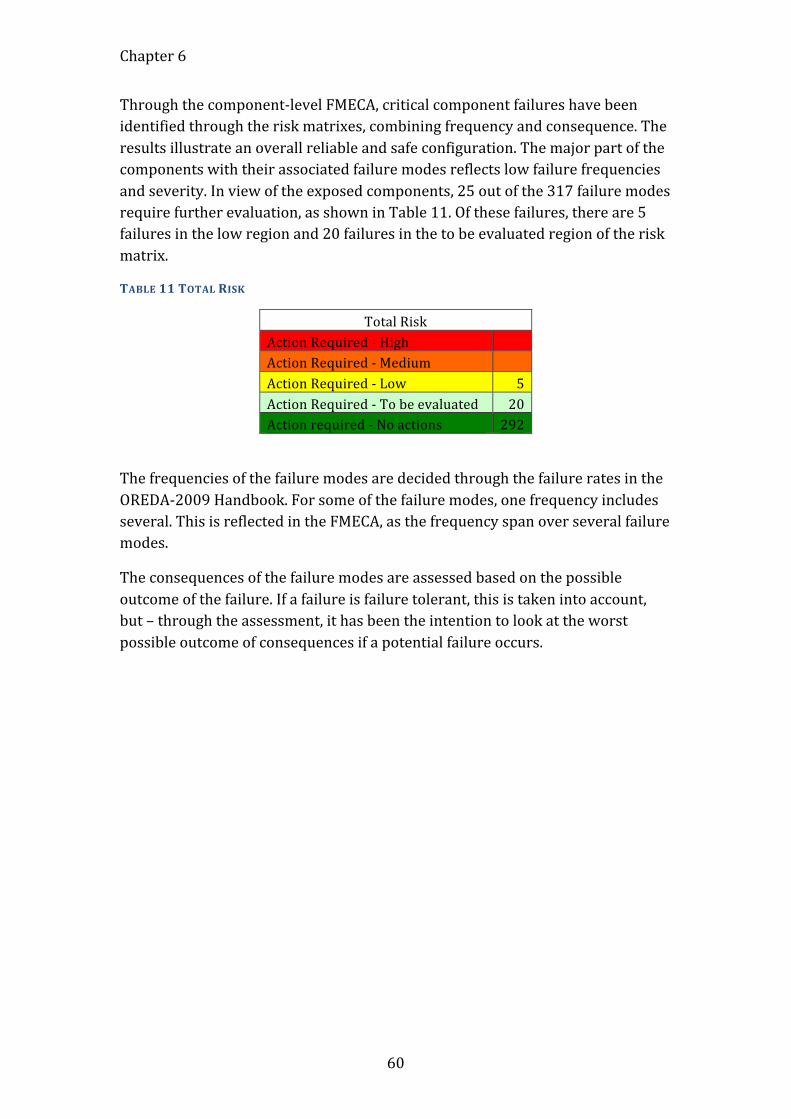
Chapter 6
60
Through the component-‐level FMECA, critical component failures have been identified through the risk matrixes, combining frequency and consequence. The results illustrate an overall reliable and safe configuration. The major part of the components with their associated failure modes reflects low failure frequencies and severity. In view of the exposed components, 25 out of the 317 failure modes require further evaluation, as shown in Table 11. Of these failures, there are 5 failures in the low region and 20 failures in the to be evaluated region of the risk matrix.
TABLE 11 TOTAL RISK
Total Risk Action Required -‐ High Action Required -‐ Medium Action Required -‐ Low 5 Action Required -‐ To be evaluated 20 Action required -‐ No actions 292
The frequencies of the failure modes are decided through the failure rates in the OREDA-‐2009 Handbook. For some of the failure modes, one frequency includes several. This is reflected in the FMECA, as the frequency span over several failure modes.
The consequences of the failure modes are assessed based on the possible outcome of the failure. If a failure is failure tolerant, this is taken into account, but – through the assessment, it has been the intention to look at the worst possible outcome of consequences if a potential failure occurs.
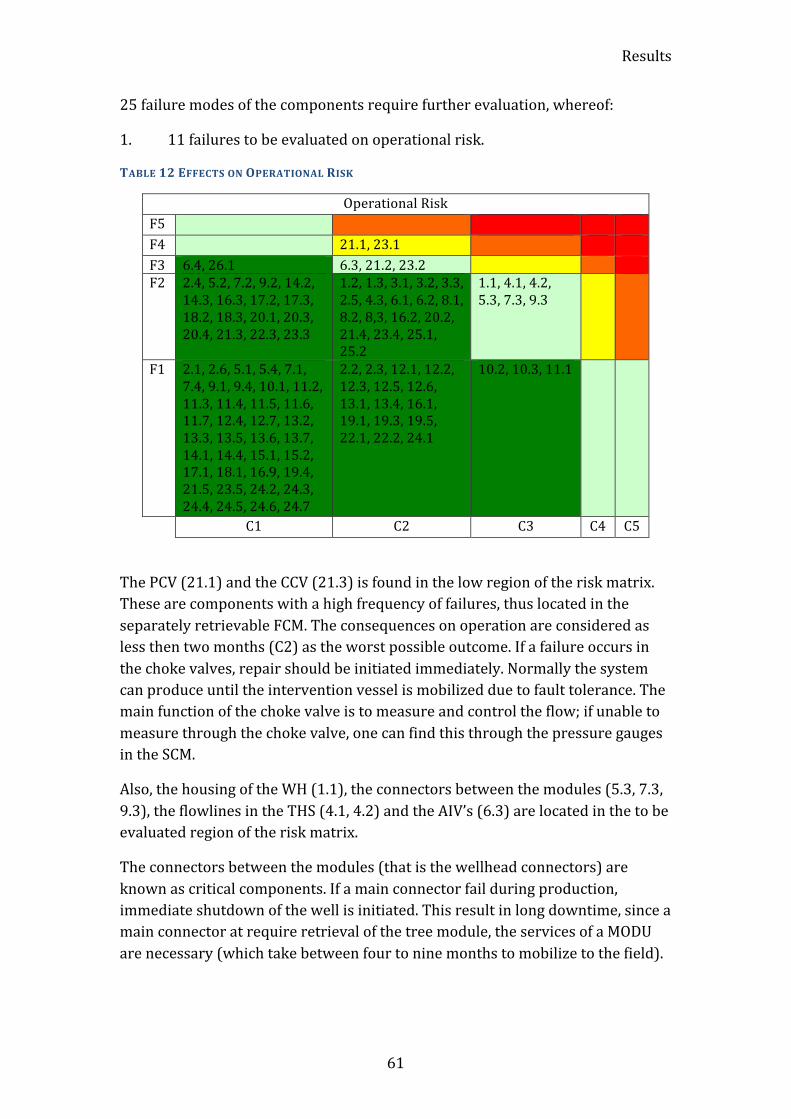
Results
61
25 failure modes of the components require further evaluation, whereof:
1. 11 failures to be evaluated on operational risk.
TABLE 12 EFFECTS ON OPERATIONAL RISK
Operational Risk F5 F4 21.1, 23.1 F3 6.4, 26.1 6.3, 21.2, 23.2 F2 2.4, 5.2, 7.2, 9.2, 14.2,
14.3, 16.3, 17.2, 17.3, 18.2, 18.3, 20.1, 20.3, 20.4, 21.3, 22.3, 23.3
1.2, 1.3, 3.1, 3.2, 3.3, 2.5, 4.3, 6.1, 6.2, 8.1, 8.2, 8,3, 16.2, 20.2, 21.4, 23.4, 25.1, 25.2
1.1, 4.1, 4.2, 5.3, 7.3, 9.3
F1 2.1, 2.6, 5.1, 5.4, 7.1, 7.4, 9.1, 9.4, 10.1, 11.2, 11.3, 11.4, 11.5, 11.6, 11.7, 12.4, 12.7, 13.2, 13.3, 13.5, 13.6, 13.7, 14.1, 14.4, 15.1, 15.2, 17.1, 18.1, 16.9, 19.4, 21.5, 23.5, 24.2, 24.3, 24.4, 24.5, 24.6, 24.7
2.2, 2.3, 12.1, 12.2, 12.3, 12.5, 12.6, 13.1, 13.4, 16.1, 19.1, 19.3, 19.5, 22.1, 22.2, 24.1
10.2, 10.3, 11.1
C1 C2 C3 C4 C5
The PCV (21.1) and the CCV (21.3) is found in the low region of the risk matrix. These are components with a high frequency of failures, thus located in the separately retrievable FCM. The consequences on operation are considered as less then two months (C2) as the worst possible outcome. If a failure occurs in the choke valves, repair should be initiated immediately. Normally the system can produce until the intervention vessel is mobilized due to fault tolerance. The main function of the choke valve is to measure and control the flow; if unable to measure through the choke valve, one can find this through the pressure gauges in the SCM.
Also, the housing of the WH (1.1), the connectors between the modules (5.3, 7.3, 9.3), the flowlines in the THS (4.1, 4.2) and the AIV’s (6.3) are located in the to be evaluated region of the risk matrix.
The connectors between the modules (that is the wellhead connectors) are known as critical components. If a main connector fail during production, immediate shutdown of the well is initiated. This result in long downtime, since a main connector at require retrieval of the tree module, the services of a MODU are necessary (which take between four to nine months to mobilize to the field).
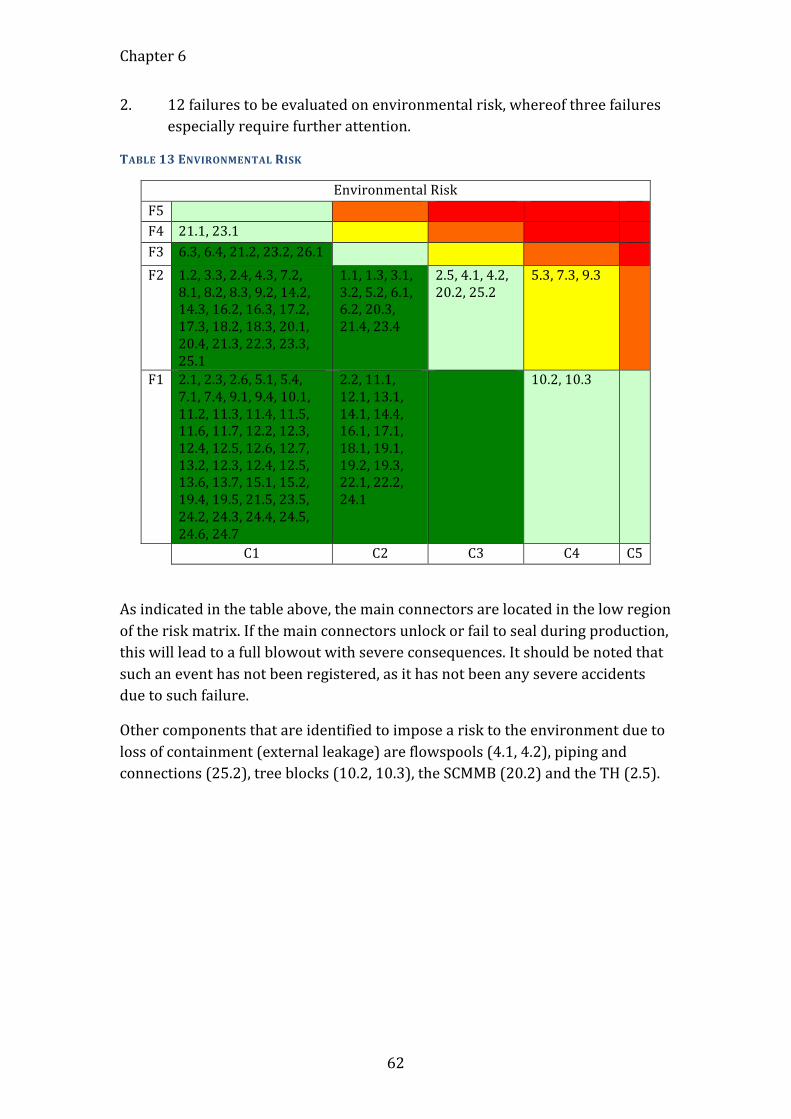
Chapter 6
62
2. 12 failures to be evaluated on environmental risk, whereof three failures especially require further attention.
TABLE 13 ENVIRONMENTAL RISK
Environmental Risk F5 F4 21.1, 23.1 F3 6.3, 6.4, 21.2, 23.2, 26.1 F2 1.2, 3.3, 2.4, 4.3, 7.2,
8.1, 8.2, 8.3, 9.2, 14.2, 14.3, 16.2, 16.3, 17.2, 17.3, 18.2, 18.3, 20.1, 20.4, 21.3, 22.3, 23.3, 25.1
1.1, 1.3, 3.1, 3.2, 5.2, 6.1, 6.2, 20.3, 21.4, 23.4
2.5, 4.1, 4.2, 20.2, 25.2
5.3, 7.3, 9.3
F1 2.1, 2.3, 2.6, 5.1, 5.4, 7.1, 7.4, 9.1, 9.4, 10.1, 11.2, 11.3, 11.4, 11.5, 11.6, 11.7, 12.2, 12.3, 12.4, 12.5, 12.6, 12.7, 13.2, 12.3, 12.4, 12.5, 13.6, 13.7, 15.1, 15.2, 19.4, 19.5, 21.5, 23.5, 24.2, 24.3, 24.4, 24.5, 24.6, 24.7
2.2, 11.1, 12.1, 13.1, 14.1, 14.4, 16.1, 17.1, 18.1, 19.1, 19.2, 19.3, 22.1, 22.2, 24.1
10.2, 10.3
C1 C2 C3 C4 C5
As indicated in the table above, the main connectors are located in the low region of the risk matrix. If the main connectors unlock or fail to seal during production, this will lead to a full blowout with severe consequences. It should be noted that such an event has not been registered, as it has not been any severe accidents due to such failure.
Other components that are identified to impose a risk to the environment due to loss of containment (external leakage) are flowspools (4.1, 4.2), piping and connections (25.2), tree blocks (10.2, 10.3), the SCMMB (20.2) and the TH (2.5).
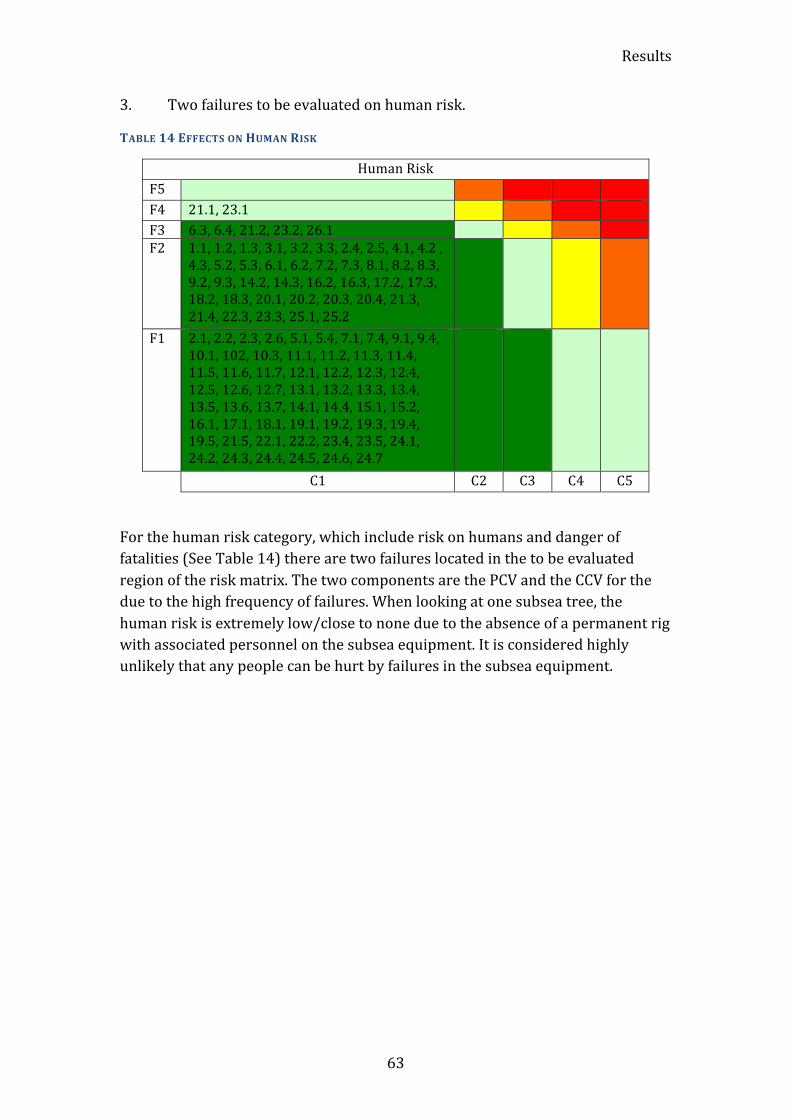
Results
63
3. Two failures to be evaluated on human risk.
TABLE 14 EFFECTS ON HUMAN RISK
Human Risk F5 F4 21.1, 23.1 F3 6.3, 6.4, 21.2, 23.2, 26.1 F2 1.1, 1.2, 1.3, 3.1, 3.2, 3.3, 2.4, 2.5, 4.1, 4.2 ,
4.3, 5.2, 5.3, 6.1, 6.2, 7.2, 7.3, 8.1, 8.2, 8.3, 9.2, 9.3, 14.2, 14.3, 16.2, 16.3, 17.2, 17.3, 18.2, 18.3, 20.1, 20.2, 20.3, 20.4, 21.3, 21.4, 22.3, 23.3, 25.1, 25.2
F1 2.1, 2.2, 2.3, 2.6, 5.1, 5.4, 7.1, 7.4, 9.1, 9.4, 10.1, 102, 10.3, 11.1, 11.2, 11.3, 11.4, 11.5, 11.6, 11.7, 12.1, 12.2, 12.3, 12.4, 12.5, 12.6, 12.7, 13.1, 13.2, 13.3, 13.4, 13.5, 13.6, 13.7, 14.1, 14.4, 15.1, 15.2, 16.1, 17.1, 18.1, 19.1, 19.2, 19.3, 19.4, 19.5, 21.5, 22.1, 22.2, 23.4, 23.5, 24.1, 24.2, 24.3, 24.4, 24.5, 24.6, 24.7
C1 C2 C3 C4 C5
For the human risk category, which include risk on humans and danger of fatalities (See Table 14) there are two failures located in the to be evaluated region of the risk matrix. The two components are the PCV and the CCV for the due to the high frequency of failures. When looking at one subsea tree, the human risk is extremely low/close to none due to the absence of a permanent rig with associated personnel on the subsea equipment. It is considered highly unlikely that any people can be hurt by failures in the subsea equipment.
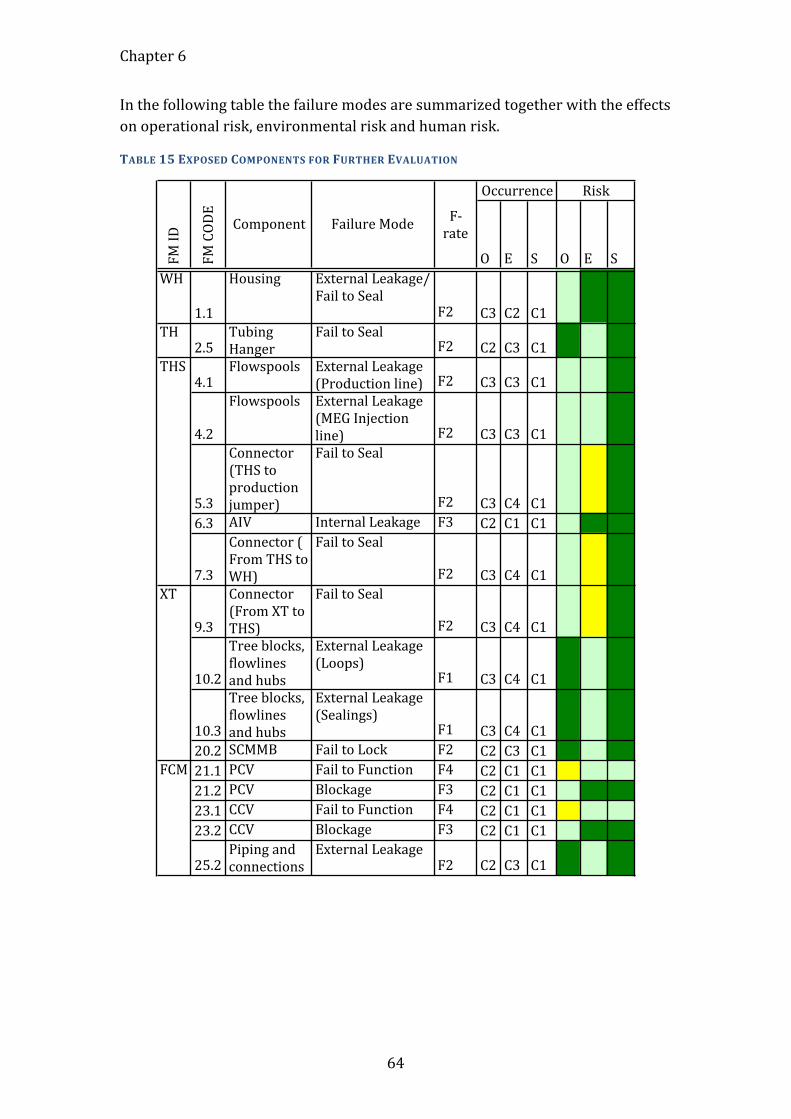
Chapter 6
64
In the following table the failure modes are summarized together with the effects on operational risk, environmental risk and human risk.
TABLE 15 EXPOSED COMPONENTS FOR FURTHER EVALUATION
O E S O E SWH
1.1
Housing External4Leakage/4Fail4to4Seal
F2 C3 C2 C1TH
2.5Tubing4Hanger
Fail4to4SealF2 C2 C3 C1
4.1Flowspools External4Leakage4
(Production4line) F2 C3 C3 C1
4.2
Flowspools External4Leakage4(MEG4Injection4line) F2 C3 C3 C1
5.3
Connector4(THS4to4production4jumper)
Fail4to4Seal
F2 C3 C4 C16.3 AIV Internal4Leakage F3 C2 C1 C1
7.3
Connector4(4From4THS4to4WH)
Fail4to4Seal
F2 C3 C4 C1
9.3
Connector4(From4XT4to4THS)
Fail4to4Seal
F2 C3 C4 C1
10.2
Tree4blocks,4flowlines4and4hubs
External4Leakage4(Loops)
F1 C3 C4 C1
10.3
Tree4blocks,4flowlines4and4hubs
External4Leakage4(Sealings)
F1 C3 C4 C120.2 SCMMB Fail4to4Lock F2 C2 C3 C121.1 PCV Fail4to4Function F4 C2 C1 C121.2 PCV Blockage F3 C2 C1 C123.1 CCV Fail4to4Function F4 C2 C1 C123.2 CCV Blockage F3 C2 C1 C1
25.2Piping4and4connections
External4LeakageF2 C2 C3 C1
FCM
FWrate
RiskOccurrenceFM
4ID
FM4CODE
Component Failure4Mode
THS
XT
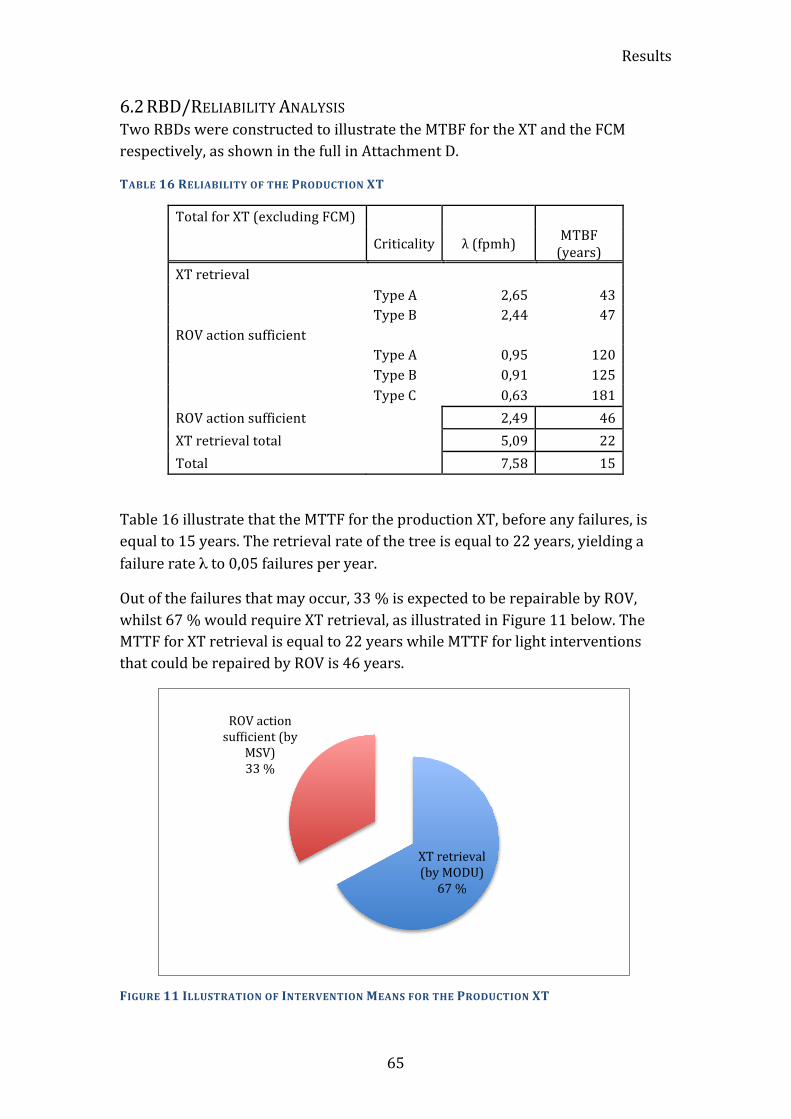
Results
65
6.2 RBD/RELIABILITY ANALYSIS Two RBDs were constructed to illustrate the MTBF for the XT and the FCM respectively, as shown in the full in Attachment D.
TABLE 16 RELIABILITY OF THE PRODUCTION XT
Total for XT (excluding FCM)
Criticality λ (fpmh) MTBF (years)
XT retrieval
Type A 2,65 43 Type B 2,44 47 ROV action sufficient
Type A 0,95 120 Type B 0,91 125 Type C 0,63 181 ROV action sufficient
2,49 46
XT retrieval total
5,09 22 Total 7,58 15
Table 16 illustrate that the MTTF for the production XT, before any failures, is equal to 15 years. The retrieval rate of the tree is equal to 22 years, yielding a failure rate λ to 0,05 failures per year.
Out of the failures that may occur, 33 % is expected to be repairable by ROV, whilst 67 % would require XT retrieval, as illustrated in Figure 11 below. The MTTF for XT retrieval is equal to 22 years while MTTF for light interventions that could be repaired by ROV is 46 years.
FIGURE 11 ILLUSTRATION OF INTERVENTION MEANS FOR THE PRODUCTION XT
XT retrieval (by MODU) 67 %
ROV action suf{icient (by
MSV) 33 %
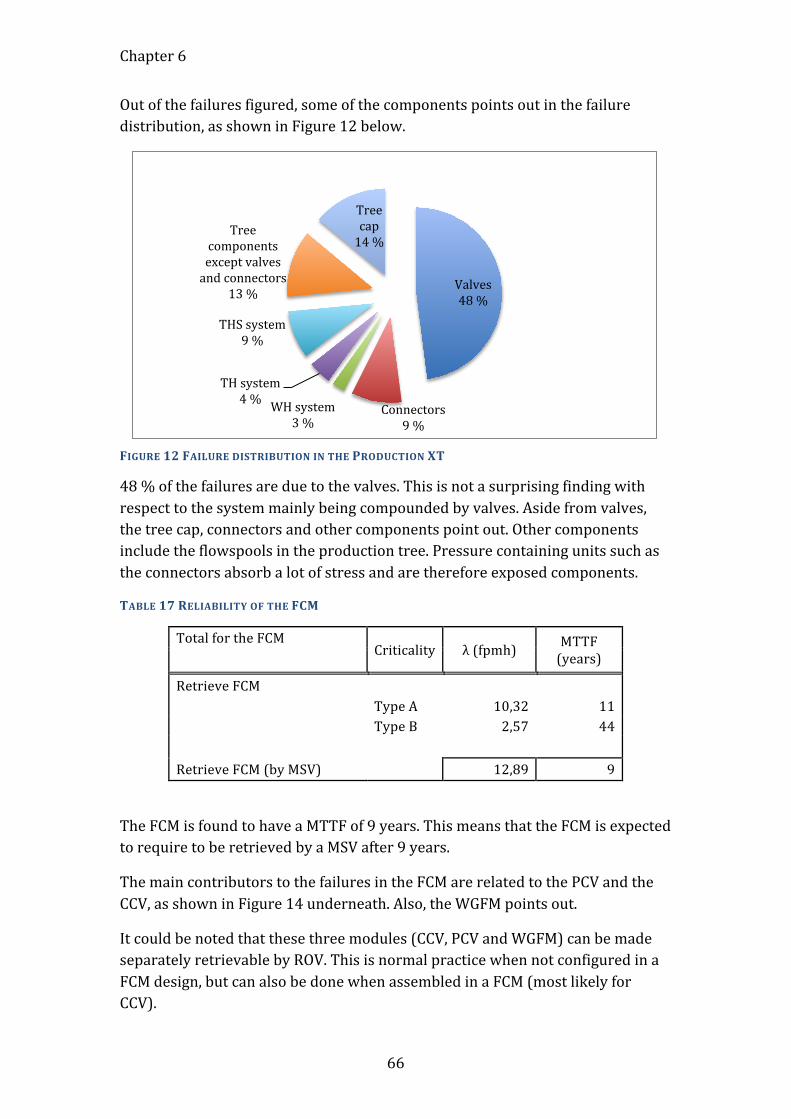
Chapter 6
66
Out of the failures figured, some of the components points out in the failure distribution, as shown in Figure 12 below.
FIGURE 12 FAILURE DISTRIBUTION IN THE PRODUCTION XT
48 % of the failures are due to the valves. This is not a surprising finding with respect to the system mainly being compounded by valves. Aside from valves, the tree cap, connectors and other components point out. Other components include the flowspools in the production tree. Pressure containing units such as the connectors absorb a lot of stress and are therefore exposed components.
TABLE 17 RELIABILITY OF THE FCM
Total for the FCM Criticality λ (fpmh) MTTF
(years)
Retrieve FCM
Type A 10,32 11 Type B 2,57 44
Retrieve FCM (by MSV) 12,89 9
The FCM is found to have a MTTF of 9 years. This means that the FCM is expected to require to be retrieved by a MSV after 9 years.
The main contributors to the failures in the FCM are related to the PCV and the CCV, as shown in Figure 14 underneath. Also, the WGFM points out.
It could be noted that these three modules (CCV, PCV and WGFM) can be made separately retrievable by ROV. This is normal practice when not configured in a FCM design, but can also be done when assembled in a FCM (most likely for CCV).
Valves 48 %
Connectors 9 %
WH system 3 %
TH system 4 %
THS system 9 %
Tree components except valves and connectors
13 %
Tree cap 14 %
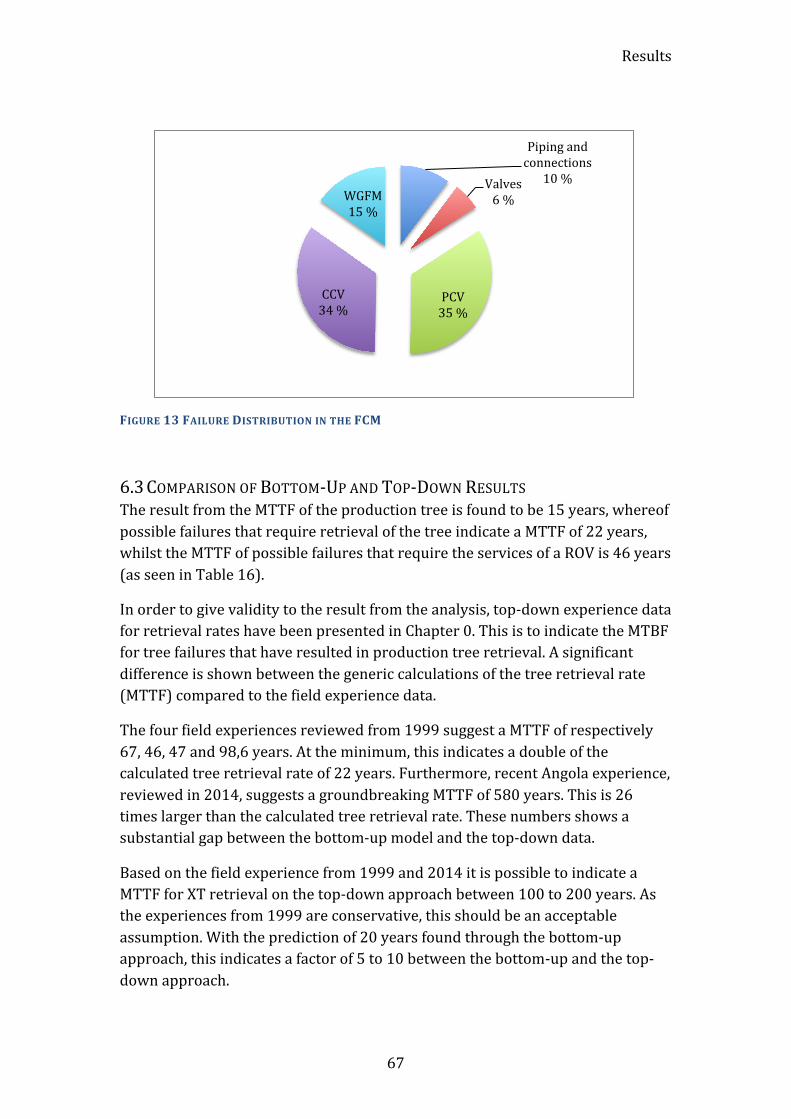
Results
67
FIGURE 13 FAILURE DISTRIBUTION IN THE FCM
6.3 COMPARISON OF BOTTOM-‐UP AND TOP-‐DOWN RESULTS The result from the MTTF of the production tree is found to be 15 years, whereof possible failures that require retrieval of the tree indicate a MTTF of 22 years, whilst the MTTF of possible failures that require the services of a ROV is 46 years (as seen in Table 16).
In order to give validity to the result from the analysis, top-‐down experience data for retrieval rates have been presented in Chapter 0. This is to indicate the MTBF for tree failures that have resulted in production tree retrieval. A significant difference is shown between the generic calculations of the tree retrieval rate (MTTF) compared to the field experience data.
The four field experiences reviewed from 1999 suggest a MTTF of respectively 67, 46, 47 and 98,6 years. At the minimum, this indicates a double of the calculated tree retrieval rate of 22 years. Furthermore, recent Angola experience, reviewed in 2014, suggests a groundbreaking MTTF of 580 years. This is 26 times larger than the calculated tree retrieval rate. These numbers shows a substantial gap between the bottom-‐up model and the top-‐down data.
Based on the field experience from 1999 and 2014 it is possible to indicate a MTTF for XT retrieval on the top-‐down approach between 100 to 200 years. As the experiences from 1999 are conservative, this should be an acceptable assumption. With the prediction of 20 years found through the bottom-‐up approach, this indicates a factor of 5 to 10 between the bottom-‐up and the top-‐down approach.
Piping and connections
10 % Valves 6 %
PCV 35 %
CCV 34 %
WGFM 15 %
Chapter 6
68
It should be noted, for clarity, that the MTTF estimates is not meant for one XT in operation – the tree would obviously reach wear-‐out long before this number of years. It is meant for a population of trees in operation before they reach wear out. By this means, with a large field of for an example 30 trees, if a MTTF estimate of 300 years is expected – a tree would be expected to be retrieved due to tree failures every 10 years.
Figure 12 (Chapter 6.2) illustrate the intervention means for the production tree, whereof the majority (67%) of the failures would require retrieval of the tree, while the minority (33 %) of the failures can be restored by light interventions. This contrasts with the GE Oil & Gas experience, as described earlier in Chapter 0., that the Pareto-‐rule is applicable.
The Pareto-‐rule would state that the majority (80 %) of the failures can be restored by light intervention means such as ROV override, while only the minority (20 %) of the failures would require XT retrieval, thus the highest intervention cost.
If in fact 80% of the XT critical failures can be restored by light intervention means, the total MTTF of 15 years predicted for XT critical failures by the bottom-‐up approach then result in an XT retrieval rate of 75 years. This is closer to the expectations indicated by the top-‐down approach, but still not similar to the levels indicated by recent field experience.
Discussion
69
7 DISCUSSION This chapter consists of two parts. Firstly there will be a discussion of findings from the performed study. The second part will be a discussion of the framework used to obtain/produce these results.
7.1 DISCUSSION OF RESULTS The substantial gap between the bottom-‐up model and the top-‐down data presented in Chapter 6.3 raise the question in what amount XT failures will result in retrieval of the XT. Such a gap between experienced figures and calculations indicate that the input data is either too conservative or the assumptions made are too inaccurate, or a combination of the two.
Through the RBD conducted, it seems as though redundancy is not reflected in the system, but the truth is that the XT has tolerance for errors built into the design. In particular, this is reflected in back-‐up solutions for problems that might occur, which primarily reduce the need for retrieval of the tree if an error first occurs. This is one of the main reasons that the actual retrieval rate of trees is much lower than the single component reliability would suggest. This is discussed further under Simplifications and Weaknesses of the RBD.
The sole source for reliability data applied to the bottom-‐up approach is the OREDA-‐2009 handbook. The handbook is deliberately selected as single source for reliability in the current study due to the recognized conservative output. This is in order to illustrate the expected differential factor to field experience data/other inputs.
The data presented in OREDA are based on a set of individual components with different histories, properties, characteristics and functions. When assessing the reliability data from the handbook, not including the database, the failure rates are only given based on the equipment unit name, without the history of the item. Therefore, the frequencies of the failures might have benefitted further modification, based on specific conditions and properties of the equipment and input from an engineer with massive experience on the subject to fit with the case at hand. As an example, for a component with material of high-‐strength steel, material failure can be neglected. Hence, a more in-‐depth use of data from the OREDA database, looking at failure data in more detail, could have affected the output of this research. The data set is used directly in this study to highlight this issue.
Out of the failures featured in the production tree, seen in Figure 12, 48 % are due to the valves. Asides from valve failures, the tree cap and connectors points out. The figure reflects a typical distribution of failures regarding the production tree as expected by experienced engineers (as found in internal GE Oil & Gas documents).
Chapter 7
70
The MTTF to retrieval of the FCM by a light intervention vessel such as MSV is found to be 9 years. This is an interesting finding as this is not far from realistic, particularly for the complex FCM with several sophisticated instruments, which is the one, considered here. This raise a question why the MTTF of the FCM seems to be more representative compared to the production tree module, when based on the same data source. The FCM is used for packing less reliable components since the module only require light intervention to be retrieved. The reason that this module has more concurrent results for calculated and experienced failure rates, could be that the FCM is dominated by two or three individual components where it is not that difficult to keep track of failure modes and effects, and that these components actually fail a portion so that it exists enough data to predict failure rates with some confidence.
Collating and storing operating data is crucial to failure prevention and elimination strategy. Improving the reliability and availability of XTs will depend on the availability of useful historic failure data. It is therefore imperative to have a comprehensive inventory of all components within a XT in an integrated asset register and data management system. This will keep a track record of each valve and the like within the XT in a meaningful format that can be used for optimization processes and for an informed decision making processes.
7.2 DISCUSSION OF THE FRAMEWORK USED TO OBTAIN THE RESULTS Reliability requirements are normally part of contractual requirements based on experiences of failure. The reliability target is typically set as a final absolute result in terms of MTTF or as an overall availability figure. This is an understandable tactic, but do not necessarily evolve into a sound strategy for achieving reliability. The suppliers may consider the reliability measures met if the listed issues have been dealt with. Conversely, without a set reliability target, the underlying signal to the supplier is “supply whatever reliability at the lowest possible cost”. Suppliers need to impose strict requirements within the organization to ensure that reliability goals are met in right fashion with the correct purpose.
A reliability model should represent a system and its usage in such a way that it mirrors the reality as close as possible. To produce useful models in a timely fashion, practical simplifications and assumptions are usually made to balance the effort of reflecting a close-‐to-‐reality. This implies that models used for reliability calculations should contain approximations based on reasoned arguments and engineering judgments to reduce the complexity of the model.
Uncertainties for the analysis conducted include:
• To what extend data are applicable to the current system and inadequate data gathering.
Discussion
71
• Equipment novelty issues – Lack of relevant reliability data. • Erroneous classification of failures criticality (Critical, degraded or
incipient at component level, leading to type A, type B or type C at XT system level).
• Assumptions on operational modes and repair strategies. • Erroneous interpretation of the system component failure modes and
approximations following the reliability modeling approaches.
Errors in input failure data are critical. The one source of reliability data applied is the OREDA Handbook, which for example yet has not included THS in the scope of subsystems for the XT system. Therefore, assumptions have been made based on compatible components from other parts of the XT system. Consequently, the principles from NORSOK Z-‐016 (See Chapter 2.2.1) have been followed for the application of the reliability data to ensure rightful use.
It shall also be noted that the failure modes that are listed in OREDA are not the most practical as the registered failures are failures that have occurred on the components underlying the project and do not provide a full model of potential failures, ranked by importance, frequency, etc., from the beginning. Thus, one may overlook very important issues to be addressed. The registered failures are divided into critical, degraded and incipient. However, this set of classification is not optimal as the third category is too vague. Therefore, the incipient category has been excluded from the analysis.
Furthermore, the data from OREDA covers only in-‐service failures. Failures recorded prior to start-‐up are excluded. It is also vital to be aware that the correct reliability pictures depend on a number of additional parameters not included in the analysis. If performed appropriately, these parameters will improve the reliability and vice versa if performed less appropriately.
Chapter 7
72
Notably, the following parameters will affect the observed reliability of the XT system:
• Operation attitude/approach • Training of personnel for operation, installation and repair • Maintenance strategies, such as making repair parts readily available,
ensuring proper handling of products during repair and coordination of installation and intervention procedures.
• Functional requirements • System configuration and complexity
These parameters do not improve the reliability of the components, but they do result in better reliability and availability of the XT system if performed correctly. This could be a theme for further research.
7.2.1 SIMPLIFICATION OF THE SYSTEM The scope is limited in this study to the XT system and systems that influence the XT system in terms of XT retrieval rate and downtime due to XT failures. Therefore, the control systems with associated monitoring equipment are excluded from the analysis conducted. ISO 14224:2006 stipulates that the SCM and other control system parts can be considered outside the scope of the XT system or as subunits or maintainable units of the XT system.
In the context of this study, the SCM is beyond this scope to achieve predictability in the results. The SCM would have caused noise in the data set so that the focus is removed from the XT itself. SCM and control instrument failures will not result in XT retrieval, which is the main objective of this thesis. It is therefore reasonable to include the SCM with the rest of the subsea control system when performing a RAM analysis on an entire or a part of a field.
Nonetheless, the main functions of a XT include functioning as a barrier between the reservoir and the environment and to control and monitor the well. All monitoring devices are connected and controlled by the SCM. In view of this, by eliminating the SCM one also eliminates the equipment installed on the tree for monitoring means such as the pressure and temperature transmitters. If the monitoring instrumentation were considered critical on a field, the instrumentation would be designed redundant to the degree that it would be close-‐to negligible. By this, instrumentation can be modeled quadruple to the degree where the instrumentation is considered negligible.
Discussion
73
7.2.2 SIMPLIFICATIONS AND WEAKNESSES OF THE FMECA The FMECA is performed on a component-‐level for the DVXT with main components and failure modes evaluated on frequency and consequence.
The consequence matrix is scaled from C1 to C5 (Ref. Table 4 Severity Matrix), but in accordance with GE Oil & Gas FMECA procedures, the consequences have only been evaluated from C1 to C3. The XT usually have impact only on (the volume of) production from one well. C3 correspond to long-‐term loss of one well, while C4 is linked towards long-‐term loss of production from entire drill centers (4 to 6 wells), while C5 applies to long-‐term loss of an entire field (several drill centers). In hindsight, it could have been appropriate to use a larger scale of the consequence matrix with smaller intervals on the production impact when only assessing one tree. For example, C1 could be less than two days impact, C2 less than two weeks, C3 less than two months and C4 less than one year. This would have been beneficial in allocating the consequences, as most of the failure modes assessed has been placed in C1 with the consequence matrix used, even though some of the failures would reflect 1-‐2 days downtime of the well and other up to 14 days. Also, it would be beneficial when allocating the consequence and frequency in the risk matrix, as more of the failure modes would be assigned at a greater span in the risk matrix.
It also may be criticized to use risk matrixes on component level. If misused, undesirable risks can be tampered to fit the wanted result. By evaluating the subsystems in the tree as a whole and how they act together – one might find a higher risk for the system. The risk matrixes are put in a more meaningful matter if used on system-‐level rather than at a component-‐level.
7.2.3 SIMPLIFICATIONS AND WEAKNESSES OF THE RBD When the XT retrieval rate was calculated with the RBD, the failure modes were assigned to one out of two repair scenarios: either it required XT retrieval or it was repairable by ROV. This does not mirror a realistic reliability picture, as it usually is not predetermined whether a failure mode is repairable by light interventions or requires XT retrieval. The generalization was still made for this research, as having this as an open possibility for all failures, would severely obscure dataset, results and hence usability of the study.
Through the RBD conducted, it seems as though redundancy is not reflected in the system, but the truth is that the XT has tolerance for errors built into the design (see below for a list of examples). In particular, this is reflected in back-‐up solutions for problems that might occur, which primarily reduce the need for retrieval of the tree if an error first occurs. This is one of the main reasons that the actual retrieval rate of trees is much lower than the single component reliability would suggest.
Chapter 7
74
Fault tolerance/redundancy that is built into the XT design may include contingency modes of operation, which means that components can adopt a function if another component loose its function, or fallback systems for failure critical components. Such systems are elaborated on in Chapter 5.5.
The bottom line is that most of the components in the XT system have individual failure modes that are critical and therefore they are put in series in the reliability analysis, even though some of the failure modes in the component are failure tolerant with solutions that prevent the error to have an impact. The failure tolerant failure modes may be compensated by comments in the RBD so that in a further RAM-‐analysis, it will be modeled more realistically. Ideally, the RBD should be made with separate failure modes for components that have potential failures modes that are failure tolerant and vice versa.
Conclusion and Further Work
75
8 CONCLUSION AND FURTHER WORK
8.1 SUMMARY AND CONCLUSION In this master thesis, the main objective is to study a specific XT system and to estimate the retrieval rate due to tree failures based on commercially available reliability data. Further this has been compared to high-‐level experience data presented. This is to initiate the process to alleviate the gap seen between generic calculations of the tree retrieval rate compared to known field experience.
To assess the DVXT system, a reliability analysis is performed. The reliability analysis is achieved in the following steps with proven methods from the reliability engineering discipline:
1. FMECA/Failure analysis 2. RBD/Reliability analysis
A component-‐level FMECA is conducted to develop an understanding of main components with essential functional requirements, criticality and effect resulting from functional failure. The results from the bottom-‐up reliability analysis indicate a retrieval rate of the production tree near 22 years.
Through the performed reliability analysis, the DVXT system has confirmed its reputation as a reliable configuration with high operating reliability and associated low risk. Nonetheless, several assumptions have been made. The focus of this thesis is not at the absolute result, but is meant to illustrate a reliability issue experienced by GE Oil & Gas in the calculation of reliability based on generic reliability data versus field experience data. The OREDA-‐2009 Handbook is deliberately used as a sole source for raw data to illustrate this issue, as the handbook is known to give conservative results when calculations is performed purely based on it. However, it can well be seen as desirable that calculations are more cautious than a real situation, but a natural question here is to what extend.
It is shown a significant gap between the bottom-‐up approach and the experience data presented. Based on the field experience collected it is indicated a MTTF for XT retrieval on the top-‐down approach between 100 to 200 years. This implies a factor of 5 to 10 between the bottom-‐up and the top-‐down approach.
Further, it is indicated by GE Oil & Gas that a Pareto-‐rule seem to apply when deciding if failures require heavy workover such as XT retrieval or light intervention means such as ROV remedial actions upon repair. Applied to the sensitivity case to the bottom-‐up approach, assuming that in fact 80% of XT
Chapter 8
76
critical failures can be restored by light intervention means, the total MTBF of 15 years predicted for XT critical failures then results in an XT retrieval rate of 75 years. This is nearer to the expectations indicated by the top-‐down approach, but still not close to the levels indicated by recent field experience.
This indicates that the bottom-‐up model should be calibrated with input data that is based on experience data rather than solely generic data to alleviate some of the distance between the outputs for the two approaches. This can be performed in shape of additional model parameters, modification factors or other refinements. The solution to this is however not presented in this thesis. The Pareto-‐rule may be used to calibrate this gap, if shown applicable based on comprehensive historic data.
8.2 FURTHER WORK Improving the reliability and availability of XT mean retrieval time depend on the availability of useful historic failure data. There is an unrealized potential for a structured data-‐collecting and organizing tool aimed at field experience that include number of trees installed, years in operation, number of failures, corresponding repair activity, etc. In lack of such a tool, the generic and apparent misleading retrieval rate is emphasized to a higher degree than one might wish.
Comprehensive work has to be executed to introduce shape or model parameters for the reliability data, such as the Pareto-‐rule. A possible first phase approach is to go deep into the Subsea OREDA database and investigate the failures that have occurred, the reason for the failure and the corresponding repair activity. This could expose a pattern. The problem here is that the different participants in the project only have in-‐depth knowledge about their own components in addition to a common release-‐area among the participants. None of the participants in the OREDA project have the inventory of all the components included. To gain insight in the entire database, research could be executed in a collaborative work, perhaps through a concrete delivery project. This could enable the sought after a model parameter. Further, this parameter should be rechecked for a best estimate on empirical data. This would require appropriate empiric data. In the third phase, this should be related to mechanical theory, whereof probability, confidence intervals and light intervention means.
Several assumptions were made through the study. The assumptions and methods used should be evaluated before continuing any process based on the results. Attention should be given to the consequence matrix in the FMECA, which could have included more of the classes (at least C1 to C4). Further, the RBD could be evaluated, as it could reflect the tolerance of errors that is built into the design. This may be compensated by comments in the RBD so that it can be modeled accordingly in a further RAM-‐analysis. Ideally, the RBD should be made with failure modes separately for failures that are failure tolerant and vice

Conclusion and Further Work
77
versa. If put into a further RAM analysis, the monitoring equipment and the SCM should be assessed in relation to the DVXT system to mirror the reality that risk analysis strive to depict.
Chapter 0
78
BIBLIOGRAPHY American Petroleum Institute (API). (2011). API SPEC 17D: Design and Operation of Subsea Production Systems — Subsea Wellhead and Tree Equipment.
American Petroleum Institute (API). (2010). API SPEC 6A: Specification for Wellhead and Christmas Tree Equipment.
(ENI), H.-‐E. B., (Statoil), H. B., (NTNU), S. S., (UiS), B. S., (Shell), J. S., (Total), S. J., et al. (2012). An Introduction to Well Integrity.
Bai, Y., & Bai, Q. (2012). Subsea Engineering Handbook. Gulf Professional Publishing.
DNV GL. (2010). DNV RP B401: Cathodic Protection Design.
FMC Technologies. (2013). Global Supplier Handbook.
ISO 10423. (2009). Petroleum and natural gas industries; Drilling and production equipment -‐ Wellhead and christmas tree equipment.
ISO 13628-‐4. (2010). Petroleum and natural gas industries -‐ Design and operation of subsea production systems.
ISO 14224. (2006). Petroleum, petrochemical and natural gas industries -‐-‐ Collection and exchange of reliability and maintenance data for equipment.
Molnes, E. (2012). Risikoanalyser for brønner i operasjon i situasjoner med barrieresvikt.
NORSOK D-‐010. (n.d.). Well integrity in drilling and well operations.
NORSOK Z-‐016. (n.d.). Regularity mangement & reliability technology.
Rausand, M., & Høyland, A. (2004). System Reliability Theory: Models, Statistical Methods, and Applications.
SINTEF. (2009). OREDA: Offshore Reliability Data.
Statoil ASA. (2013). Deep Water XT -‐ Subsea Forum.
White, P. W. (2013). Drivers influencing the evolution of horizontal and vertical trees .

Appendices
79
APPENDICES

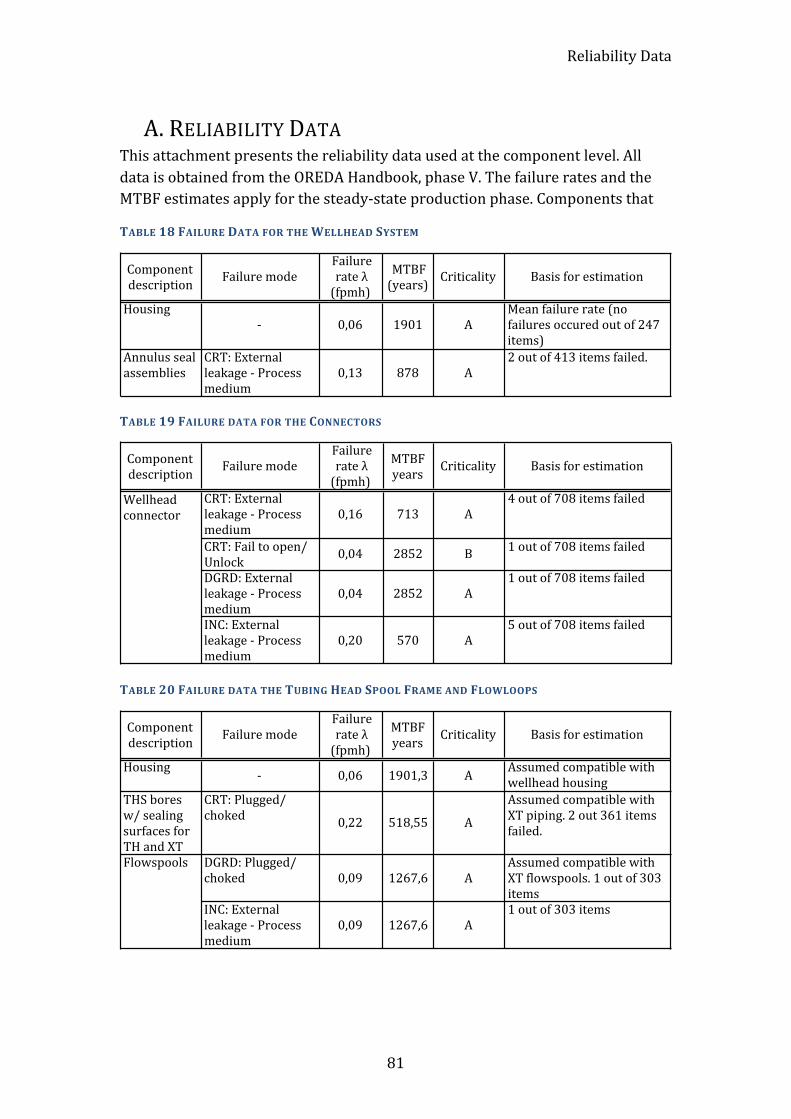
Reliability Data
81
A. RELIABILITY DATA This attachment presents the reliability data used at the component level. All data is obtained from the OREDA Handbook, phase V. The failure rates and the MTBF estimates apply for the steady-‐state production phase. Components that
TABLE 18 FAILURE DATA FOR THE WELLHEAD SYSTEM
TABLE 19 FAILURE DATA FOR THE CONNECTORS
TABLE 20 FAILURE DATA THE TUBING HEAD SPOOL FRAME AND FLOWLOOPS
Component(description Failure(mode
Failure(rate(λ((fpmh)
MTBF(((((((years) Criticality Basis(for(estimation
Housing= 0,06 1901 A
Mean(failure(rate((no(failures(occured(out(of(247(items)
Annulus(seal(assemblies
CRT:(External(leakage(=(Process(medium
0,13 878 A2(out(of(413(items(failed.
Component(description Failure(mode
Failure(rate(λ((fpmh)
MTBF((((((years Criticality Basis(for(estimation
CRT:(External(leakage(A(Process(medium
0,16 713 A4(out(of(708(items(failed
CRT:(Fail(to(open/(Unlock 0,04 2852 B 1(out(of(708(items(failed
DGRD:(External(leakage(A(Process(medium
0,04 2852 A1(out(of(708(items(failed
INC:(External(leakage(A(Process(medium
0,20 570 A5(out(of(708(items(failed
Wellhead(connector
Component(description Failure(mode
Failure(rate(λ((fpmh)
MTBF((((((years Criticality Basis(for(estimation
Housing = 0,06 1901,3 A Assumed(compatible(with(wellhead(housing
THS(bores(w/(sealing(surfaces(for(TH(and(XT
CRT:(Plugged/(choked 0,22 518,55 A
Assumed(compatible(with(XT(piping.(2(out(361(items(failed.(
DGRD:(Plugged/(choked 0,09 1267,6 A
Assumed(compatible(with(XT(flowspools.(1(out(of(303(items
INC:(External(leakage(=(Process(medium
0,09 1267,6 A1(out(of(303(items
Flowspools
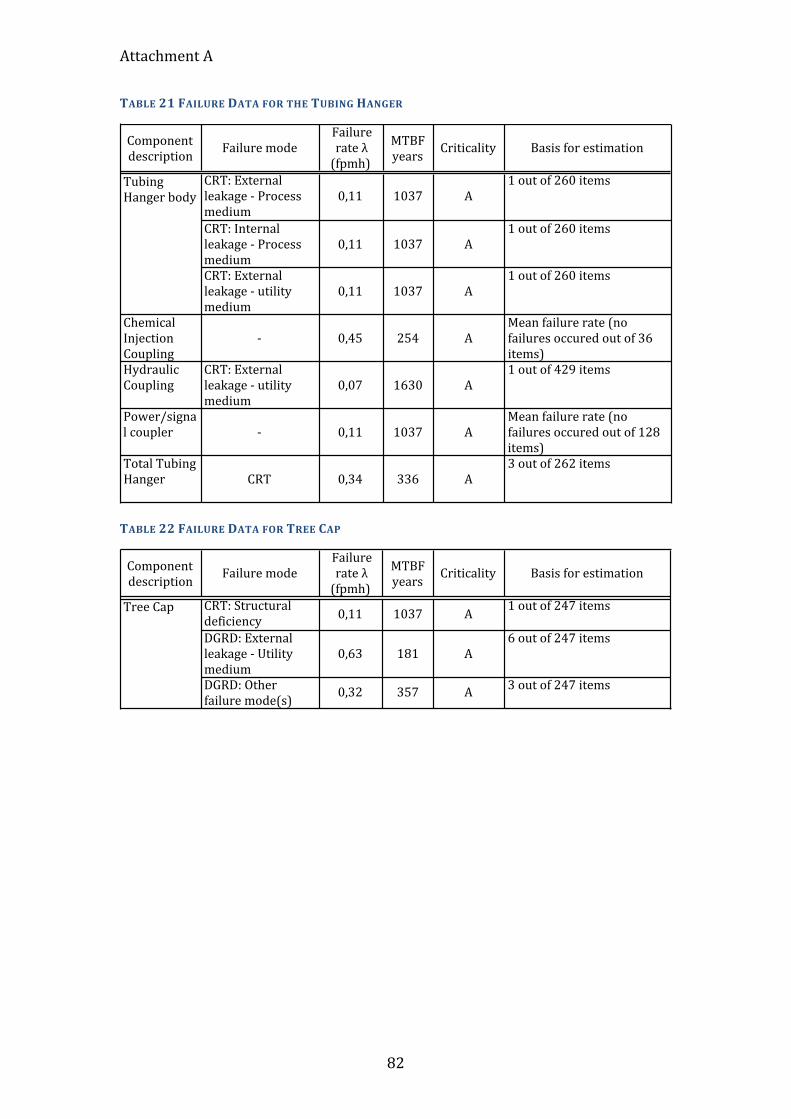
Attachment A
82
TABLE 21 FAILURE DATA FOR THE TUBING HANGER
TABLE 22 FAILURE DATA FOR TREE CAP
Component(description Failure(mode
Failure(rate(λ((fpmh)
MTBF((((((years Criticality Basis(for(estimation
CRT:(External(leakage(A(Process(medium
0,11 1037 A1(out(of(260(items
CRT:(Internal(leakage(A(Process(medium
0,11 1037 A1(out(of(260(items
CRT:(External(leakage(A(utility(medium
0,11 1037 A1(out(of(260(items
Chemical(Injection(Coupling
A 0,45 254 AMean(failure(rate((no(failures(occured(out(of(36(items)(
Hydraulic(Coupling
CRT:(External(leakage(A(utility(medium
0,07 1630 A1(out(of(429(items
Power/signal(coupler A 0,11 1037 A
Mean(failure(rate((no(failures(occured(out(of(128(items)(
Total(Tubing(Hanger CRT 0,34 336 A
3(out(of(262(items
Tubing(Hanger(body
Component(description Failure(mode
Failure(rate(λ((fpmh)
MTBF((((((years Criticality Basis(for(estimation
CRT:(Structural(deficiency 0,11 1037 A 1(out(of(247(items
DGRD:(External(leakage(L(Utility(medium
0,63 181 A6(out(of(247(items
DGRD:(Other(failure(mode(s) 0,32 357 A 3(out(of(247(items
Tree(Cap(
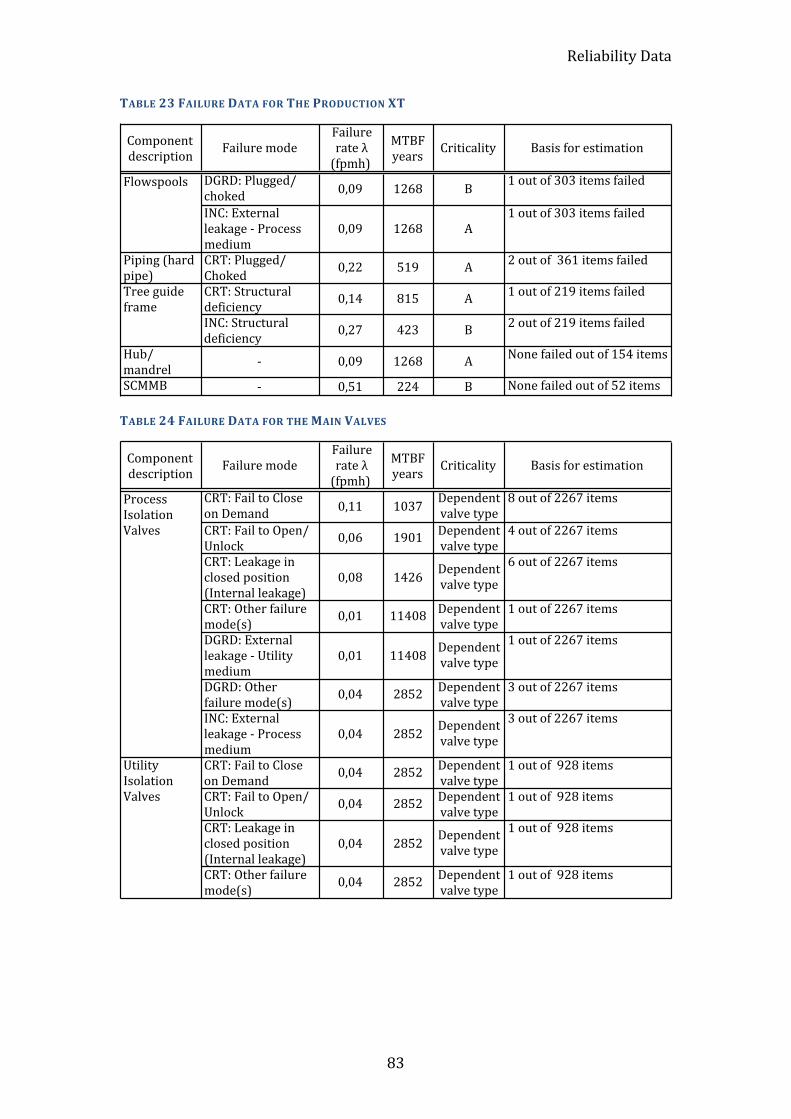
Reliability Data
83
TABLE 23 FAILURE DATA FOR THE PRODUCTION XT
TABLE 24 FAILURE DATA FOR THE MAIN VALVES
Component(
descriptionFailure(mode
Failure(
rate(λ(
(fpmh)
MTBF((((((
yearsCriticality Basis(for(estimation
DGRD:(Plugged/(
choked0,09 1268 B
1(out(of(303(items(failed
INC:(External(
leakage(O(Process(
medium
0,09 1268 A
1(out(of(303(items(failed
Piping((hard(
pipe)
CRT:(Plugged/(
Choked0,22 519 A
2(out(of((361(items(failed
CRT:(Structural(
deficiency0,14 815 A
1(out(of(219(items(failed
INC:(Structural(
deficiency0,27 423 B
2(out(of(219(items(failed
Hub/(
mandrelO 0,09 1268 A
None(failed(out(of(154(items
SCMMB O 0,51 224 B None(failed(out(of(52(items
Flowspools
Tree(guide(
frame
Component(description Failure(mode
Failure(rate(λ((fpmh)
MTBF((((((years Criticality Basis(for(estimation
CRT:(Fail(to(Close(on(Demand 0,11 1037 Dependent(
valve(type8(out(of(2267(items
CRT:(Fail(to(Open/(Unlock 0,06 1901 Dependent(
valve(type4(out(of(2267(items
CRT:(Leakage(in(closed(position((Internal(leakage)
0,08 1426 Dependent(valve(type
6(out(of(2267(items
CRT:(Other(failure(mode(s) 0,01 11408 Dependent(
valve(type1(out(of(2267(items
DGRD:(External(leakage(S(Utility(medium
0,01 11408 Dependent(valve(type
1(out(of(2267(items
DGRD:(Other(failure(mode(s) 0,04 2852 Dependent(
valve(type3(out(of(2267(items
INC:(External(leakage(S(Process(medium
0,04 2852 Dependent(valve(type
3(out(of(2267(items
CRT:(Fail(to(Close(on(Demand 0,04 2852 Dependent(
valve(type1(out(of((928(items
CRT:(Fail(to(Open/(Unlock 0,04 2852 Dependent(
valve(type1(out(of((928(items
CRT:(Leakage(in(closed(position((Internal(leakage)
0,04 2852 Dependent(valve(type
1(out(of((928(items
CRT:(Other(failure(mode(s) 0,04 2852 Dependent(
valve(type1(out(of((928(items
Utility(Isolation(Valves
Process(Isolation(Valves
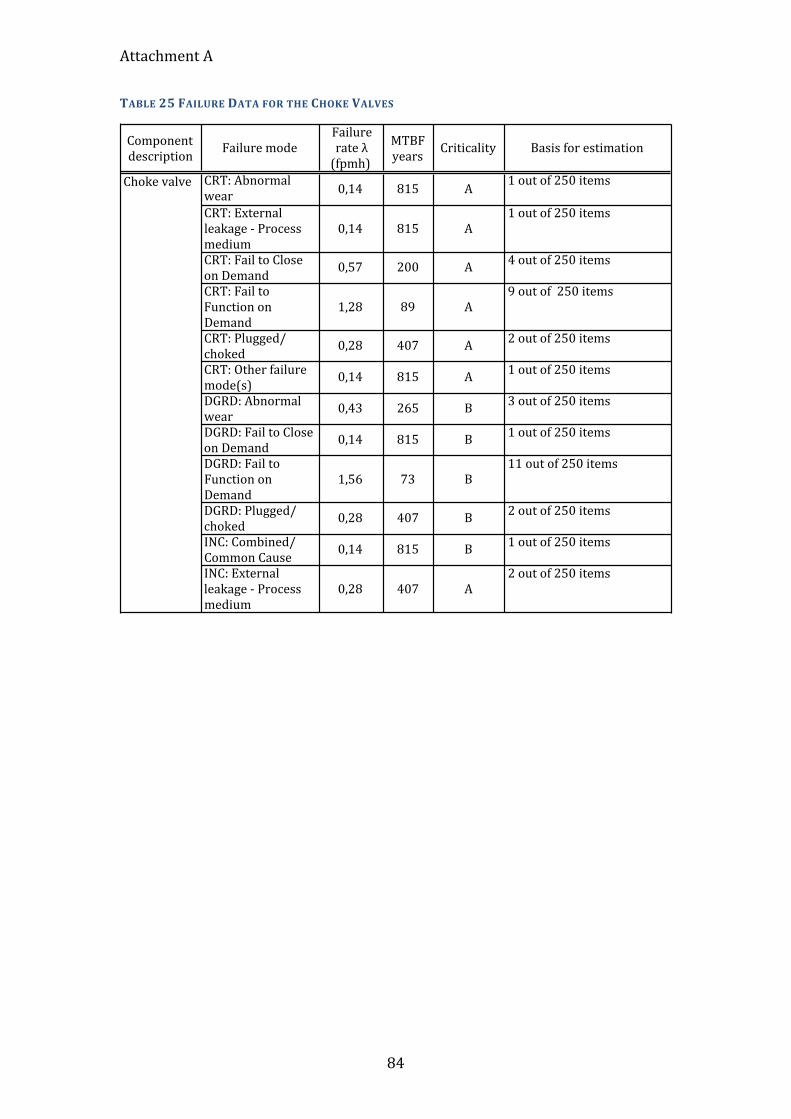
Attachment A
84
TABLE 25 FAILURE DATA FOR THE CHOKE VALVES
Component(description
Failure(modeFailure(rate(λ((fpmh)
MTBF((((((years
Criticality Basis(for(estimation
CRT:(Abnormal(wear 0,14 815 A
1(out(of(250(items
CRT:(External(leakage(K(Process(medium
0,14 815 A1(out(of(250(items
CRT:(Fail(to(Close(on(Demand
0,57 200 A 4(out(of(250(items
CRT:(Fail(to(Function(on(Demand
1,28 89 A9(out(of((250(items
CRT:(Plugged/(choked
0,28 407 A 2(out(of(250(items
CRT:(Other(failure(mode(s)
0,14 815 A 1(out(of(250(items
DGRD:(Abnormal(wear
0,43 265 B 3(out(of(250(items
DGRD:(Fail(to(Close(on(Demand
0,14 815 B 1(out(of(250(items
DGRD:(Fail(to(Function(on(Demand
1,56 73 B11(out(of(250(items
DGRD:(Plugged/(choked
0,28 407 B 2(out(of(250(items
INC:(Combined/(Common(Cause
0,14 815 B 1(out(of(250(items
INC:(External(leakage(K(Process(medium
0,28 407 A2(out(of(250(items
Choke(valve
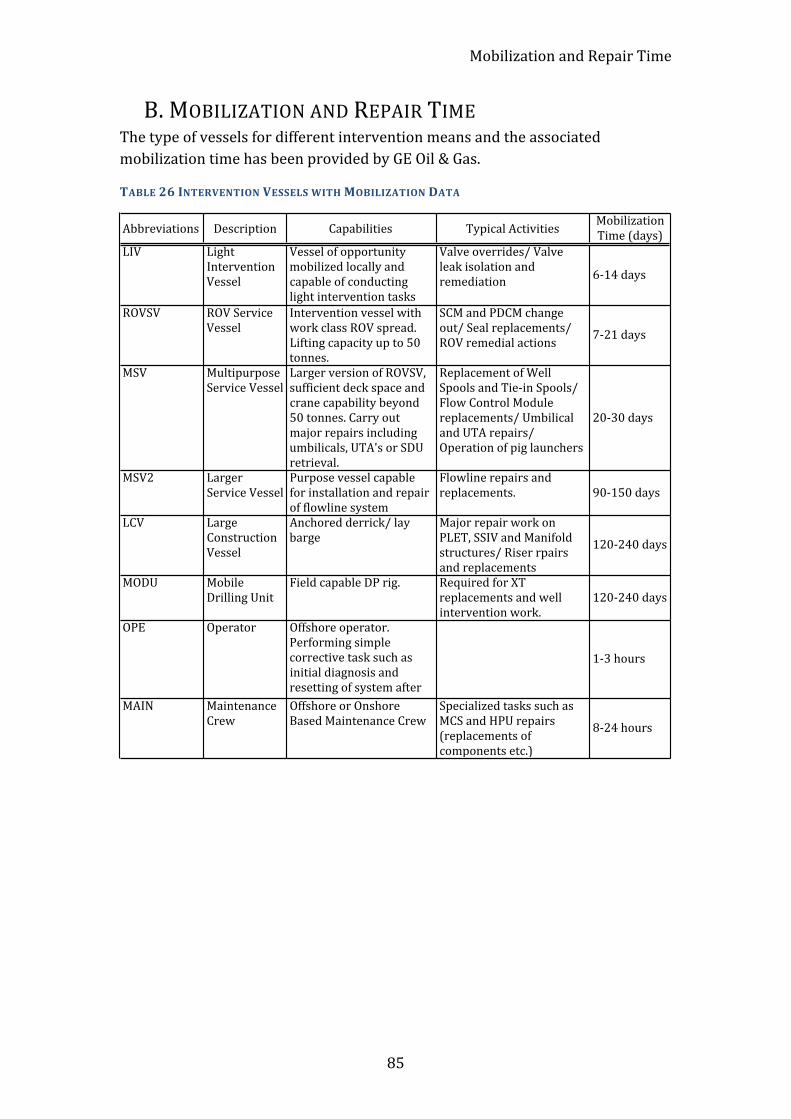
Mobilization and Repair Time
85
B. MOBILIZATION AND REPAIR TIME The type of vessels for different intervention means and the associated mobilization time has been provided by GE Oil & Gas.
TABLE 26 INTERVENTION VESSELS WITH MOBILIZATION DATA
Abbreviations Description Capabilities Typical3Activities Mobilization3Time3(days)
LIV Light3Intervention3Vessel
Vessel3of3opportunity3mobilized3locally3and3capable3of3conducting3light3intervention3tasks
Valve3overrides/3Valve3leak3isolation3and3remediation 6D143days
ROVSV ROV3Service3Vessel
Intervention3vessel3with3work3class3ROV3spread.3Lifting3capacity3up3to3503tonnes.
SCM3and3PDCM3change3out/3Seal3replacements/3ROV3remedial3actions 7D213days
MSV Multipurpose3Service3Vessel
Larger3version3of3ROVSV,3sufficient3deck3space3and3crane3capability3beyond3503tonnes.3Carry3out3major3repairs3including3umbilicals,3UTA's3or3SDU3retrieval.
Replacement3of3Well3Spools3and3TieDin3Spools/3Flow3Control3Module3replacements/3Umbilical3and3UTA3repairs/3Operation3of3pig3launchers
20D303days
MSV2 Larger3Service3Vessel
Purpose3vessel3capable3for3installation3and3repair3of3flowline3system
Flowline3repairs3and3replacements. 90D1503days
LCV Large3Construction3Vessel
Anchored3derrick/3lay3barge3
Major3repair3work3on3PLET,3SSIV3and3Manifold3structures/3Riser3rpairs3and3replacements
120D2403days
MODU Mobile3Drilling3Unit
Field3capable3DP3rig. Required3for3XT3replacements3and3well3intervention3work.
120D2403days
OPE Operator Offshore3operator.3Performing3simple3corrective3task3such3as3initial3diagnosis3and3resetting3of3system3after3trip,3etc.
1D33hours
MAIN Maintenance3Crew
Offshore3or3Onshore3Based3Maintenance3Crew
Specialized3tasks3such3as3MCS3and3HPU3repairs3(replacements3of3components3etc.)
8D243hours
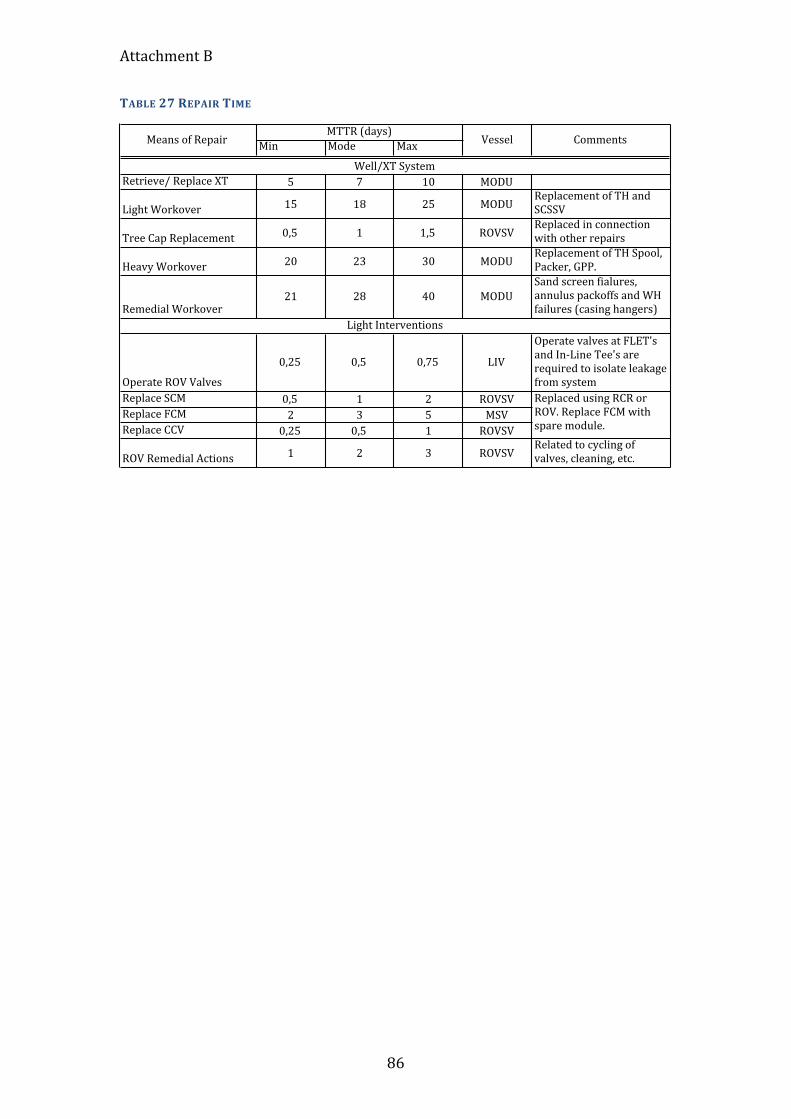
Attachment B
86
TABLE 27 REPAIR TIME
Min Mode Max
Retrieve/.Replace.XT 5 7 10 MODU
Light.Workover
15 18 25 MODU
Replacement.of.TH.and.
SCSSV
Tree.Cap.Replacement
0,5 1 1,5 ROVSV
Replaced.in.connection.
with.other.repairs
Heavy.Workover
20 23 30 MODU
Replacement.of.TH.Spool,.
Packer,.GPP.
Remedial.Workover
21 28 40 MODU
Sand.screen.fialures,.
annulus.packoffs.and.WH.
failures.(casing.hangers)
Operate.ROV.Valves
0,25 0,5 0,75 LIV
Operate.valves.at.FLET's.
and.InXLine.Tee's.are.
required.to.isolate.leakage.
from.system
Replace.SCM 0,5 1 2 ROVSV
Replace.FCM 2 3 5 MSV
Replace.CCV 0,25 0,5 1 ROVSV
ROV.Remedial.Actions
1 2 3 ROVSV
Related.to.cycling.of.
valves,.cleaning,.etc..
Replaced.using.RCR.or.
ROV..Replace.FCM.with.
spare.module.
MTTR.(days)
Means.of.Repair Vessel Comments
Well/XT.System
Light.Interventions
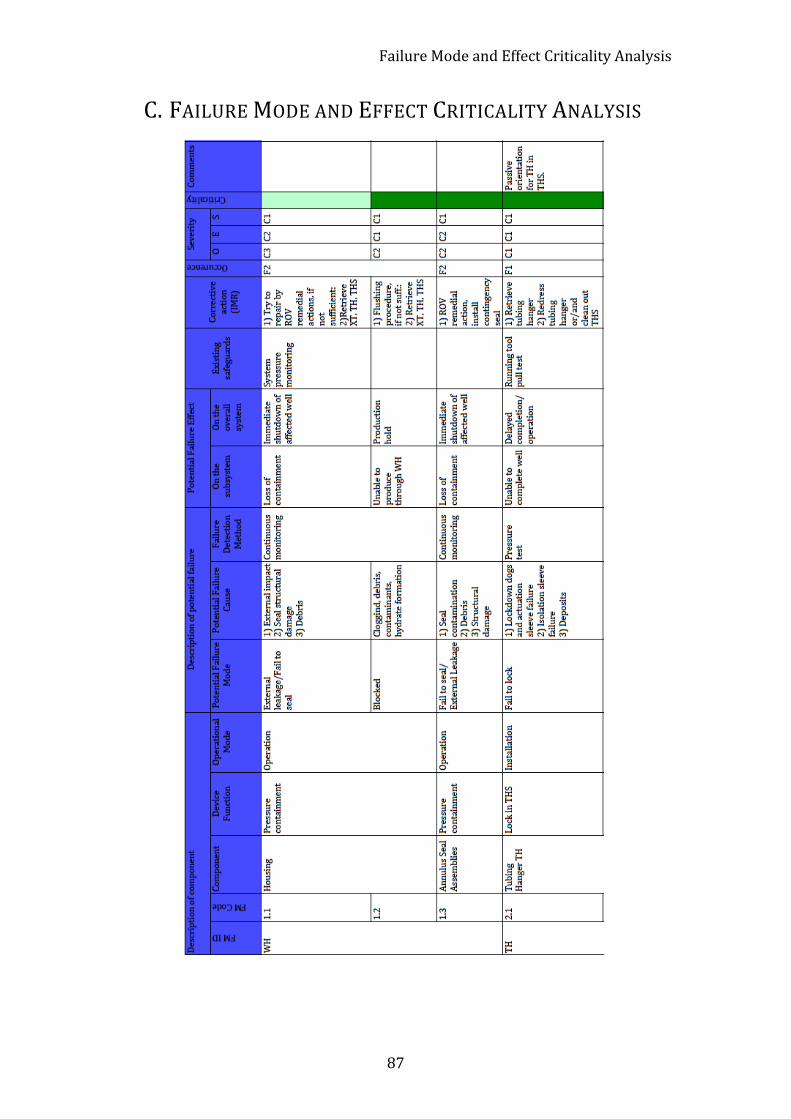
Failure Mode and Effect Criticality Analysis
87
C. FAILURE MODE AND EFFECT CRITICALITY ANALYSIS
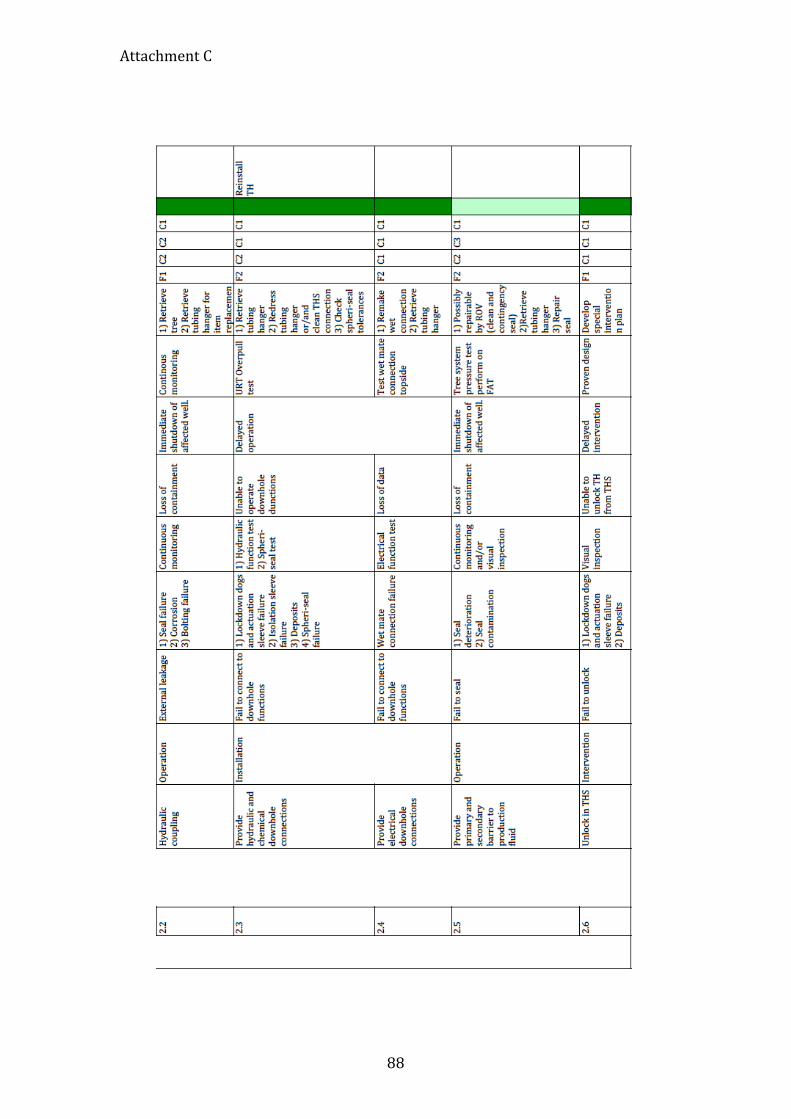
Attachment C
88
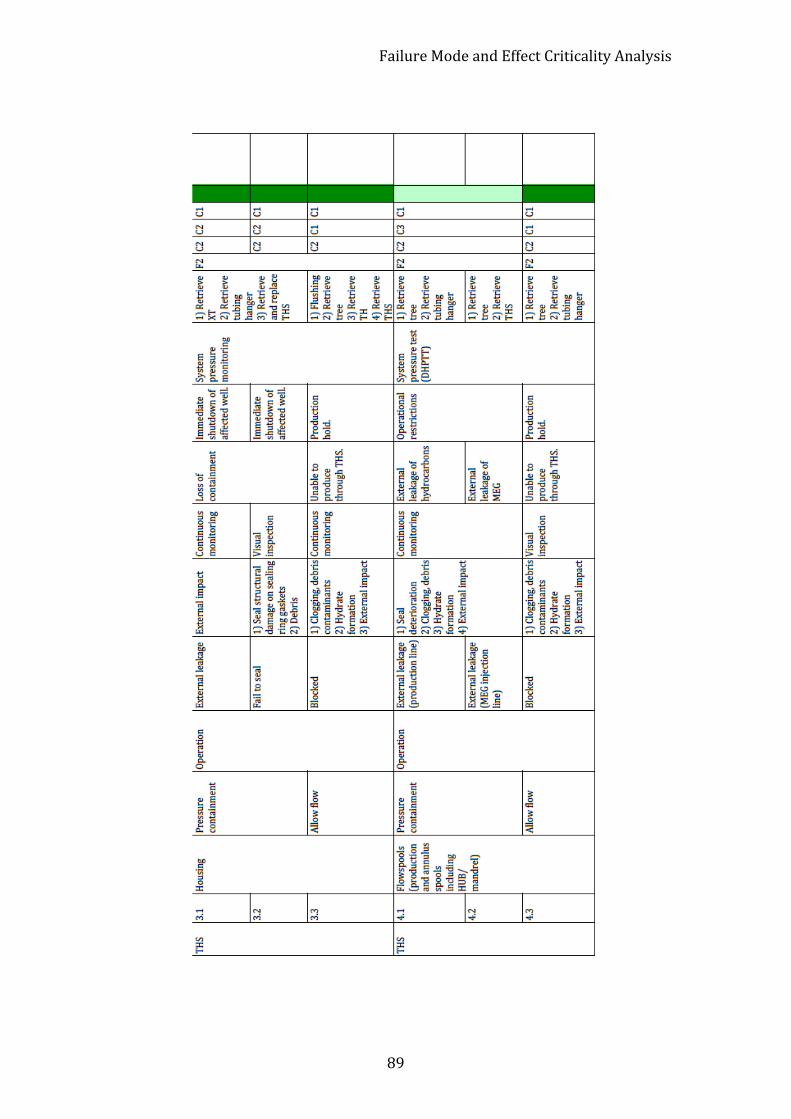
Failure Mode and Effect Criticality Analysis
89
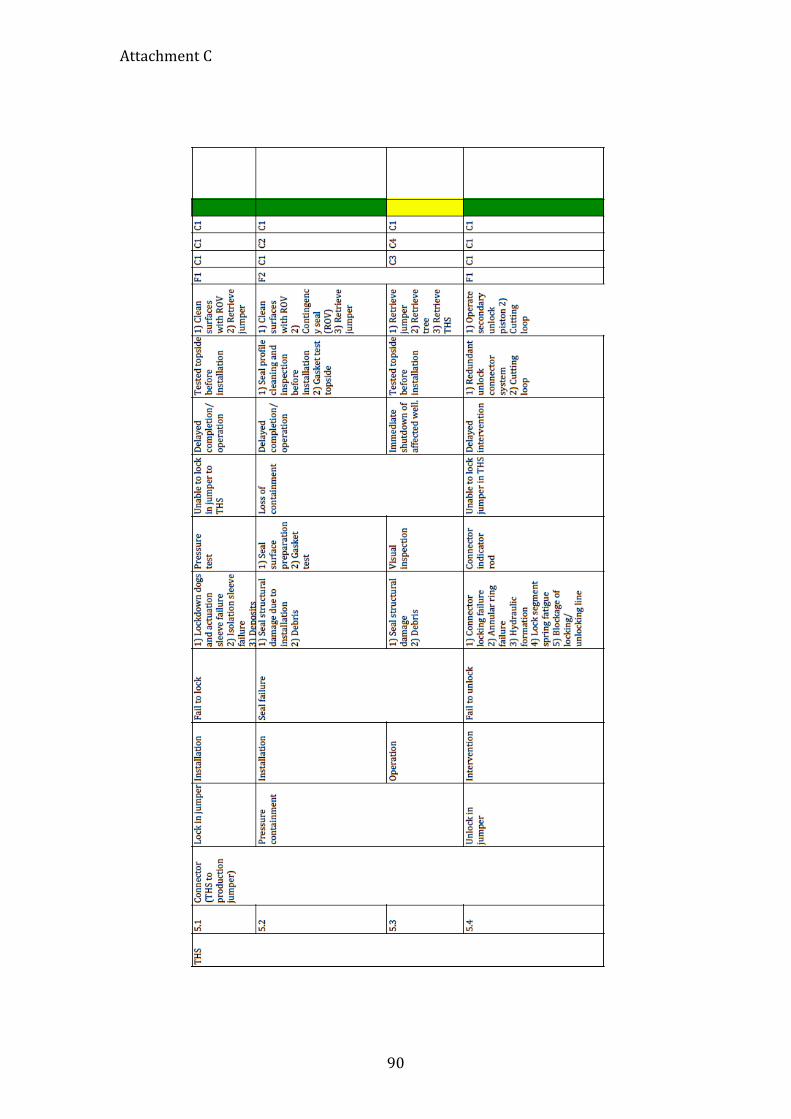
Attachment C
90
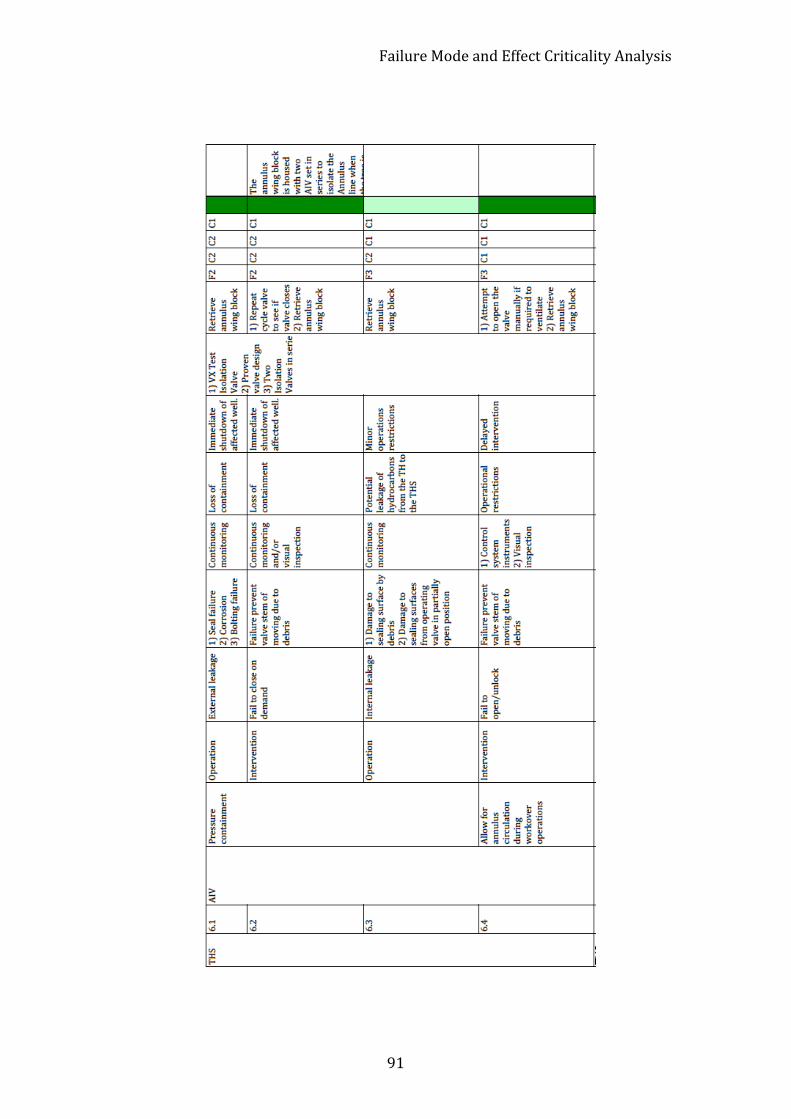
Failure Mode and Effect Criticality Analysis
91
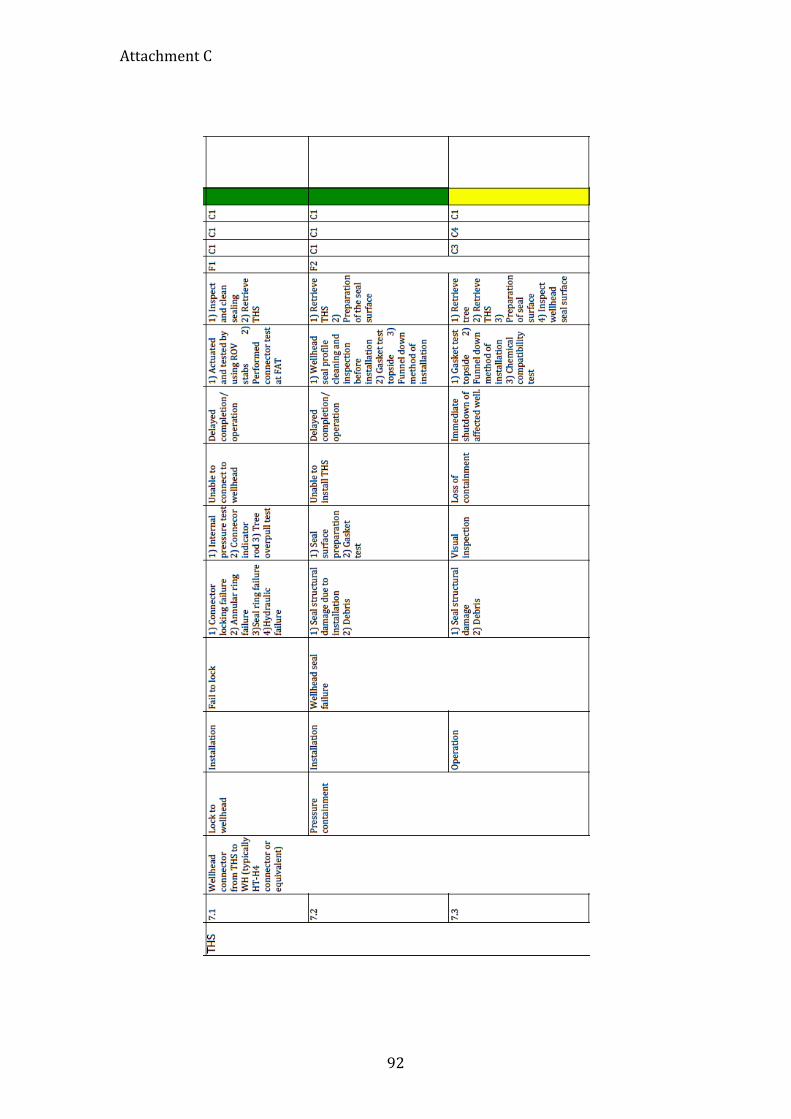
Attachment C
92
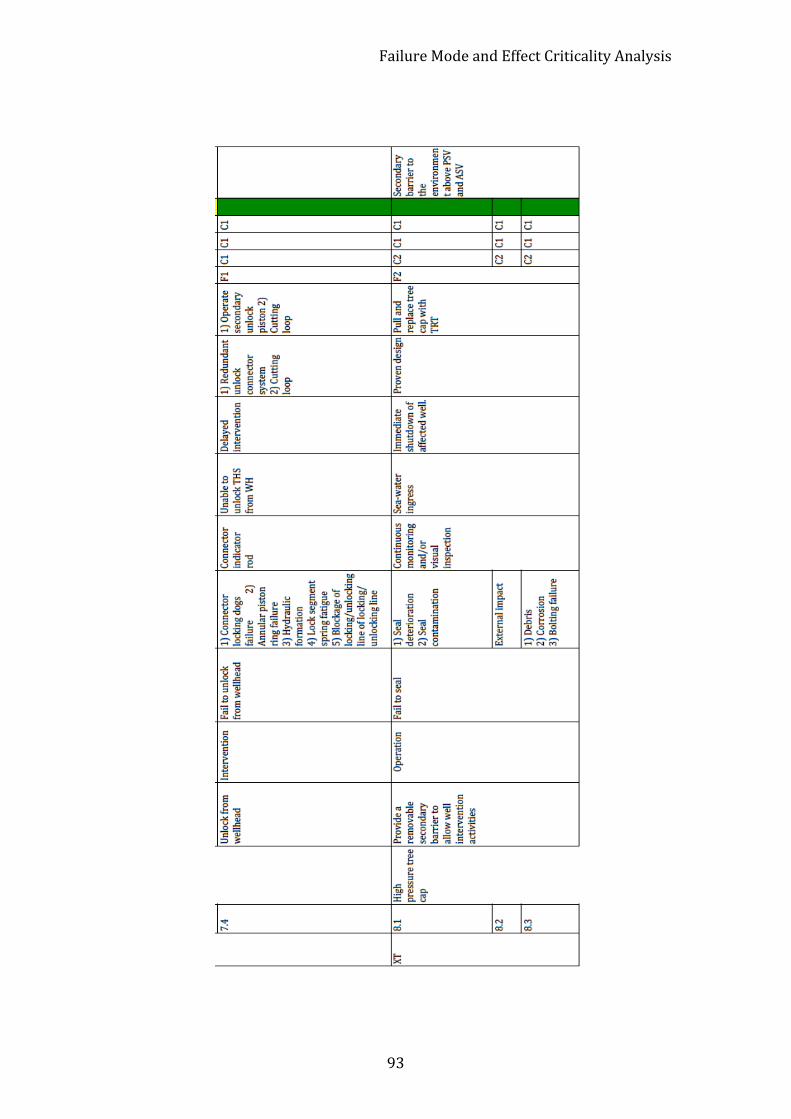
Failure Mode and Effect Criticality Analysis
93
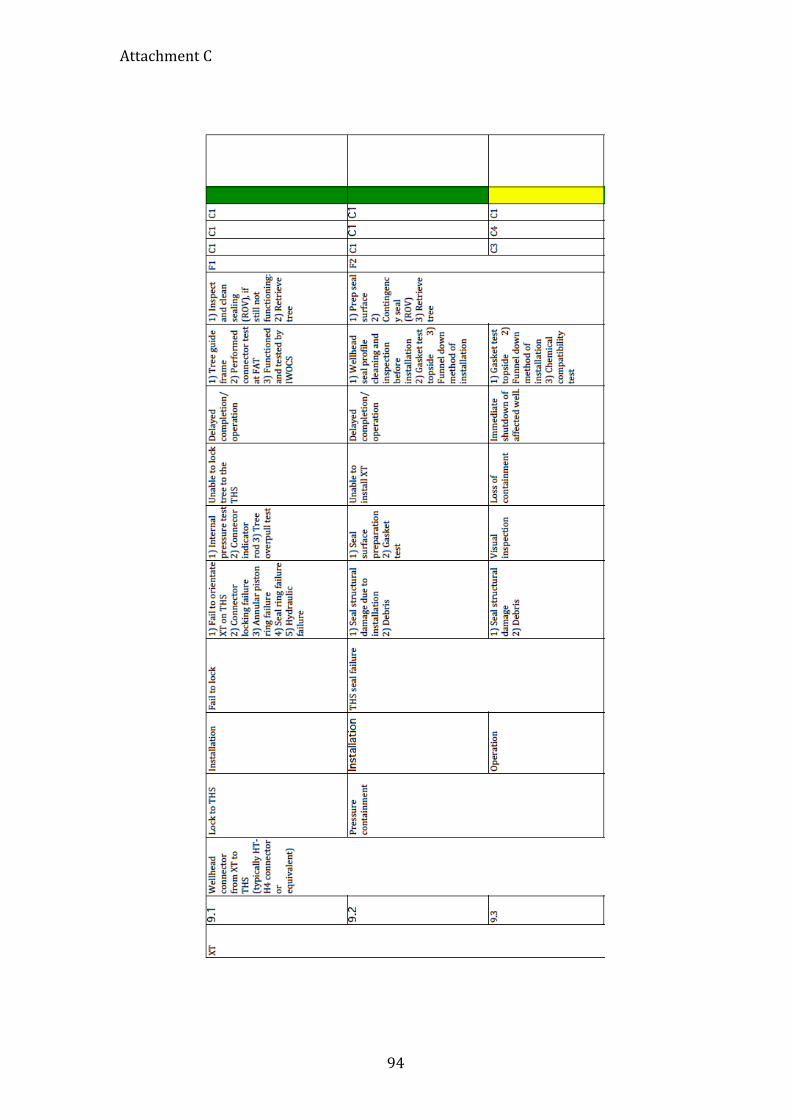
Attachment C
94

Failure Mode and Effect Criticality Analysis
95
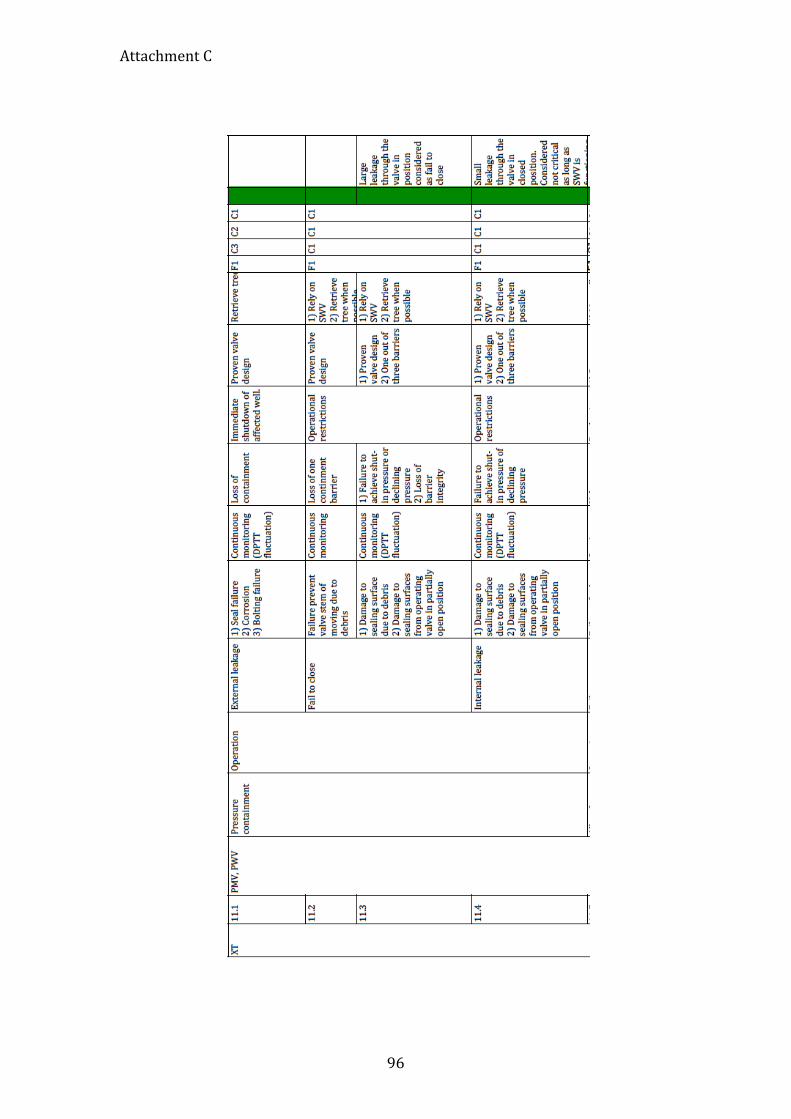
Attachment C
96
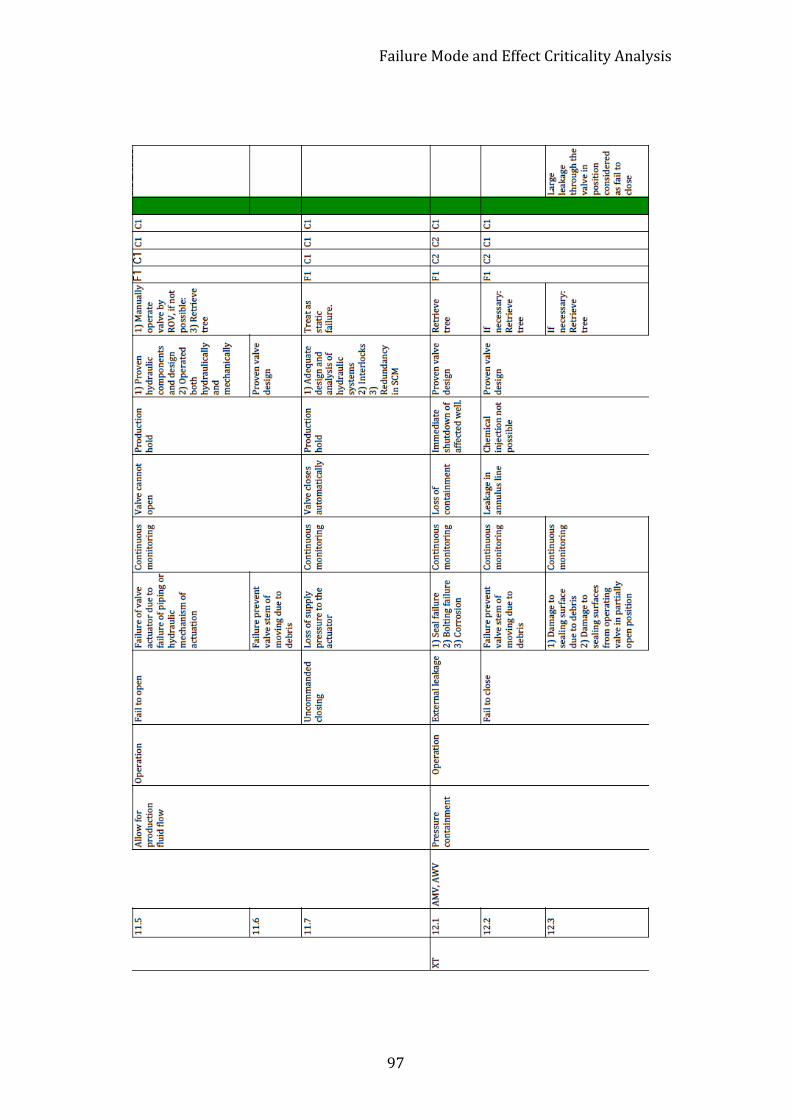
Failure Mode and Effect Criticality Analysis
97
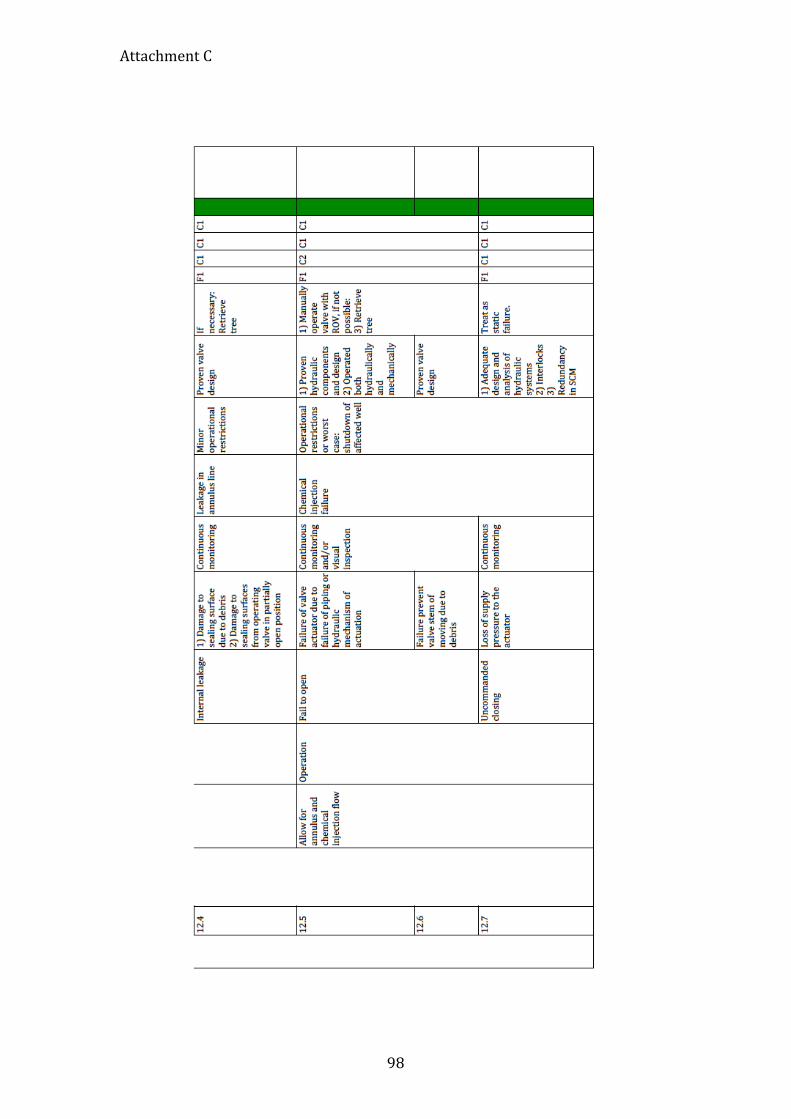
Attachment C
98
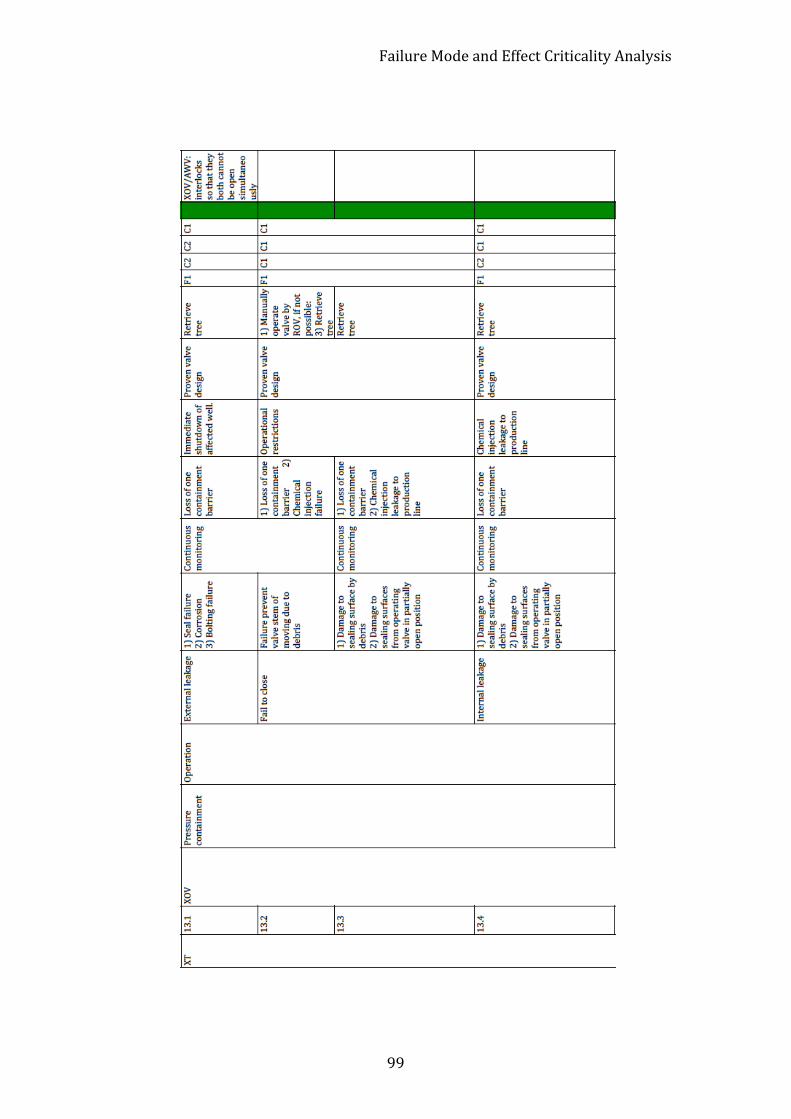
Failure Mode and Effect Criticality Analysis
99
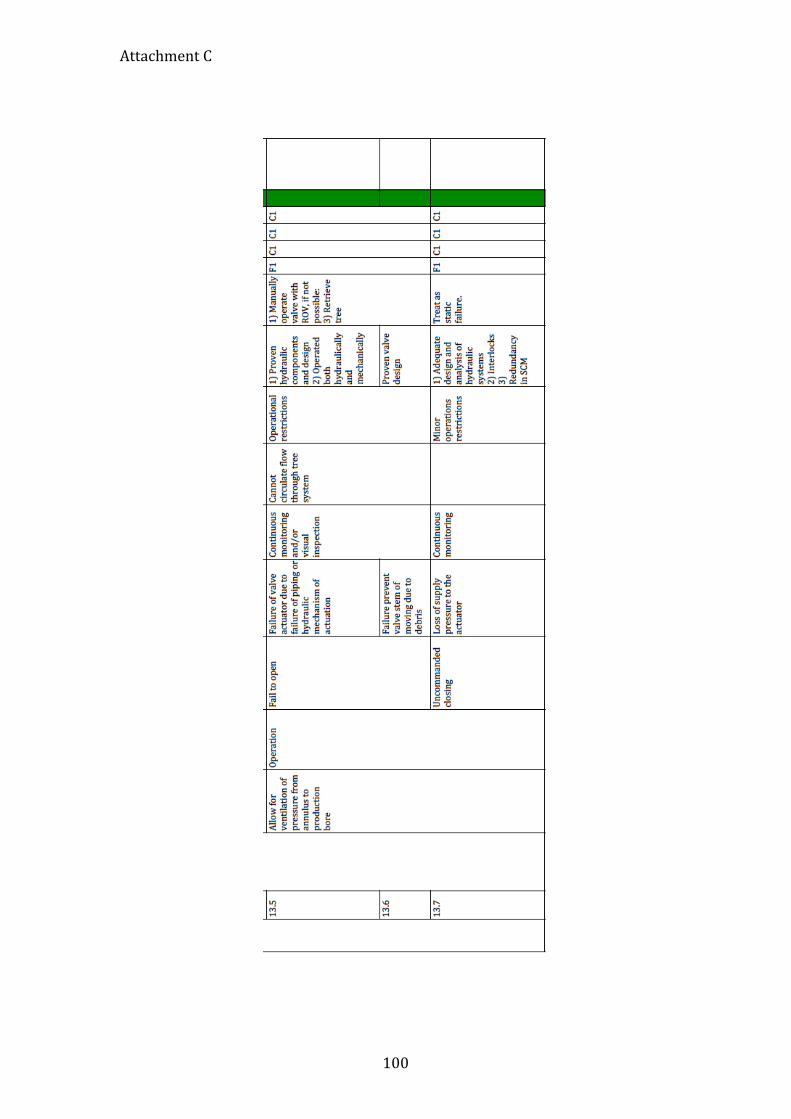
Attachment C
100
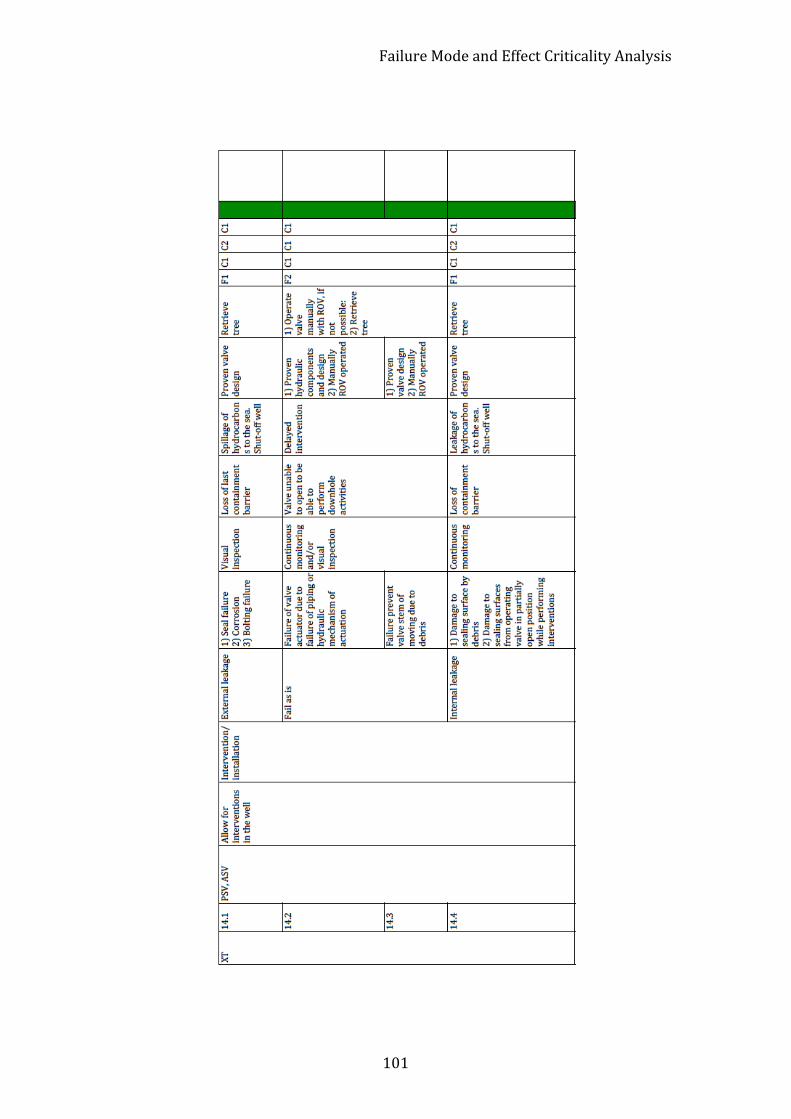
Failure Mode and Effect Criticality Analysis
101
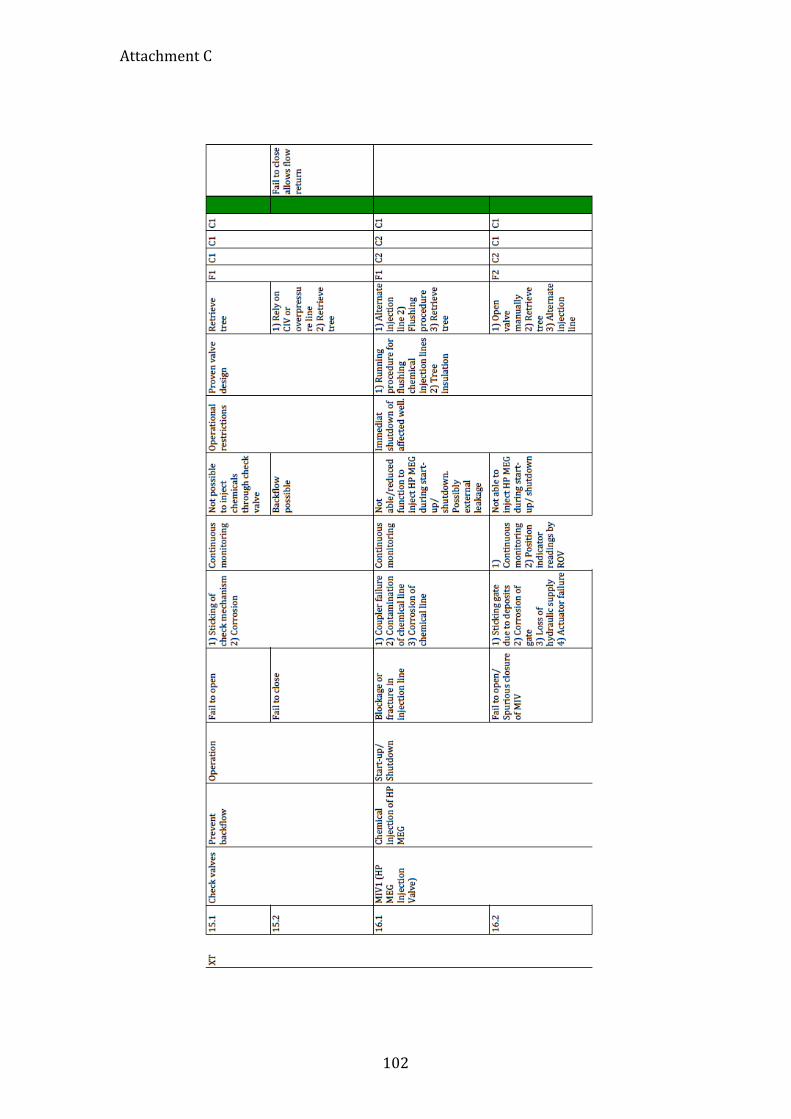
Attachment C
102
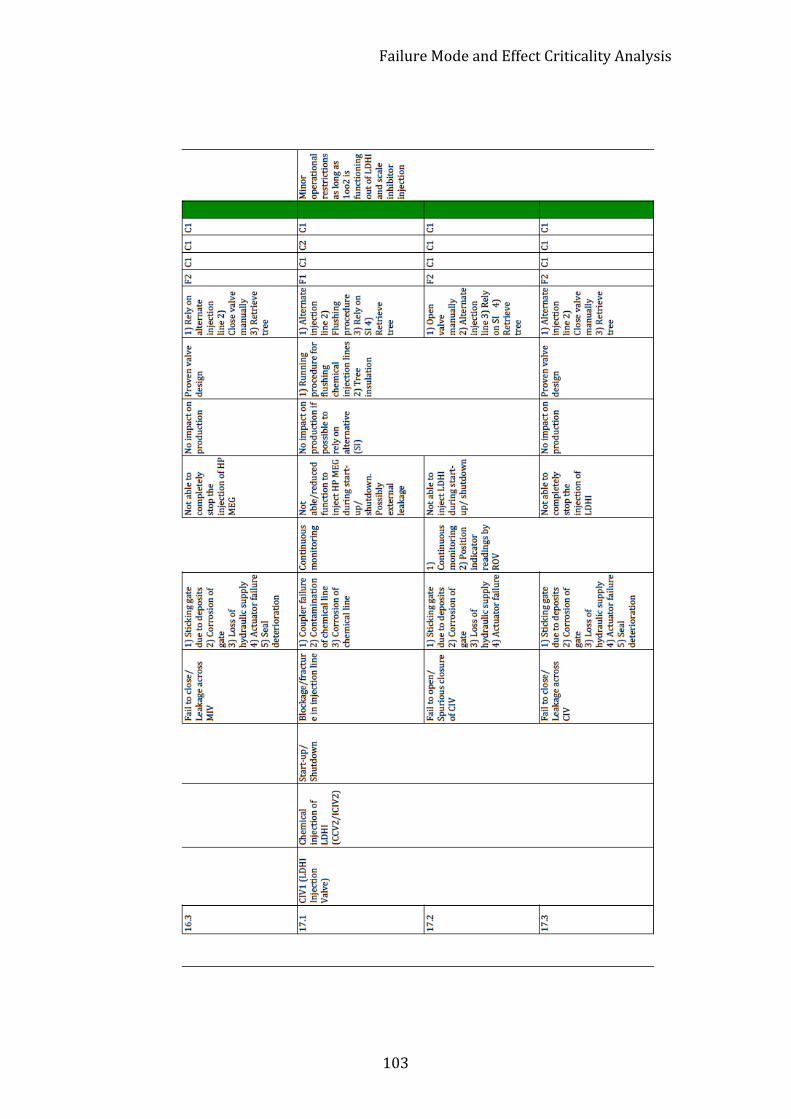
Failure Mode and Effect Criticality Analysis
103
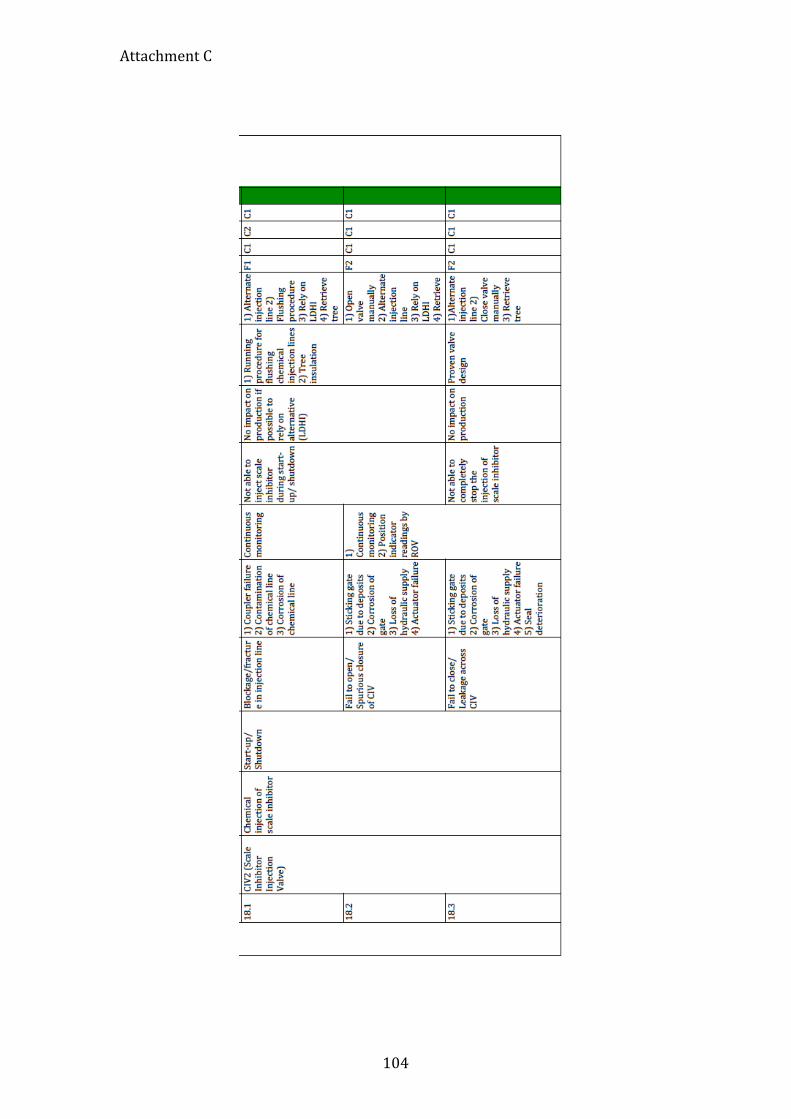
Attachment C
104

Failure Mode and Effect Criticality Analysis
105
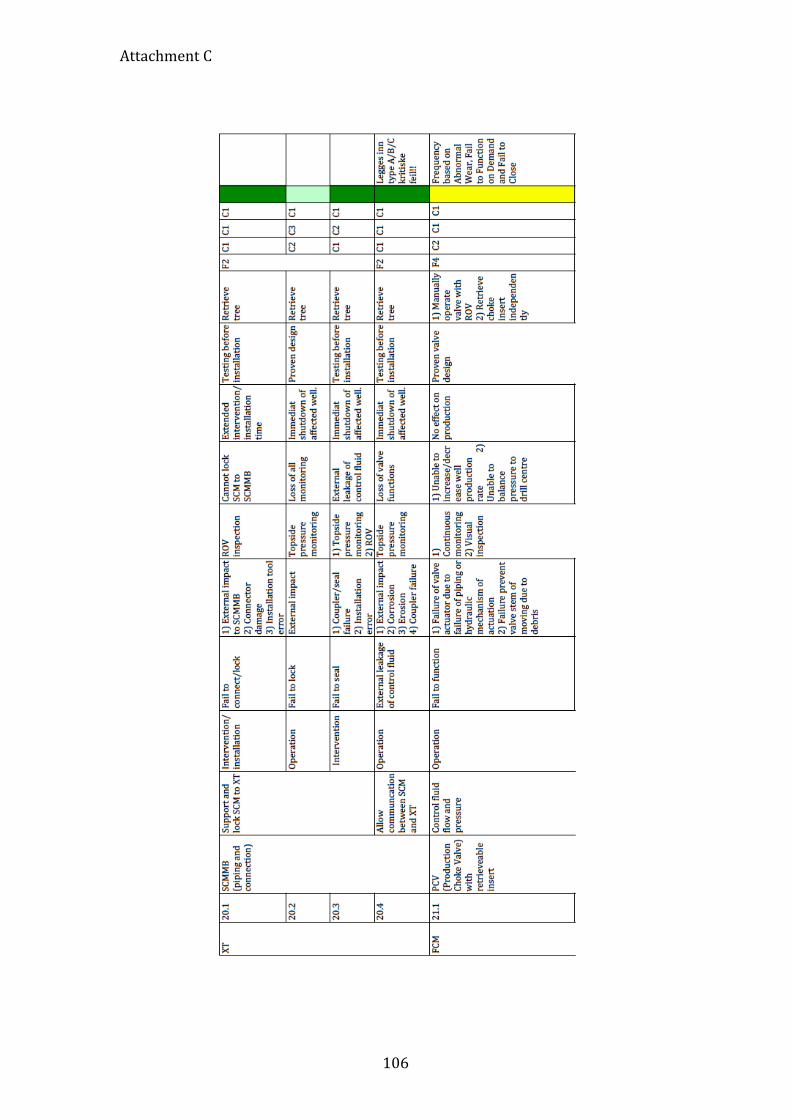
Attachment C
106
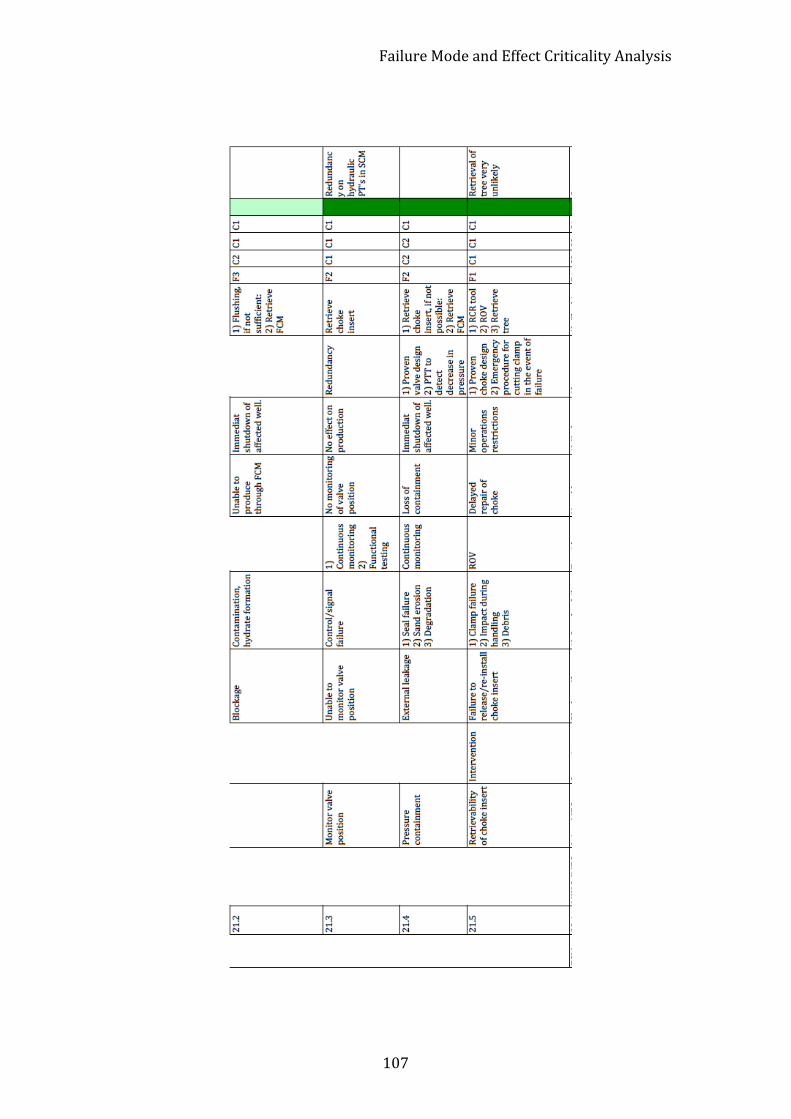
Failure Mode and Effect Criticality Analysis
107
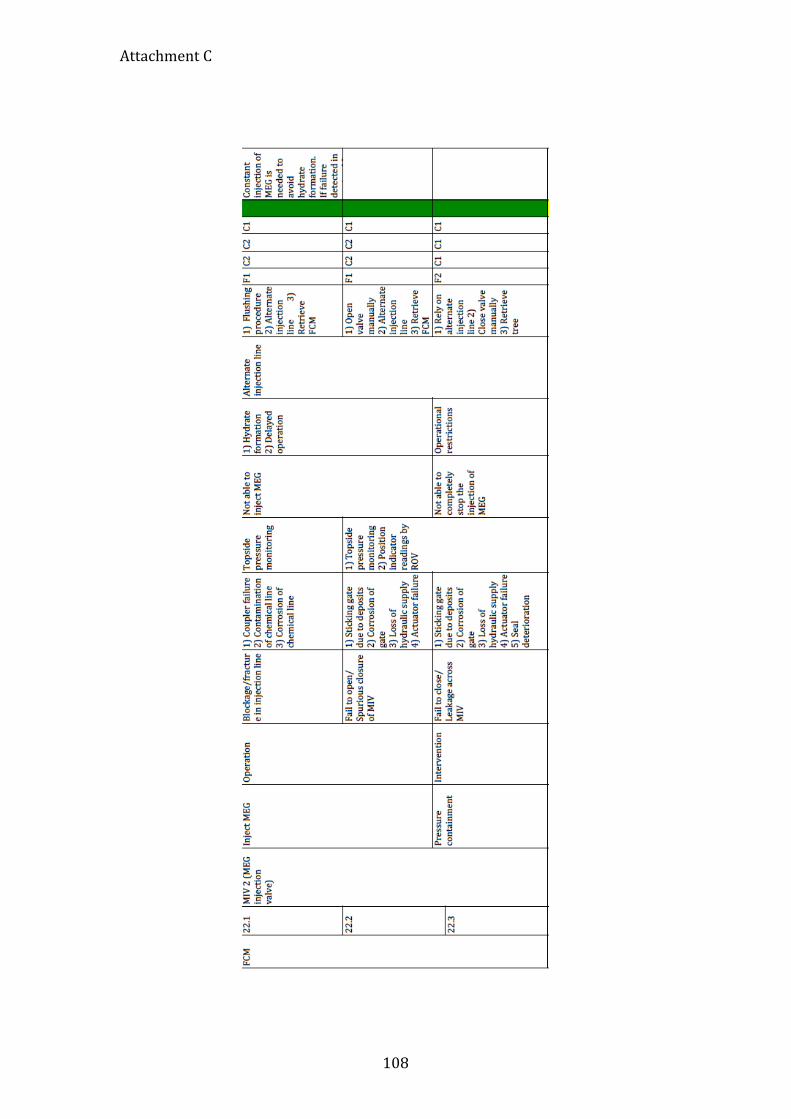
Attachment C
108
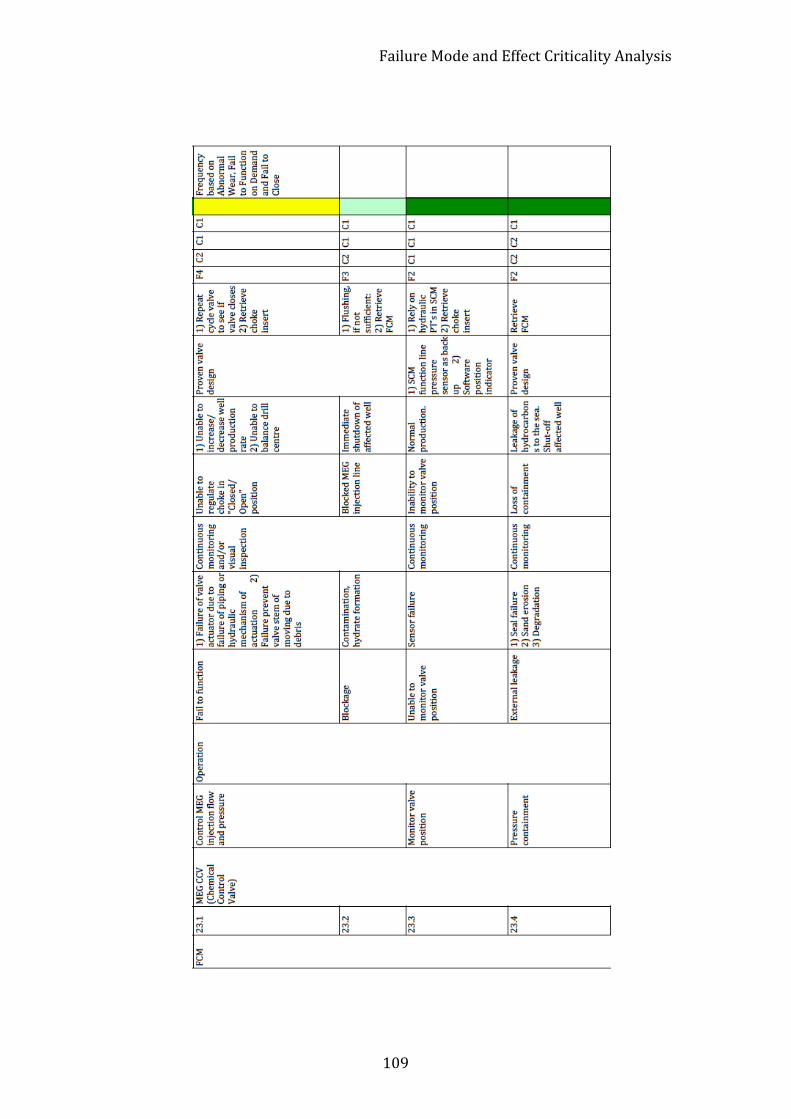
Failure Mode and Effect Criticality Analysis
109
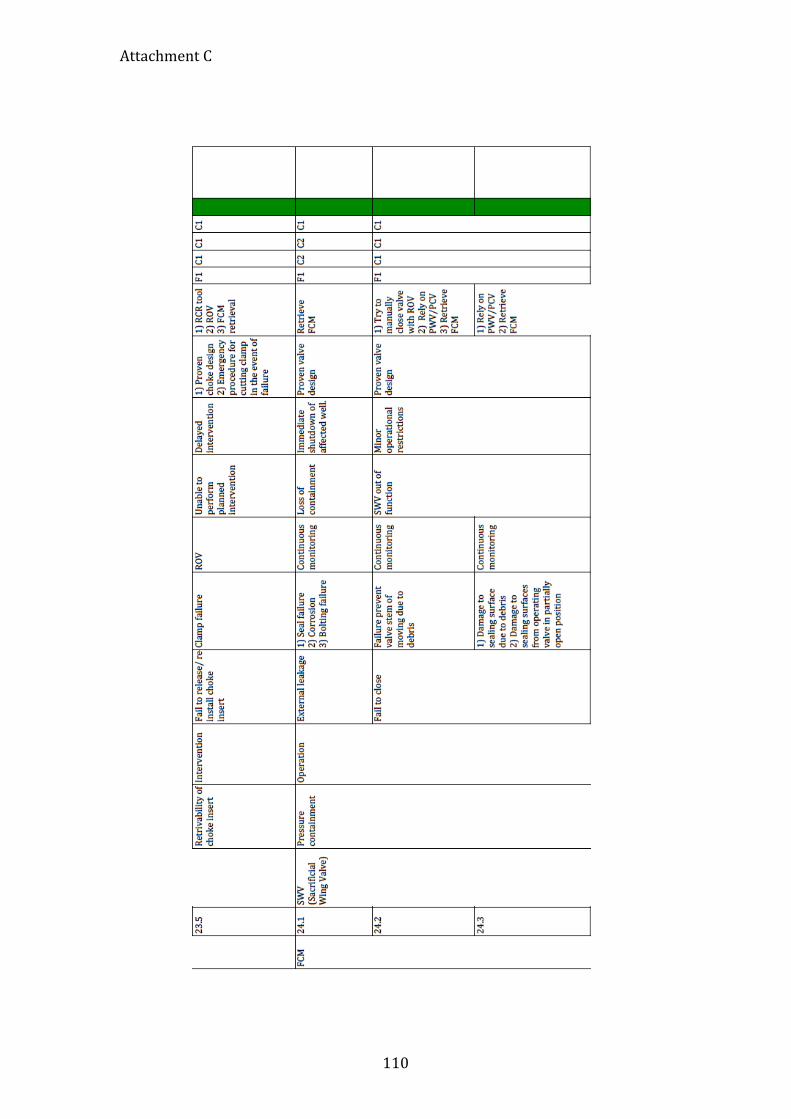
Attachment C
110
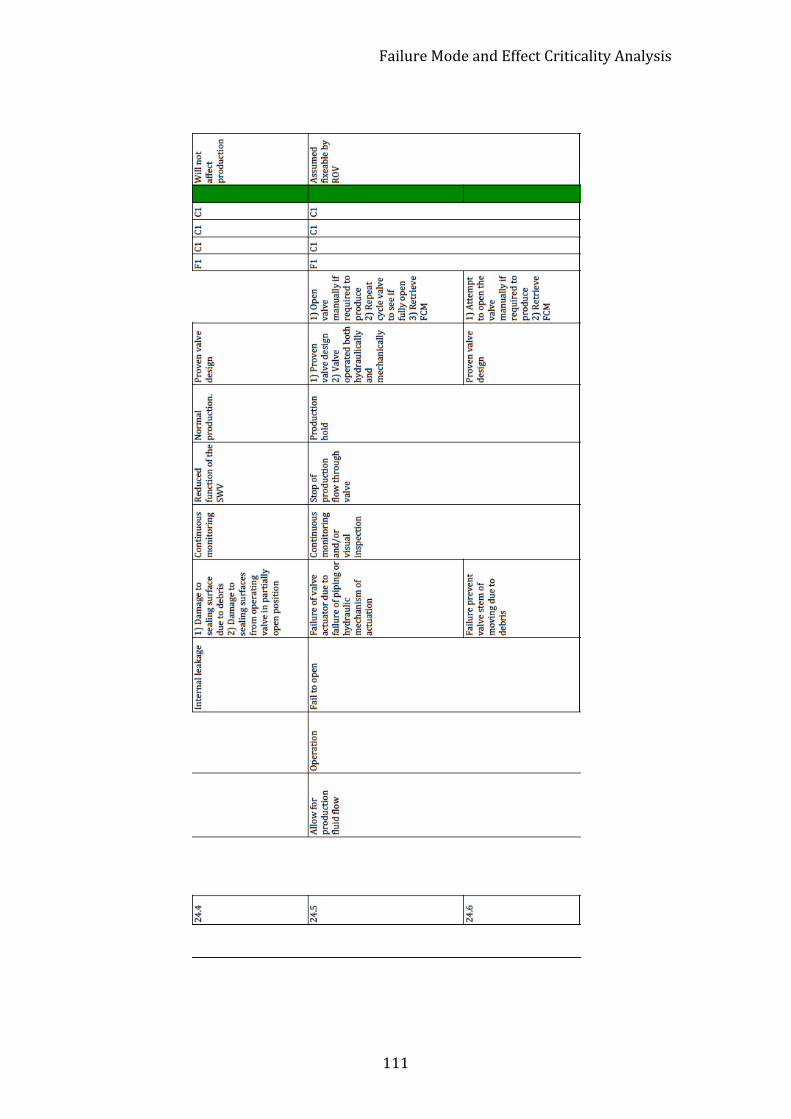
Failure Mode and Effect Criticality Analysis
111
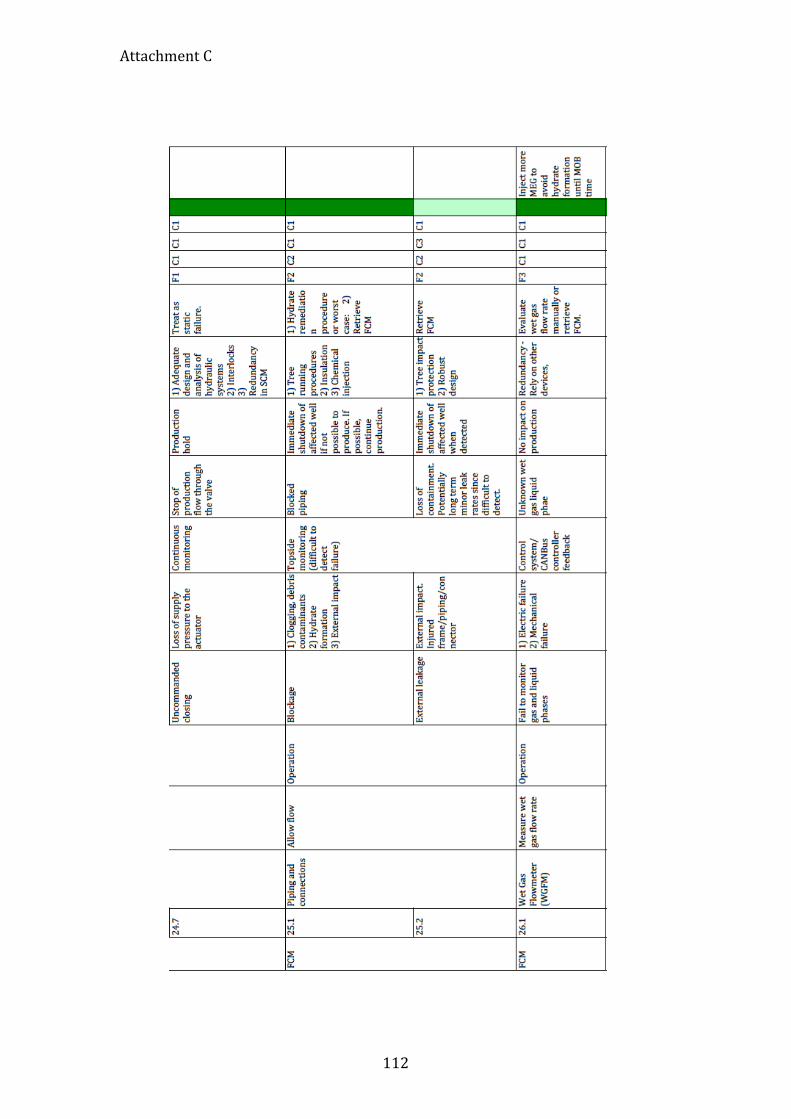
Attachment C
112
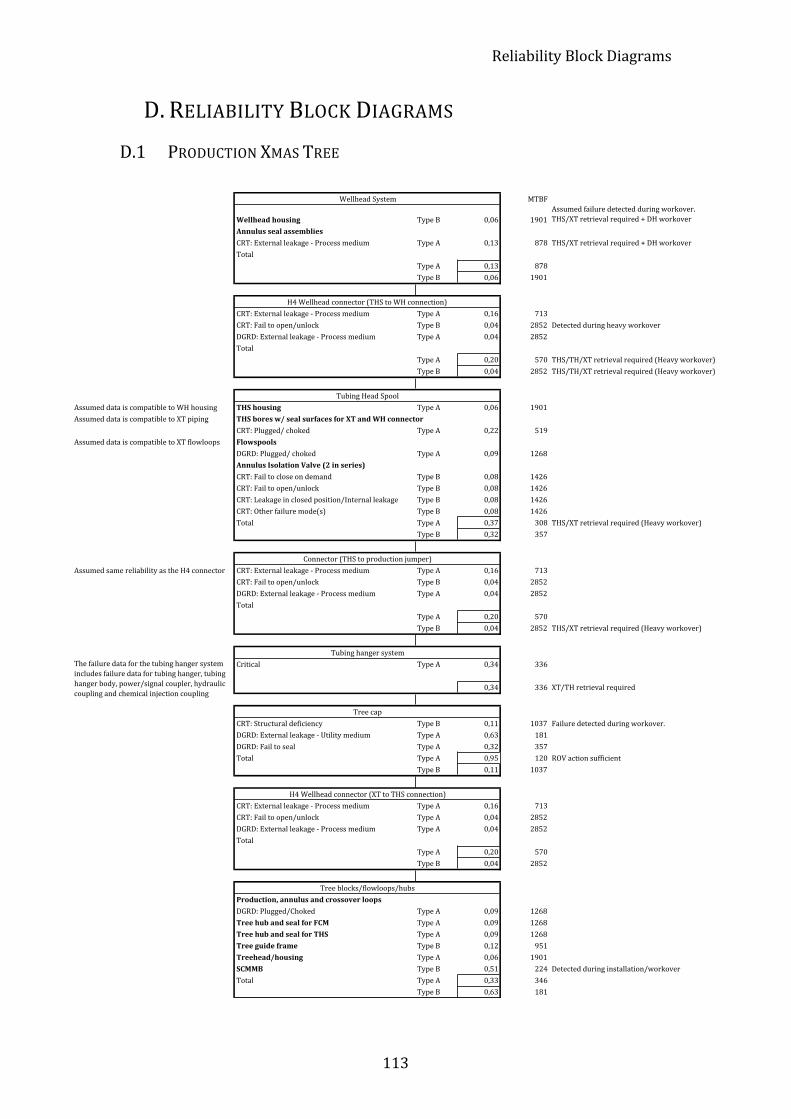
Reliability Block Diagrams
113
D. RELIABILITY BLOCK DIAGRAMS
D.1 PRODUCTION XMAS TREE
MTBF
Wellhead'housing Type(B 0,06 1901Assumed(failure(detected(during(workover.(THS/XT(retrieval(required(+(DH(workover
Annulus'seal'assembliesCRT:(External(leakage(M(Process(medium Type(A 0,13 878 THS/XT(retrieval(required(+(DH(workoverTotal
Type(A 0,13 878Type(B 0,06 1901
CRT:(External(leakage(M(Process(medium Type(A 0,16 713CRT:(Fail(to(open/unlock Type(B 0,04 2852 Detected(during(heavy(workoverDGRD:(External(leakage(M(Process(medium Type(A 0,04 2852Total
Type(A 0,20 570 THS/TH/XT(retrieval(required((Heavy(workover)Type(B 0,04 2852 THS/TH/XT(retrieval(required((Heavy(workover)
Assumed(data(is(compatible(to(WH(housing THS'housing Type(A 0,06 1901Assumed(data(is(compatible(to(XT(piping THS'bores'w/'seal'surfaces'for'XT'and'WH'connector
CRT:(Plugged/(choked Type(A 0,22 519Assumed(data(is(compatible(to(XT(flowloops Flowspools
DGRD:(Plugged/(choked Type(A 0,09 1268Annulus'Isolation'Valve'(2'in'series)CRT:(Fail(to(close(on(demand Type(B 0,08 1426CRT:(Fail(to(open/unlock Type(B 0,08 1426CRT:(Leakage(in(closed(position/Internal(leakage Type(B 0,08 1426CRT:(Other(failure(mode(s) Type(B 0,08 1426Total Type(A 0,37 308 THS/XT(retrieval(required((Heavy(workover)
Type(B 0,32 357
Assumed(same(reliability(as(the(H4(connector CRT:(External(leakage(M(Process(medium Type(A 0,16 713CRT:(Fail(to(open/unlock Type(B 0,04 2852DGRD:(External(leakage(M(Process(medium Type(A 0,04 2852Total
Type(A 0,20 570Type(B 0,04 2852 THS/XT(retrieval(required((Heavy(workover)
Critical Type(A 0,34 336
0,34 336 XT/TH(retrieval(required
CRT:(Structural(deficiency Type(B 0,11 1037 Failure(detected(during(workover.(DGRD:(External(leakage(M(Utility(medium Type(A 0,63 181DGRD:(Fail(to(seal Type(A 0,32 357Total Type(A 0,95 120 ROV(action(sufficient
Type(B 0,11 1037
CRT:(External(leakage(M(Process(medium Type(A 0,16 713CRT:(Fail(to(open/unlock Type(A 0,04 2852DGRD:(External(leakage(M(Process(medium Type(A 0,04 2852Total
Type(A 0,20 570Type(B 0,04 2852
Production,'annulus'and'crossover'loopsDGRD:(Plugged/Choked Type(A 0,09 1268Tree'hub'and'seal'for'FCM Type(A 0,09 1268Tree'hub'and'seal'for'THS Type(A 0,09 1268Tree'guide'frame Type(B 0,12 951Treehead/housing Type(A 0,06 1901SCMMB Type(B 0,51 224 Detected(during(installation/workoverTotal Type(A 0,33 346
Type(B 0,63 181
Wellhead(System
The(failure(data(for(the(tubing(hanger(system(includes(failure(data(for(tubing(hanger,(tubing(hanger(body,(power/signal(coupler,(hydraulic(coupling(and(chemical(injection(coupling
Connector((THS(to(production(jumper)
Tree(cap
H4(Wellhead(connector((THS(to(WH(connection)
Tubing(Head(Spool
Tubing(hanger(system
H4(Wellhead(connector((XT(to(THS(connection)
Tree(blocks/flowloops/hubs
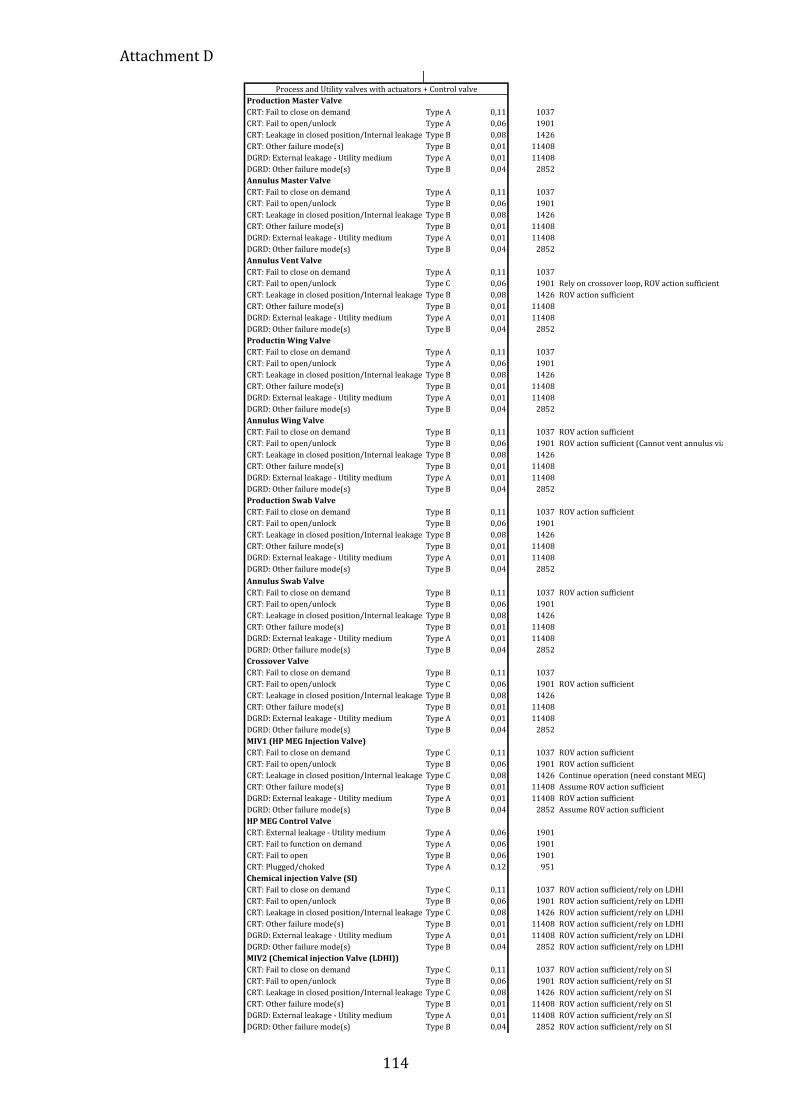
Attachment D
114
Production*Master*ValveCRT:%Fail%to%close%on%demand Type%A 0,11 1037CRT:%Fail%to%open/unlock Type%A 0,06 1901CRT:%Leakage%in%closed%position/Internal%leakage Type%B 0,08 1426CRT:%Other%failure%mode(s) Type%B 0,01 11408DGRD:%External%leakage%P%Utility%medium Type%A 0,01 11408DGRD:%Other%failure%mode(s) Type%B 0,04 2852Annulus*Master*ValveCRT:%Fail%to%close%on%demand Type%A 0,11 1037CRT:%Fail%to%open/unlock Type%B 0,06 1901CRT:%Leakage%in%closed%position/Internal%leakage Type%B 0,08 1426CRT:%Other%failure%mode(s) Type%B 0,01 11408DGRD:%External%leakage%P%Utility%medium Type%A 0,01 11408DGRD:%Other%failure%mode(s) Type%B 0,04 2852Annulus*Vent*ValveCRT:%Fail%to%close%on%demand Type%A 0,11 1037CRT:%Fail%to%open/unlock Type%C 0,06 1901 Rely%on%crossover%loop,%ROV%action%sufficientCRT:%Leakage%in%closed%position/Internal%leakage Type%B 0,08 1426 ROV%action%sufficientCRT:%Other%failure%mode(s) Type%B 0,01 11408DGRD:%External%leakage%P%Utility%medium Type%A 0,01 11408DGRD:%Other%failure%mode(s) Type%B 0,04 2852Productin*Wing*ValveCRT:%Fail%to%close%on%demand Type%A 0,11 1037CRT:%Fail%to%open/unlock Type%A 0,06 1901CRT:%Leakage%in%closed%position/Internal%leakage Type%B 0,08 1426CRT:%Other%failure%mode(s) Type%B 0,01 11408DGRD:%External%leakage%P%Utility%medium Type%A 0,01 11408DGRD:%Other%failure%mode(s) Type%B 0,04 2852Annulus*Wing*ValveCRT:%Fail%to%close%on%demand Type%B 0,11 1037 ROV%action%sufficientCRT:%Fail%to%open/unlock Type%B 0,06 1901 ROV%action%sufficient%(Cannot%vent%annulus%via%AVV%or%XOV).%CRT:%Leakage%in%closed%position/Internal%leakage Type%B 0,08 1426CRT:%Other%failure%mode(s) Type%B 0,01 11408DGRD:%External%leakage%P%Utility%medium Type%A 0,01 11408DGRD:%Other%failure%mode(s) Type%B 0,04 2852Production*Swab*ValveCRT:%Fail%to%close%on%demand Type%B 0,11 1037 ROV%action%sufficientCRT:%Fail%to%open/unlock Type%B 0,06 1901CRT:%Leakage%in%closed%position/Internal%leakage Type%B 0,08 1426CRT:%Other%failure%mode(s) Type%B 0,01 11408DGRD:%External%leakage%P%Utility%medium Type%A 0,01 11408DGRD:%Other%failure%mode(s) Type%B 0,04 2852Annulus*Swab*ValveCRT:%Fail%to%close%on%demand Type%B 0,11 1037 ROV%action%sufficientCRT:%Fail%to%open/unlock Type%B 0,06 1901CRT:%Leakage%in%closed%position/Internal%leakage Type%B 0,08 1426CRT:%Other%failure%mode(s) Type%B 0,01 11408DGRD:%External%leakage%P%Utility%medium Type%A 0,01 11408DGRD:%Other%failure%mode(s) Type%B 0,04 2852Crossover*ValveCRT:%Fail%to%close%on%demand Type%B 0,11 1037CRT:%Fail%to%open/unlock Type%C 0,06 1901 ROV%action%sufficientCRT:%Leakage%in%closed%position/Internal%leakage Type%B 0,08 1426CRT:%Other%failure%mode(s) Type%B 0,01 11408DGRD:%External%leakage%P%Utility%medium Type%A 0,01 11408DGRD:%Other%failure%mode(s) Type%B 0,04 2852MIV1*(HP*MEG*Injection*Valve)CRT:%Fail%to%close%on%demand Type%C 0,11 1037 ROV%action%sufficientCRT:%Fail%to%open/unlock Type%B 0,06 1901 ROV%action%sufficientCRT:%Leakage%in%closed%position/Internal%leakage Type%C 0,08 1426 Continue%operation%(need%constant%MEG)CRT:%Other%failure%mode(s) Type%B 0,01 11408 Assume%ROV%action%sufficientDGRD:%External%leakage%P%Utility%medium Type%A 0,01 11408 ROV%action%sufficientDGRD:%Other%failure%mode(s) Type%B 0,04 2852 Assume%ROV%action%sufficientHP*MEG*Control*ValveCRT:%External%leakage%P%Utility%medium Type%A 0,06 1901CRT:%Fail%to%function%on%demand Type%A 0,06 1901CRT:%Fail%to%open Type%B 0,06 1901CRT:%Plugged/choked Type%A 0,12 951Chemical*injection*Valve*(SI)CRT:%Fail%to%close%on%demand Type%C 0,11 1037 ROV%action%sufficient/rely%on%LDHICRT:%Fail%to%open/unlock Type%B 0,06 1901 ROV%action%sufficient/rely%on%LDHICRT:%Leakage%in%closed%position/Internal%leakage Type%C 0,08 1426 ROV%action%sufficient/rely%on%LDHICRT:%Other%failure%mode(s) Type%B 0,01 11408 ROV%action%sufficient/rely%on%LDHIDGRD:%External%leakage%P%Utility%medium Type%A 0,01 11408 ROV%action%sufficient/rely%on%LDHIDGRD:%Other%failure%mode(s) Type%B 0,04 2852 ROV%action%sufficient/rely%on%LDHIMIV2*(Chemical*injection*Valve*(LDHI))CRT:%Fail%to%close%on%demand Type%C 0,11 1037 ROV%action%sufficient/rely%on%SICRT:%Fail%to%open/unlock Type%B 0,06 1901 ROV%action%sufficient/rely%on%SICRT:%Leakage%in%closed%position/Internal%leakage Type%C 0,08 1426 ROV%action%sufficient/rely%on%SICRT:%Other%failure%mode(s) Type%B 0,01 11408 ROV%action%sufficient/rely%on%SIDGRD:%External%leakage%P%Utility%medium Type%A 0,01 11408 ROV%action%sufficient/rely%on%SIDGRD:%Other%failure%mode(s) Type%B 0,04 2852 ROV%action%sufficient/rely%on%SI
Process%and%Utility%valves%with%actuators%+%Control%valve
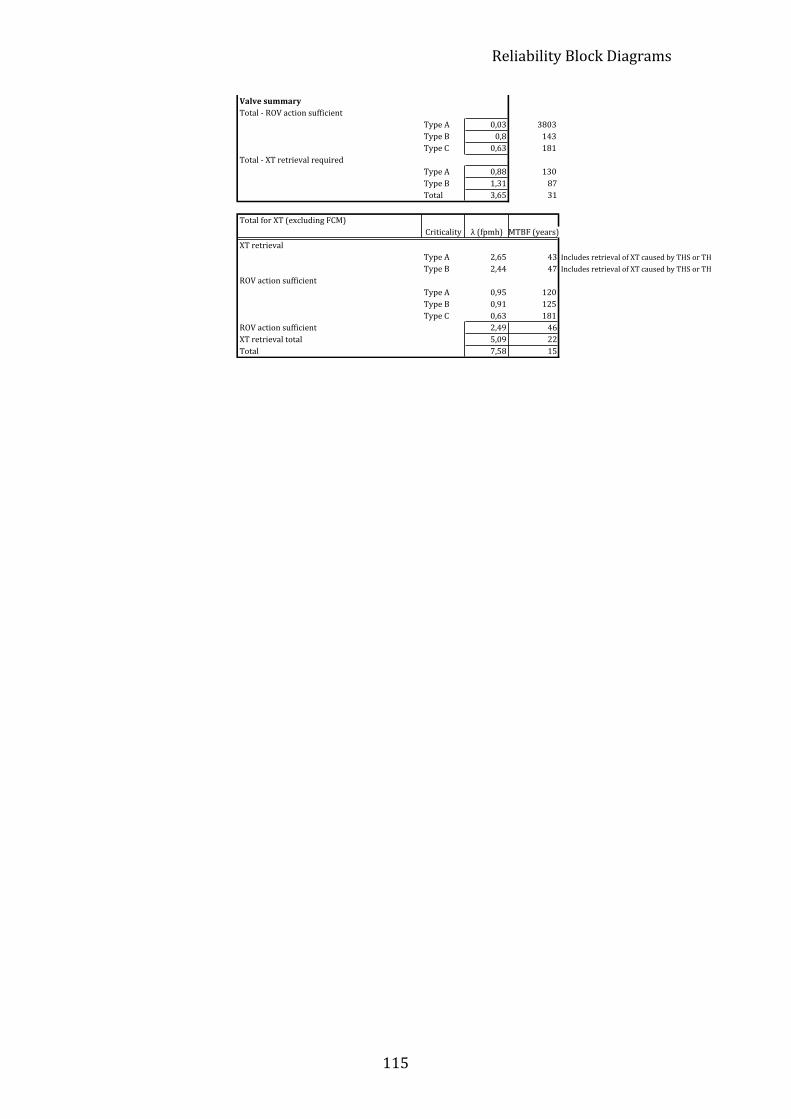
Reliability Block Diagrams
115
Valve&summaryTotal&'&ROV&action&sufficient
Type&A 0,03 3803Type&B 0,8 143Type&C 0,63 181
Total&'&XT&retrieval&requiredType&A 0,88 130Type&B 1,31 87Total 3,65 31
Total&for&XT&(excluding&FCM)Criticality λ&(fpmh) MTBF&(years)
XT&retrievalType&A 2,65 43 Includes&retrieval&of&XT&caused&by&THS&or&THType&B 2,44 47 Includes&retrieval&of&XT&caused&by&THS&or&TH
ROV&action&sufficientType&A 0,95 120Type&B 0,91 125Type&C 0,63 181
ROV&action&sufficient 2,49 46XT&retrieval&total 5,09 22Total 7,58 15
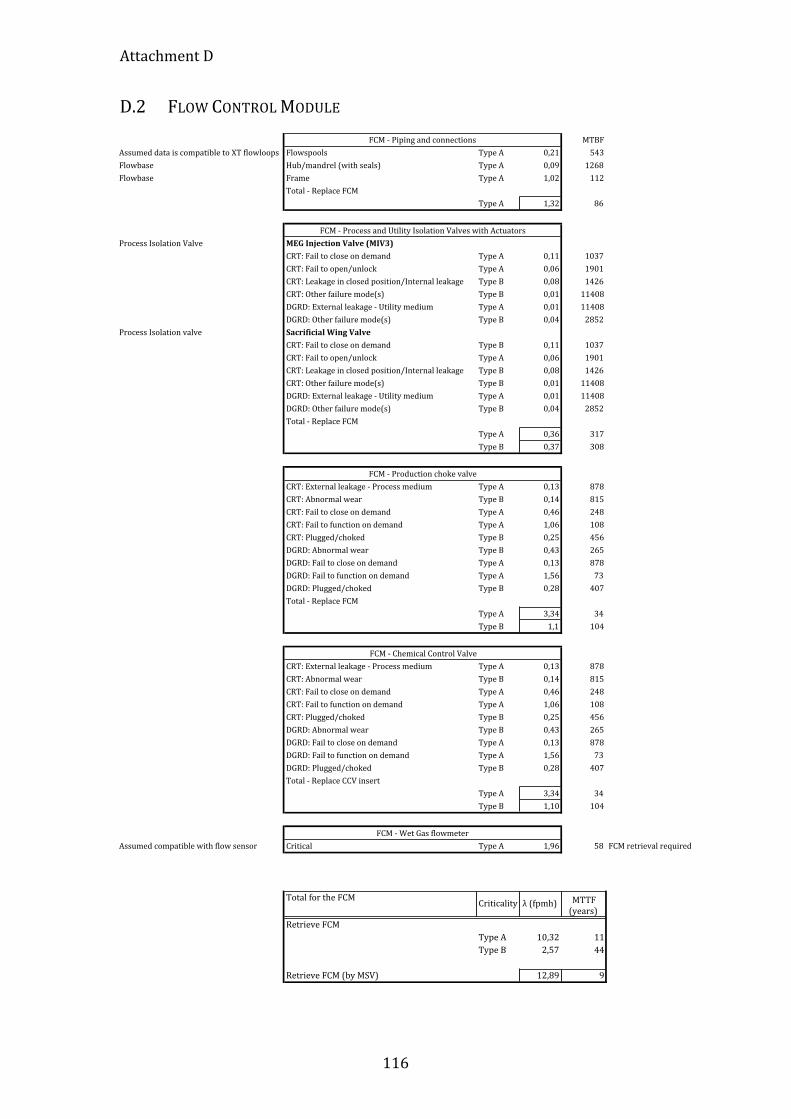
Attachment D
116
D.2 FLOW CONTROL MODULE
MTBF
Assumed+data+is+compatible+to+XT+flowloops Flowspools Type+A 0,21 543
Flowbase Hub/mandrel+(with+seals) Type+A 0,09 1268
Flowbase Frame Type+A 1,02 112
Total+I+Replace+FCM
Type+A 1,32 86
Process+Isolation+Valve MEG$Injection$Valve$(MIV3)CRT:+Fail+to+close+on+demand Type+A 0,11 1037
CRT:+Fail+to+open/unlock Type+A 0,06 1901
CRT:+Leakage+in+closed+position/Internal+leakage Type+B 0,08 1426
CRT:+Other+failure+mode(s) Type+B 0,01 11408
DGRD:+External+leakage+I+Utility+medium Type+A 0,01 11408
DGRD:+Other+failure+mode(s) Type+B 0,04 2852
Process+Isolation+valve Sacrificial$Wing$ValveCRT:+Fail+to+close+on+demand Type+B 0,11 1037
CRT:+Fail+to+open/unlock Type+A 0,06 1901
CRT:+Leakage+in+closed+position/Internal+leakage Type+B 0,08 1426
CRT:+Other+failure+mode(s) Type+B 0,01 11408
DGRD:+External+leakage+I+Utility+medium Type+A 0,01 11408
DGRD:+Other+failure+mode(s) Type+B 0,04 2852
Total+I+Replace+FCM
Type+A 0,36 317
Type+B 0,37 308
CRT:+External+leakage+I+Process+medium Type+A 0,13 878
CRT:+Abnormal+wear Type+B 0,14 815
CRT:+Fail+to+close+on+demand Type+A 0,46 248
CRT:+Fail+to+function+on+demand Type+A 1,06 108
CRT:+Plugged/choked Type+B 0,25 456
DGRD:+Abnormal+wear Type+B 0,43 265
DGRD:+Fail+to+close+on+demand Type+A 0,13 878
DGRD:+Fail+to+function+on+demand Type+A 1,56 73
DGRD:+Plugged/choked Type+B 0,28 407
Total+I+Replace+FCM
Type+A 3,34 34
Type+B 1,1 104
CRT:+External+leakage+I+Process+medium Type+A 0,13 878
CRT:+Abnormal+wear Type+B 0,14 815
CRT:+Fail+to+close+on+demand Type+A 0,46 248
CRT:+Fail+to+function+on+demand Type+A 1,06 108
CRT:+Plugged/choked Type+B 0,25 456
DGRD:+Abnormal+wear Type+B 0,43 265
DGRD:+Fail+to+close+on+demand Type+A 0,13 878
DGRD:+Fail+to+function+on+demand Type+A 1,56 73
DGRD:+Plugged/choked Type+B 0,28 407
Total+I+Replace+CCV+insert
Type+A 3,34 34
Type+B 1,10 104
Assumed+compatible+with+flow+sensor Critical Type+A 1,96 58 FCM+retrieval+required
Total+for+the+FCM
Retrieve+FCMType+A 10,32 11Type+B 2,57 44
Retrieve+FCM+(by+MSV) 12,89 9
MTTF+(years)
λ+(fpmh)Criticality
FCM+I+Piping+and+connections
FCM+I+Process+and+Utility+Isolation+Valves+with+Actuators
FCM+I+Production+choke+valve
FCM+I+Chemical+Control+Valve
FCM+I+Wet+Gas+flowmeter


![[Oreda] OREDA - Offshore Reliability Data Handbook(BookFi.org)](https://img.pdfslide.net/doc/110x75/56d6bf841a28ab3016968e36/oreda-oreda-offshore-reliability-data-handbookbookfiorg.jpg)