Embed Size (px)
Citation preview
AIMS Energy, 4(5): 675-696. DOI: 10.3934/energy.2016.5.675 Received: 16 June 2016 Accepted: 26 August 2016
Published: 06 September 2016http://www.aimspress.com/journal/energy
Review
A review of Ghana’s solar energy potential
Samuel Asumadu-Sarkodie* and Phebe Asantewaa Owusu
Sustainable Environment and Energy Systems, Middle East Technical University—Northern Cyprus Campus, Kalkanli, Guzelyurt, TRNC 99738/Mersin 10, Turkey
* Correspondence: Email: [email protected], [email protected]; Tel: +90-533-821-3422.
Abstract: The Eight Hundred and Thirty-Second ACT of the Parliament of the Republic of Ghana entitled: Renewable Energy Act, 2011 has assented to provide for the development, management, utilization, sustainability and adequate supply of renewable energy for generation of heat and power for related matters by the year 2020. With the current load shedding and inadequate energy supply in Ghana, it was essential to examine other options that can be added to the grid installed capacity to ease the burden on Ghanaians. The study examined the solar energy resources in Ghana and how this huge potential can be utilized to grow and modernize the Ghanaian economy in order to decrease the high prevalence of poverty. Access to energy has been proven to directly affect human development, therefore, an option of the diversified local energy mix for electricity production will be the best choice to improve an energy economy that would guarantee a safe and consistent supply of high-quality energy services for all Ghanaian. Evidence from the study shows that Ghana has a good potential for both concentrating and non-concentrating solar technologies. It is estimated that 50–100 MW solar energy potential are still untapped in Ghana which requires an investment of US $100–150 million. Developing and harnessing this renewable energy potential will boost the productivity of businesses, industries, and the transport sector while making a significant contribution to the export earnings of the country.
Keywords: Solar resource assessment; Ghana; renewable energy; solar energy; sustainability
1. Introduction
A country’s energy development is closely linked to climate change variability, economic development, agricultural productivity, food security and quality of life. Several studies in modern economics have established the relationship between Ghana’s energy consumption, macroeconomic
676
AIMS Energy Volume 4, Issue 5, 675-696.
indicators, environmental pollution and population growth [1-3]. Thus, meeting the energy requirement of the Ghanaian population will directly affect the country’s economic growth. At the end of 2010, Ghana migrated from a low-income to a middle-income country as energy services became available and economically accessible [4]. Access to energy plays a critical role in achieving the Sustainable Development Goals (SDGs) by developed, developing and least developed countries by 2030 [5-7]. Certainly, there is a close connection between energy insufficiency and poverty indicators like; illiteracy, life expectancy, infant mortality, total fertility rate, and rapid urbanization in developing countries like Ghana. Rural-urban migration has increased immensely within the last decades in the quest to search for better living conditions and social amenities in the urban areas [8,9]. Ghana is ranked 140th (HDI = 0.579) in the Human Index (HDI) Report as a country with a medium human development index. In addition, 30.5% of her population are in multidimensional poverty while almost 80% have access to electricity [10]. Nevertheless, the inadequate energy supply to meet the demand, power outages, and load shedding have been persistent for a decade now [6].
According to the International Energy Agency (IEA), 1.3 billion of the population are inaccessible to electricity and 2.7 billion people depend on traditional biomass for cooking and heating. It is estimated that more than one-third of household expenses is reserved for the costs of fuel in many countries in Sub-Saharan Africa. Even though biomass is of poor quality and very ineffective but countries in sub-Saharan Africa pays a heavy price for fuel (mainly biomass). Indigenous usage of biomass has been predicted by IEA to decrease in many countries, except South Asia and sub-Saharan Africa in addition to population growth by 2030 [11,12].
Many studies have attested that renewable energy sources are more than enough to meet the current energy demand worldwide, although the estimates of such potential vary in the literature [13]. Aside their enormous potential, renewable energy sources offer further advantages in that, they ―enhance diversity in energy supply markets, secure long term sustainable energy supplies and reduce local and atmospheric emissions‖ [14]. Additionally, under certain conditions such as in developing countries and rural areas, renewable energy sources are more cost-effective sources of energy for the provision of energy services while creating new employment opportunities and possibilities for local manufacturing [13,15].
It has been a challenge for Ghana’s energy sector to increase renewable energy in the national energy portfolio in a sustainable manner. Ghana’s energy sector seeks to increase the proportion of renewable energy, particularly solar energy, wind energy, mini hydro and waste-to-energy in the national energy supply mix while contributing to climate change mitigation [16].
The Government of Ghana is dedicated to improving the cost-effectiveness of certain renewable energy technologies like; solar energy and wind energy by addressing the technological difficulties, institutional barriers, along with market restrictions that impede the utilization of solar and wind energy technologies [17]. Ghana is well endowed with renewable energy resources, particularly biomass, solar and wind energy [18]. The development and utilization of renewable energy and waste-to-energy resources have the potential to guarantee Ghana’s energy security while mitigating climate change and its impacts. The use of waste-to-energy resources have the potential to act as a significant part of the national sanitation program [19].
In 2013, the total grid electricity generated in the country was 12,870 GWh compared to 12,164 GWh in 2012 and 11,200 GWh in 2011. The 2012 gross electricity generation was made up of 8071 GWh from hydroelectric power and 3639 GWh from thermal power [20]. Though the share of hydropower generation decreased by 0.5% at the end of 2011 however, energy production increased
677
AIMS Energy Volume 4, Issue 5, 675-696.
by almost 510 GWh in 2012 due to significant water inflow in the Akosombo dam [5,20]. In 2013, the industrial, residential, commercial sectors and street lighting system accounted for 45%, 35%, 16% and 4% of the total electricity end-use in Ghana [5]. Ghana’s Renewable Energy Development Program aims to assess the availability of renewable energy resources by examining the technical feasibility and cost-effectiveness of promising renewable energy technologies [21,22], ensuring the efficient production and use of the country’s renewable energy resources, and developing the relevant information base that will facilitate the establishment of a planning framework for the rational development and the use of the country’s renewable energy resources [23].
The Eight Hundred and Thirty-Second ACT of the Parliament of the Republic of Ghana entitled: Renewable Energy Act, 2011 has assented to provide for the development, management, utilization, sustainability and adequate supply of renewable energy for generation of heat and power for related matters by the year 2020 [24].
There is a global paradigm shift in energy and its related studies within the past decades. Renewable energy research is spearheading in energy and its related studies due to its role as an alternative to fossil-fuel based energy generation and climate change mitigation. Empirical evidence shows the relationship between energy consumption, utilization and environmental pollution in many developing and growing economies [25-31].
Nevertheless, there are limited studies on Ghana’s solar resource analysis. Almost every study depends on the solar and wind energy resource assessment (SWERA) project in Ghana without any alternative [32]. The SWERA project provides no information on the solar resources for concentrating and non-concentrating surfaces nor the losses for the different tracking surfaces. Against this background, the study reviews Ghana’s solar energy potential and examine the solar resource potential in some selected locations in Ghana. The study serves as an alternative to the SWERA project with much information on the solar resources for concentrating and non-concentrating surfaces and the losses for the different tracking surfaces in the selected locations. The essence of this research is to serve as a reference material for further academic studies in order to broaden the scope and frontiers of research in this field. Finally, the study will also inform and support the work of policymakers, research analysts, project planners and investors in Ghana.
2. Solar energy
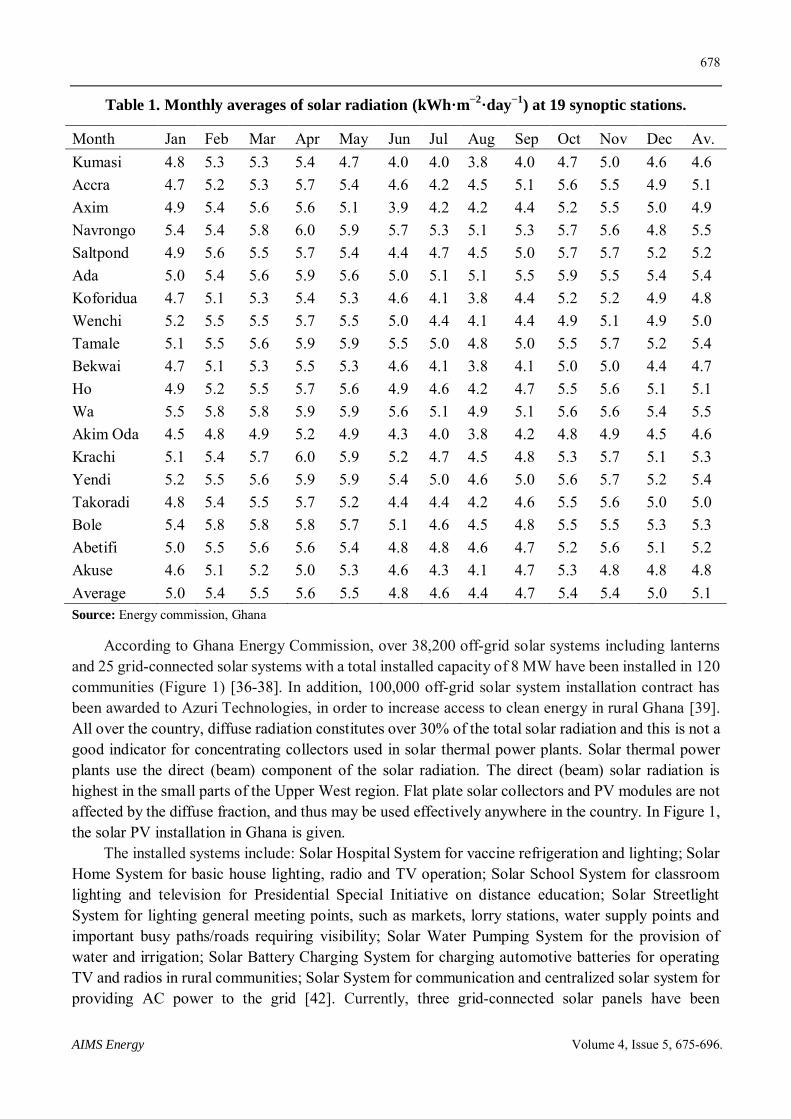
According to the energy commission of Ghana, Ghana is endowed with vast solar energy resource which spreads through the entire country. Daily solar irradiation level ranges from 4 kWh/m2 to 6 kWh/m2 (Table 1) with an annual sunshine duration ranges between 1800 to 3000 hours per annum which offers a high potential for grid connection [33,34]. The allocation of solar intensities in Ghana are as follows: the savannah zone which comprises; Upper East, Upper West, Northern, upper parts of Brong-Ahafo and Volta Regions experiences 4.0–6.5 kWh·m−2·day−1 of solar radiation; middle forest zone which consists of, Ashanti, Eastern, Western and parts of Central, Brong-Ahafo, Volta Regions experiences 3.1–5.8 kWh·m−2·day−1 of solar intensities whilst the coastal belt consisting of Greater Accra, coastal parts of Central and Volta Regions experiences 4.0–6.0 kWh·m−2·day−1 of solar intensities [34,35]. In Table 1, the monthly averages of solar radiation (kWh·m−2·day−1) at 19 synoptic stations are given.
678
AIMS Energy Volume 4, Issue 5, 675-696.
Table 1. Monthly averages of solar radiation (kWh·m−2
·day−1
) at 19 synoptic stations.
Month Jan Feb Mar Apr May Jun Jul Aug Sep Oct Nov Dec Av. Kumasi 4.8 5.3 5.3 5.4 4.7 4.0 4.0 3.8 4.0 4.7 5.0 4.6 4.6 Accra 4.7 5.2 5.3 5.7 5.4 4.6 4.2 4.5 5.1 5.6 5.5 4.9 5.1 Axim 4.9 5.4 5.6 5.6 5.1 3.9 4.2 4.2 4.4 5.2 5.5 5.0 4.9 Navrongo 5.4 5.4 5.8 6.0 5.9 5.7 5.3 5.1 5.3 5.7 5.6 4.8 5.5 Saltpond 4.9 5.6 5.5 5.7 5.4 4.4 4.7 4.5 5.0 5.7 5.7 5.2 5.2 Ada 5.0 5.4 5.6 5.9 5.6 5.0 5.1 5.1 5.5 5.9 5.5 5.4 5.4 Koforidua 4.7 5.1 5.3 5.4 5.3 4.6 4.1 3.8 4.4 5.2 5.2 4.9 4.8 Wenchi 5.2 5.5 5.5 5.7 5.5 5.0 4.4 4.1 4.4 4.9 5.1 4.9 5.0 Tamale 5.1 5.5 5.6 5.9 5.9 5.5 5.0 4.8 5.0 5.5 5.7 5.2 5.4 Bekwai 4.7 5.1 5.3 5.5 5.3 4.6 4.1 3.8 4.1 5.0 5.0 4.4 4.7 Ho 4.9 5.2 5.5 5.7 5.6 4.9 4.6 4.2 4.7 5.5 5.6 5.1 5.1 Wa 5.5 5.8 5.8 5.9 5.9 5.6 5.1 4.9 5.1 5.6 5.6 5.4 5.5 Akim Oda 4.5 4.8 4.9 5.2 4.9 4.3 4.0 3.8 4.2 4.8 4.9 4.5 4.6 Krachi 5.1 5.4 5.7 6.0 5.9 5.2 4.7 4.5 4.8 5.3 5.7 5.1 5.3 Yendi 5.2 5.5 5.6 5.9 5.9 5.4 5.0 4.6 5.0 5.6 5.7 5.2 5.4 Takoradi 4.8 5.4 5.5 5.7 5.2 4.4 4.4 4.2 4.6 5.5 5.6 5.0 5.0 Bole 5.4 5.8 5.8 5.8 5.7 5.1 4.6 4.5 4.8 5.5 5.5 5.3 5.3 Abetifi 5.0 5.5 5.6 5.6 5.4 4.8 4.8 4.6 4.7 5.2 5.6 5.1 5.2 Akuse 4.6 5.1 5.2 5.0 5.3 4.6 4.3 4.1 4.7 5.3 4.8 4.8 4.8 Average 5.0 5.4 5.5 5.6 5.5 4.8 4.6 4.4 4.7 5.4 5.4 5.0 5.1 Source: Energy commission, Ghana
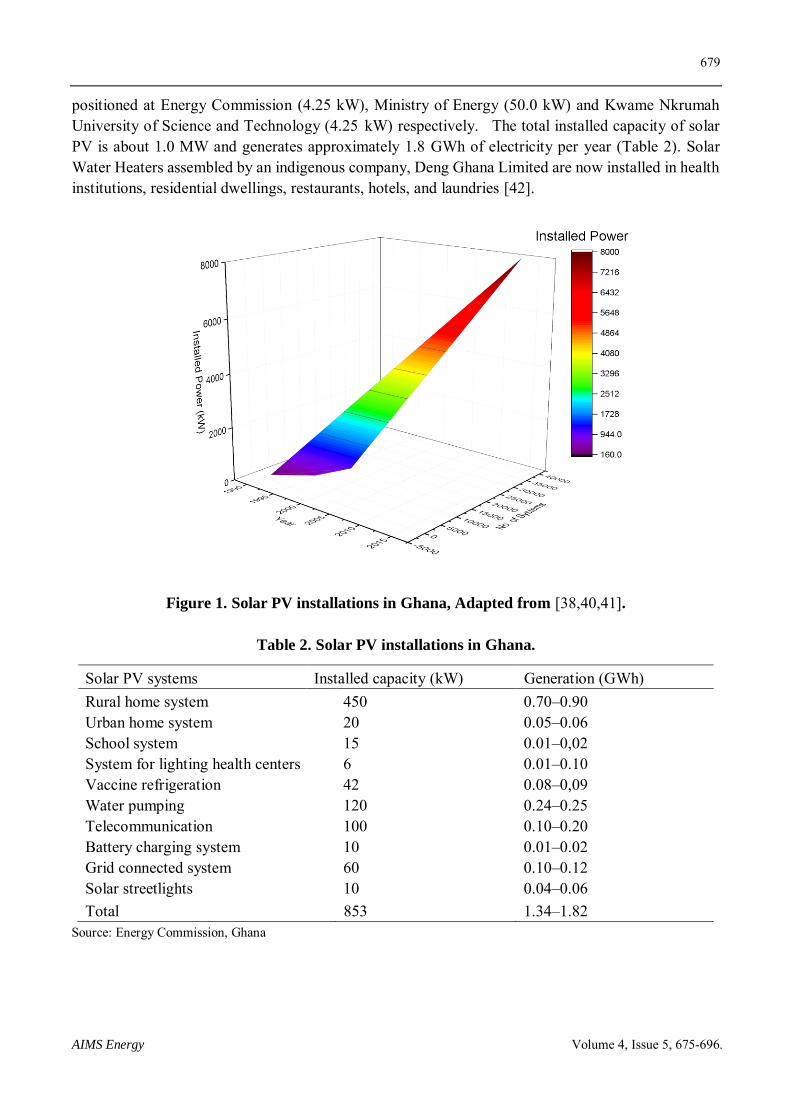
According to Ghana Energy Commission, over 38,200 off-grid solar systems including lanterns and 25 grid-connected solar systems with a total installed capacity of 8 MW have been installed in 120 communities (Figure 1) [36-38]. In addition, 100,000 off-grid solar system installation contract has been awarded to Azuri Technologies, in order to increase access to clean energy in rural Ghana [39]. All over the country, diffuse radiation constitutes over 30% of the total solar radiation and this is not a good indicator for concentrating collectors used in solar thermal power plants. Solar thermal power plants use the direct (beam) component of the solar radiation. The direct (beam) solar radiation is highest in the small parts of the Upper West region. Flat plate solar collectors and PV modules are not affected by the diffuse fraction, and thus may be used effectively anywhere in the country. In Figure 1, the solar PV installation in Ghana is given.
The installed systems include: Solar Hospital System for vaccine refrigeration and lighting; Solar Home System for basic house lighting, radio and TV operation; Solar School System for classroom lighting and television for Presidential Special Initiative on distance education; Solar Streetlight System for lighting general meeting points, such as markets, lorry stations, water supply points and important busy paths/roads requiring visibility; Solar Water Pumping System for the provision of water and irrigation; Solar Battery Charging System for charging automotive batteries for operating TV and radios in rural communities; Solar System for communication and centralized solar system for providing AC power to the grid [42]. Currently, three grid-connected solar panels have been
679
AIMS Energy Volume 4, Issue 5, 675-696.
positioned at Energy Commission (4.25 kW), Ministry of Energy (50.0 kW) and Kwame Nkrumah University of Science and Technology (4.25 kW) respectively. The total installed capacity of solar PV is about 1.0 MW and generates approximately 1.8 GWh of electricity per year (Table 2). Solar Water Heaters assembled by an indigenous company, Deng Ghana Limited are now installed in health institutions, residential dwellings, restaurants, hotels, and laundries [42].
Figure 1. Solar PV installations in Ghana, Adapted from [38,40,41].
Table 2. Solar PV installations in Ghana.
Solar PV systems Installed capacity (kW) Generation (GWh) Rural home system Urban home system School system System for lighting health centers Vaccine refrigeration Water pumping Telecommunication Battery charging system Grid connected system Solar streetlights
450
20
15
6
42
120
100
10
60
10
0.70–0.90 0.05–0.06 0.01–0,02 0.01–0.10 0.08–0,09 0.24–0.25 0.10–0.20 0.01–0.02 0.10–0.12 0.04–0.06
Total 853 1.34–1.82 Source: Energy Commission, Ghana
680
AIMS Energy Volume 4, Issue 5, 675-696.
2.1. Methodology
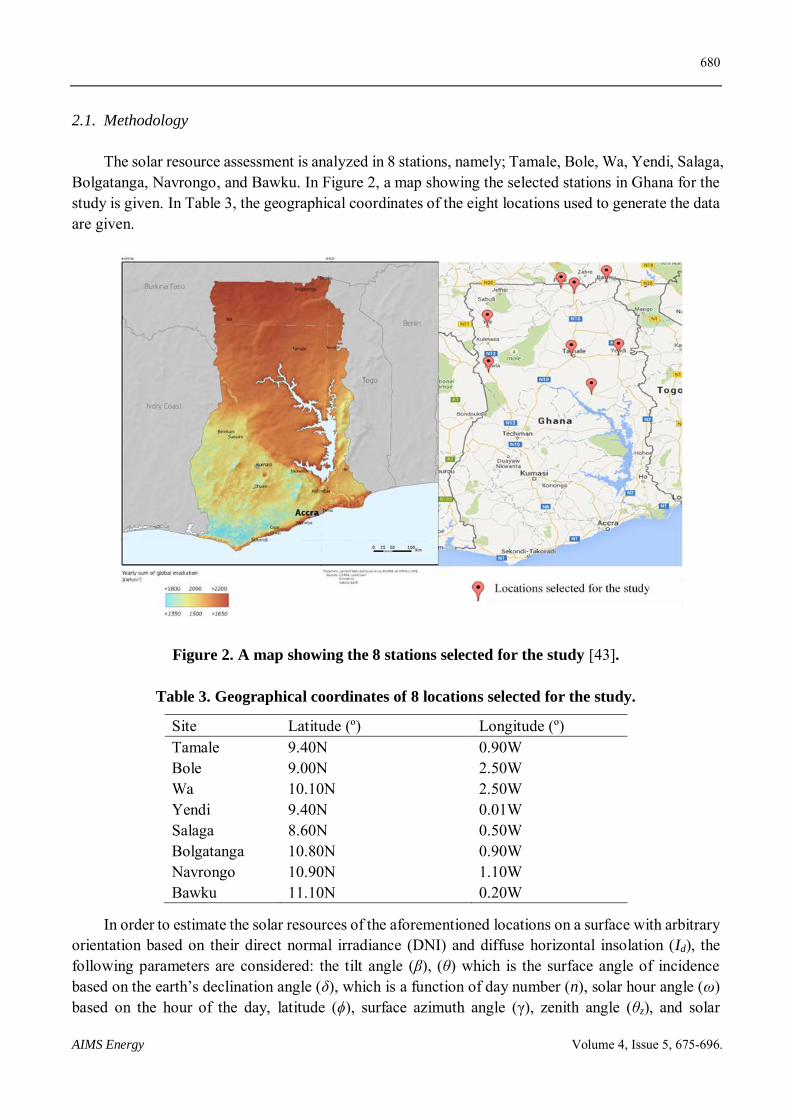
The solar resource assessment is analyzed in 8 stations, namely; Tamale, Bole, Wa, Yendi, Salaga, Bolgatanga, Navrongo, and Bawku. In Figure 2, a map showing the selected stations in Ghana for the study is given. In Table 3, the geographical coordinates of the eight locations used to generate the data are given.
Figure 2. A map showing the 8 stations selected for the study [43].
Table 3. Geographical coordinates of 8 locations selected for the study.
Site Latitude (º) Longitude (º) Tamale 9.40N 0.90W Bole 9.00N 2.50W Wa 10.10N 2.50W Yendi 9.40N 0.01W Salaga 8.60N 0.50W Bolgatanga 10.80N 0.90W Navrongo 10.90N 1.10W Bawku 11.10N 0.20W
In order to estimate the solar resources of the aforementioned locations on a surface with arbitrary orientation based on their direct normal irradiance (DNI) and diffuse horizontal insolation (Id), the following parameters are considered: the tilt angle (β), (θ) which is the surface angle of incidence based on the earth’s declination angle (δ), which is a function of day number (n), solar hour angle (ω) based on the hour of the day, latitude (ϕ), surface azimuth angle (γ), zenith angle (θz), and solar
681
AIMS Energy Volume 4, Issue 5, 675-696.
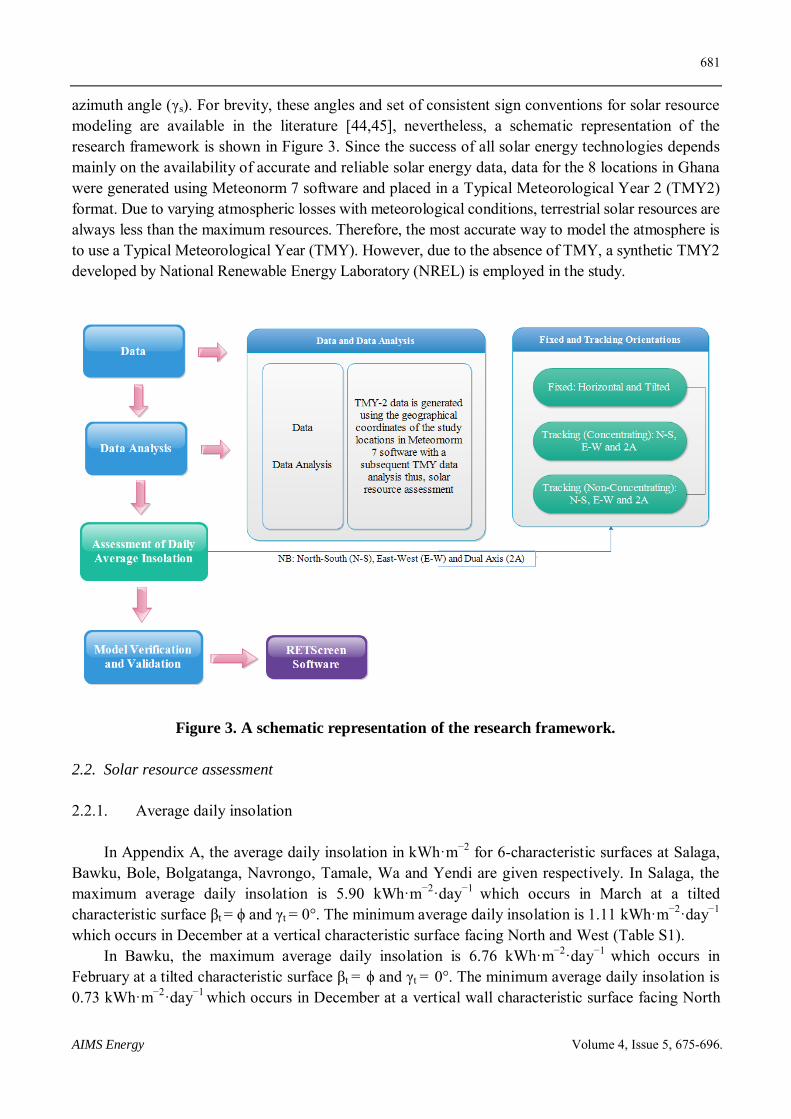
azimuth angle (γs). For brevity, these angles and set of consistent sign conventions for solar resource modeling are available in the literature [44,45], nevertheless, a schematic representation of the research framework is shown in Figure 3. Since the success of all solar energy technologies depends mainly on the availability of accurate and reliable solar energy data, data for the 8 locations in Ghana were generated using Meteonorm 7 software and placed in a Typical Meteorological Year 2 (TMY2) format. Due to varying atmospheric losses with meteorological conditions, terrestrial solar resources are always less than the maximum resources. Therefore, the most accurate way to model the atmosphere is to use a Typical Meteorological Year (TMY). However, due to the absence of TMY, a synthetic TMY2 developed by National Renewable Energy Laboratory (NREL) is employed in the study.
Figure 3. A schematic representation of the research framework.
2.2. Solar resource assessment
2.2.1. Average daily insolation
In Appendix A, the average daily insolation in kWh·m−2 for 6-characteristic surfaces at Salaga, Bawku, Bole, Bolgatanga, Navrongo, Tamale, Wa and Yendi are given respectively. In Salaga, the maximum average daily insolation is 5.90 kWh·m−2·day−1 which occurs in March at a tilted characteristic surface βt = ϕ and γt = 0°. The minimum average daily insolation is 1.11 kWh·m−2·day−1
which occurs in December at a vertical characteristic surface facing North and West (Table S1). In Bawku, the maximum average daily insolation is 6.76 kWh·m−2·day−1 which occurs in
February at a tilted characteristic surface βt = ϕ and γt = 0°. The minimum average daily insolation is 0.73 kWh·m−2·day−1 which occurs in December at a vertical wall characteristic surface facing North
682
AIMS Energy Volume 4, Issue 5, 675-696.
and West (Table S2). In Bole, the maximum average daily insolation is 5.98 kWh·m−2·day−1 which occurs in February at a tilted characteristic surface βt = ϕ and γt = 0°. The minimum average daily insolation is 1.11 kWh·m−2·day−1 which occurs in November at a vertical characteristic surface facing North and West (Table S3).
In Bolgatanga, the maximum average daily insolation is 6.85 kWh·m−2·day−1 which occurs in February at a tilted characteristic surface βt = ϕ and γt = 0°. The minimum average daily insolation is 0.64 kWh·m−2·day−1 which occurs in January at a vertical characteristic surface facing North and West (Table S4).
In Navrongo, the maximum average daily insolation is kWh·m−2·day−1 which occurs in February at a tilted characteristic surface βt = tilted γt = 0°. The minimum average daily insolation is 0.62 kWh·m−2·day−1 which occurs in December at a vertical characteristic surface facing North and West (Table S5).
In Tamale, the maximum average daily insolation is 5.94 kWh·m−2·day−1 which occurs in both February and March at a tilted characteristic surface βt = tilted γt = 0°. The minimum average daily insolation is 1.11 kWh·m−2·day−1 which occurs in November at a vertical wall characteristic surface facing North and West (Table S6).
In Wa, the maximum average daily insolation is 6.46 kWh·m−2·day−1 which occurs in February at a tilted characteristic surface βt = tilted γt = 0°. The minimum average daily insolation is 1.00 kWh·m−2·day−1 which occurs in both January and December at a vertical characteristic surface facing North and West (Table S7).
In Yendi, the maximum average daily insolation is 5.77 kWh·m−2·day−1 which occurs in March at a tilted characteristic surface βt = tilted γt = 0°. The minimum average daily insolation is 1.06 kWh·m−2·day−1 which occurs in December at a vertical wall characteristic surface facing north and west (Table S8).
2.2.2. Trends in daily insolation
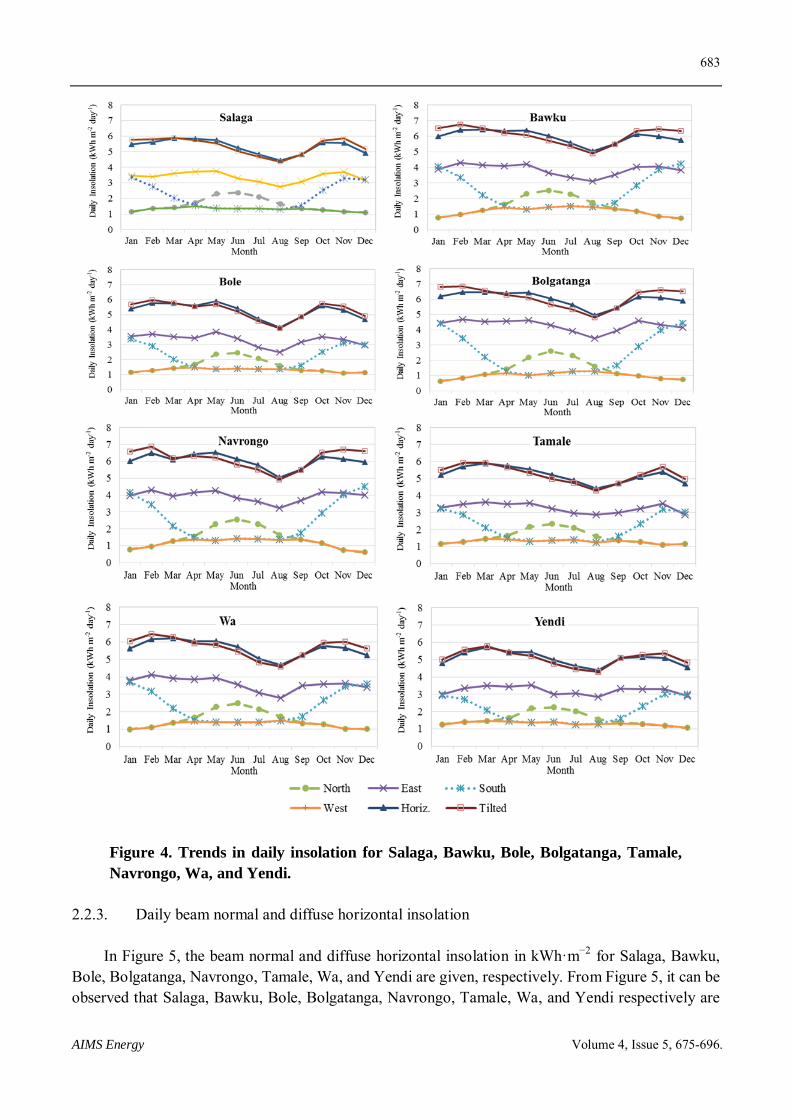
In Figure 4, the trends in daily insolation in kWh·m−2 for 6-characteristic surfaces for; Salaga, Bawku, Bole, Bolgatanga, Navrongo, Tamale, Wa, and Yendi are given respectively. There is a constant trend in the daily insolation within the 8 locations, the maximum average daily insolation occurs in 7 months (January, February, March, September, October, November, and December) at the tilted characteristic surface βt = tilted γt = 0°, while the rest of the maximum average daily insolation occurs in 5 months (April, May, June, July, and August) on the horizontal surface. The least average daily insolation occurs in the vertical walls facing West while the third highest average daily insolation occurs in vertical wall facing East in all the 8 locations which are useful in housing design. Thus, for cooling and heating purposes in these locations, the windows can be mounted in the vertical walls facing West and East.
683
AIMS Energy Volume 4, Issue 5, 675-696.
Figure 4. Trends in daily insolation for Salaga, Bawku, Bole, Bolgatanga, Tamale,
Navrongo, Wa, and Yendi.
2.2.3. Daily beam normal and diffuse horizontal insolation
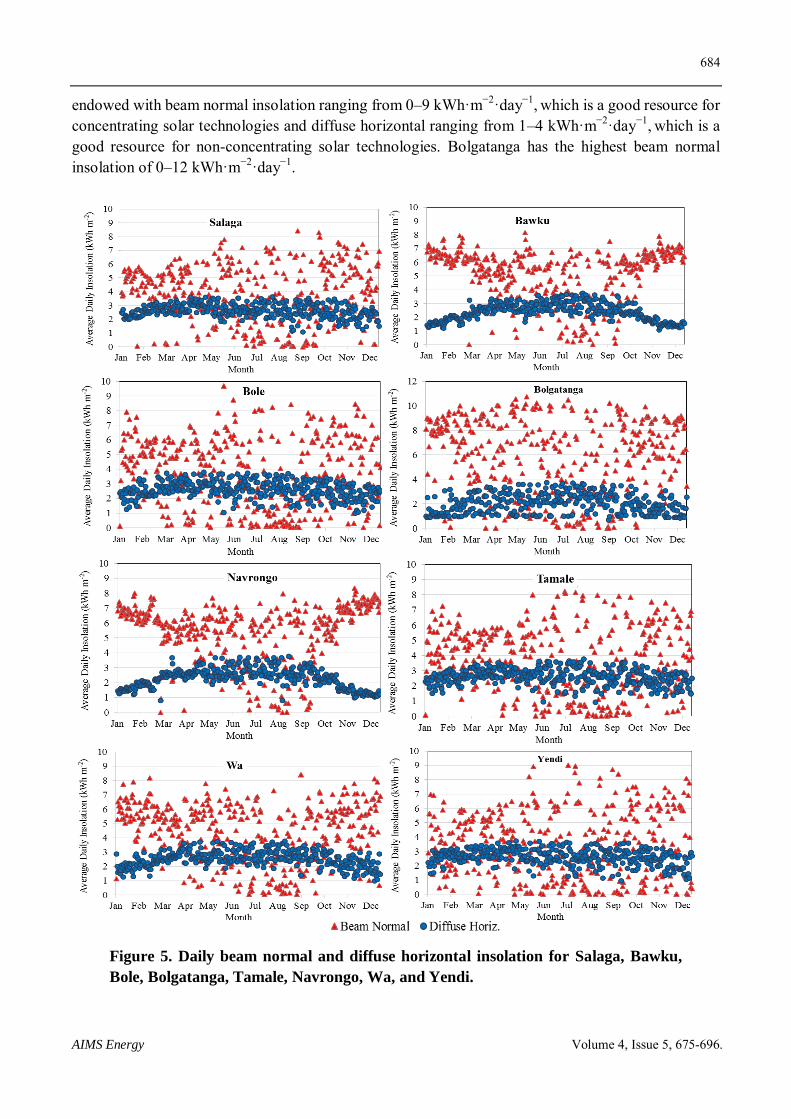
In Figure 5, the beam normal and diffuse horizontal insolation in kWh·m−2 for Salaga, Bawku, Bole, Bolgatanga, Navrongo, Tamale, Wa, and Yendi are given, respectively. From Figure 5, it can be observed that Salaga, Bawku, Bole, Bolgatanga, Navrongo, Tamale, Wa, and Yendi respectively are
684
AIMS Energy Volume 4, Issue 5, 675-696.
endowed with beam normal insolation ranging from 0–9 kWh·m−2·day−1, which is a good resource for concentrating solar technologies and diffuse horizontal ranging from 1–4 kWh·m−2·day−1, which is a good resource for non-concentrating solar technologies. Bolgatanga has the highest beam normal insolation of 0–12 kWh·m−2·day−1.
Figure 5. Daily beam normal and diffuse horizontal insolation for Salaga, Bawku,
Bole, Bolgatanga, Tamale, Navrongo, Wa, and Yendi.
685
AIMS Energy Volume 4, Issue 5, 675-696.
2.2.4. Solar resources and losses
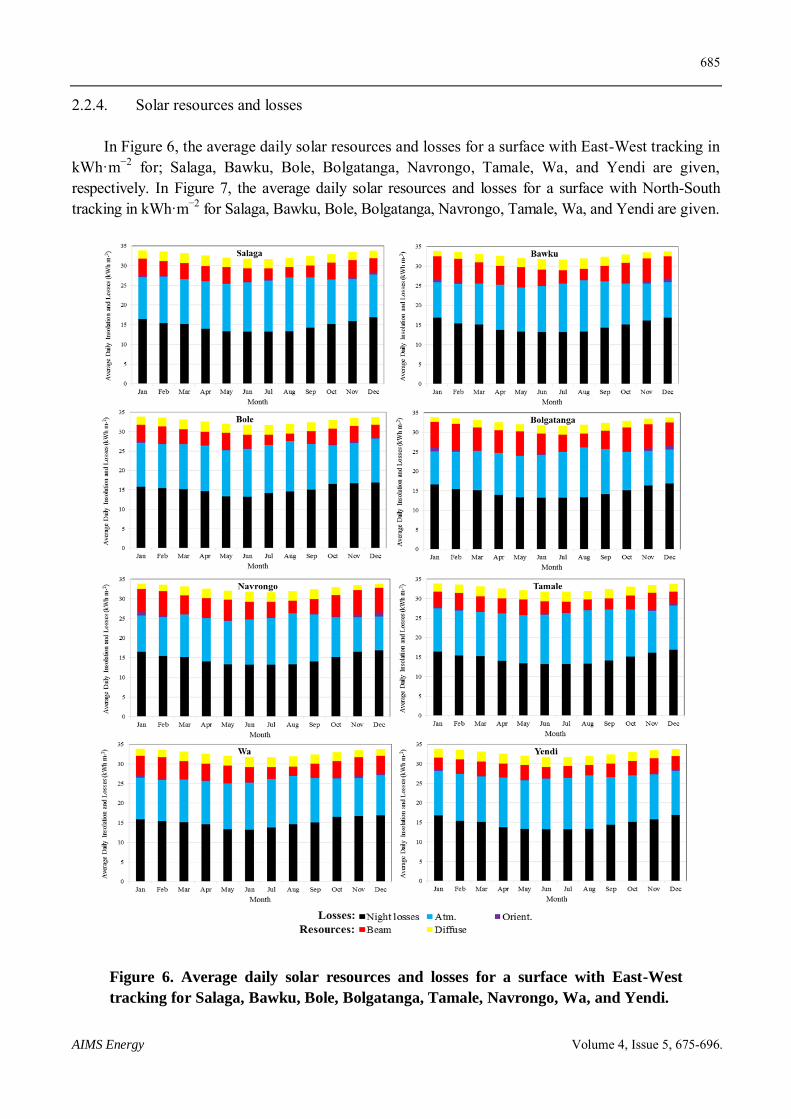
In Figure 6, the average daily solar resources and losses for a surface with East-West tracking in kWh·m−2 for; Salaga, Bawku, Bole, Bolgatanga, Navrongo, Tamale, Wa, and Yendi are given, respectively. In Figure 7, the average daily solar resources and losses for a surface with North-South tracking in kWh·m−2 for Salaga, Bawku, Bole, Bolgatanga, Navrongo, Tamale, Wa, and Yendi are given.
Figure 6. Average daily solar resources and losses for a surface with East-West
tracking for Salaga, Bawku, Bole, Bolgatanga, Tamale, Navrongo, Wa, and Yendi.
686
AIMS Energy Volume 4, Issue 5, 675-696.
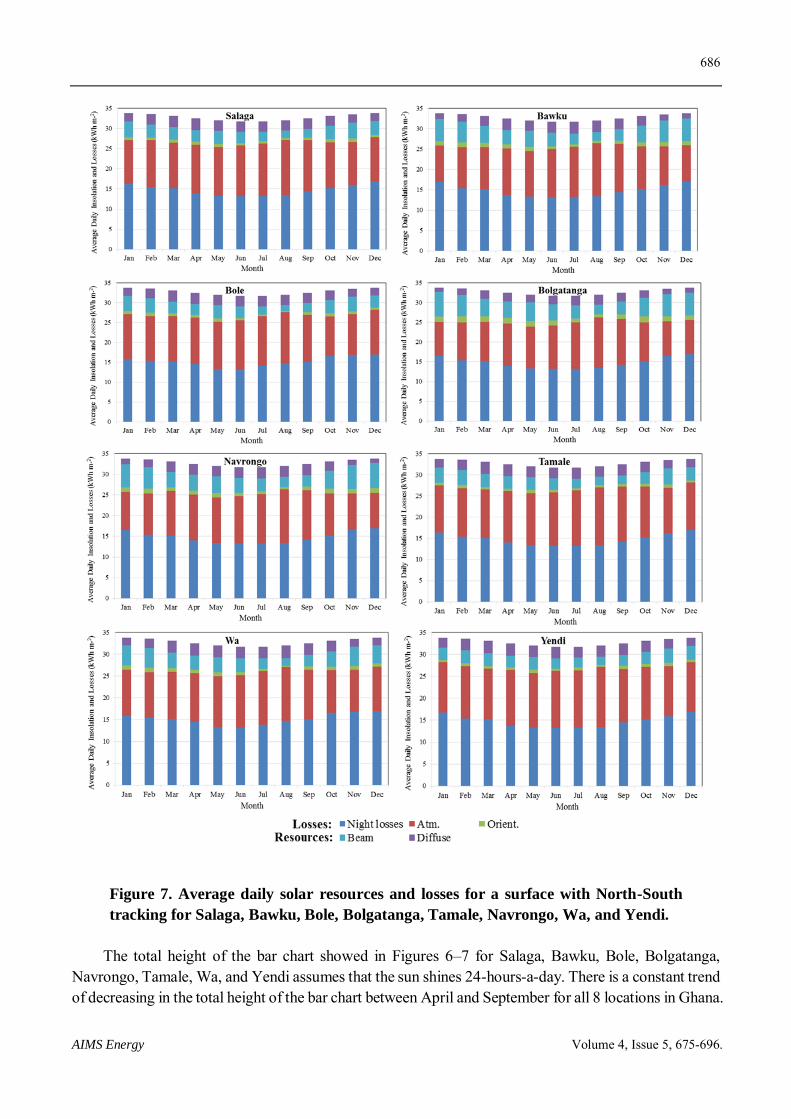
Figure 7. Average daily solar resources and losses for a surface with North-South
tracking for Salaga, Bawku, Bole, Bolgatanga, Tamale, Navrongo, Wa, and Yendi.
The total height of the bar chart showed in Figures 6–7 for Salaga, Bawku, Bole, Bolgatanga, Navrongo, Tamale, Wa, and Yendi assumes that the sun shines 24-hours-a-day. There is a constant trend of decreasing in the total height of the bar chart between April and September for all 8 locations in Ghana.
687
AIMS Energy Volume 4, Issue 5, 675-696.
There are two reasons for this trend; during these months, the Earth moves farther away from the Sun and there are more precipitations during these months. Therefore, as night losses decrease there is an increasing atmospheric loss due to moisture as a result of precipitations. In Figure 6, there are fewer orientation losses than in Figure 7, the reason being that incidence angle tends to reduce between March and September in Salaga, Bawku, Bole, Bolgatanga, Navrongo, Tamale, Wa and Yendi for a surface with East-West tracking but the opposite happens for a surface with North-South tracking. This is to show that East-West tracking is far more valuable for concentrating surfaces in Salaga, Bawku, Bole, Bolgatanga, Navrongo, Tamale, Wa and Yendi than North-South tracking.
2.2.5. Solar resources for concentrating and non-concentrating
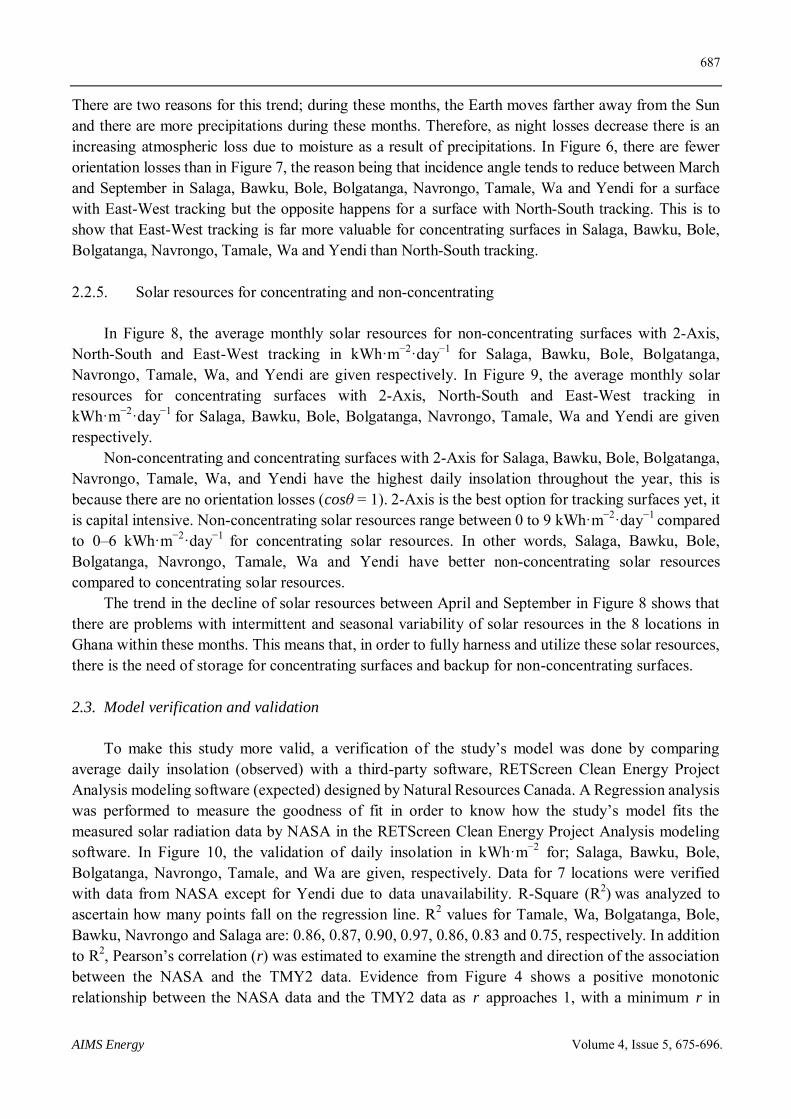
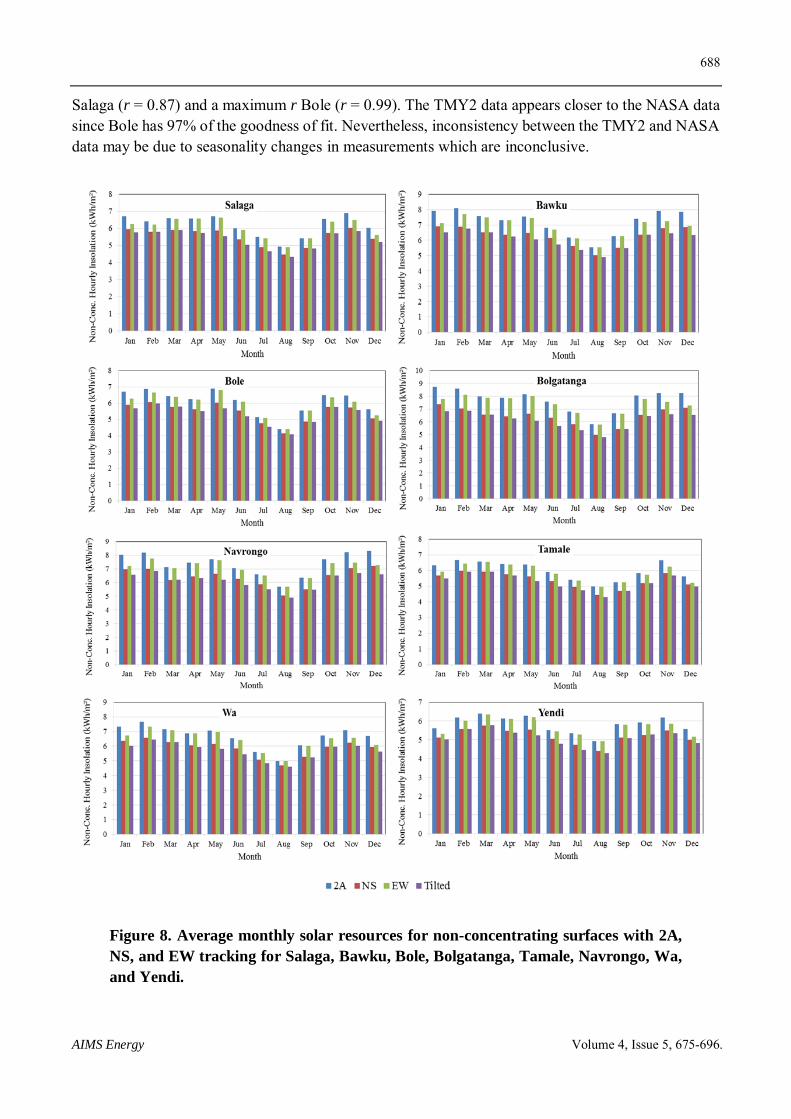
In Figure 8, the average monthly solar resources for non-concentrating surfaces with 2-Axis, North-South and East-West tracking in kWh·m−2·day−1 for Salaga, Bawku, Bole, Bolgatanga, Navrongo, Tamale, Wa, and Yendi are given respectively. In Figure 9, the average monthly solar resources for concentrating surfaces with 2-Axis, North-South and East-West tracking in kWh·m−2·day−1 for Salaga, Bawku, Bole, Bolgatanga, Navrongo, Tamale, Wa and Yendi are given respectively.
Non-concentrating and concentrating surfaces with 2-Axis for Salaga, Bawku, Bole, Bolgatanga, Navrongo, Tamale, Wa, and Yendi have the highest daily insolation throughout the year, this is because there are no orientation losses (cosθ = 1). 2-Axis is the best option for tracking surfaces yet, it is capital intensive. Non-concentrating solar resources range between 0 to 9 kWh·m−2·day−1 compared to 0–6 kWh·m−2·day−1 for concentrating solar resources. In other words, Salaga, Bawku, Bole, Bolgatanga, Navrongo, Tamale, Wa and Yendi have better non-concentrating solar resources compared to concentrating solar resources.
The trend in the decline of solar resources between April and September in Figure 8 shows that there are problems with intermittent and seasonal variability of solar resources in the 8 locations in Ghana within these months. This means that, in order to fully harness and utilize these solar resources, there is the need of storage for concentrating surfaces and backup for non-concentrating surfaces.
2.3. Model verification and validation
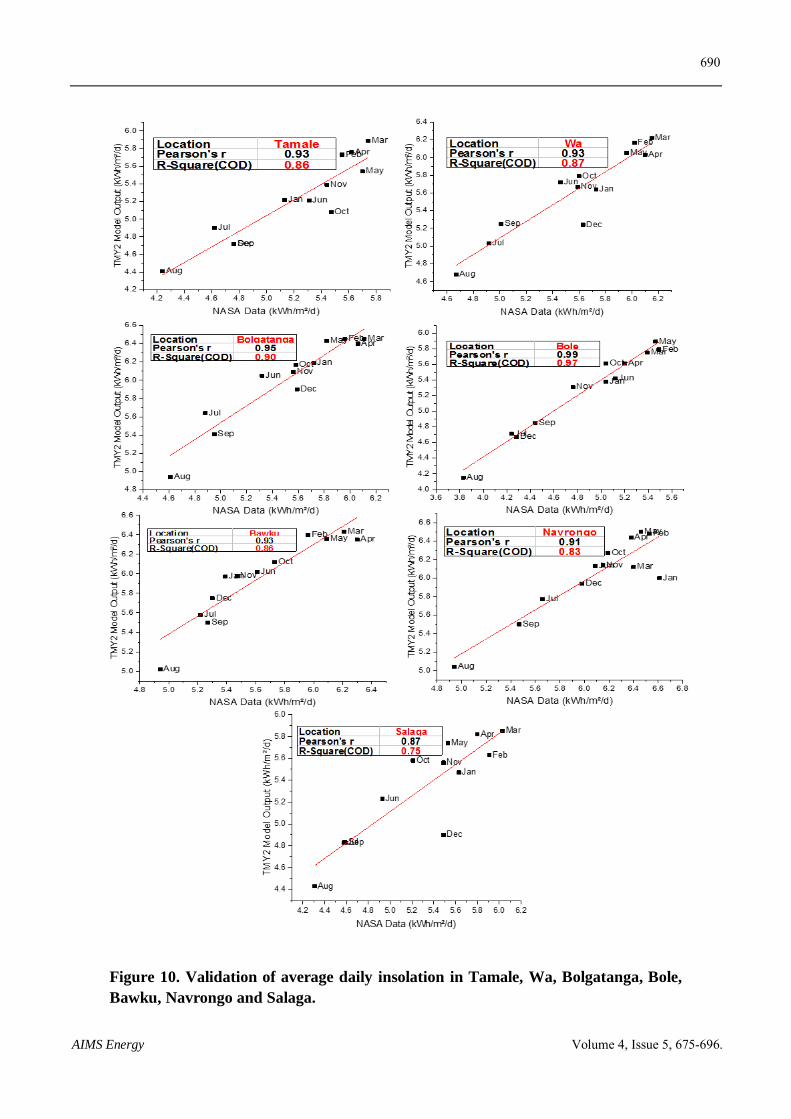
To make this study more valid, a verification of the study’s model was done by comparing average daily insolation (observed) with a third-party software, RETScreen Clean Energy Project Analysis modeling software (expected) designed by Natural Resources Canada. A Regression analysis was performed to measure the goodness of fit in order to know how the study’s model fits the measured solar radiation data by NASA in the RETScreen Clean Energy Project Analysis modeling software. In Figure 10, the validation of daily insolation in kWh·m−2 for; Salaga, Bawku, Bole, Bolgatanga, Navrongo, Tamale, and Wa are given, respectively. Data for 7 locations were verified with data from NASA except for Yendi due to data unavailability. R-Square (R2) was analyzed to ascertain how many points fall on the regression line. R2 values for Tamale, Wa, Bolgatanga, Bole, Bawku, Navrongo and Salaga are: 0.86, 0.87, 0.90, 0.97, 0.86, 0.83 and 0.75, respectively. In addition to R2, Pearson’s correlation (r) was estimated to examine the strength and direction of the association between the NASA and the TMY2 data. Evidence from Figure 4 shows a positive monotonic relationship between the NASA data and the TMY2 data as r approaches 1, with a minimum r in
688
AIMS Energy Volume 4, Issue 5, 675-696.
Salaga (r = 0.87) and a maximum r Bole (r = 0.99). The TMY2 data appears closer to the NASA data since Bole has 97% of the goodness of fit. Nevertheless, inconsistency between the TMY2 and NASA data may be due to seasonality changes in measurements which are inconclusive.
Figure 8. Average monthly solar resources for non-concentrating surfaces with 2A,
NS, and EW tracking for Salaga, Bawku, Bole, Bolgatanga, Tamale, Navrongo, Wa,
and Yendi.
689
AIMS Energy Volume 4, Issue 5, 675-696.
Figure 9. Average monthly solar resources for concentrating surfaces with 2A, NS,
and EW tracking for Salaga, Bawku, Bole, Bolgatanga, Tamale, Navrongo, Wa, and
Yendi.
690
AIMS Energy Volume 4, Issue 5, 675-696.
Figure 10. Validation of average daily insolation in Tamale, Wa, Bolgatanga, Bole,
Bawku, Navrongo and Salaga.
691
AIMS Energy Volume 4, Issue 5, 675-696.
3. Renewable energy targets and challenges
3.1. Renewable energy targets
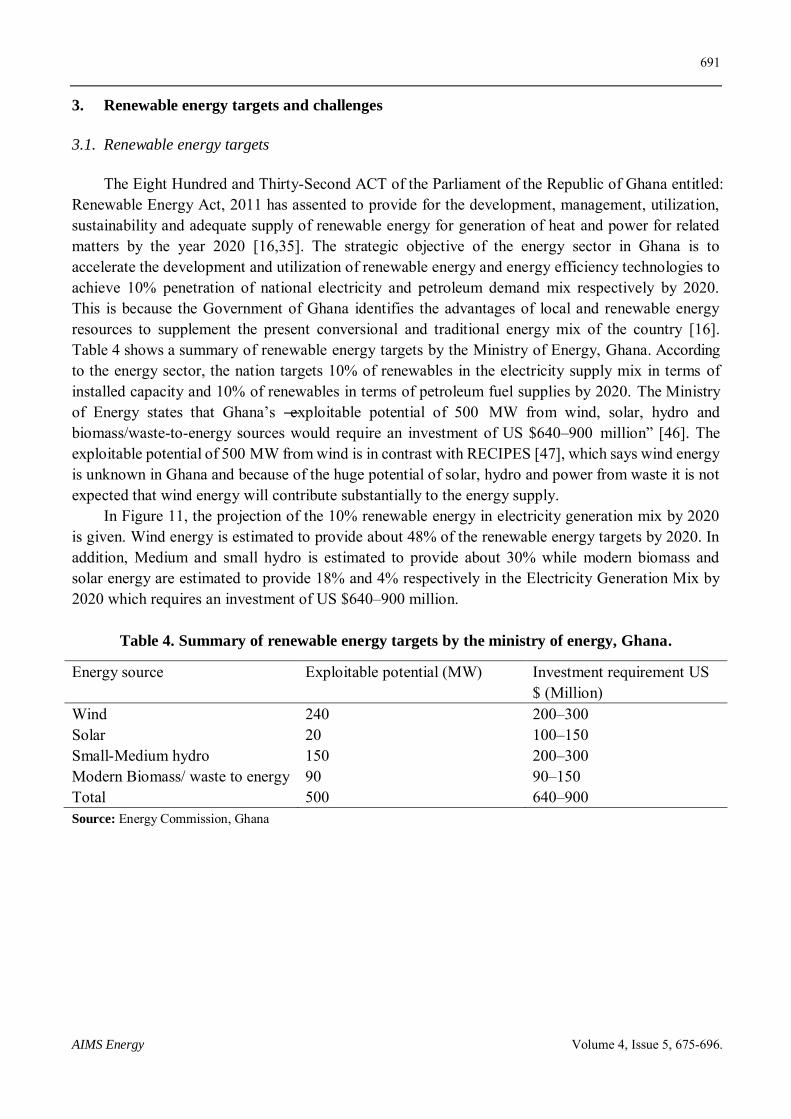
The Eight Hundred and Thirty-Second ACT of the Parliament of the Republic of Ghana entitled: Renewable Energy Act, 2011 has assented to provide for the development, management, utilization, sustainability and adequate supply of renewable energy for generation of heat and power for related matters by the year 2020 [16,35]. The strategic objective of the energy sector in Ghana is to accelerate the development and utilization of renewable energy and energy efficiency technologies to achieve 10% penetration of national electricity and petroleum demand mix respectively by 2020. This is because the Government of Ghana identifies the advantages of local and renewable energy resources to supplement the present conversional and traditional energy mix of the country [16]. Table 4 shows a summary of renewable energy targets by the Ministry of Energy, Ghana. According to the energy sector, the nation targets 10% of renewables in the electricity supply mix in terms of installed capacity and 10% of renewables in terms of petroleum fuel supplies by 2020. The Ministry of Energy states that Ghana’s ―exploitable potential of 500 MW from wind, solar, hydro and biomass/waste-to-energy sources would require an investment of US $640–900 million‖ [46]. The exploitable potential of 500 MW from wind is in contrast with RECIPES [47], which says wind energy is unknown in Ghana and because of the huge potential of solar, hydro and power from waste it is not expected that wind energy will contribute substantially to the energy supply.
In Figure 11, the projection of the 10% renewable energy in electricity generation mix by 2020 is given. Wind energy is estimated to provide about 48% of the renewable energy targets by 2020. In addition, Medium and small hydro is estimated to provide about 30% while modern biomass and solar energy are estimated to provide 18% and 4% respectively in the Electricity Generation Mix by 2020 which requires an investment of US $640–900 million.
Table 4. Summary of renewable energy targets by the ministry of energy, Ghana.
Energy source Exploitable potential (MW) Investment requirement US $ (Million)
Wind 240 200–300 Solar 20 100–150 Small-Medium hydro 150 200–300 Modern Biomass/ waste to energy 90 90–150 Total 500 640–900 Source: Energy Commission, Ghana
692
AIMS Energy Volume 4, Issue 5, 675-696.
Figure 11. Projection of the 10% renewable energy in the electricity generation Mix
by 2020.
3.2. Challenges
The fundamental goal of the Government of Ghana’s development agenda as enshrined in the Growth and Poverty Reduction Strategy (GPRS II) is to grow the economy in order to reduce poverty among Ghanaians. However, the challenge is how to increase the energy supplies and also expand the energy infrastructure in order to achieve the development targets. Another challenge facing renewable energy development in Ghana is the high cost of these energy sources owing to the current state of their technology. Renewable energy implementation is hindered by the inadequate tariff frameworks, a challenging investment climate, limited technological advancement and capacity, and the deficiency of renewable energy experience [38]. Finally, the major challenge in biomass energy supply is how to reverse the decline in the fuelwood resource base of the country and further sustain its production and use by improving the efficiency of production and use.
4. Discussion
The solar resource assessment provides evidence that needs further analysis. Ghana is endowed with solar resource potentials thus, concentrating and non-concentrating which are available across the country. A recent study by Asumadu-Sarkodie and Owusu [22] examined the potential and economic feasibility of solar photovoltaic power systems in Ghana. Evidence from their study shows that 5 MW of grid-connected electricity can be harnessed from 20 strategic locations in Ghana, which requires an investment capital of US $17,752,179 and a land requirement of 25,313 m2 for photovoltaic power system installation across Ghana. Even though their study highlighted some location with limited potential for a 5 MW of grid-connected electricity nevertheless, low capacity photovoltaic power system installations can be utilized in those locations. Currently, a US $ 230 million solar investment deal have been made for a 5-year period, which encompasses: mini-grid and standalone solar PV systems, solar photovoltaic-based metering with storage, a utility-scale for solar PV and wind power generation and a rapid technical assistance team for managing renewable energy projects [38]. The Government of Ghana aims at deploying about 30,000 solar home systems and
693
AIMS Energy Volume 4, Issue 5, 675-696.
2,000,000 solar lanterns by the end of 2020. In the meantime, Ghana’s energy commission has already issued permits and licenses for utility-scale solar power projects adding up to 1.84 GW power generation and a 20 MW solar project under construction by a permitted private company [38].
Against the backdrop, the following policy recommendations are proposed: There is the need for an enhanced foreign collaboration that facilitates access to clean energy
technologies and research while providing investment capital in energy infrastructure and its related technological advancement.
Efforts that promote local and foreign investment in renewable energy technologies should be encouraged through tax reductions and incentives.
Efforts should be aimed at improving energy efficiency through energy saving policies and strategies that increase awareness on energy saving options.
Efforts should be made towards supporting academic and research institutions on technological advancement in renewable energy options that can contribute to the country’s role in ensuring universal access to clean, affordable and reliable modern energy services towards achieving sustainable energy for all.
The Government should formulate policies that ensure conducive investment environment, encourage innovations and enhance scientific research as a way of providing job opportunities for the youth.
5. Conclusion
This study investigated the solar resource potential in Ghana and how this huge potential can be utilized as an alternative to the hydropower, to grow and modernize the Ghanaian economy in order to decrease the high prevalence of poverty. With the current load shedding in Ghana, it was essential to examine other renewable energy sources that can be added to the grid installed capacity to ease the burden on Ghanaians. Ghana has an exploited hydropower capacity of 1580 MW from Akosombo, Kpong and Bui dam which represents 67% of energy generation. It is estimated that the potential usable renewable energy resource for Ghana still untapped consist of 50–100 MW solar energy which requires an investment of US $100–150 million.
As part of the study, solar resource assessment and performance were evaluated at 8 locations in Ghana namely Salaga, Bawku, Bole, Bolgatanga, Navrongo, Tamale, Wa and Yendi. The study employed data from 1991–2010 using the Meteonorm 7 software to generate data in TMY2 format and validated the model using the RETScreen Clean Energy Project Analysis modeling designed by Natural Resources Canada. A summary of findings from the study is as follows: The maximum average daily insolation in Salaga, Bawku, Bole, Bolgatanga, Navrongo, Tamale,
Wa, and Yendi are 5.90 kWh·m−2·day−1, 6.76 kWh·m−2·day−1, 5.98 kWh·m−2·day−1, 6.85 kWh·m−2·day−1, 6.86 kWh·m−2·day−1, 5.94 kWh·m−2·day−1, 6.46 kWh·m−2·day−1 and 5.77 kWh·m−2·day−1 which occurs in February-March at a tilted characteristic surface βt = ϕ and γt = 0°.
The vertical wall facing west in all the 8 locations has the least average daily insolation and vertical wall facing east in all the 8 locations has the third highest average daily insolation which can be useful in housing design. For building design, windows can be mounted in the vertical walls facing west and east for cooling and heating in all-weather conditions in Ghana.
Salaga, Bawku, Bole, Bolgatanga, Navrongo, Tamale, Wa, and Yendi are endowed with beam normal insolation ranging from 0–9 kWh·m−2·day−1 which is a good resource for concentrating
694
AIMS Energy Volume 4, Issue 5, 675-696.
solar technologies and diffuse horizontal ranging from 1–4 kWh·m−2·day−1 which is a good resource for non-concentrating solar technologies.
East-West tracking is far more valuable for concentrating surfaces in Salaga, Bawku, Bole, Bolgatanga, Navrongo, Tamale, Wa and Yendi than North-South tracking.
The trend in the decline of solar resources between April and September in Salaga, Bawku, Bole, Bolgatanga, Navrongo, Tamale, Wa, and Yendi shows that there are problems with intermittent and seasonal variability of solar resources in the 8 locations in Ghana within these months. This means that, in order to fully harness and utilize these solar resources, there is the need of storage for concentrating surfaces and backup for non-concentrating surfaces.
The abundance of solar resources in Salaga, Bawku, Bole, Bolgatanga, Navrongo, Tamale, Wa and Yendi, shows that Ghana is endowed with solar energy potentials which are conducive for the installation and utilization of solar energy technologies and systems. Harnessing the renewable energy potential and incorporating it into existing energy portfolio of Ghana can help reduce, if not eradicate the frequent erratic power outages and load shedding that has become a burden to Ghanaians. Investing in this energy potential will drastically boost the productivity of businesses, industries, and the transport sector while making a significant contribution to the export earnings of the country.
The study proposes a future research on how to harness the solar energy potentials in Salaga, Bawku, Bole, Bolgatanga, Navrongo, Tamale, Wa and Yendi in order to serve as a benchmark for future investment in clean energy potentials in Ghana.
Acknowledgment
SAS expresses his sincere gratitude to Prof. Derek Baker. Department of Mechanical Engineering, Middle East Technical University, Ankara campus who provided the seed and earlier guidance for the solar resource assessment.
Conflict of interest
The authors declare no conflict of interest.
References
1. Asumadu-Sarkodie S, Sevinc C, Jayaweera HMPC (2016) A hybrid solar photovoltaic-Wind Turbine-Rankine cycle for electricity generation in Turkish Republic Of Northern Cyprus. Cogent Eng 3: 1180740.
2. Asumadu-Sarkodie S, Owusu PA (2016) Carbon dioxide emissions, GDP, energy use and population growth: a multivariate and causality analysis for Ghana, 1971–2013. Environ Sci
Pollut Res Int 23: 13508-13520. 3. Asumadu-Sarkodie S, Owusu PA (2016) Recent evidence of the relationship between carbon
dioxide emissions, energy use, GDP and population in Ghana: A Linear Regression Approach. Energy Sources, Part B: Economics, Planning, and Policy.
4. Asumadu-Sarkodie S, Owusu PA (2016) Multivariate co-integration analysis of the Kaya factors in Ghana. Environ Sci Pollut Res Int 23: 9934-9943.
5. Owusu P, Asumadu-Sarkodie S (2016) A review of renewable energy sources, sustainability issues and climate change mitigation. Cogent Engineering 3: 1167990.
695
AIMS Energy Volume 4, Issue 5, 675-696.
6. Asumadu-Sarkodie S, Owusu P (2016) A review of Ghana’s energy sector national energy statistics and policy framework. Cogent Eng 3: 1155274.
7. Owusu PA, Asumadu-Sarkodie S, Ameyo P (2016) A review of Ghana’s water resource management and the future prospect. Cogent Eng 3: 1164275.
8. Lipton M, Ravallion M (1993) Poverty and policy: World Bank Publications. 9. Asumadu-Sarkodie S, Owusu P (2016) The casual nexus between child mortality rate, fertility
rate, GDP, household final consumption expenditure, and food production index. Cogent Econ
Fin 4: 1191985. 10. UNDP (2016) Human Development Indicators. 11. Tang X, Liao H (2014) Energy poverty and solid fuels use in rural China: Analysis based on
national population census. Energy Sustain Dev 23: 122-129. 12. Asumadu-Sarkodie S, Owusu P (2016) Feasibility of biomass heating system in Middle East
Technical University, Northern Cyprus Campus. Cogent Eng 3: 1134304. 13. Johansson TB, McCormick K, Neij L, et al. (2004) The potentials of renewable energy: March. 14. Asif M, Muneer T (2007) Energy supply, its demand and security issues for developed and
emerging economies. Renew Sustain Energy Rev 11: 1388-1413. 15. Turkenburg WC, Beurskens J, Faaij A, et al. (2000) Renewable energy technologies. World
energy assessment: Energy challenge sustain: 219-272. 16. Energy Commission (2011) Ghana renewable energy bill. 17. PURC Ghana (2012) Ghana Energy Policy. 18. Deichmann U, Meisner C, Murray S, et al. (2011) The economics of renewable energy
expansion in rural Sub-Saharan Africa. Energy Policy 39: 215-227. 19. Globserver (2015) Ghana Energy Profile. 20. Reegle (2014) Energy Profile, Ghana. 21. Asumadu-Sarkodie S, Owusu PA (2016) The potential and economic viability of wind farms in
Ghana. Energ Source Part A 38: 695-701. 22. Asumadu-Sarkodie S, Owusu PA (2016) The potential and economic viability of solar
photovoltaic power in Ghana. Energy Source Part A 38: 709-716. 23. Gboney W (2009) Policy and regulatory framework for renewable energy and energy efficiency
development in Ghana. Climate Policy 9: 508-516. 24. Gaye A (2007) Access to energy and human development. Human development report 2008. 25. Asumadu-Sarkodie S, Owusu PA (2016) Forecasting Nigeria’s energy-use by 2030, an
econometric approach. Energy Source Part B: Economics, Planning, and Policy. 26. Asumadu-Sarkodie S, Owusu PA (2016) Energy use, carbon dioxide emissions, GDP,
industrialization, financial development and population, a causal nexus in Sri Lanka: with a subsequent Prediction of Energy Use Using Neural Network. Energy Source Part B: Economics,
Planning, and Policy. 27. Asumadu-Sarkodie S, Owusu PA (2016) Carbon dioxide emission, electricity consumption,
industrialization and economic growth nexus: The Beninese Case. Energy Source Part B:
Economics, Planning, and Policy. 28. Mohiuddin O, Asumadu-Sarkodie S, Obaidullah M (2016) The relationship between carbon
dioxide emissions, energy consumption, and GDP: a recent evidence from Pakistan. Cogent Eng 3: 1210491.
696
AIMS Energy Volume 4, Issue 5, 675-696.
29. Asumadu-Sarkodie S, Owusu PA (2016) The causal nexus between energy use, carbon dioxide emissions and macroeconomic variables in Ghana. Energy Source Part B: Economics, Planning,
and Policy. 30. Asumadu-Sarkodie S, Owusu PA (2016) The causal effect of carbon dioxide emissions,
electricity consumption, economic growth and industrialization in Sierra Leone. Energy Source
Part B: Economics, Planning, and Policy. 31. Asumadu-Sarkodie S, Owusu PA (2016) A multivariate analysis of carbon dioxide emissions,
electricity consumption, economic growth, financial development, industrialization and urbanization in Senegal. Energy Source Part B: Economics, Planning, and Policy.
32. Energy Commission G (2012) The SWERA Ghana Project. 33. Energy Commission (2011) Annual report for 2011. 34. Kemausuor F, Obeng GY, Brew-Hammond A, et al. (2011) A review of trends, policies and
plans for increasing energy access in Ghana. Renew Sustain Energy Rev 15: 5143-5154. 35. Dora C, Haines A, Balbus J, et al. (2015) Indicators linking health and sustainability in the
post-2015 development agenda. The Lancet 385: 380-391. 36. Commission CE (2001) A Guide to Photovoltaic (PV) System design and installation:
consultant report: California Energy Commission. 37. Gyamfi S, Modjinou M, Djordjevic S (2015) Improving electricity supply security in
Ghana-The potential of renewable energy. Renew Sustain Energy Rev 43: 1035-1045. 38. PV Magazine (2015) Solar to play key role in Ghana’s US $230 million renewable energy program. 39. Azuri (2015) 100,000 of Ghana’s off-grid households to benefit from pay-as-you-go solar power. 40. Obeng GY, Evers HD (2009) Solar PV rural electrification and energy-poverty: a review and
conceptual framework with reference to Ghana. 41. Samuel AS, Phebe Asantewaa O (2016) Solar PV installations in Ghana. 42. Energy Commission (2009) Renewable energy policy framework for climate change mitigation
in Ghana. 43. Solar SG (2015) Global horizontal irradiation (GHI), Ghana. 44. Duffie JA, Beckman WA (1980) Solar engineering of thermal processes: Wiley New York etc. 45. Baker DK, Özalevli CC, Sömek SK (2015) Technical study of a hybrid solar–geothermal power
plant and its application to a thermal design course. Prog Clean Energy 2: 887-910. 46. World Portlio (2012) Ghana. 47. RECIPES (2006) RET.
© 2016 Samuel Asumadu-Sarkodie et al., licensee AIMS Press. This is an open access article distributed under the terms of the Creative Commons Attribution License (http://creativecommons.org/licenses/by/4.0)


![Energy Metabolism and Allocation in Selfish Immune System ... · Energy metabolism (EM) is the main driver of life [1] [2] [3]. One of the primary aims of human energy metabolism](https://img.pdfslide.net/doc/110x75/5f02fcb27e708231d406fb7c/energy-metabolism-and-allocation-in-selfish-immune-system-energy-metabolism.jpg)