Embed Size (px)
Citation preview
A review of international policies, approaches and action to address obesity

2 | Public Health WalesA review of international policies, approaches and action to address obesity.
AcknowledgementsJo Peden, Consultant in Public Health - Author and Dr Julie Bishop, Director of Health Improvement, Dr Nike Arowobusoye, Consultant in Public Health, Natalie Munaiwa, for their contributions.
Additional information on the case studies can be found in the International case studies supplement: policies, approaches and action to address obesity.
November 2018
© 2018 Public Health Wales NHS Trust.Material contained in this document may be reproduced under the terms of the Open Government Licence (OGL)www.nationalarchives.gov.uk/doc/open-government-licence/version/3/provided it is done so accurately and is not used in a misleading context.Acknowledgement to Public Health Wales NHS Trust to be stated.Copyright in the typographical arrangement, design and layout belongs to Public Health Wales NHS Trust
3 | Public Health WalesA review of international policies, approaches and action to address obesity.
1
2
3
4
5
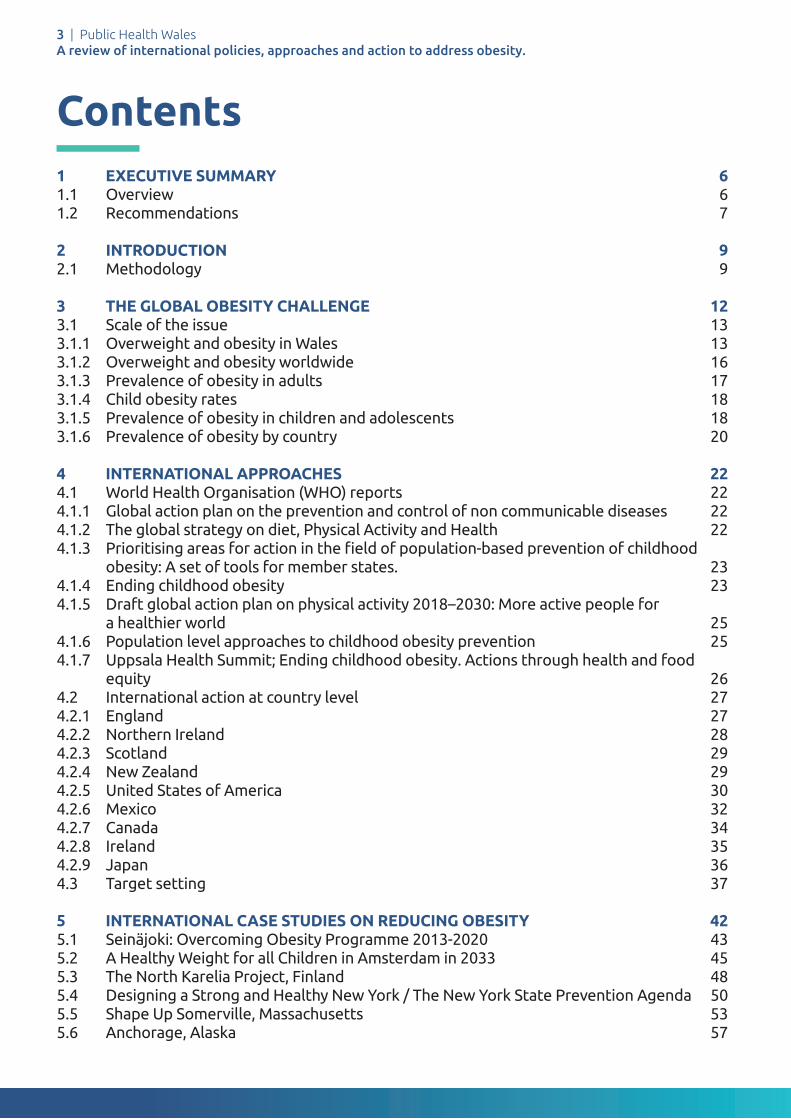
EXECUTIVE SUMMARY 61.1 Overview 61.2 Recommendations 7
INTRODUCTION 92.1 Methodology 9
THE GLOBAL OBESITY CHALLENGE 123.1 Scale of the issue 133.1.1 Overweight and obesity in Wales 133.1.2 Overweight and obesity worldwide 163.1.3 Prevalence of obesity in adults 173.1.4 Child obesity rates 183.1.5 Prevalence of obesity in children and adolescents 183.1.6 Prevalence of obesity by country 20
INTERNATIONAL APPROACHES 224.1 World Health Organisation (WHO) reports 224.1.1 Global action plan on the prevention and control of non communicable diseases 224.1.2 The global strategy on diet, Physical Activity and Health 224.1.3 Prioritising areas for action in the fi eld of population-based prevention of childhood
obesity: A set of tools for member states. 234.1.4 Ending childhood obesity 234.1.5 Draft global action plan on physical activity 2018–2030: More active people for
a healthier world 254.1.6 Population level approaches to childhood obesity prevention 254.1.7 Uppsala Health Summit; Ending childhood obesity. Actions through health and food equity 264.2 International action at country level 274.2.1 England 274.2.2 Northern Ireland 284.2.3 Scotland 294.2.4 New Zealand 294.2.5 United States of America 304.2.6 Mexico 324.2.7 Canada 344.2.8 Ireland 354.2.9 Japan 364.3 Target setting 37
INTERNATIONAL CASE STUDIES ON REDUCING OBESITY 425.1 Seinäjoki: Overcoming Obesity Programme 2013-2020 435.2 A Healthy Weight for all Children in Amsterdam in 2033 455.3 The North Karelia Project, Finland 485.4 Designing a Strong and Healthy New York / The New York State Prevention Agenda 505.5 Shape Up Somerville, Massachusetts 535.6 Anchorage, Alaska 57
Contents

4 | Public Health WalesA review of international policies, approaches and action to address obesity.
Table of fi guresFigure 1: Adults reporting to be overweight or obese by age and sex, percentage, persons aged 16+, Wales 2016/17 14
Figure 2: Percentage of children aged 4 to 5 years who are underweight, healthy weight, overweight or obese 2013/13-2016/17 in Wales 16
Figure 3: Obesity, age standardised prevalence, males and females aged 20+, UK and selected countries, 1980/2015 17
Figure 4: Overweight including obesity among adults, 2015 (or nearest year), OECD 18
Figure 5: International overweight and obesity prevalence aged 2-19 years by OECD country 19
Figure 6: Overweight, age standardised prevalence, boys and girls aged under 20, UK and selected countries, 1980-2015 20
Figure 7: Recommendations from Ending Childhood Obesity 23
Figure 8: Components of a step based population level approach to childhood obesity prevention) 26
Figure 9: Structure of the A Fitter Future for All Framework, Northern Ireland 28
Figure 10: CDC Framework for Preventing Obesity (adapted from IOM 2005) 31
Figure 11: Summary of Mexican government approach 34
Figure 12: Population-Based Approaches to Childhood Obesity Prevention 61
List of TablesTable 1: Overweight and Obesity in Adults in Wales by Age and Sex (National Survey for Wales, 2017-18) 14
Table 2: International Comparison of Targets or Goals to Reduce Obesity 38
CONCLUSION 60
REFERENCES 63
6
7

5 | Public Health WalesA review of international policies, approaches and action to address obesity.
Executive Summary1

6 | Public Health WalesA review of international policies, approaches and action to address obesity. 1Executive summary
This report reviews the policy approaches taken internationally in relation to reducing the prevalence of obesity.
1.1 OverviewThis report aims:
• To review international rates of obesity in countries comparable to Wales• To complete a rapid review of the international policies on obesity in countries that are of
similar development and prevalence of obesity to Wales • To review the actions and approaches taken by any countries/ regions who have succesfully reduced obesity • To make recommendations to inform the development of the Welsh obesity strategy
This research study used a rapid review methodology and was primarily looking at government strategy and innovative successful interventions and so a methodological assessment of the studies was not included.
Obesity is a challenge to governments across the world. Rates of obesity in both children and adults are rising rapidly and this is having severe consequences on life expectancy, morbidity and spiralling healthcare costs. The causes of rising obesity rates are multi-factorial and therefore the solutions to reducing obesity are complex (McKinsey, 2014).
A key fi nding of this report is that there is no country internationally which has been successful in lowering obesity rates at a national level and this has been illustrated previously in data from the Global Burden of Disease Study (Ng et al 2013).
There are however examples of regions or cities which have lowered childhood obesity rates. The actions taken by these areas have been highlighted in this report. The challenge will be to emulate these actions at scale. In many cases the reductions in prevalence of obesity have been relatively minor, however if achieved at a national scale they have the potential to have a signifi cant impact. In the majority of these cases studies the results have not been published in the peer reviewed literature. They do however; provide an insight into innovative ways to potentially reduce childhood obesity.
It is interesting to note that national obesity strategies have begun to move away from very specifi c targets (included in earlier obesity strategies). There are several reasons for this, the foremost being that the targets were not achieved.
It is also diffi cult to predict the level of target to set which is realistic.

7 | Public Health WalesA review of international policies, approaches and action to address obesity.
1.2 RecommendationsBased on the findings of this rapid review, it is recommended that the obesity strategy:
• is multifaceted and considers incorporating the areas for action outlined above• emphasises a system leadership approach to delivery• targets all aspects of society including engagement with the community• takes a life course approach considering the best intervention points along the life course• considers the possibility of designing a population based community level intervention at
a national scale based on the model of North Karelia with an enhanced focus on dietary change and increasing physical activity
• takes innovative steps to design new interventions and ensure they are well evaluated in order to contribute to the evidence base
1The case studies which successfully reduced obesity had thefollowing in common. They:
• included multi-level action across different sectors including community, schools and early year settings, industry and government city departments• involved strong leadership, often from a key figure such as a mayor, who shared a vision• involved ownership and community participation and mobilised existing structures within the communities• influenced individual and environmental factors• took a long term approach with realistic targets and goals• were flexible enough to evolve as they were delivered and vary target groups or geographical areas• had strong communication/ marketing elements

8 | Public Health WalesA review of international policies, approaches and action to address obesity.
Introduction2

9 | Public Health WalesA comparison of international obesity rates, policies and innovative action to reduce obesity 2Introduction
This report reviews the policy approaches taken by other countries in relation to reducing the prevalence of obesity. The aims of the review were:
• To review international rates of obesity in countries comparable to Wales• To complete a rapid review on the international policies on obesity in countries of similar
development and prevalence of obesity to Wales • To review the actions and approaches taken by any countries/ regions who have successfully
reduced obesity • To make recommendations to inform the development of the Welsh obesity strategy
2.1 MethodologyThis review used rapid review methodology (Haby et al, 2016).The search strategy was comprehensive, including published and grey literature written in English. Two databases were searched and numerous websites reviewed for strategy documents. Data extraction was done by one reviewer. The review was primarily looking at government strategy and successful innovative interventions and so a methodological assessment of the studies was not included.

11 | Public Health WalesA review of international policies, approaches and action to address obesity.
3The global challenge
of rising obesity rates

12 | Public Health WalesA review of international policies, approaches and action to address obesity.
The global obesity challenge
Obesity is a challenge to governments across the world. Obesity is a challenge to governments across the world. Rates of obesity in both children and adults are rising rapidly and this is having severe consequences on life expectancy, morbidity and causing spiralling healthcare costs.
As this report will illustrate, the causes of rising obesity rates are multi-factorial and therefore the solutions to reducing obesity are complex (McKinsey, 2014). However, obesity is not inevitable, but is largely preventable through lifestyle changes (WHO, 2000). Obesity is not just an individual level problem. It is also a population level problem and should be tackled as such. Eff ective prevention and management of obesity will require an integrated approach, involving actions in all sectors of society (WHO 2000).
This report illustrates the need for a multi-level, broad approach, involving all sectors of society: government, employers, research, schools, industry and retailers, healthcare, communities and individuals. WHO have urged the need for ‘strategic leadership’ to create supportive environments (ecological, societal, economic and health) that are conducive to behaviour change (WHO, 1986).
A key fi nding of this review is that there is no country in the world which has been successful in lowering obesity rates at a national level. This has been illustrated in the Global Burden of Disease Study (Ng et al 2013). There are however examples of regions or cities which have lowered childhood obesity rates. The actions taken by these areas are highlighted in this report. The challenge will be to emulate these actions at scale.
In many cases the reductions in prevalence of obesity have been relatively minor, however if achieved at a national scale they have the potential to have a signifi cant impact. The results of most of these case studies have not been published in the peer reviewed literature. They do however, provide an insight into innovative ways to potentially reduce childhood obesity.
Obesity and overweight are associated with an increased risk of several chronic diseases and premature death. In particular, the incidence of type 2 diabetes, cardiovascular disease, hypertension and stroke, muscular skeletal problems, such as osteoarthritis, and many forms of cancer increase with overweight and obesity (WHO 2006, Chan et al 2010 , Brown et al, 2009, Guh et al, 2009).
Recent epidemiological trends in obesity indicate that the primary cause of the global obesity problem lies in environmental and behavioural changes. The rapid increase in obesity rates has occurred in too short a time for there to have been signifi cant genetic changes within populations (WHO 2000).
The fundamental cause of overweight and obesity is an energy imbalance between calories consumed and calories expended. Global increases in overweight and obesity are attributable to a number of factors including:
• a global shift towards increased intake of energy-dense foods that are high in fat and sugars (including the high consumption of sugary drinks),but low in vitamins, minerals and other healthy micronutrients; (Chan et al 2010)
3

13 | Public Health WalesA review of international policies, approaches and action to address obesity.
• changes in the global food system; moving from individual to mass preparation, and production of more highly processed food (adding sugar, fats, salt and flavour enhancers), and marketed them with increasingly effective techniques (Muller-Riemenschneider et al, 2008).
• a trend towards decreased physical activity levels due to the increasingly sedentary nature of many forms of recreation time, changing modes of transportation, and increasing urbanisation (WHO, 2016, WHO, 2000).
Obesity in childhood arises from a combination of exposure of the child to an unhealthy environment (often called the obesogenic environment) and inadequate behavioural and biological responses to that environment. These responses vary among individuals and are strongly influenced by developmental or life-course factors. Children are exposed to ultra-processed, energy-dense, nutrient-poor foods, which are cheap and readily available. Opportunities for physical activity, both in and out of school, have been reduced and more time is spent on screen based and sedentary leisure activities. Critically, childhood obesity is a strong predictor of adult obesity, which has well known health and economic consequences, both for the individual and society as a whole (WHO, 2016).
Obesity affects all age groups and therefore prevention is needed across the life course. However, the effective prevention of adult obesity will require the prevention and management of childhood obesity.
3.1 Scale of the issueThere are a range of data sources for global obesity rates. In the majority of data sources where international comparisons are made, data from the United Kingdom is used rather than Wales. In the main, international estimates of overweight and obesity prevalence are based on national surveys of measured height and weight among children at various ages. Caution is needed when comparing overweight and obesity rates across countries as estimates of national prevalence vary in their timing and frequency, the method used to classify Body Mass Index (BMI) into categories such as overweight or obese, and the age of the children included (PHE, 2016). Adult obesity is defined consistently across Scotland, England, Wales and Northern Ireland using the BMI scale. However, height and weight measurements are self-reported in the National Survey of Wales/Welsh Health Survey and are therefore not directly comparable with equivalent statistics in Scotland, England and Northern Ireland, where direct measurements are taken. (House of Commons, 2017).
3.1.1 Overweight and obesity in WalesWales experiences a significant and growing prevalence of overweight and obesity in both adults and children. Information on levels of overweight and obesity in Wales is available from the National Survey of Wales for adults 16+ years of age based on self- reported height and weight. Information on overweight and obesity in children aged 4 – 5 years is available from the Child Measurement Programme Wales. This information is drawn from direct measurements of children starting school in Wales.
The most recent information from the National Survey for Wales indicates that 60% of adults are overweight or obese and 22% are obese (Table 1).
3

14 | Public Health WalesA review of international policies, approaches and action to address obesity.
TABLE 1: Overweight and Obesity in Adults in Wales by Age and Sex (National Survey for Wales, 2017-18)
Per cent Overweight or Obese Obese
All aged 16+ 60 22
Men 66 22
Women 54 23
By Age:
16 – 44 years 52 18
45 – 64 years 69 27
65+ years 63 23
Source: Welsh Government. National Survey for Wales. https://gov.wales/docs/statistics/2018/180627-national-survey-2017-18-population-health-lifestyle-en.pdf [Online]
Rates of overweight and obesity are higher in men than women in all age groups and this diff erence is statistically signifi cant in all but the youngest and oldest age groups (16 – 24 years and 75+ years). Prevalence of overweight and obesity rises with increasing age in both men and women until the age of 65 – 74 years when it begins to decline in women, and 55-64 years when it begins to decline in men (Figure 1).
FIGURE 1: Adults reporting to be overweight or obese by age and sex, percentage, persons aged 16+, Wales 2016/17
The most recent information from the Child Measurement Programme for Wales illustrates that 14.7% of children are overweight and 12.4% are obese (Figure 2).
Public Health Wales A review of international policies, approaches and action to address obesity
Date: November 18 Version: 1.0 Page: 6 of 67
Table 1: Overweight and Obesity in Adults in Wales by Age and Sex (National Survey for Wales, 2017-18)
Per cent Overweight or Obese Obese
All aged 16+ 60 22Men 66 22Women 54 23By Age:16 – 44 years 52 1845 – 64 years 69 2765+ years 63 23
Source: Welsh Government. National Survey for Wales. https://gov.wales/docs/statistics/2018/180627-national-survey-2017-18-population-health-lifestyle-en.pdf [Online]
Rates of overweight and obesity are higher in men than women in all age groups and this difference is statistically significant in all but the youngest and oldest age groups (16 – 24 years and 75+ years). Prevalence of overweight and obesity rises with increasing age in both men and women until the age of 65 – 74 years when it begins to decline in women, and 55-64 years when it begins to decline in men (Figure ).
Figure 1: Adults reporting to be overweight or obese by age and sex, percentage, persons aged 16+, Wales 2016/17
3

16 | Public Health WalesA review of international policies, approaches and action to address obesity.
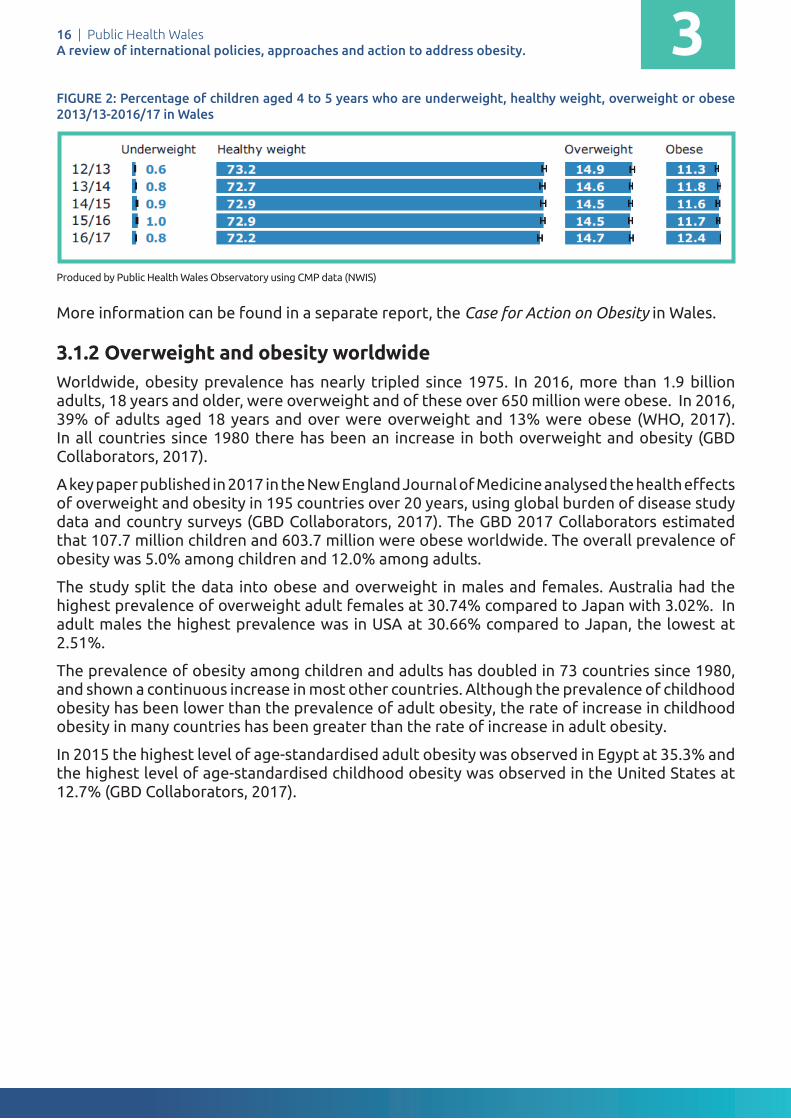
FIGURE 2: Percentage of children aged 4 to 5 years who are underweight, healthy weight, overweight or obese 2013/13-2016/17 in Wales
Produced by Public Health Wales Observatory using CMP data (NWIS)
More information can be found in a separate report, the Case for Action on Obesity in Wales.
3.1.2 Overweight and obesity worldwideWorldwide, obesity prevalence has nearly tripled since 1975. In 2016, more than 1.9 billion adults, 18 years and older, were overweight and of these over 650 million were obese. In 2016, 39% of adults aged 18 years and over were overweight and 13% were obese (WHO, 2017). In all countries since 1980 there has been an increase in both overweight and obesity (GBD Collaborators, 2017).
A key paper published in 2017 in the New England Journal of Medicine analysed the health effects of overweight and obesity in 195 countries over 20 years, using global burden of disease study data and country surveys (GBD Collaborators, 2017). The GBD 2017 Collaborators estimated that 107.7 million children and 603.7 million were obese worldwide. The overall prevalence of obesity was 5.0% among children and 12.0% among adults.
The study split the data into obese and overweight in males and females. Australia had the highest prevalence of overweight adult females at 30.74% compared to Japan with 3.02%. In adult males the highest prevalence was in USA at 30.66% compared to Japan, the lowest at 2.51%.
The prevalence of obesity among children and adults has doubled in 73 countries since 1980, and shown a continuous increase in most other countries. Although the prevalence of childhood obesity has been lower than the prevalence of adult obesity, the rate of increase in childhood obesity in many countries has been greater than the rate of increase in adult obesity.
In 2015 the highest level of age-standardised adult obesity was observed in Egypt at 35.3% and the highest level of age-standardised childhood obesity was observed in the United States at 12.7% (GBD Collaborators, 2017).
Public Health Wales A review of international policies, approaches and action to address obesity
Date: November 18 Version: 1.0 Page: 7 of 67
The most recent information from the Child Measurement Programme for Wales illustrates that 14.7% of children are overweight and 12.4% are obese (Figure 2).
Figure 2: Percentage of children aged 4 to 5 years who are underweight, healthy weight, overweight or obese 2013/13-2016/17 in Wales
More information can be found in a separate report, the Case for Action on Obesity in Wales.
3.1.2 Overweight and Obesity Worldwide
Worldwide, obesity prevalence has nearly tripled since 1975. In 2016, more than 1.9 billion adults, 18 years and older, were overweight and of these over 650 million were obese. In 2016, 39% of adults aged 18 years and over were overweight and 13% were obese (WHO, 2017). In all countries since 1980 there has been an increase in both overweight and obesity (GBD Collaborators, 2017).
A key paper published in 2017 in the New England Journal of Medicine analysed the health effects of overweight and obesity in 195 countries over 20 years, using global burden of disease study data and country surveys (GBD Collaborators, 2017). The GBD 2017 Collaborators estimated that 107.7 million children and 603.7 million were obese worldwide. The overall prevalence of obesity was 5.0% among children and 12.0% among adults.
The study split the data into obese and overweight in males and females. Australia had the highest prevalence of overweight adult females at 30.74% compared to Japan with 3.02%. In adult males the highest prevalence was in USA at 30.66% compared to Japan, the lowest at 2.51%.
The prevalence of obesity among children and adults has doubled in 73 countries since 1980, and shown a continuous increase in most other countries. Although the prevalence of childhood obesity has been lower than the prevalence of adult obesity, the rate of increase in childhood obesity in many countries has been greater than the rate of increase in adult obesity.
In 2015 the highest level of age-standardised adult obesity was observed in Egypt at 35.3% and the highest level of age-standardised childhood
3

17 | Public Health WalesA review of international policies, approaches and action to address obesity.
FIGURE 3: Obesity, age standardised prevalence, males and females aged 20+, UK and selected countries, 1980/2015
Source: GBD Collaborators, 2017
The study from The GBD 2017 Obesity Collaborators did not break down the data lower than the UK level. Although not directly comparable, as it is a diff erent data set, the Welsh Health Survey for 2015 showed the rates of obesity for Wales as 24% of women being obese and 23% of men. This is self-reported data and is likely to be an underestimate. This prevalence of obesity for men, puts Wales on a par with Mexico but lower than USA, Australia and New Zealand. The obesity prevalence for women in Wales is lower than USA, Mexico, Australia, New Zealand and Finland.
3.1.3 Prevalence of obesity in adultsThe Organisation for Economic Cooperation and Development (OECD) provides timely data comparing international obesity rates in OECD countries. The most recent report concluded that adult obesity rates are highest in United States, Mexico, New Zealand and lowest in Japan and Korea. Social inequalities in overweight and obesity prevalence are strong, especially among women.
In half of the eight countries for which data are available, less educated women are two to three times more likely to be overweight than those with a higher education.
Public Health Wales A review of international policies, approaches and action to address obesity
Date: November 18 Version: 1.0 Page: 8 of 67
obesity was observed in the United States at 12.7% (GBD Collaborators, 2017).
Figure 3: Obesity, age standardised prevalence, males and females aged 20+, UK and selected countries, 1980/2015
Source: GBD Collaborators, 2017
The study from The GBD 2017 Obesity Collaborators did not break down the data lower than the UK level. Although not directly comparable, as it is a different data set, the Welsh Health Survey for 2015 showed the rates of obesity for Wales as 24% of women being obese and 23% of men. This is self-reported data and is likely to be an underestimate. This prevalence of obesity for men, puts Wales on a par with Mexico but lower than USA, Australia and New Zealand. The obesity prevalence for women in Wales is lower than USA, Mexico, Australia, New Zealand and Finland.
3.1.3 Prevalence of Obesity in Adults
The Organisation for Economic Cooperation and Development (OECD)provides timely data comparing international obesity rates in OECD countries. The most recent report concluded that adult obesity rates are highest in United States, Mexico, New Zealand and lowest in Japan and Korea. Social inequalities in overweight and obesity prevalence are strong, especially among women.
In half of the eight countries for which data are available, less educated women are two to three times more likely to be overweight than those with a higher education.
60 50 40 30 20 10 0 10 20 30 40 50 60
Mexico
UK
Netherlands
Finland
Japan
USA
Canada
NZ
Australia
Females- 1980 Females - 2015 Males- 1980 Males- 2015
*Please note this axis scale is larger than the children obesity and overweight charts.
3

18 | Public Health WalesA review of international policies, approaches and action to address obesity.
FIGURE 4: Overweight including obesity among adults, 2015 (or nearest year), Organisation for Economic Cooperation and Development (OECD)
Data source: https://www.oecd.org/unitedkingdom/Health-at-a-Glance-2017-Key-Findings-UNITED-KINGDOM.pdf
The United Kingdom has the sixth highest rate of obesity and overweight, compared to other OECD countries. Total overweight (BMI≥25) ranges from 24% in Japan and 33% in Korea to just over 70% in Mexico and the United States. Obesity (BMI≥30) is lowest in Italy, Japan and Korea (under 10%), and highest in Hungary, Mexico, New Zealand and the United States (30% or over). In most countries, pre-obesity (25≤BMI<30) accounts for the largest share of overweight people (OECD, 2017).
3.1.4 Child obesity rates Source: https://www.oecd.org/unitedkingdom/Health-at-a-Glance-2017-Key-Findings-
3.1.5 Prevalence of obesity in children and adolescentsThe most recent data from the World Health Organisation (WHO) highlight that worldwide, in 2016, 41 million children under the age of 5 were overweight or obese in 2016 and over 340 million children and adolescents aged 5-19 were overweight or obese (WHO, 2018).
The prevalence of overweight and obesity among children and adolescents aged 5-19 has risen dramatically from just 4% in 1975 to just over 18% in 2016. The rise has occurred similarly among both boys and girls: in 2016 18% of girls and 19% of boys were overweight (WHO, 2018).
While just under 1% of children and adolescents aged 5-19 were obese in 1975, more 124 million children and adolescents (6% of girls and 8% of boys) were obese in 2016 (WHO, 2018).
In 2013, the UK ranked 9th for overweight prevalence (including obesity) in children (aged 2 to 19 years) out of the 34 Organisation for Economic Cooperation and Development (OECD) countries when International Obesity Task Force (IOTF) body mass index (BMI) thresholds are applied.
Public Health Wales A review of international policies, approaches and action to address obesity
Date: November 18 Version: 1.0 Page: 9 of 67
Figure 4: Overweight including obesity among adults, 2015 (or nearest year), Organisation for Economic Cooperation and Development (OECD)
Data source: https://www.oecd.org/unitedkingdom/Health-at-a-Glance-2017-Key-Findings-UNITED-KINGDOM.pdf
The United Kingdom has the sixth highest rate of obesity and overweight, compared to other OECD countries. Total overweight (BMI≥25) ranges from 24% in Japan and 33% in Korea to just over 70% in Mexico and the United States. Obesity (BMI≥30) is lowest in Italy, Japan and Korea (under 10%), and highest in Hungary, Mexico, New Zealand and the United States (30% or over). In most countries, pre-obesity (25≤BMI<30) accounts for the largest share of overweight people (OECD, 2017).
3.1.4 Child obesity rates
Source: https://www.oecd.org/unitedkingdom/Health-at-a-Glance-2017-Key-Findings-
3.1.5 Prevalence of Obesity in Children and Adolescents
The most recent data from the World Health Organisation (WHO) highlight that worldwide, in 2016, 41 million children under the age of 5 were overweight or obese in 2016 and over 340 million children and adolescents aged 5-19 were overweight or obese (WHO, 2018).
The prevalence of overweight and obesity among children and adolescents aged 5-19 has risen dramatically from just 4% in 1975 to just over 18% in 2016. The rise has occurred similarly among both boys and girls: in 2016 18% of girls and 19% of boys were overweight (WHO, 2018).
3

19 | Public Health WalesA review of international policies, approaches and action to address obesity.
FIGURE 5: International overweight and obesity prevalence aged 2-19 years by OECD country
Data source: The Lancet, Systematic analysis for the Global Burden of Disease Study 2013
3
Chille
Greece
United States
New Zealand
Mexico
Israel
Slovenia
Portugal
United Kingdom
Hungary
Italy
Ireland
Spain
Iceland
Canada
Australia
Finland
Luxembourg
Estonia
Czech Republic
Turkey
Germany
Poland
Sweden
Belgium
Denmark
Switserland
Norway
France
Austria
Netherlands
South Korea
Slovak Republic
Japan
Girls - Obese Boys - ObeseBoys - OverweightGirls - Overweight
45% 45%35%25%15%5%5%15%25%35%
31.6%
29.1%
29.7%
28.7%
29.3%
26.6%
24.0%
27.1%
29.2%
24.9%
24.3%
26.5%
23.8%
23.0%
22.0%
23.0%
21.1%
17.7%
21.4%
18.0%
19.8%
19.4%
17.8%
19.3%
18.8%
19.4%
16.2%
16.0%
16.0%
16.3%
16.1%
13.2%
13.5%
12.4%
37.0%
33.7%
28.8%
29.6%
28.4%
31.0%
33.1%
28.7%
26.1%
30.2%
29.9%
26.6%
27.6%
26.4%
25.5%
24.4%
26.0%
29.3%
24.0%
22.3%
20.4%
20.5%
21.9%
20.4%
20.5%
19.7%
20.7%
20.1%
19.9%
18.9%
18.3%
21.2%
20.6%
15.3%

20 | Public Health WalesA review of international policies, approaches and action to address obesity.
3.1.6 Prevalence of obesity by countryThe increase of overweight and obese children has been dramatic across all countries. Finland had the highest percentage of overweight males at 20.61% and UK had highest percent of females at 19.95%. The lowest rates were in Japan at 10.97% males and 10.78% females being overweight and only 3.22% males and 2.46% females were obese.
FIGURE 6: Overweight, age standardised prevalence, boys and girls aged under 20, UK and selected countries, 1980-201
Source: GBD Collaborators, 2017
United States of AmericaThe Study from the GBD 2015 Obesity Collaborators shows the highest percentage is in USA with 12.99% of male children categorised as obese and 12.4% of female children.
Overall childhood obesity rates remain higher than they were a generation ago, the rise in rates has slowed in recent years and some places are starting to see their rates decline. Thirty seven states reported a decrease in obesity in children aged 2-4 enrolled in Welfare programmes with the highest decline of 4.7% in New Mexico from 2010 to 2014 (State of Obesity, 2018).
Public Health Wales A review of international policies, approaches and action to address obesity
Date: November 18 Version: 1.0 Page: 11 of 67
20.61% and UK had highest percent of females at 19.95%. The lowest rates were in Japan at 10.97% males and 10.78% females being overweight and only 3.22% males and 2.46% females were obese.
Figure 6: Overweight, age standardised prevalence, boys and girls aged under 20, UK and selected countries, 1980-2015
Source: The GBD 2015 Obesity Collaborators
United States of America
The Study from the GBD 2015 Obesity Collaborators shows the highest percentage is in USA with 12.99% of male children categorised as obese and 12.4% of female children.
Overall childhood obesity rates remain higher than they were a generation ago, the rise in rates has slowed in recent years and some places are starting to see their rates decline. Thirty seven states reported a decrease in obesity in children aged 2-4 enrolled in Welfare programmes with the highest decline of 4.7% in New Mexico from 2010 to 2014 (State of Obesity, 2018).
25 15 5 5 15 25
Mexico
UK
Netherlands
Finland
Japan
USA
Canada
NZ
Australia
Girls- 1980 Girls - 2015 Boys- 1980 Boys- 2015
*Please note this axis scale is smaller than the adult obesity and overweight charts.
3

21 | Public Health WalesA review of international policies, approaches and action to address obesity.
International Approaches4

22 | Public Health WalesA review of international policies, approaches and action to address obesity. 4International approachesThis section of the report will summarise key strategic documents from WHO and internationally which provide guidance and evidence relating to reducing obesity. The documents vary and range from plans of action to tools and recommendations. Some approaches specifi cally address issues of diet, nutrition and physical activity as related to obesity and others look at it as part of addressing non communicable diseases.
4.1 World Health Organisation (WHO) reports
4.1.1 Global action plan on the prevention and control of non communicable diseases (NCD)The Global Action Plan on the Prevention and Control of NCDs was published in 2013 and set out a vision of a ‘world free of the avoidable burden of non-communicable diseases’. It outlined its main goal as to reduce the preventable and avoidable burden of morbidity, mortality and disability due to non-communicable diseases, by means of multi-sectoral collaboration and cooperation at national, regional and global levels, so that populations reach the highest attainable standards of health and productivity at every age and those diseases are no longer a barrier to well-being or socioeconomic development. The Global Action Plan on the Prevention and Control of NCDs set nine global voluntary targets, which include a 25% reduction of premature mortality from NCDs and a 10% relative reduction in the prevalence of insuffi cient physical activity by 2025. Halting the rise in diabetes and obesity globally is one of them. The plan has nine over- arching principles:
• Life-course approach• Empowerment of people and communities• Evidence-based strategies• Universal health coverage• Management of real, perceived or potential confl icts of interest• Human rights approach• Equity-based approach• National action and international cooperation and solidarity• Multi-sectoral action
4.1.2 The global strategy on diet, physical activity and healthThe Global Strategy on Diet, Physical Activity and Health was developed by the WHO in 2004 to address the increasing prevalence and burden of NCDs.
The four main objectives were:
• To encourage the implementation of public health action and preventative intervention to reduce the risk factors which result from unhealthy diet and physical inactivity
• To increase recognition of the implications of unhealthy diet and inadequate physical activity levels and knowledge of preventative measures
• To promote policies and action plans at all levels to address diet and physical activity behaviours
• To encourage monitoring, evaluation and further research

23 | Public Health WalesA review of international policies, approaches and action to address obesity.
The strategy called for priority to be given to the socially, economically and politically disadvantaged, and for the unhealthy diet and physical activity behaviours of, in particular, children and adolescents to be addressed.
4.1.3 Prioritising areas for action in the fi eld of population-based prevention of childhood obesity: A set of tools for member states.Prioritising areas for action in the fi eld of population-based prevention of childhood obesity; A set of tools for members states aims to provide a set of tools for member states to determine and identify priority areas for action in the fi eld of population-based prevention of childhood obesity. The information provided is to guide stakeholders in conducting a systematic, evidence-informed approach to identifying priority areas for action.
4.1.4 Ending childhood obesity Ending Childhood Obesity presented a comprehensive, integrated package of recommendations to guide countries to address childhood obesity. The recommendations call for all countries to remedy the obesogenic environments, take a life course approach in promoting obesity prevention and improve the treatment of children who are already obese (WHO, 2016). The recommendations were categorised into six areas with specifi c recommended actions in each area. Figure 7 illustrates the 6 areas.
FIGURE 7: Recommendations from Ending Childhood Obesity
Source: https://www.who.int/end-childhood-obesity/publications/echo-report/en/
4
Public Health Wales A review of international policies, approaches and action to address obesity
Date: November 18 Version: 1.0 Page: 14 of 67
Figure 7 Recommendations from Ending Childhood Obesity
Source: https://www.who.int/end-childhood-obesity/publications/echo-report/en/
4.1.5 Draft global action plan on physical activity 2018–2030: More active people for a healthier world
WHO is in the process of developing a global action plan on physical activity, which includes the vision to have ‘more active people for a healthier world. The mission is to ensure that all people have access to safe and enabling environments and to diverse opportunities to be physically active in their


25 | Public Health WalesA review of international policies, approaches and action to address obesity.
4.1.5 Draft global action plan on physical activity 2018–2030: More active people for a healthier worldWHO is in the process of developing a global action plan on physical activity, which includes the vision to have ‘more active people for a healthier world. The mission is to ensure that all people have access to safe and enabling environments and to diverse opportunities to be physically active in their daily lives, as a means of improving individual and community health and contributing to the social, cultural and economic development of all nations. The target for this global action plan is a 15% relative reduction, using a 2016 baseline, in the global prevalence of physical inactivity in adults and in adolescents by 2030. This action plan has four strategic areas:
› Create and active societyCreate a paradigm shift in all of society by enhancing knowledge and understanding of, and appreciation for, the multiple benefits of regular physical activity, according to ability and at all ages.
› Create active environmentsCreate and maintain environments that promote and safeguard the rights of all people, of all ages, to have equitable access to safe places and spaces, in their cities and communities, in which to engage in regular physical activity, according to ability.
› Create active peopleIncrease provision and access to opportunities and programmes that support people of all ages, abilities and diverse identities in multiple settings, to be physically active in their community through walking, cycling, active recreation, sports, dance and play.
› Create active systemsDeliver the leadership and systems that provide the necessary governance, coordination and joint action at national and sub-national levels; the data systems for surveillance, monitoring and accountability; the research and development to build capacity, and leadership to mobilise resources and implement actions to increase participation in walk, cycle, active recreation, sports, dance and play.
4.1.6 Population level approaches to childhood obesity preventionPopulation Level approaches to Childhood Obesity Prevention outlines guiding principles for the development of a population-based childhood obesity prevention strategy. It is clear that actions to prevent childhood obesity need to be taken in multiple settings and at all levels of government. They also need to incorporate a variety of approaches and involve a wide range of stakeholders. Moreover, childhood obesity prevention efforts need to be tightly integrated with other efforts to control the major non-communicable disease risk factors. Policies for obesity prevention need to be inclusive and improve equity, with interventions tailored to suit local contexts. They also need to be carried out in a transparent and sustainable way. Surveillance, monitoring and evaluation are also critical to support effective action. The prioritisation of policy actions needs to be explicit, with defined processes for selecting interventions for implementation in a step-based manner (see Figure 8).
4
26 | Public Health WalesA review of international policies, approaches and action to address obesity.
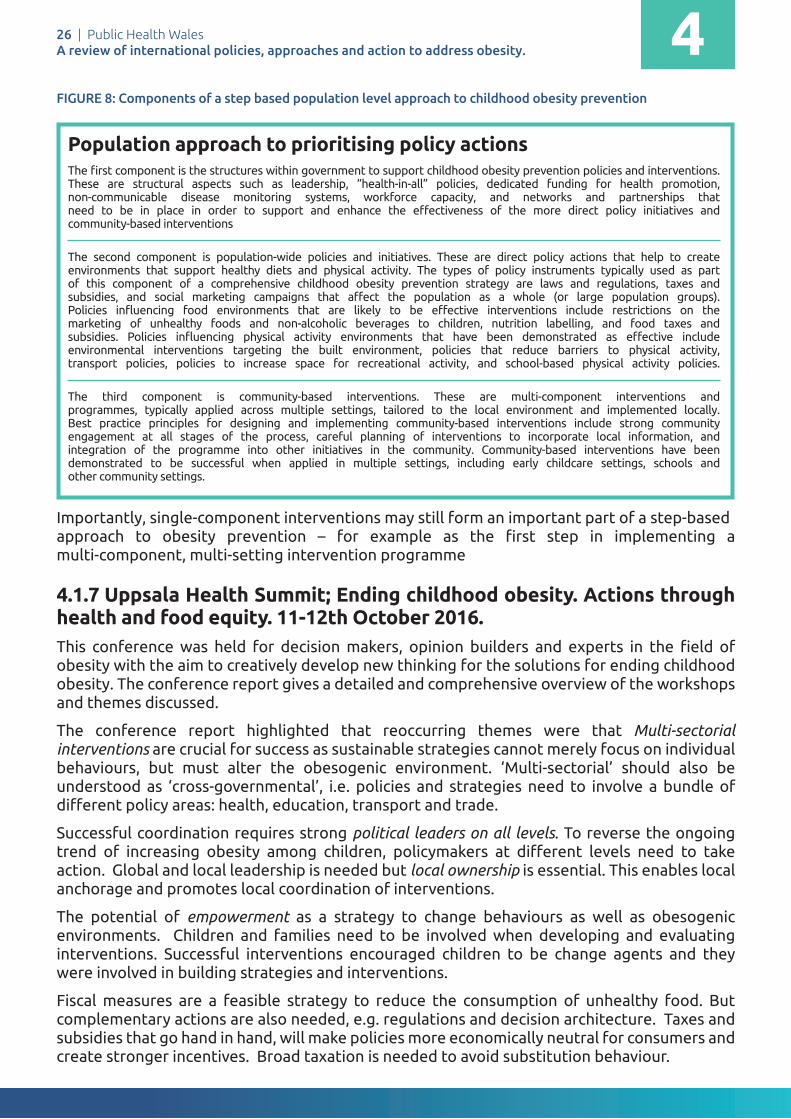
FIGURE 8: Components of a step based population level approach to childhood obesity prevention
Importantly, single-component interventions may still form an important part of a step-based approach to obesity prevention – for example as the first step in implementing a multi-component, multi-setting intervention programme
4.1.7 Uppsala Health Summit; Ending childhood obesity. Actions through health and food equity. 11-12th October 2016.This conference was held for decision makers, opinion builders and experts in the field of obesity with the aim to creatively develop new thinking for the solutions for ending childhood obesity. The conference report gives a detailed and comprehensive overview of the workshops and themes discussed.
The conference report highlighted that reoccurring themes were that Multi-sectorial interventions are crucial for success as sustainable strategies cannot merely focus on individual behaviours, but must alter the obesogenic environment. ‘Multi-sectorial’ should also be understood as ‘cross-governmental’, i.e. policies and strategies need to involve a bundle of different policy areas: health, education, transport and trade.
Successful coordination requires strong political leaders on all levels. To reverse the ongoing trend of increasing obesity among children, policymakers at different levels need to take action. Global and local leadership is needed but local ownership is essential. This enables local anchorage and promotes local coordination of interventions.
The potential of empowerment as a strategy to change behaviours as well as obesogenic environments. Children and families need to be involved when developing and evaluating interventions. Successful interventions encouraged children to be change agents and they were involved in building strategies and interventions.
Fiscal measures are a feasible strategy to reduce the consumption of unhealthy food. But complementary actions are also needed, e.g. regulations and decision architecture. Taxes and subsidies that go hand in hand, will make policies more economically neutral for consumers and create stronger incentives. Broad taxation is needed to avoid substitution behaviour.
4
The first component is the structures within government to support childhood obesity prevention policies and interventions. These are structural aspects such as leadership, “health-in-all” policies, dedicated funding for health promotion, non-communicable disease monitoring systems, workforce capacity, and networks and partnerships thatneed to be in place in order to support and enhance the effectiveness of the more direct policy initiatives andcommunity-based interventions
The second component is population-wide policies and initiatives. These are direct policy actions that help to createenvironments that support healthy diets and physical activity. The types of policy instruments typically used as partof this component of a comprehensive childhood obesity prevention strategy are laws and regulations, taxes andsubsidies, and social marketing campaigns that affect the population as a whole (or large population groups).Policies influencing food environments that are likely to be effective interventions include restrictions on themarketing of unhealthy foods and non-alcoholic beverages to children, nutrition labelling, and food taxes andsubsidies. Policies influencing physical activity environments that have been demonstrated as effective includeenvironmental interventions targeting the built environment, policies that reduce barriers to physical activity,transport policies, policies to increase space for recreational activity, and school-based physical activity policies.
The third component is community-based interventions. These are multi-component interventions andprogrammes, typically applied across multiple settings, tailored to the local environment and implemented locally.Best practice principles for designing and implementing community-based interventions include strong communityengagement at all stages of the process, careful planning of interventions to incorporate local information, andintegration of the programme into other initiatives in the community. Community-based interventions have beendemonstrated to be successful when applied in multiple settings, including early childcare settings, schools andother community settings.
Population approach to prioritising policy actions

27 | Public Health WalesA review of international policies, approaches and action to address obesity.
Nudging strategies must be based on an understanding of how to motivate different stakeholders to engage and if used effectively are an important tool to help reduce obesity.
Studies provide evidence that overall, food deserts are associated with increases in BMI z-scores*. Children in low-income areas with no access to retail stores offering fresh fruit and vegetables tend to have higher BMIs. Life in a food desert raises the cost of access to a healthy diet and thereby contributes to the risk of weight gain. Residents of disadvantaged neighbourhoods face higher prices with a poorer range and lower quality in healthy food categories. Lower-income households spend considerably more time travelling to grocery stores and shop for groceries less frequently. The presence of supermarkets significantly affects food accessibility and food purchase behaviour.
Actions proposed to improve the food retail environment:
• encouraging local food suppliers• farm to school programmes• online purchases to counteract food desserts and to influence people to make
Building a coalition of relevant stakeholders from different levels using both top-down and bottom-up approaches will help to develop a structure for coordinating the action. A stakeholder coalition consisting of teachers, community actors, healthcare providers, food suppliers or supermarkets and researchers may be relevant in socioeconomically disadvantaged areas to jointly address access to healthy foods and health outcomes. Such coalitions are useful to promote an efficient use of resources, to advocate for a change in norms and to sustain activities such as continuing community education.
Interventions should be built in such a way that they can be evaluated to be able to adjust and improve actions and interventions over time, to continue to develop our knowledge base.
4.2 International action at country levelThis section gives a brief synopsis of a range of country level strategies from countries with similar levels of obesity prevalence to Wales.
4.2.1 England On 18 August 2016, the English government published its childhood obesity plan Childhood Obesity: A Plan for Action. The key action outlined was introducing a soft drinks industry levy effective in April 2018. Drinks with more than 8g of total sugar per 100ml will pay 24p per litre, with drinks between 5g and 8g sugar per 100ml paying 18p. Drinks with less than 5g sugar per 100ml are exempt. The plan also had a target of removing 20% of the sugar children (up to 18 years of age) consume from the foods that contribute the most sugar to their diets by 2020, part of the PHE sugar reduction programme. Other approaches included:
• Supporting innovation to help businesses to make their products healthier• Developing a new framework by updating the nutrient profile model• Making healthy options available in the public sector• Continuing to provide support with the cost of healthy food for those who need it most• Helping all children to enjoy an hour of physical activity every day• Improving the co-ordination of quality sport and physical activity programmes for schools• Creating a new healthy rating scheme for primary schools• Making school food healthier• Clearer food labelling
4

28 | Public Health WalesA review of international policies, approaches and action to address obesity.
• Supporting early years settings• Harnessing the best new technology• Enabling health professionals to support families
4.2.2 Northern IrelandNorthern Ireland published A Fitter Future for All Framework for addressing and preventing overweight in Northern Ireland 2012-2022.
The aim of the framework is, "empower the population of Northern Ireland to make healthy choices, reduce the risk of overweight and obesity related diseases and improve health and wellbeing, by creating an environment that supports and promotes a physically active lifestyle and a healthy diet".
The overarching objective of the framework is to increase the percentage of people eating a healthy, nutritionally balanced diet; and to increase the percentage of the population meeting the CMO guidelines on physical activity.
The framework takes a life course approach, focusing on short, medium and long term outcomes.
FIGURE 9: Structure of the A Fitter Future for All Framework, Northern Ireland
Data source: https://www.health-ni.gov.uk/sites/default/fi les/publications/dhssps/obesity-fi tter-future-framework-ni-2012-22.pdf
Public Health Wales International Comparison Obesity Strategy
Date: November 18 Version: 1.0 Page: 20 of 114
The overarching objective of the framework is to increase the percentage of people eating a healthy, nutritionally balanced diet; and to increase the percentage of the population meeting the CMO guidelines on physical activity.
The framework is illustrated below, with a life course approach, focusing on short, medium and long term outcomes.
Figure 7: Structure of the A Fitter Future for All Framework
Data source: https://www.health-ni.gov.uk/sites/default/files/publications/dhssps/obesity-fitter-future-framework-ni-2012-22.pdf
4.2.3 Scotland
The Scottish Strategy, A Healthier Future – Action and Ambitions on Diet, Activity and Healthy Weight was published for consultation in October 2017. There is an obesity route map which categorises actions into high, medium or low impact. The strategy focusses on three broad areas;
• Transforming the food environment• Living healthier and more active lives• Leadership and exemplary practice
This strategy builds upon an earlier outline from The Food Standards Agency Scotland, which emphasises the following principles.
Principle 1 -Collaborative working
4

29 | Public Health WalesA review of international policies, approaches and action to address obesity.
4.2.3 Scotland The Scottish Strategy, A Healthier Future – Action and Ambitions on Diet, Activity and Healthy Weight – was published for consultation in October 2017. It has an obesity route map which categorises actions into high, medium or low impact. The strategy focusses on three broad areas;
• Transforming the food environment• Living healthier and more active lives• Leadership and exemplary practice
This strategy builds upon an earlier outline from The Food Standards Agency Scotland, which emphasises the following principles.
Principle 1 - Collaborative workingPrinciple 2 - Progression towards a healthier food and drink environmentPrinciple 3 - All options to be considered, including non-voluntary measuresPrinciple 4 - Consumer understanding and educationPrinciple 5 -The public sector as an exemplarPrinciple 6 - A wide range of actions is required
In the development of the strategy the following areas for action were considered1 :
• Price and promotions• Portion size reductions• Advertising and marketing• Reformulation• Taxation • Labelling and information• Empowering consumers• Public information campaigns• Nutrition training for health professionals and educators• Education on diabetes• Aff ordability and acceptability of a healthy diet• Provision of consistent dietary messaging• Development of dietary guidelines• Working with local authorities• The public sector
4.2.4 New ZealandNew Zealand launched its Childhood Obesity Plan in 2015. The plan has three focus areas made up of 22 initiatives, which are either new or an expansion of existing initiatives:
• Targeted interventions for those who are obese• Increased support for those at risk of becoming obese• Broad approaches to make healthier choices easier for all New Zealanders.
The focus is on food, the environment and being active at each life stage, starting during pregnancy and early childhood. The package brings together initiatives across government agencies, the private sector, communities, schools, families and whānau (whānau is a Māori-language word for extended family). Its main approach is based on WHO Ending Childhood Obesity approach and McKinsey’s Overcoming Obesity report.
4
1 http://www.foodstandards.gov.scot/downloads/Board_meeting_-_2017_March_08_-__Diet_and_Nutrition_one_year_on_0.pdf

30 | Public Health WalesA review of international policies, approaches and action to address obesity.
4.2.5 United States of AmericaAccelerating Progress in Obesity Prevention reviewed previous studies and their recommendations and presented five key recommendations to accelerate meaningful change on a societal level. The report suggested strategies that, independently, can accelerate progress, but urged a systems approach of many strategies working in concert to maximise progress in accelerating obesity prevention.
The recommendations in Accelerating Progress in Obesity Prevention included major reforms in access to and opportunities for physical activity; widespread reductions in the availability of unhealthy foods and beverages and increases in access to healthier options at affordable, competitive prices; an overhaul of the messages that surround Americans through marketing and education with respect to physical activity and food consumption; expansion of the obesity prevention support structure provided by health care providers, insurers, and employers; and schools as a major national focal point for obesity prevention. The report called on all individuals, organizations, agencies, and sectors that do or can influence physical activity and nutrition environments to assess and begin to act on their potential roles as leaders in obesity prevention.
Healthy Communities what local Governments can do to reduce obesity was developed by the U.S.A. Centre for disease control (CDC) as a resource, it focused on six target behaviours for the reduction of obesity:
• Increase physical activity• Increase consumption of fruits and vegetables• Increase breastfeeding initiation, duration, and exclusivity• Decrease consumption of sugar sweetened beverages• Decrease consumption of high energy dense, nutrient poor, foods• Decrease television viewing
CDC also developed a framework for preventing obesity which focused on individual factors, behavioral settings, sectors of influence and social norms and values.
4

31 | Public Health WalesA review of international policies, approaches and action to address obesity.
FIGURE 10: CDC Framework for Preventing Obesity (adapted from IOM 2005)
Data source: https://www.cdc.gov/obesity/downloads/CDC_Healthy_Communities.pdf
The social-ecological model stresses that society is composed of interconnected elements that invariably aff ect one another. The model is based on the premise that changes in individual behavior will come about through a combination of societal, community, organizational, interpersonal, and individual eff orts. Eff ective obesity prevention initiatives should address multiple levels of the environment and engage multiple sectors of society in order to aff ect social change and achieve health impact. For these reasons, CDC supports population based approaches to prevent and control obesity, such as policy, systems, and environmental change, in various settings and at all levels of government (i.e. local, state, and federal).
CDC recruited approximately 75 internal and external content area experts in the fi eld(s) of urban planning, built environment, obesity prevention, nutrition, and physical activity to assist in the identifi cation, nomination, and selection of the recommended strategies and measurements. They reviewed the evidence recommended 24 policy and environmental change strategies to promote healthy eating and active living and reduce the prevalence of obesity in the U.S.A
Strategies to promote the availability of aff ordable healthy food & beverages• Increase availability of healthier food and beverage choices in public service venues• Improve availability of aff ordable healthier food and beverage choices in public service
venues• Improve geographic availability of supermarkets in underserved areas• Provide incentives to food retailers to locate in and/or off er healthier food and beverage
choices in underserved areas• Improve availability of mechanisms for purchasing foods from farms
4
Energy Intake Energy Expenditure
Energy Balance
Individual Factors
Behavioral Settings
Social Norms and Values Home and Family
School
Community
Work Site
Healthcare
Genetics
Psychosocial
Other Personal Factors
Food and Beverage Intake
Physical Activity
Sectors of Influence
Food and Beverage Industry
Agriculture
Education
Media
Government
Public Health Systems
Healthcare Industry
Business and Workers
Land Use and Transportation
Leisure and Recreation
Prevention of Overweight and Obesity Among Children, Adolescents, and Adults
Draft – last revised, March 24, 2005
CDC Framework for Preventing Obesity(adapted from IOM 2005)

32 | Public Health WalesA review of international policies, approaches and action to address obesity.
• Provide incentives for the production, distribution, and procurement of foods from local farms
• Restrict availability of less healthy foods and beverages in public service venues• Institute smaller portion size options in public service venues• Limit advertisements of less healthy foods and beverages• Discourage consumption of sugar-sweetened beverages
Strategy to Encourage Breastfeeding• Increase support for breastfeeding
Strategies to Encourage Physical Activity or Limit Sedentary Activity Among Children and Youth• Require Physical Education in schools• Increase the amount of physical activity in PE programs in schools• Increase opportunities for extracurricular physical activity• Reduce screen time in public service venues
Strategies to Create Safe Communities That Support Physical Activity• Improve access to outdoor recreational facilities• Enhance infrastructure supporting bicycling• Enhance infrastructure supporting walking• Support locating schools in residential neighborhoods• Improve access to transportation• Zone for mixed-use development• Enhance personal safety where people are or could be physically active• Enhance traffic safety in areas where persons are or could be physically active
Strategy to Encourage Communities to Organize for Change• Participate in community coalitions or partnerships to address obesity
This approach although older (2009) is still being promoted by CDC.
In 2010, President Obama launched a taskforce on Childhood obesity, including a campaign called Let's Move!, led by The First Lady at the time, Michelle Obama.
4.2.6 MexicoMexico has very high rates of overweight and obesity, this has been increasing in children with 32.4% of the population above the age of 15 years obese (OECD, 2017).
The government identified some key opportunities for action on obesity:
• High calorie beverages contributed to 20–23% of the total energy intake in the population• Children spent only a few hours at school (about 4.5 hour per day), but they had many
opportunities to eat unhealthy energy-dense foods whilst there• Food and beverage marketing to young children was not regulated to protect this
vulnerable sector of the population• Nutrition literacy was poor among the general population. Labelling schemes were not
useful, and the Guideline Daily Amounts were confusing and misleading. There was a clear need for a labelling system that promotes better nutritional choices for the population
• Physical activity was very low across the country
4

33 | Public Health WalesA review of international policies, approaches and action to address obesity.
The Mexican Ministry of Health developed the National Agreement for Healthy Nutrition (ANSA). The ANSA was founded on the WHO Global Strategy on Diet, Physical Activity and Health. The process included a review of the risk factors for obesity and NCDs and recommendations from international agencies and governments and an international meeting of experts to discuss the reviews and identify lines of action. They agreed on the need to create a comprehensive, multi-sectoral, multilevel policy with participation of the government and civil society, including industry, non-governmental organizations (NGOs), and academia.
The National Agreement for Healthy Nutrition has ten strategic objectives that address the obesity problem:
1. Promote physical activity among the Mexican population in the school, work, community and recreation environments through the collaboration of the public, private and social sectors
2. Increase the availability, accessibility and consumption of plain drinking water
3. Reduce fats and sugars in beverages
4. Increase daily intake of fruits and vegetables, legumes, whole grain cereals, and fi bre by increasing their availability and accessibility and promoting their consumption
5. Improve the public’s ability to make informed decisions about a proper diet through useful, easy-to-understand labelling, thereby promoting nutritional and health literacy
6. Promote and protect exclusive breast-feeding for the fi rst six months of life and complementary adequate feeding afterward
7. Reduce consumption of sugars and other caloric sweeteners added to foods and increase the availability and accessibility of low- or no-calorie sweeteners
8. Decrease daily consumption of saturated fats and minimize consumption of trans fats from commercial sources
9. Educate the public about controlling the recommended portion sizes in foods prepared at home and in permitted processed foods and encourage restaurants and food outlets to off er smaller portion sizes
10. Reduce daily sodium intake by reducing the amount of added sodium in foods and increasing the availability and accessibility of low- or no-sodium products
The main objective of the strategy was to improve the well-being of the population and national sustainability by slowing the increase on the prevalence of overweight and obesity and by reversing the epidemic of non- communicable diseases, especially type 2 diabetes, through the implementation of public health actions, medical care and a comprehensive policy implementation.
The Mexican government has taken a range of actions including
• the Mexican national beverage guidelines – 10% tax on sodas and 8% tax on processed food which contains more than 275 calories per 100g
• a multi sectoral national obesity prevention strategy • accountability mechanisms and inter sectoral coordination;• the school guidelines for healthy food – including a ban on soda sales, reduction of fat in milk distributed by the government the Mexican front of pack labelling and the regulation of food and beverage marketing to children
4
34 | Public Health WalesA review of international policies, approaches and action to address obesity.
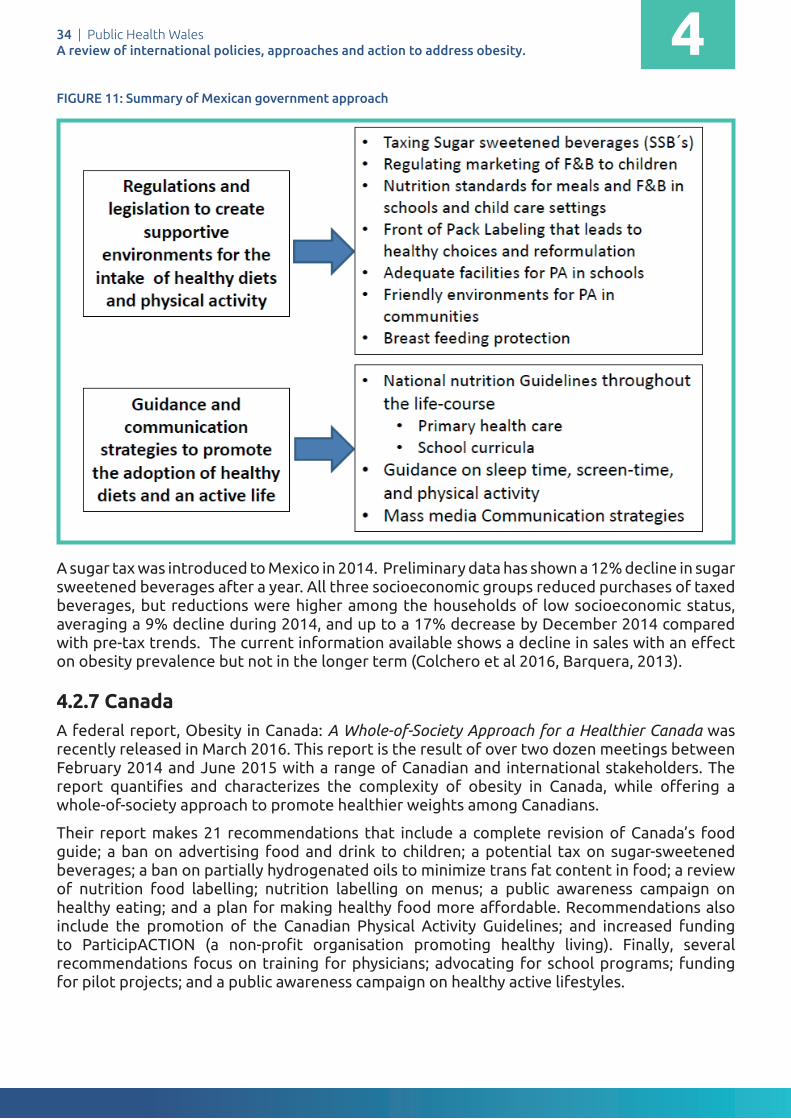
FIGURE 11: Summary of Mexican government approach
A sugar tax was introduced to Mexico in 2014. Preliminary data has shown a 12% decline in sugar sweetened beverages after a year. All three socioeconomic groups reduced purchases of taxed beverages, but reductions were higher among the households of low socioeconomic status, averaging a 9% decline during 2014, and up to a 17% decrease by December 2014 compared with pre-tax trends. The current information available shows a decline in sales with an eff ect on obesity prevalence but not in the longer term (Colchero et al 2016, Barquera, 2013).
4.2.7 CanadaA federal report, Obesity in Canada: A Whole-of-Society Approach for a Healthier Canada was recently released in March 2016. This report is the result of over two dozen meetings between February 2014 and June 2015 with a range of Canadian and international stakeholders. The report quantifi es and characterizes the complexity of obesity in Canada, while off ering a whole-of-society approach to promote healthier weights among Canadians.
Their report makes 21 recommendations that include a complete revision of Canada’s food guide; a ban on advertising food and drink to children; a potential tax on sugar-sweetened beverages; a ban on partially hydrogenated oils to minimize trans fat content in food; a review of nutrition food labelling; nutrition labelling on menus; a public awareness campaign on healthy eating; and a plan for making healthy food more aff ordable. Recommendations also include the promotion of the Canadian Physical Activity Guidelines; and increased funding to ParticipACTION (a non-profi t organisation promoting healthy living). Finally, several recommendations focus on training for physicians; advocating for school programs; funding for pilot projects; and a public awareness campaign on healthy active lifestyles.
Public Health Wales International Comparison Obesity Strategy
Date: November 18 Version: 1.0 Page: 27 of 114
The main objective of the strategy was to improve the well-being of the population and national sustainability by slowing the increase on the prevalence of overweight and obesity and by reversing the epidemic of non- communicable diseases, especially type 2 diabetes, through the implementation of public health actions, medical care and a comprehensive policy implementation.
The Mexican government has taken a range of actions including
• the Mexican national beverage guidelines – 10% tax on sodas and 8% tax on processed food which contains more than 275 calories per 100g
• a multi sectoral national obesity prevention strategy • accountability mechanisms and inter sectoral coordination;• the school guidelines for healthy food – including a ban on soda
sales, reduction of fat in milk distributed by the government the Mexican front of pack labelling and the regulation of food and beverage marketing to children
The approach taken by the Mexican government is summarised below.
Figure 10: Summary of Mexican government approach
Source:
A sugar tax was introduced in 2014. Preliminary data has shown a 12% decline in sugar sweetened beverages after a year. All three socioeconomic groups reduced purchases of taxed beverages, but reductions were higher among the households of low socioeconomic status, averaging a 9% decline during 2014, and up to a 17% decrease by
4

35 | Public Health WalesA review of international policies, approaches and action to address obesity.
Canada is following Brazil in developing a revised food guide which will be
• evidence-based • apply meal-based rather than nutrient-based principles • effectively and prominently describe the benefits of fresh, whole foods compared to
refined grains, ready-to-eat meals and processed foods; and • make strong statements about restricting consumption of highly processed foods
The Province of Ontario in Canada has developed an approach produced by The Healthy Kids Panel, a multi-sectoral panel of 18 experts, created to develop recommendations for the Minister of Health and Long-Term Care. After conducting its deliberations between May and December 2012, the Ontario Healthy Kids Panel submitted its report, No Time to Wait: The Healthy Kids Strategy.
To reach the ambitious obesity reduction target, the panel recommended a three-part strategy, recognizing that no one measure will solve the problem of childhood overweight/obesity:
• Start All Kids on the Path to Health • Change the Food Environment • Create Healthy Communities
The panel emphasised that health is much more than weight and cautioned that an overemphasis on weight is stigmatising and does not address many of the factors contributing to unhealthy weights. The Healthy Kids Strategy is a comprehensive approach to promoting healthy eating and physical activity, creating healthy communities and mitigating the broader social and health disparities affecting children.
It also focusses on a life course approach to reducing obesity in children:
• Preconception and prenatal period• First 6 months of life• Early years• Transition to childcare and school • Entering adolescence• Late teens
From Strategy to Action highlighted key actions needed including
• Establishing a cross ministry cabinet committee, chaired by the Prime Minister• Empowering parents, caregivers and youth• Leverage to build on existing work • Funding commitments• The use of evidence, monitoring of progress and ensuring accountability
The aim is to have an evolving strategy which creates and uses evidence to drive action and decision, and one that continually measures the impact of different interventions and progress in improving child health
4.2.8 IrelandA Healthy Weight for Ireland was published in 2016 and sets out its core principles:
• life-course oriented, with a focus on children and families; and• prevention focused, with an emphasis on targeting inequalities
4
36 | Public Health WalesA review of international policies, approaches and action to address obesity.
It outlines who the policy will operate at two levels:
• “Top down” measures: different sectors play key roles in shaping the obesity prevention environment
• “Bottom up” approaches: these empower individuals, families and communities to make healthier choices and/or inform relevant key sectors of future strategies and interventions/actions
It sets out ten key steps:
1. Embed multi-sectoral actions on obesity prevention with the support of government departments and public sector agencies
2. Regulate for a healthier environment3. Secure appropriate support from the commercial sector to play its part in obesity prevention4. Implement a strategic and sustained communications strategy that empowers a. individuals, communities and service providers to become obesity aware and b. equipped to change, with a particular focus on families with children in the early years5. The Department of Health, through Healthy Ireland, will provide leadership, a. engage and co-ordinate multi-sectoral action and implement best practice in b. the governance of the Obesity Policy and Action Plan6. Mobilise the health services to better prevent and address overweight and obesity through
effective community-based health promotion programmes, a. training and skills development and through enhanced systems for detection and
referrals of overweight and obese patients at primary care level7. Develop a service model for specialist care for children and adults8. Acknowledge the key role of physical activity in the prevention of overweight and obesity9. Allocate resources according to need, in particular to those population groups most in
need of support in the prevention and management of obesity, with particular emphasis on families and children during the first 1,000 days of life
10. Develop a multi-annual research programme that is closely allied to policy actions, invest in surveillance and evaluate progress on an annual basis
4.2.9 JapanLife expectancy of the Japanese population has steadily increased over the past few decades and is currently among the longest in the world, with Japanese women recording the longest life expectancy of 86.8 in 2017 (WHO, 2017) A recent study on Japanese diet concluded, that a dietary pattern of high intake of vegetables and fruits and adequate intake of fish and meat can significantly decrease the risk of mortality from cardiovascular disease in East Asian populations, particularly from cerebrovascular disease (Kurotani, Akter et al. 2016).
In addition, Japan has the lowest BMI out of the developed countries. It is interesting to examine the reasons why there is such a difference in BMI between Japan and other developed countries. Several reasons have been put forward for this difference. The traditional Japanese diet with its emphasis on rice, vegetables, and fish, with very little fat, is very conducive to maintaining a pattern of lower calorie consumption. The food pyramid depicting a traditional Japanese, or other Asian, diet has much in common with the pyramid of the traditional Mediterranean diet. They both share a base built around grains, with plentiful consumption of vegetables and fruits, and also fish, but relatively little animal fat, meat and sweets.
The average Japanese consumes fewer calories and less fat than other developed countries
4

37 | Public Health WalesA review of international policies, approaches and action to address obesity.
such as US, UK and Canada and have smaller portion sizes (Senauer et al 2006). Other factors which have been cited are that traditionally Japanese incorporate physical activity as part of their daily live. The cities in Japan are based on mass transit urban designs and so cars are used less (Senauer et al 2006). School lunches are healthy based on locally sourced vegetables, rice and fi sh and children help in the preparation and cleaning up after meals.
In 2008 the Metabo Law was introduced which requires people aged between 45-74 years to have their waist measured annually. If they are found to be at risk of being overweight they are referred for weight management and dietary advice. Linked to this are fi nancial penalties for local governments and companies which don’t meet specifi c targets. Japanese companies carry out medical screening on employees once a year. Culturally Japanese have the view that it is unacceptable to be overweight. Every October there is a national holiday which exists to promote sport and healthy living and Japanese children around the country take part in sporting events.
4.3 Target setting It is interesting to note that internationally, strategies have begun to move away from very specifi c targets included in earlier obesity strategies. There are several reasons for this but the foremost being that those targets were not achieved. It is also diffi cult to predict the level of target to set which is realistic. More recent strategies, including have been less specifi c.
The Swedish government's public health policy is not target driven; instead, it focuses on creating the right environment for people to improve their own health through infl uencing workplace and education policy.
The WHO Global Action Plan on Non-Communicable Disease, ‘to halt the rise in Obesity’ has 2 global nutrition targets for 2025. (WHO, 2013). They are:
Target 4: Ensure that there is no increase in childhood overweight, andTarget 5: Increase the rate of exclusive breastfeeding in the fi rst 6 months up to at least 50%2
There is generally a move towards more process measures, however some national strategies do have specifi c targets, such as Ireland’s; based on stabilisation rates of obesity in the national survey and a focus on short term fi ve year target of a sustained downwards trend of 0.5% per annum in the level of excess weight averaged across all adults and children. Ireland has also set a target of a reduction in the gap in obesity levels between the highest and lowest socioeconomic groups by 10%. New Zealand have included a referral target for obese children. Brazil set a specifi c target of reducing obesity prevalence in children aged 5–9 years by 7.1% per year, in an eleven year strategy, with an end goal to return to the obesity prevalence observed in 1998 (8.0%) by 2022.
Table 2 gives a brief review of national obesity strategies and the types of targets included. Australia and USA do not have a national obesity strategy and therefore not included in the table.
2 http://apps.who.int/iris/bitstream/10665/149018/1/WHO_NMH_NHD_14.2_eng.pdf?ua=1
4

38 | Public Health WalesA review of international policies, approaches and action to address obesity.
3 https://extranet.who.int/nutrition/gina/sites/default/fi les/GBR%202008%20Healthy%20Weight%2C%20Healthy%20Lives-%20A%20Cross-Government%20Strategy%20for%20England.pdf4 http://media.dh.gov.uk/network/261/fi les/2012/05/Obesity-Review-Group-19-April-2012-Background-Slide-Set-2-Call-to-action.pdf5 https://www.gov.uk/government/publications/childhood-obesity-a-plan-for-action/childhood-obesity-a-plan-for-action6 https://www.thl.fi /en/web/thlfi -en/research-and-expertwork/projects-and-programmes/the-national-obesity-programme-2012-2015
4TABLE 2: International Comparison of Countries’ Targets or Goals to Reduce Obesity
2008 England
Healthy weight Healthy Lives3
Initial focus on children: by 2020, aim to reduce the proportion of overweight and obese children to 2000 levels.
A sustained downward trend in the levels of excess weight in children by 2020.
A clear halt to the rising trend (and where possible a downward trend) in levels of excess weight across all adult age groups by 2020.
Have one specifi c target:
• Taking out 20% of sugar in products
The other headings were:
• Introducing a soft drinks industry levy • Supporting innovation to help businesses to make their
products healthier• Developing a new framework by updating the nutrient
profi le model• Making healthy options available in the public sector• Continuing to provide support with the cost of healthy food
for those who need it most• Helping all children to enjoy an hour of physical activity
every day• Improving the co-ordination of quality sport and physical
activity programmes for schools• Creating a new healthy rating scheme for primary schools• Making school food healthier• Clearer food labelling• Supporting early years settings• Harnessing the best new technology• Enabling health professionals to support families
England
Call to Action on Obesity4
England
Childhood obesity: a plan for
action5
2011
2017
Year Country Strategy & Target
2012 Finland
The National Obesity
Programme 2012–20186
Main programme targets were:
• Increasingly fewer children and young people grow up to as obese adults
• Increasingly fewer people gain weight as adults• Diff erences in obesity prevalence among population groups
become smaller• People at risk of obesity-related conditions lose weight or
do not gain any more weight.

39 | Public Health WalesA review of international policies, approaches and action to address obesity.
2010
Strategy & Target
Scotland
Preventing overweight
and obesity in Scotland7
Identified a national indicator -‘Reduce the rate of increase in the proportion of children with their Body Mass Index outwith a healthy range by 2018’.
* (In Scottish English, outwith means outside/ beyond)
And are working to develop a further indicator and milestones:
• Prevention of weight gain in both those of normal weight and those currently overweight through changes in Scotland’s culture and environment
• Reduction in weight in those currently overweight and obese
• Prevention of adverse complications in those who are currently obese
Year Country
The programme is deemed successful when:
• Our partners create networks and become committed to obesity prevention
• Health promotion and obesity prevention are taken into account in all strategic planning and decision-making at local, regional and national levels
• Decision-makers can use up-to-date information in their decision-making
• The environment encourages to physical activity• Healthy dietary choices are available for everyone• Obesity prevention is part of vocational and continuing
education in the fi elds of health care, education, nutrition and physical activity
• Guidelines on diet, physical activity and clinical practice as well as good practices are well-known and in use
• Everyone has access to inclusive and empowering lifestyle guidance and health monitoring as well as support for healthy choices.
7 http://www.gov.scot/Resource/Doc/302783/0094795.pdf8 https://www.health.govt.nz/our-work/diseases-and-conditions/obesity/childhood-obesity-plan
2015 New Zealand
Childhood obesity plan8
‘By December 2017, 95% of obese children identifi ed in the Before School Check (B4SC) programme will be off ered a referral to a health professional for clinical assessment and family based nutrition, activity and lifestyle interventions.’ Families referred through the B4SC programme will have improved access to nutrition and physical activity programmes.
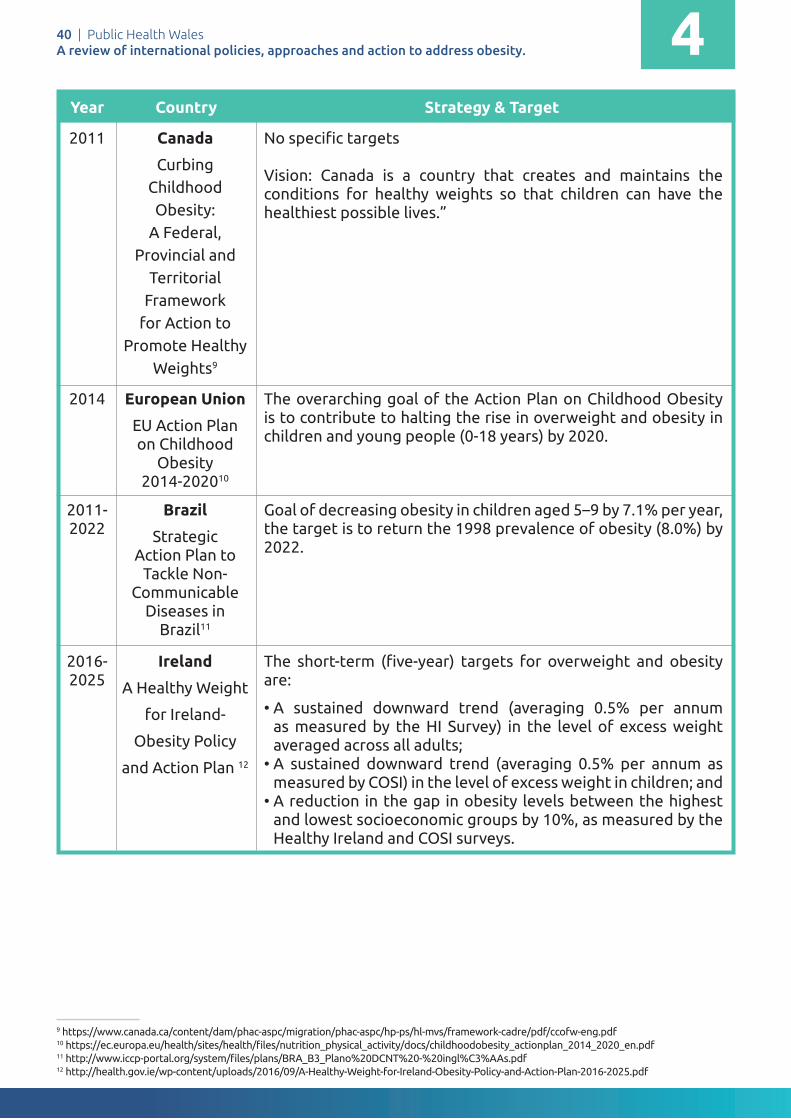
40 | Public Health WalesA review of international policies, approaches and action to address obesity.
2014
2011-2022
2016-2025
European Union
EU Action Plan on Childhood
Obesity 2014-202010
Brazil
Strategic Action Plan to
Tackle Non-Communicable
Diseases in Brazil11
Ireland
A Healthy Weight
for Ireland-
Obesity Policy
and Action Plan 12
The overarching goal of the Action Plan on Childhood Obesity is to contribute to halting the rise in overweight and obesity in children and young people (0-18 years) by 2020.
Goal of decreasing obesity in children aged 5–9 by 7.1% per year, the target is to return the 1998 prevalence of obesity (8.0%) by 2022.
The short-term (fi ve-year) targets for overweight and obesity are:
• A sustained downward trend (averaging 0.5% per annum as measured by the HI Survey) in the level of excess weight averaged across all adults;
• A sustained downward trend (averaging 0.5% per annum as measured by COSI) in the level of excess weight in children; and
• A reduction in the gap in obesity levels between the highest and lowest socioeconomic groups by 10%, as measured by the Healthy Ireland and COSI surveys.
Year Country Strategy & Target
9 https://www.canada.ca/content/dam/phac-aspc/migration/phac-aspc/hp-ps/hl-mvs/framework-cadre/pdf/ccofw-eng.pdf10 https://ec.europa.eu/health/sites/health/fi les/nutrition_physical_activity/docs/childhoodobesity_actionplan_2014_2020_en.pdf11 http://www.iccp-portal.org/system/fi les/plans/BRA_B3_Plano%20DCNT%20-%20ingl%C3%AAs.pdf12 http://health.gov.ie/wp-content/uploads/2016/09/A-Healthy-Weight-for-Ireland-Obesity-Policy-and-Action-Plan-2016-2025.pdf
42011 Canada
Curbing Childhood Obesity:
A Federal, Provincial and
Territorial Framework
for Action to Promote Healthy
Weights9
No specifi c targets
Vision: Canada is a country that creates and maintains the conditions for healthy weights so that children can have the healthiest possible lives.”

41 | Public Health WalesA review of international policies, approaches and action to address obesity.
International case studies on reducing obesity
5

42 | Public Health WalesA review of international policies, approaches and action to address obesity.
International case studies on reducing obesity
The following section provides case studies from countries identifi ed in the literature review and search of grey literature as successfully reduced the prevalence of obesity.13
These countries are:
• The Netherlands (Amsterdam)• Finland (Seinäjoki and North Karelia)• The United States (New York, Massachusetts and Anchorage)
The case studies examine the actions taken, the supporting and challenging factors and an assessment of how transferable the case studies are for other countries. The quality of the information varied between case studies.
An issue with these case studies is that for some of these interventions (Amsterdam and Finland) the evaluations have not been published in the peer reviewed literature and the reduction in prevalence has been measured through routine surveys. The US and North Keralia case studies do have better quality evaluations which have been published in peer review literature and can be considered to be more robust evidence.
5
13 More detailed information on the case studies can be found in the case study supplement.

43 | Public Health WalesA review of international policies, approaches and action to address obesity. 5
Background and context of initiatives
Obesity in Finland is more common than in other Nordic countries. One in five (1/5) Finnish adults are obese (BMI 30 or more) (FINRISKI 2017). The childhood obesity and overweight is a growing problem. Six years ago, almost 20 per cent of the five-year-olds in the city of Seinäjoki Finland were overweight or obese.
The City of Seinäjoki launched Overcoming Obesity Programme in 2013. The Programme is based on the National Obesity Programme 2012–2018 'Overcoming obesity – well-being from healthy nutrition and physical activity' coordinated by the National Institute for Health and Welfare (THL).
Description of the intervention
1. To actively promote well-being, map the differences in well-being and monitor effectiveness of taken measures with the help of well-being report.
2. Decision-makers have access to up-to-date information on research, statistics and good practices. Health and well-being promotion and obesity prevention are taken into account in all strategic planning and decision-making at municipal and regional levels.
3. The environment and functional practices promote and encourage physical activity.
4. Healthy dietary choices are available for everyone.
5. The whole population has access to motivating, inclusive and empowering lifestyle guidance and health monitoring as well as support for healthy choices. The purpose is to make children and their families understand that overweight is connected with all the components of well-being and health, and overweight in childhood leads to morbidity in adulthood. Families get timely information and services that support healthy life choices and taking responsibility for family's well-being.
6. Guidelines on diet, physical activity and clinical practice as well as effective working methods are well known and applied.
7. Obesity prevention and health promotion are included in vocational and continuing education in fields of health care, teaching, nutrition and physical activity.
8. Partners create networks and make commitment to prevent obesity.
9. Families and communities participate in Overcoming Obesity programme.
5.1 Seinäjoki: Overcoming Obesity Programme, 2013-2020
Case study 1.
Supporting Factors
Each sector of the city has the same goal and across the city management there is a commitment to:
• Work with families. • Provide systematic lifestyle counselling in
maternity and child health clinics and school and student health clinics.
• Develop mass catering and nutrition. • Develop professional skills in every city
department.
The city management is committed to this cross functional development work.

44 | Public Health WalesA review of international policies, approaches and action to address obesity. 5
Key actions taken
The urban planning department improved school playgrounds. Recreation implemented more physical activity in schools. Nutrition worked with day care centres to eliminate sugary snacks and with schools to serve healthier lunches. The health department instituted comprehensive yearly health examinations in schools, including parent education on healthy eating.
The program monitored 1 and 5 year old children, as well as the 1st and 5th grade students in the areas of:
• weight development. • mothers' breast-feeding activity. • dental health.
In schools, day care centres and elderly services the lunch food meets nutrition recommendations (Heart Symbol 2015). The school lunches are provided for free.
Lessons are active lessons and avoid sitting, with physical activity breaks. During the 50-minute break you have time to play, exercise, dance or move as you like outdoors or indoors.
The needs of groups with special needs (old, young people, disabled persons), are taken into account in land use planning, zoning and traffic planning.
Non-profit organisations and more than 70 sport clubs in Seinäjoki participate in creating well-being.
Timescales
The intervention started in 2012 and is ongoing.
Resources
The City of Seinäjoki is implementing Overcoming Obesity Programme without extra financing or resources as a part of each sector's basic work and yearly budget.
Conclusions
The overcoming obesity programme in Seinäjoki is a good example of a multi-level intervention which has been delivered at scale in a city. The key to the programmes delivery is the involvement of all sectors of society, with interventions aimed at every age group and the involvement of schools, early years settings and extra-curricular sports clubs. There is also a focus on changing the obesogenic environment. A strong leadership from the city council enabled the sharing of the vision.
Outcomes (and Efficacy)
The work in Seinäjoki has been recognised by WHO as a successful example of reducing childhood obesity. However, currently the evidence of evaluation is not published in a peer reviewed journal. All the information regarding the activities and actions taken have been documented by the Seinäjoki government.
In 2009 almost one in five (17 %) 5 year old children in Seinäjoki was overweight or obese. In 2015 only one in ten (10 %) 5 year old children was overweight or obese (Effica). The favourable weight development of primary school students has continued. In 2011, 14 % of 1st grade students and 16.1 % of 5th grade students were overweight or obese. Four years later, in 2015, 8.7 % of 1st grade students and 8.2 % of 5th grade students were overweight or obese.
Positive changes have also been identified in levels of breastfeeding and in oral health.

45 | Public Health WalesA review of international policies, approaches and action to address obesity. 55
Background and context of initiatives
In Amsterdam in 2013 , one in four to five young people were overweight, which equates to approximately 30,000 children.
In 2013, to tackle this issue the Council and Health Department of Amsterdam set out to develop a long term approach that reached into every domain of a child’s life. Council members awarded the programme with unanimous approval and a sizeable, structural budget, reaching as far as 2033, to coincide when children of the first ‘healthy generation’ will celebrate their 18th birthday.
The Mission of the programme is for all of Amsterdam’s children to have a healthy weight by 2033 and no child in Amsterdam to have an unhealthy upbringing.
A key concept of the programme is that Amsterdam views a healthy life for children not just as a responsibility of the parents, but as a responsibility shared by everyone who plays a part in the life of children, from neighbours and teachers to policy makers and the food industry.
• A healthy weight is a collective responsibility and the healthy choice is the normal choice.• Everyone is needed: It takes a village to raise a child.• A healthy lifestyle is the norm, the default in our city.• Every child in Amsterdam has the best possible opportunities for a healthy upbringing.
The programme has steadily been working on building a coalition of partners, all working in their own domain on this issue, sending out the same message: healthy behaviour is normal behaviour.
Three simple lifestyle rules form the basis of this message: Healthy food and drink, exercise, and sleep.
5.2 A healthy weight for all children in Amsterdam in 2033 - Amsterdamse aanpak gezond gewicht
Description of the intervention
A key part of the programme was building partnerships. Eleven neighbourhoods agreements or ‘pacts’ were agreed. There was an extensive training programme where five hundred professionals and volunteers learnt about weight-related issues. A manager was appointed in each of the five districts who led the implementation of the programme in conjunction with partners.
The programme consisted of:
• The building of a network of ‘healthy businesses.
• The First Thousand Days approach (from conception to the age of two) which involved the establishment of a collaborative network with midwives, maternity care, youth healthcare and the parent and child teams.
• In 2017 there was an additional focus on teenagers but this is still in the preparatory phase.
Case study 2.

46 | Public Health WalesA review of international policies, approaches and action to address obesity. 5
Outcomes (and Efficacy)
In 2017 overweight and obesity had fallen from 21% to18.5% of all children- 2,500 less children). Children of all ages – with the exception of 14 and 16-year olds– are more often found in the ‘healthy weight’ category than they were in 2012. Of the eleven ‘heaviest neighbourhoods’, nine are now lighter.
A challenge is that although there has been a reduction in prevalence of obesity in most age groups. There has been mixed results in the lower age groups, 2-3 and 3-4 and as yet there is not an explanation why the interventions have not been successful in this age group. Recently there has also been a more concerted effort to focus on teenagers in the city.
There has been a 6% increase in 5-10 year olds exercising for more than an hour a day, an increase in sports club participation and also a decrease in chidlren spending 2 hours or less watching TV. In 5 year olds there has been a large increas in girls taking more exercise and more sports clubs.There has been a decline in the percentage of overweight and obese children among those with a low or very low SES.
Supporting Factors
The supporting factors are the strong vision and leadership of the city government who have managed to share the vision across the city and enabled all stakeholders to become involved. There is buy in from all government departments but also the community, education and the food industry.
Timescales
The city of Amsterdam has adopted a long term approach to reducing obesity and there strategic aim is that all children in Amsterdam will be a healthy weight by 2033. This has been split into different milestones using the metaphor of a marathon with ‘sprints, half marathon and full marathon' as the goals.
Resources
This has not been documented.
The targets for the programme have been staggered:
• 2018 – a healthy weight for all 0-5 year olds in Amsterdam.• 2023 – a healthy weight for all 0-10 year olds in Amsterdam.• 2033 – a healthy weight for all young people in Amsterdam.
The initial focus of the programme was in the five neighbourhoods with most overweight children (and most deprived area) but this is now being extended further, however the targeting and resourcing still prioritises more deprived areas. The aim is to have fewer primary schools where more than 25% of pupils are overweight or obese. All children who are obese or morbidly obese must be given appropriate care and the right type of care must be given at the right time.
The programme aims to:
• influence individual lifestyle factors by means of professionals.• influence children’s immediate social and physical environments. • influence relevant living and working conditions.

47 | Public Health WalesA review of international policies, approaches and action to address obesity. 5
Conclusions
The programme in Amsterdam has been successful in reducing obesity rates, especially in more deprived areas. There has been a real focus on lower socio- economic neighbourhoods where the obesity prevalence was high. This has also been combined with a universal approach expanding to all neighbourhoods. This is a multi-level intervention involving all sectors of the city delivered at scale. The delivery and marketing of the ‘vision’ that no child in Amsterdam will be overweight by 2033 is an important aspect. An essential part of the programme is the training of voluntary health ambassadors who communicate the message to the community and teach healthy eating.

48 | Public Health WalesA review of international policies, approaches and action to address obesity. 555
Background and context of initiatives
The North Karelia Project started in 1972. In Finland at the time the coronary heart disease rate was the highest in the world . In Eastern Finland the rates were particularly high. A pilot community prevention programme was started in an area called North Karelia. The goal of the North Karelia Project was to reverse the situation by changing the population’s lifestyles. (Baril, G, 2013). The Finnish experience gives strong support to the general possibility and potential of CVD prevention and to the main strategies of population-based prevention. (Puska et al, 2009).› Initially (1972-82): to reduce CVD mortality in the local population› Later (1982 onwards): to reduce major chronic (non-communicable disease) mortality and promote
health in the local population
5.3 The North Karelia Project, Finland
Description of intervention
The North Keralia Project took the following approach:
• Improving preventive services to help the public identify its risk factors and devote the desired attention to them.
• Disseminating information on the relationship between health and lifestyles.
• Persuading people to get involved in efforts targeting their health.
• Training people, providing them with new skills to make them more capable of managing their habits and environment.
• Ensuring that social support be provided to encourage individuals committed to change to pursue their efforts.
• Implementing environmental changes that tackle obstacles to healthy lifestyles and that create new possibilities to make better choices for one’s health.
• Joining forces with local organizations and mobilizing the community to create a social climate conducive to the adoption of healthy lifestyles (Baril, G, 2013).
The nutrition component
The nutrition intervention was multi-faceted. Personal and group counselling, training of local personnel, and promotion of environmental changes. Nutrition information was disseminated via local newspapers, radio, leaflets, posters and stickers, health education meetings, and public campaigns in schools and worksites. Health care personnel, teachers, workers in voluntary organizations, and community leaders were regularly trained in seminars and meetings. Newer intervention techniques have included television programs, worksite intervention programs, health education in schools, and environmental modification to increase vegetable and berry production and consumption (Pietinen et al, 1989).
Challenging Factors
One of the challenges of the original North Keralia project was that the behavioural changes began to infiltrate across the county and so changes in dietary behaviour began to occur in the comparison region as a result of the intervention which potentially diluted the evaluation.
Case study 3.

49 | Public Health WalesA review of international policies, approaches and action to address obesity. 5
Timescales
The original aim of the North Karelia Project was to carry out the intervention in North Karelia for the 5-year period between 1972 and 1977 as a pilot for all of Finland. The success of the project meant it was then rolled out nationally.
Outcomes (and Efficacy)
The results show marked positive population changes in target risk factors and related lifestyles, and associated with these, positive changes in cardiovascular rates during the original period, especially in North Karelia and later on in all of Finland. These can be explained to a great extent by the changes in the target risk factors. From between 1969 and 1971 to 2011, the age-adjusted coronary heart disease mortality among the 35- to 64-year-old male population declined in North Karelia by 84% and in all of Finland by 82%. The early rather large gap between North Karelia and all of Finland became very small by 1995, and practically disappeared in the 2000s (Puska et al 2009).
Transferability
The learning from North Karelia shows that the program planning and evaluation should include the following key steps to help individuals to modify their behaviour:
1. Improved preventive services to help people to identify their risk factors and to provide appropriate attention and services.2. Information to educate people about the relationship between behaviours and their health.3. Persuasion to motivate people and to promote the intentions to adopt the healthy action.4. Training to increase the skills of self-management, environmental control, and necessary action.5 . Social support to help people to maintain the initial action.6. Environmental change to create the opportunities for healthy actions and improve unfavourable conditions.7. Community organisation to mobilise the community for broad-ranged changes (through increased social support and environment modification) to support the adoption of the new lifestyles in the community (Puska et al, 2009).
Overall the key aspects which are transferable are
• Adopting a long-term vision.• Maintaining close ties with the political bodies and decision makers concerned.• Making the theoretical bases of the intervention explicit.• Influencing individual and environmental factors.• Using the media and a variety of channels for disseminating information.• Involving champions and influential community members in the project.• Developing collaborative cross-sector ways of changing environments.• Mobilising structures and networks existing in the community (Baril, 2013).
Key actions taken
The key actions were the identification of risk factors, the setting up of the project group and office, the identification of key leaders and influencers in the community, the delivery of training across the community including healthcare, the development of the media messaging, working with industry and work places and influencing key community groups to spread the message.

50 | Public Health WalesA review of international policies, approaches and action to address obesity. 555
Brief summary
The New York State Prevention Agenda 2013-2018 is the blueprint for state and local action to improve the health of New Yorkers in five priority areas and to reduce health disparities for racial, ethnic, disability, and low socioeconomic groups, as well as other populations who experience them. A main focus is reducing obesity.
The key goals of the programme are to:
• Create community environments that promote and support healthy food and beverage choices and physical activity.
• Prevent childhood obesity through early child care and schools.• Expand the role of health care and health service providers and insurers in obesity prevention.• Expand the role of public and private employers in obesity prevention.
The vision was for a Strong and Healthy New York:
• Our communities encourage daily physical activity through active design and active communities.• New York State’s food system brings healthy food to all our neighborhoods.• Our health care system prevents illness, and services are conveniently available in our communities.• Public and private investments prioritise health improvement.
5.4 Designing a Strong and Healthy New York / The New York State Prevention Agenda
Description of Intervention
An important was that efforts were concentrated in neighbourhoods of greatest need. The District Public Health Offices (DPHOs) were created in 2002 and strategically located in neighbourhoods with the highest rates of poverty and diet-related disease in the city. This was a cross government strategy at a state level involving multiple partners. It had strong leadership from the Mayor, with champions across different agencies.
The interventions included the development of:
Strategy 1: New York city food standards.Strategy 2: Nutrition standards for school meals.Strategy 3: Move to improve for elementary
schools children. Strategy 4: New York city day care regulations.Strategy 5: Health Bucks.
Supporting factors
The following factors were identified as being supportive to implementation:
• The standards developed were evidence based and rigorous.
• There were internal champions within the city agencies.
• Partnership working-having the various organisations work together on food policy seemed unprecedented and an impetus for creating change, led by the Mayor.
• Funding was available to train teachers in physical activity and provided equipment.
A primary facilitator of the Health Bucks program is that it is mutually beneficial to customers, farmers, and farmers market managers.
Case study 4.

51 | Public Health WalesA review of international policies, approaches and action to address obesity. 5
Timescales
The actions outlined took place between 2006 until 2010. Actions have continued as part of the New York State Prevention Agenda 2013-2018.
Resources
Funding were not described but stakeholder interviews commented on the difficult of delivering with a lack of funding in some areas.
Outcomes (and Efficacy)
In NYC, statistically significant declines in obesity were noted among students in grades K-8 between the 2006–2007 and 2010–20112 school years. The prevalence of obesity in grades K–8 had a relative decline of 5.5% (p < .001) between 2006–2007 (21.9%) and 2010–2011 (20.7%). The findings show that obesity decreased significantly among children in all age groups and socioeconomic and racial/ethnic populations; however, the decrease was smaller among black (1.9%) and Hispanic (3.4%) children than among Asian/Pacific Islander (7.6%) and white (12.5%) children.
Strategy 5, Health Bucks
An evaluation of the program revealed evidence that Health Bucks have increased EBT sales at farmers markets in NYC.7 The population using EBT began redirecting their food shopping to farmers markets, where they are able to afford more fresh produce. Farmers markets also began responding to this shift in demand, and an additional benefit of the Health Bucks program cited by respondents was that farmers markets were better able to operate in low-income neighbourhoods, opening up new access points in areas of high need. One respondent described that 59% of the 141 farmers markets in the city are now located in underserved neighbourhoods. The program increased access to and availability of fresh produce for families living in low-income neighbourhoods throughout the city.
The interventions which took place were initially exploratory in nature, and did not have a control group or measure changes over time. Through data collection, many items emerged that likely impacted childhood obesity declines in New York City, but the evaluation study did not allow for direct determination of causality.
Conclusions
The strategies were implemented across a variety of settings and used complementary strategies to ensure that they addressed all aspects of the issues and reached their target population. The emphasis on complementary strategies helped to support change within the community to increase demands for healthy foods and beverages. The strategies also helped to expand the availability of healthy foods and opportunities for physical activity. Having these strategies implemented in multiple settings ensures that those who need them the most will be exposed at multiple levels. Also of importance is consistency in policies implemented across early childhood through adolescence and the level of enforcement of those policies. In New York City, policies were reinforced at multiple levels. For example, the changes in the school nutrition policies were reinforced by the New York City Food Standards. Respondents stated that this cumulative effect potentially impacted the decline in the obesity rates seen in New York City children. Some respondents referred to this as the “layering effect”—changing policies and developing programs at the Federal, State, and local levels ensure that obesity is addressed at all levels.

52 | Public Health WalesA review of international policies, approaches and action to address obesity. 5
The changes seen in New York City is an example of how communities can work together to foster a culture of health. Starting with the mayor, the community created an environment where a healthier lifestyle was not only encouraged, but also made a part of everyday life. City agencies, businesses, and community-based and other local organizations all worked together to foster healthy communities, especially among the neediest neighbourhoods. Schools and early childhood centres, where children spend the bulk of their days, placed emphasis on eating healthy and staying active. Altogether, there is a shared value that all individuals should have access to affordable healthy foods and opportunities to be active – which will help them make healthier choices in life.

53 | Public Health WalesA review of international policies, approaches and action to address obesity. 5555
Background and context of initiatives
Shape up Somerville (SUS) is a city-wide collective impact campaign to reduce obesity by engaging schools, city government, civic organizations, community groups, businesses, and other people who live in, work in, and visit the city of Somerville, Mass. The effort has made significant changes for the city through programming, physical infrastructure improvements, and policy work.› By 2003, 44% of all youth were overweight or obese. › The rate of obesity was disproportionately high among racial and ethnic minorities.
The Friedman School of Nutrition at Tufts partnered with the City of Somerville to begin a three-year research trial, with core funding from the U.S. Centers for Disease Control and Prevention (CDC), focused on creating environmental change to prevent obesity in early-elementary school children.
5.5 Shape Up Somerville, Massachusetts
Description of Intervention
Mission: To take a community-based, participatory, environmental approach to prevent obesity for the people who live in, work in, or visit Somerville.
Enhancing food options: Over 40 restaurants across the city offered healthy options on their menus, additional farmer’s market and community supported Agriculture drop off sites and electronic benefit transfer to purchase fruits and vegetables at farmers markets.
Changed quality and quantity of healthy foods for students: Schools increased the amount of healthy fruits and vegetables that were available for students and eliminated unhealthy options like ice-cream. The development of nutrition standards in schools and publicly owned enterprises. Farm to school purchases and school yard gardens. Nutrition education in schools and cooking classes during after school programmes.
Trained educators and changed school policy: More than 50 local clinicians and school nurses were trained on a new toolkit designed to assess
and address children who are overweight. Improved nutrition and obesity counselling and electronic record keeping in health centres.
New and improved park: The City has renovated 17 parks and added four new parks increasing the city’s open space inventory by 2.05 acres.
Promotion of active living:Advocacy and planning for regional mass transportation.
Development of bicycle lanes and traffic calming measures, parks and playground enhancements and safety measures.
Physical education and gymnasium improvements in the local schools and after school programmes.
Education and self-assessment though BMI and fitness testing in schools and improved counselling on physical activity in health centres. Engagement of the immigrant population.
Case study 5.
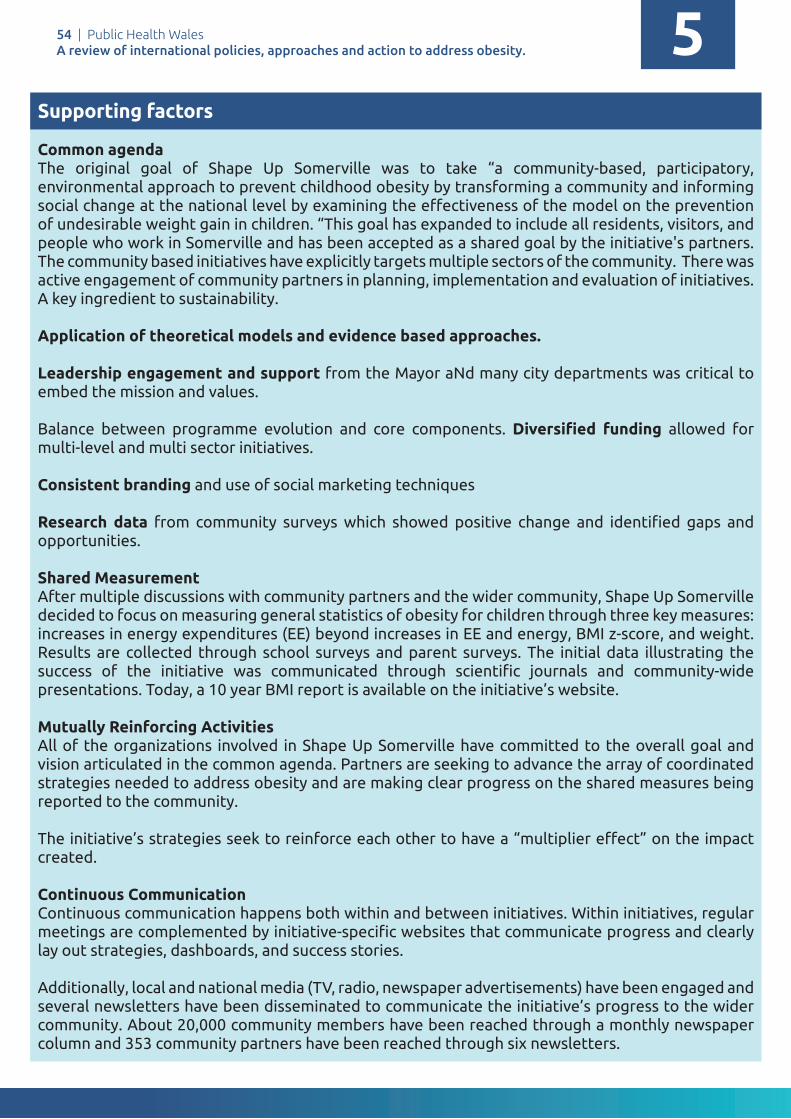
54 | Public Health WalesA review of international policies, approaches and action to address obesity. 5
Supporting factors
Common agenda The original goal of Shape Up Somerville was to take “a community-based, participatory, environmental approach to prevent childhood obesity by transforming a community and informing social change at the national level by examining the effectiveness of the model on the prevention of undesirable weight gain in children. “This goal has expanded to include all residents, visitors, and people who work in Somerville and has been accepted as a shared goal by the initiative's partners. The community based initiatives have explicitly targets multiple sectors of the community. There was active engagement of community partners in planning, implementation and evaluation of initiatives. A key ingredient to sustainability.
Application of theoretical models and evidence based approaches.
Leadership engagement and support from the Mayor aNd many city departments was critical to embed the mission and values.
Balance between programme evolution and core components. Diversified funding allowed for multi-level and multi sector initiatives.
Consistent branding and use of social marketing techniques
Research data from community surveys which showed positive change and identified gaps and opportunities.
Shared Measurement After multiple discussions with community partners and the wider community, Shape Up Somerville decided to focus on measuring general statistics of obesity for children through three key measures: increases in energy expenditures (EE) beyond increases in EE and energy, BMI z-score, and weight. Results are collected through school surveys and parent surveys. The initial data illustrating the success of the initiative was communicated through scientific journals and community-wide presentations. Today, a 10 year BMI report is available on the initiative’s website.
Mutually Reinforcing Activities All of the organizations involved in Shape Up Somerville have committed to the overall goal and vision articulated in the common agenda. Partners are seeking to advance the array of coordinated strategies needed to address obesity and are making clear progress on the shared measures being reported to the community.
The initiative’s strategies seek to reinforce each other to have a “multiplier effect” on the impact created.
Continuous Communication Continuous communication happens both within and between initiatives. Within initiatives, regular meetings are complemented by initiative-specific websites that communicate progress and clearly lay out strategies, dashboards, and success stories.
Additionally, local and national media (TV, radio, newspaper advertisements) have been engaged and several newsletters have been disseminated to communicate the initiative’s progress to the wider community. About 20,000 community members have been reached through a monthly newspaper column and 353 community partners have been reached through six newsletters.

55 | Public Health WalesA review of international policies, approaches and action to address obesity.
Timescales
Shape up Somerville was a 15 year strategy (1998-2013) to build and sustain a healthier more equitable community for everyone who lives in, works in, and visits Somerville.
Resources
Funding received from CDC (school based initiative) Vitamin Company Litigation Settlement Funds (school based vegetable gardens and fruit and vegetable promotion in schools), Grant from Robert Wood Johnson Foundation (city planning and infrastructure).
Outcomes (and Efficacy)
In the first year of the intervention 2003-4 there was a modest statistically significant decrease in BMI of 1%, for an average 8 year old child this translates to the prevention of additional weight gain of 1.1 lbs in a male child and 1.3lbs in a female child.
Over 2 years the BMI z score of children decreased by 0.06, a modest weight reduction compared to those who did not receive the intervention (Economos, C et al 2013). Prevalence of overweight/obesity decreased in males (OR =0.78 p.0.01) and females (OR=0.78, p=0.03) and remission increased in males (OR 3.18, p=0.03) and females (OR 1.93, p=0.03) in intervention compared to controls.
Between 2006-7 the proportion of students who were at a healthy weight increased modestly but statistically significantly form 49%-51%/.There were statistically significant declines in the average
Key actions taken
A common fact base was developed and an advisory committee allowed researchers and community members to meet monthly for updates, collaborative grants and measure outcomes.Build trust between stakeholders develop memoranda of understanding, listing the commitments and responsibilities of each participant.Each sector implemented the agenda through existing channelsPowerful sponsor / champion – unwavering commitment of the Mayor (intersector.com)
Challenging Factors
Challenging to measure the impact of Somerville’s health eating and active living on Changes in CMI as Somerville did not have a continuous data set on children’s health indicators during this period, not a sustained comparison community to compare results over time. The population of Somerville is dynamic with families frequently moving which means children with varying levels of exposure to the intervention are entering and leaving the school system and potentially diluting the observed effectiveness.
Dedicated SupportThe city government of Somerville serves as the backbone organization for the initiative. The backbone consists of a four-person team: a part-time mobile farmers market manager, a part-time intern working on various projects, a full-time coordinator organizing partners in areas such as the restaurant program, and a director responsible for managing work such as the worksite wellness program. The initial funding for these positions was provided by Tufts University through a $1.5 million CDC grant and the Robert Wood Johnson Foundation. Currently, the majority of Shape Up Somerville’s backbone staff and activities are funded through the health department of the City of Somerville, which in turn is supported by taxpayers. The funding is reapproved every year in the city’s annual budget.

56 | Public Health WalesA review of international policies, approaches and action to address obesity. 5
Transferability
This intervention emphasises the important of engaging with the wider community, especially during the planning process, listening and taking community members’ opinions into account was critical. The initiative also shared what they had learned; each month Shape Up Somerville sent home a parent newsletter to over 500 families and a community newsletter to over 200 community members. These newsletters contained updates on the project, health tips, and coupons for healthy food.
Enforce accountability: Both during the planning and implementation process, Shape Up Somerville used mechanisms like memorandums of understanding (MOU) and contracts to hold participating organizations accountable. They found that being clear and putting things in writing helped reinforce commitment and accountability of all participating groups.
Build relationships outside your “issue”: Shape Up Somerville found that the best way to get people excited about the specific issue of childhood obesity was to engage with the community as much as possible and get excited about other important issues in turn. In order to build trust, they “said yes” to helping others in the community whenever they could, even when doing so had no direct link to their work. In return, community stakeholders who did not have a direct stake in Shape Up Somerville’s anti-obesity agenda spread their message as well. As one Shape Up Somerville participant advised, “Put your agenda aside to build relationships and trust. Support other initiatives and issues in a community even if they have no direct link to your work.”
BMI percentile between 2006 and 2007 among boys (73.9 percentile vs 72.5 percentile) and among white students (71.7 vs 70.7) and black students (76.4 vs 74.7). In 2010 to 2011 the proportion of students in the sample who were obese declined from 30% to 28%.
Shape Up Somerville’s major success has been a significant decrease in weight and body mass index (BMI) – key indicators of obesity – among the community’s young children. In an initial study from 2003 – 2005, the average weight of children in Somerville went down one pound in one school year, a statistically significant impact, while the weight of children in the control group communities increased one pound (decade shape up Sommerville).
In Somerville, just outside Boston in 2000, 46% of Somerville first and third graders were overweight.
In 2003 nearly half of all high school students retorted watching TV for more than 3 hours a night, which decreased by 11% to 37% in 2011. The number of children having two or more snacks and sweets a day fell by 12% from 55% in 2003 to 43% in 2011. An increase in physical activity from 18% of middle school children meeting requirements in 2003 to 28% in 2011. In 2011 78% of youth reported have received nutrition and fitness instruction at school.
Parental BMI’s have also been recorded as decreasing by 0.411 BMI change ( 95% CI -0.725- -0.097) (Coffield et al, 2015).

57 | Public Health WalesA review of international policies, approaches and action to address obesity. 55555
Brief summary
In Alaska a key turning point for childhood obesity awareness and concern among influential leaders in Anchorage was the release of the State’s 2003 report, titled “The Burden of Overweight and Obesity in Alaska.” The report’s release marked the first time it became clear to Alaska leaders that obesity was a problem in Alaska. The report rallied leadership into finding ways to address obesity in Alaska. The same year, there was the first state-wide obesity summit.
5.6 Anchorage, Alaska
Description of Intervention
The actions taken by Alaska focussed on reducing the prevalence of obesity in children. There was a school setting approach with legislation introduced to help support the policies. A key step was the national act which required schools participating in the National School Lunch Program to establish a local wellness policy. This was implemented thoroughly and systematically (Board level and lower). These policies required school districts to address the following: (1) goals for nutrition education, physical activity, and other school-based activities; (2) nutrition guidelines for all foods sold on school campus during the school day to promote health and reduce obesity; (3) a plan to ensure implementation of the policy; (4) involvement of parents, students, and representatives of the school administration and staff as well as the public in a local wellness committee; and (5) guidelines for reimbursable school meals that are not less restrictive than national guidelines. In addition to the local wellness policies, the requirements of the fruit and vegetables program were revised. It emphasised that the majority of schools participating should be low income (at least 50% of students receiving free or reduced-price lunch), and it provided funds for
districts and schools related to farm-to-school programs as well as nutrition education (e.g., Team Nutrition grants).
The development of the Mayor’s Task Force on Obesity and Health helped to prioritise obesity programmes and gave it visible leadership and support. The policy review by the National Collaboration on obesity research, identified nine State policies related to nutrition, physical activity, and the built environment in Alaska between 2001 and 2012. Of the nine policies, one addressed health and personal safety education, five were related to nutrition, two were related to physical activity, and one was related to physical activity and the built environment
1. Introduction of nutritional standards.2. Anchorage school district (asd): nutrition
changes.3. Anchorage school district: health, wellness,
and physical education changes.4. Mayor’s task force on obesity and health5. School wellness committee, policy, and
6-year plan.
Timescales
The childhood obesity-prevention strategies were implemented from 2001-2011 but are still ongoing in Anchorage.
Resources
There is no information available regarding the cost of the programme.
Case study 6.

58 | Public Health WalesA review of international policies, approaches and action to address obesity. 5
Outcomes (and Efficacy)
Anchorage reported a 5.4 percent relative decline in the overweight and obesity rate among children in grades K, 1, 3, 5, and 7 between 2003 and 2014.
The National Collaboration on obesity research through their interviews, policy scans, and document reviews concluded that many items emerged that likely impacted childhood obesity declines in Anchorage, but the study methods do not allow for drawing direct causal conclusions about what led to those declines.
Transferability
There was a large focus on schools in this programme with many of the actions being transferable in principle to other countries. There was a financial requirement for paying the teachers for training to deliver education on nutrition and physical activity which may not be feasible in other places. There was also a strong leadership component from the Mayor, a similar figurehead may not exist in all places. The Farmers’ Market-Quest Card Program linked to the benefit system may also not be feasible in all countries.
The transferable areas are around establishing Anchorage as a Let’s Move City and a public education campaign.

59 | Public Health WalesA review of international policies, approaches and action to address obesity.
Conclusion6
60 | Public Health WalesA review of international policies, approaches and action to address obesity. 6Conclusion
A key fi nding of this report is that no country in the world has successfully managed to reduce obesity prevalence at a country level, however it has found pockets of innovative approaches which have been successful reducing obesity in children. This illustrates the complexity of reducing obesity prevalence. As McKinsey concluded over four years ago, ‘it is imperative to act decisively now on multiple levels if change is to be achieved and all links in the chain must be addressed (McKinsey, 2014). WHO also advocates for a similar approach. Obesity is a population problem and should be tackled as such. Eff ective prevention and management of obesity will require an integrated approach, involving actions in all sectors of society (WHO 2000).
The evidence points to intervention taking a systems approach which should target factors contributing to obesity, should target barriers to lifestyle change at personal, environmental and socioeconomic levels, and actively involve diff erent levels of stakeholders and other major parties (Chan at al, 2010). Interventions need to be across the life course to reinforce and sustain long term behavioural change and be integrated to address all ages and demographic groups (Gortmaker et al 2011).
Progress is being made in Finland, Amsterdam, and several US states in addressing childhood obesity, however, the percentage decrease has been small. The case studies from countries which successfully reduced obesity had the following themes in common;
• All included multi-level action across diff erent sectors including community, schools and early year settings, industry and government city departments
• Involved strong leadership, often from a key fi gure such as a mayor, who shared a vision • Involved ownership and community participation and mobilised existing structures within
the communities • Infl uenced individual and environmental factors• Took a long term approach with realistic targets and goals• Flexible enough to evolve as they were delivered and vary target groups or geographical
areas• Had strong communication/ marketing elements
This rapid review has reinforced the fi ndings from research that no single solution creates suffi cient impact to reverse obesity: only a comprehensive, systemic program of multiple interventions is likely to be eff ective. In addition, it is useful to also use the approach suggested by WHO to adopt population approaches to prevent obesity (Figure 12).
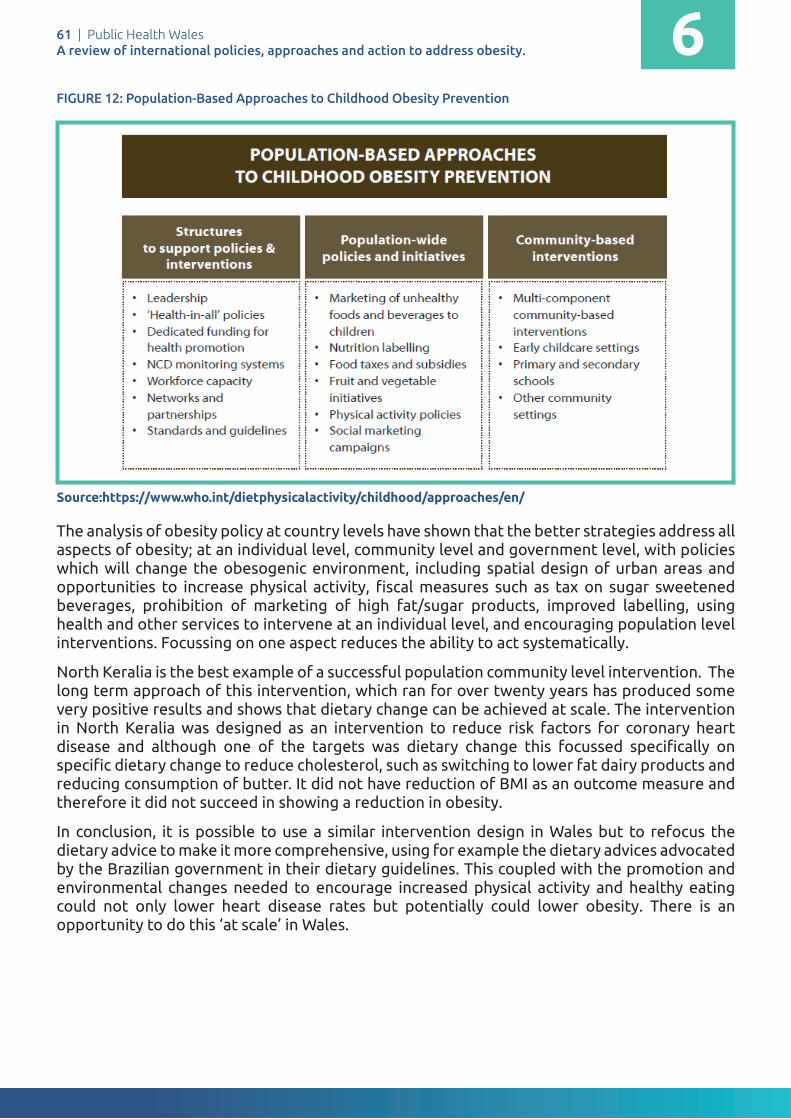
61 | Public Health WalesA review of international policies, approaches and action to address obesity.
FIGURE 12: Population-Based Approaches to Childhood Obesity Prevention
Source:https://www.who.int/dietphysicalactivity/childhood/approaches/en/
The analysis of obesity policy at country levels have shown that the better strategies address all aspects of obesity; at an individual level, community level and government level, with policies which will change the obesogenic environment, including spatial design of urban areas and opportunities to increase physical activity, fi scal measures such as tax on sugar sweetened beverages, prohibition of marketing of high fat/sugar products, improved labelling, using health and other services to intervene at an individual level, and encouraging population level interventions. Focussing on one aspect reduces the ability to act systematically.
North Keralia is the best example of a successful population community level intervention. The long term approach of this intervention, which ran for over twenty years has produced some very positive results and shows that dietary change can be achieved at scale. The intervention in North Keralia was designed as an intervention to reduce risk factors for coronary heart disease and although one of the targets was dietary change this focussed specifi cally on specifi c dietary change to reduce cholesterol, such as switching to lower fat dairy products and reducing consumption of butter. It did not have reduction of BMI as an outcome measure and therefore it did not succeed in showing a reduction in obesity.
In conclusion, it is possible to use a similar intervention design in Wales but to refocus the dietary advice to make it more comprehensive, using for example the dietary advices advocated by the Brazilian government in their dietary guidelines. This coupled with the promotion and environmental changes needed to encourage increased physical activity and healthy eating could not only lower heart disease rates but potentially could lower obesity. There is an opportunity to do this ‘at scale’ in Wales.
Public Health Wales International Comparison Obesity Strategy
Date: November 18 Version: 1.0 Page: 57 of 114
This coupled with the promotion and environmental changes needed to encourage increased physical activity and healthy eating could not only lower heart disease rates but potentially could lower obesity. There is an opportunity to do this ‘at scale’ in Wales.
The rapid review has reinforced research that no single solution creates sufficient impact to reverse obesity: only a comprehensive, systemic program of multiple interventions is likely to be effective. In addition, it is useful to also use the approach suggested by WHO to adopt population approaches to prevent obesity.
Figure 11: Population-Based Approaches to Childhood Obesity Prevention
The analysis of obesity policy at country levels have shown that the better strategies address all aspects of obesity; at an individual level, community level and government level, with policies which will change the obesogenic environment, including spatial design of urban areas and opportunities to increase physical activity, fiscal measures such as tax on sugar sweetened beverages, prohibition of marketing of high fat/sugar products, improved labelling, using health and other services to intervene at an individual level, and encouraging population level interventions. Focussing on one aspect reduces the ability to act systematically.
6

62 | Public Health WalesA review of international policies, approaches and action to address obesity.
References7
63 | Public Health WalesA review of international policies, approaches and action to address obesity.
ReferencesBari, G. (2013). The North Karelia Project in Finland: A societal shift favouring healthy lifestyles. TOPO, Issue 5. Accessed February 2017. Available at: https://www.inspq.qc.ca/pdf/publications/1624_NorthkareliaProjectFinland.pdf
Barquera S, Campos I, Rivera JA. (2013). Mexico attempts to tackle obesity: the process, results, push backs and future challenges. Obes Rev 14(Suppl 2): 69-78. https://doi:10.1111/obr.12096 24103026
Borodulin, K. Tolonen, H. Jousilahti, P. Jula, A. Juolevi, A.. Koskinen,S.. Kuulasmaa, K. Laatikainen,T. Männistö,S. Peltonen, M. Perola, M. Puska, P. Salomaa., V, Sundvall, J. Virtanen, S. Vartiainen, E (2017) Cohort Profi le: The National FINRISK Study, International Journal of Epidemiology, Nov 20. dyx239, https://doi.org/10.1093/ije/dyx239
Brown, W.V.; Fujioka, K.; Wilson, P.W.; Woodworth, K.A. (2009) Obesity: why be concerned? Am. J. Med. 122, S4-11.
Butland B, Jebb S, Kopelman P, et al. (2007) Tackling obesities: future choices – project report (2nd Ed). London: Foresight Programme of the Government Offi ce for Science.
Chan, RS; Woo, J. (2010). Prevention of overweight and obesity: How eff ective is the current public health approach. Int. J. Environ. Res. Public Health 7, 765–783
Coffi eld, E. Nihiser, A.J. Sherry, Economos, C.D. (2015). Shape Up Somerville: change in parent body mass indexes during a child-targeted, community-based environmental change intervention. Am J Public Health. Feb;105(2):
Colchero, M,A. Guerrero-Lopez,C, M. Molina M. Rivera, J, A. (2016) Beverages sales in Mexico before and after implementation of a sugar sweetened beverage tax. PLoS One, 11 (9) Article e0163463
Dobbs R, Sawers C, Thompson F, Manyika J, Woetzel J, Child P, et al. (2014) Overcoming obesity: an initial economic analysis: London: McKinsey Global Institute. Available at: https://www.mckinsey.com/industries/healthcare-systems-and-services/our-insights/how-the-world-could-better-fi ght-obesity
Gortmaker, S. L., Swinburn, B., Levy, D., Carter, R., Mabry, P. L., Finegood, D., … Moodie, M. (2011). Changing the Future of Obesity: Science, Policy and Action. Lancet, 378(9793), 838–847. https://doi.org/10.1016/S0140-6736(11)60815-
Guh, D.P.; Zhang, W.; Bansback, N.; Amarsi, Z.; Birmingham, C.L.; Anis, A.H. (2009) The incidence of co-morbidities related to obesity and overweight: a systematic review and meta-analysis. BMC Public Health 9, 88.
Haby, M.M., Chapman, E., Clark, R., Barreto, J., Reveiz, L., and Lavis, J.N. (2016). What are the best methodologies for rapid reviews of the research evidence for evidence-informed decision making in health policy and practice: a rapid review. Health Res Policy Syst. 14: 83.
House of Commons (2017) Briefi ng paper, number 3336. Obesity Statistics. London: House of Commons.
Muller-Riemenschneider, F.; Reinhold, T.; Berghofer, A.; Willich, S.N.(2008) Health-economic burden of obesity in Europe. Eur. J. Epidemiol. 23, 499-509
Ng M, Fleming T, Robinson M, Thomson B et al. (2013) Global, regional, and national prevalence of overweight and obesity in children and adults during 1980–2013: a systematic analysis for the Global Burden of Disease Study. The Lancet. 2014;384(9945):766–81
Nissinen, Aulikki, Jaakko Tuomilehto, Thomas E. Kottke, and Pekka Puska.(1986) Cost-Eff ectiveness of the North Karelia Hypertension Program 1972-1977." Medical Care 24, no. 8 :767-80.
Organisation for Economic Cooperation and Development (2017), Health at a Glance: Europe: OECD. Accessed February 2018. Available at: https://data.oecd.org/healthrisk/overweight-or-obese-population.htm
Pietinen P, Nissinen A, Vartiainen E, Tuomilehto A, Uusitalo U, et al, (1988). Dietary changes in the North Karelia Project (1972-1982). Prev Med, 17: 183-93.
Pietinen, Pirjo & Vartiainen, Erkki & J Korhonen, Heikki & Kartovaara, Leena & Uusitalo, Ulla & Tuomilehto, Jaakko & Puska, Pekka. (1989). Nutrition as a component in community control of cardiovascular disease (The North Karelia Project). The American journal of clinical nutrition. 49. 1017-24
Public Health England. (2016). Child Obesity International Comparison Factsheet. London: PHE. Accessed February 2018. Available at: https://khub.net/documents/31798783/32038776/Child+obesity+international+comparisons+data+factsheet/1aa529dc-8411-401c-a4f0-f216b28257b9?version=1.1
Puska, P., K. Koskela, H. Pakarinen, P. Puumalainen, V. Soininen and J. Tuomilehto (1976). “The North Karelia Project: a programme for community control of cardiovascular diseases,” Scandinavian Journal of Public Health, [online], vol. 4, n° 1-3, p. 57-60
Puska P, Tuomilehto J, Salonen J, Neittaanm L, Maki T, et al, (1979). Changes in coronary risk factors during comprehensive fi ve-year community programme to control cardiovascular diseases (North Karelia project). Br Med J, 2: 1173-78.
Puska P, Salonen JT, Tuomilehto J, Nissinen A, Kottke TE (1983). Evaluating community-based preventive cardiovascular programs: problems and experiences from the North Karelia project. J Comm Health, 9: 49-64.
Puska P, Salonen J, Nissinen A, Tuomilehto J (1983). The North Karelia project. Prev Med, 12: 191-5.
7
64 | Public Health WalesA review of international policies, approaches and action to address obesity.
P Puska, A Nissinen, J Tuomilehto, J T Salonen, K Koskela, A McAlister, T E Kottke, N Maccoby, and J W Farquhar. 1985. The Community-Based Strategy to Prevent Coronary Heart Disease: Conclusions from the Ten Years of the North Karelia Project. Annual Review of Public Health. Vol. 6:147-193
Puska P. 1992. The North Karelia Project: nearly 20 years of successful prevention of CVD in Finland. Hygie 11:33–35
P. Puska, E. Vartiainen, T. Laatikainen, P. Jousilahti and M. Paavola. 2009. The North Karelia Project: from North Karelia to national action. Helsinki, Helsinki University Printing House.
Puska P (2016). Why did North KareliaeFinland work? Is it transferable? Glob Heart 11:387–91.
Puska P, Vartiainen E, Nissinen A, Laatikainen T, Jousilahti P. (2016) Background, principles, implementation, and general experiences of the North Karelia Project. Global Heart 11(2):173–8. https://doi:10.1016/j.gheart.2016.04.010.
Senauer, B. and Gemma, M. (2006). "Why Is the Obesity Rate So Low in Japan and High in the US? Some Possible Economic Explanations." Paper presented at the Conference of the International Association of Agricultural Economists, Gold Coast, Australia.
State of obesity website. Accessed February 2018. Available at: https://stateofobesity.org/progress/new-york-city/
The Global Burden of Disease Collaborators. (2017). Health Effects of Overweight and Obesity in 195 Countries over 25 Years. The New England Journal of Medicine. June 2017:10.1056/NEJMoa1614362. doi:10.1056/NEJMoa1614362
Vartiainen E, Jousilahti P, Alfthan G, Sundvall J, Pietinen P, et al, (2000) Cardiovascular risk factor changes in Finland, 1972-1997. Int J Epidemiol, 29: 49-56.
WHO (1986). The Ottawa Charter for Health Promotion. Accessed February 2018. Available at: http://www.who.int/healthpromotion/conferences/previous/ottawa/en/index1.html
WHO (2000). Obesity: preventing and managing the global epidemic. Report of a WHO Consultation (WHO Technical Report Series 894). Accessed February 2018. Available at: http://www.who.int/nutrition/publications/obesity/WHO_TRS_894/en/
WHO 2013. Global action plan for the prevention and control of noncommunicable diseases 2013-2020. Accessed February 2018. Available at: http://apps.who.int/iris/bitstream/10665/94384/1/9789241506236_eng.pdf
World Health Organization. World Health Statistics 2014. WHO, 2017. Available at: http://www.who.int/gho/publications/world_health_statistics/2017/en/
WHO, 2016. Report of the commission on ending childhood obesity. Geneva; 2016. Accessed February 2018. Available at: http://www.who.int/end-childhood-obesity/en/
WHO fact sheet on obesity and overweight, Feb 2018. Accessed February 2018. Available at: www.who.int/mediacentre/factsheets/fs311/en/
WHO World Health Statistics 2017. Monitoring health for the SDGs. Accessed February 2018. Available at: http://apps.who.int/iris/bitstream/10665/255336/1/9789241565486-eng.pdf?ua=1
7