Embed Size (px)
Citation preview
ELSEVIER 0141-0296(95)00190-5
Engineering Structures, Vol. 18, No. 4, pp. 321-331, 1996 Copyright © 1996 Elsevier Science Ltd
Printed in Great Britain. All rights reserved 0141-0296/96 $15.00 + 0.00
A inferring
pressures
measurements
rigorous statistical technique for circular silo wall
from wall strain
J. F. Chen, J. Y. Ooi and J. M. Rotter
Department of Civil Engineering, University of Edinburgh, Edinburgh EH9 3JN, UK
(Received June 1994; revised version accepted September 1995)
The pressures exerted by particulate solids on circular silo walls are often measured using pressure cells mounted in the silo wall. Recent research has shown that the patterns of pressure are often very complex, and that the pressures can vary rapidly with pos- ition. Thus, a comprehensive picture can only be obtained at great expense, principally because many cells are needed, and also due to the high cost of stiff pressure cells and the installation pro- cedures. Some attempts have been made to infer wall pressures from wall strain measurements, but gross errors of interpretation have often been made by misunderstanding the complex structural behaviour of the circular silo as a thin shell structure. This paper sets out a procedure to infer the wall pressures with reasonable accuracy from wall strain measurements on a cylindrical silo whose wall can be described as an isotropic thin shell.
Keywords: silos, bulk solids, loads, pressures, strains, strain gauges
1. Introduction
The pressures acting on the walls of a silo are required as a starting point for the silo structural design. However, the magnitudes and distribution of the pressures are not yet well understood, especially for conditions of eccentric dis- charge. The uncertainty about these pressures may be seen from the large discrepancies between national standards (over 100%) when applied to quite simple problemsL This paper outlines a technique by which the pressure distri- bution may be rigorously inferred from strain measure- ments made on a full-scale silo, provided the silo wall is an isotropic thin axisymmetric shell.
Recent work on the interpretation of silo pressure exper- iments has shown that very many instantaneous measure- ments must be made to define the systematic and random components of the wall pressure distribution 2'3. Pressure cells are usually mounted in the silo wall to make such measurements. However, the cost of making and installing reliable cells is extremely high, and the number of cells needed to characterise a complex pressure distribution is large. Furthermore, for bulk solids with large particles, quite large cells are required. The low stiffness of a large cell may disturb the pressure distribution significantly, especially in a stiff solid, but a stiffer cell may become so
massive that it affects the pressure distribution by locally stiffening the structure (particularly in a thin-walled metal silo).
To overcome these shortcomings, strain gauges have sometimes been used in experiments to measure the strains in the silo walls. Attempts have been made to deduce the pressure distribution acting on the silo walls from simple strain readings (for example, see References 4-6) . Since a circular silo structure is normally a thin shell under unsym- metrical loading, both stretching and bending deformations of comparable magnitudes occur in the wall. Strains meas- ured on the outside of the wall are thus considerably affec- ted by local bending. Huge errors of interpretation can occur 7 if it is assumed that the local value of the wall press- ure p is simply related to the circumferential stress in the wall as tro=pR/t, or through two-dimensional plane stress elasticity relations (see, for example, Reference 4). Instead, the strains and stresses at every point in the structure are affected by the normal pressure and frictional traction everywhere on the wall s .
This paper presents a new rigorous procedure by which the complete pressure distribution may be inferred from strains measured on the silo wall, by back-figuring from a series of structural analyses of the silo using characterised pressure distributions. Errors are minimised by a least-
321
322 Inferring circular silo wall pressures: J. F. Chen et al.
squares adjustment. Because the pressure pattern is defined in advance, the assumptions about pressure patterns, nor- mally made by the choice of placement of pressure cells, are clearer to the user and also changeable in the light of the distributions discovered. The test silo must be quite free of defects and local complexities, so that the structural analysis used in the pressure inference process can be trusted.
The technique was developed for use in the interpretation of the strain measurements made on a specially built full- scale test silo 9. The method may only be used if the wall is an isotropic axisymmetric thin shell (concrete silos, which may contain cracks and other defects, are not reliably isotropic). A simple example is presented here to illustrate the new procedure. The application of the technique to a real silo involves many more considerations, and so is beyond the scope of this paper and instead is presented else- where ~°.
Notat ion
E H M N R S U W a
e
f k
P t
Z
Ot
/3 E
4, Y K
/x
(7"
0
Young's modulus or target function height of silo number of gauge locations number of load functions radius of silo sensitivity matrix influence matrix weighting matrix load parameter vector error vector or amplitude of noise load function lateral pressure ratio pressure or traction loading thickness of wall vertical coordinate number of load components number of strain measures at each gauge location strain meridional coordinate unit weight of stored solids curvature wall friction coefficient Poisson's ratio standard deviation circumferential coordinate
Subscripts n normal v vertical w wall b bending m membrane
2. Strain measurements on a silo wall
If the pressure distribution and the silo structure are very symmetrical, there is less need for a large number of strain observations. The simple interpretations used before 5-7 are often reliable, and the new procedure is not needed, except near discontinuities. However, the conditions for this are quite strict: the silo must be a thin shell under axisymmetric or slowly varying loading, and with uniform base support. The strain measurements must all be taken at points distant
from structural and loading discontinuities to ensure that they are not influenced by local bending, so that interesting questions about local 'switch' loadings cannot be explored.
The membrane strains are strains at the middle surface of the shell, which are not easily measured directly. The strains which can easily be measured (surface strains on the outside and inside) are strongly affected by bending strains, which can be very large wherever local bending occurs. In unsymmetrically loaded silos with fabrication imperfections, plate thickness changes and stiffners, local bending occurs in very many places ~, often in the very zones where the most dramatic pressure peaks ale observed (e.g. near the hopper transition). Thus it seems to be a good general rule that both bending and membrane strains should always be measured at every station, even if the membrane strains alone are to be used to infer the pressure distri- bution.
Both experimental 12-16 and theoretical 8'17 studies indicate that the pressure patterns occurring in eccentrically dis- charging silos, or even in silos with minor unsymmetrical features, can be highly unsymmetrical. In these circum- stances, the number of observations required to characterise the pattern sufficiently - - even to understand the behaviour qualitatively ~ 6 I is very large.
If the measured strains on an unsymmetrically loaded shell are to be accurately translated into inferred wall press- ures, the complete state of strain at any point on the wall must usually be considered. This complete state may be described in terms of six components (three membrane strains and three curvatures; or three strain components on each of the two surfaces). These six measures are needed at every station for every time step of the test.
Unfortunately, measurement of these six components normally means that rosette gauges must be placed on the inside surface of the silo wall (see, for example, Reference 6). An internal gauge inevitably causes a bump imperfec- tion over which the stored bulk solid slides, which may in turn dramatically affect the local value of pressure 18, lead- ing to a serious misinterpretation of the real pressure regime. The wires from the gauges must also be brought out of the silo, and these may interfere further with solids flow. In addition, correct translation of the measured strains into wall pressures involves a set of complicated structural analyses, which are essential if the inferred pressures are required to any useful accuracy under unsymmetrical load- ing patterns.
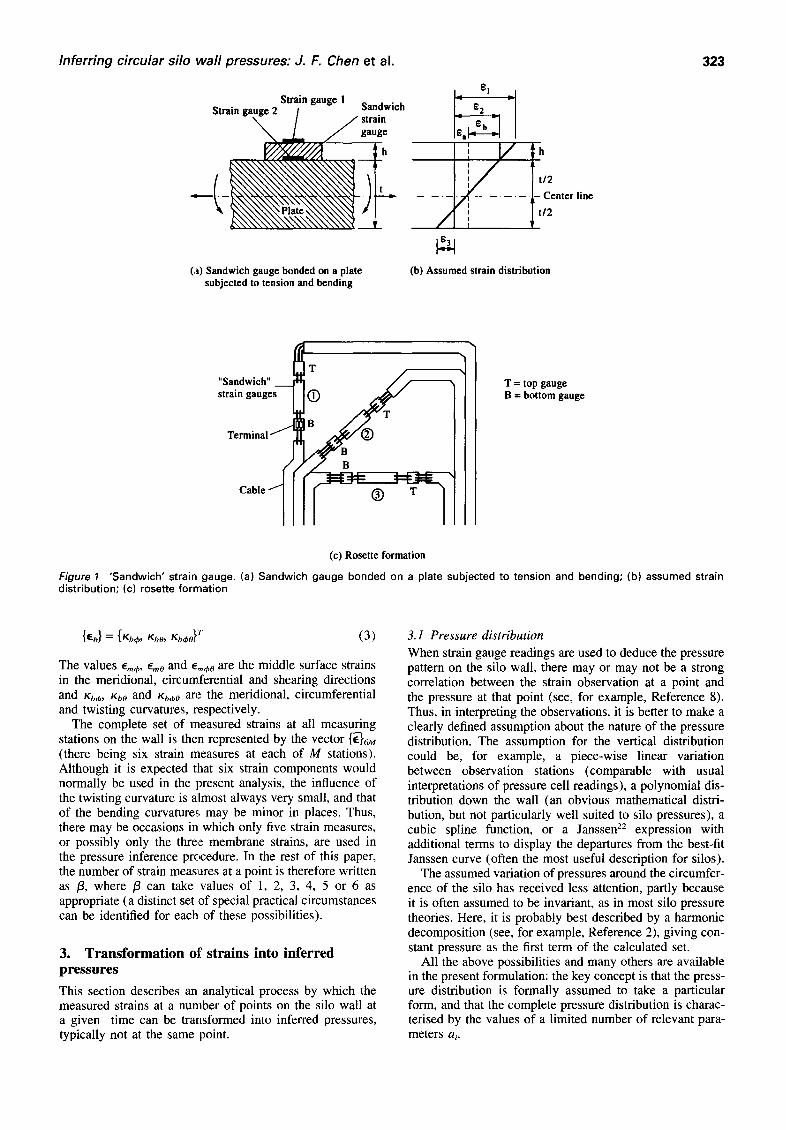
One remedy to the above dilemma is to use 'sandwich' or 'double deck' strain gauges (Figure l (a)) 19'2°, which can be placed on one surface but which measure both the local surface strain and - - by extrapolation - - the bending strain or curvature (Figure l(b)). The conditions under which these sandwich gauges are used are restricted to minimise local stiffening of the wall and shear lag in the readings2L A rosette of sandwich strain gauges can be set up at each measuring site to obtain the six measures of strain (Figure 1(c)).
The six strain measures are here represented by the vector
{~T = {Era, Eb} T ( l i
in which the membrane strains {era} are given by the vector
{Em} = {Ernf9 , EmO , Em~O} T (2)
and the bending curvatures by the vector
Inferr ing circular si lo wal l pressures: J. F. Chen et al.
Strain g a ~
I_ ~l _1 Strain gauge 1 Sandwich r s -I
/ / s t r a i n / gauge 16.1"~=-~ I
~(~//~/'/~ ___~h I J V
t - . . . . . . . J/ / t / ! Center line M\\\\\\\\\\\ '~ __L / I I t/2
(a) Sandwich gauge bonded on a plate subjected to tension and bending
(b) Assumed strain distribution
323
"Sandwich" strain gauges
Terminal /
Cable ® T
T = top gauge B = bottom gauge
(c) Rosette formation
Figure 1 'Sandwich' strain gauge. (a) Sandwich gauge bonded on a plate subjected to tension and bending; (b) assumed strain distribution; (c) rosette formation
{ M = {Kb~, K~o, ~ 0 } T (3)
The values em,~, e,,o and e,,60 are the middle surface strains in the meridional, circumferential and shearing directions and Kb+, KbO and Kbe~O an~ the meridional, circumferential and twisting curvatures, respectively.
The complete set of measured strains at all measuring stations on the wall is then represented by the vector {'~}6M (there being six strain measures at each of M stations). Although it is expected [hat six strain components would normally be used in the present analysis, the influence of the twisting curvature is almost always very small, and that of the bending curvatures may be minor in places. Thus, there may be occasions in which only five strain measures, or possibly only the three membrane strains, are used in the pressure inference procedure. In the rest of this paper, the number of strain measures at a point is therefore written as /3, where /3 can take values of 1, 2, 3, 4, 5 or 6 as appropriate (a distinct set of special practical circumstances can be identified for each of these possibilities).
3. T r a n s f o r m a t i o n o f s tra ins into in ferred p r e s s u r e s
This section describes an analytical process by which the measured strains at a number of points on the silo wall at a given time can be transformed into inferred pressures, typically not at the same point.
3. l Pressure distribution
When strain gauge readings are used to deduce the pressure pattern on the silo wall, there may or may not be a strong correlation between the strain observation at a point and the pressure at that point (see, for example, Reference 8). Thus, in interpreting the observations, it is better to make a clearly defined assumption about the nature of the pressure distribution. The assumption for the vertical distribution could be, for example, a piece-wise linear variation between observation stations (comparable with usual interpretations of pressure cell readings), a polynomial dis- tribution down the wall (an obvious mathematical distri- bution, but not particularly well suited to silo pressures), a cubic spline function, or a Janssen 22 expression with additional terms to display the departures from the best-fit Janssen curve (often the most useful description for silos).
The assumed variation of pressures around the circumfer- ence of the silo has received less attention, partly because it is often assumed to be invariant, as in most silo pressure theories. Here, it is probably best described by a harmonic decomposition (see, for example, Reference 2), giving con- stant pressure as the first term of the calculated set.
All the above possibilities and many others are available in the present formulation: the key concept is that the press- ure distribution is formally assumed to take a particular form, and that the complete pressure distribution is charac- terised by the values of a limited number of relevant para- meters ai.
324 Inferring circular silo wall pressures: J. F. Chen et al.
To implement this procedure, the pressure distribution in the silo is first characterised as
N
p , (O,z) : ~ a~(O,z) (4a) i I
2 N
p,,(O,z)= ~ a~_N(O,z) (4b) i = N + 1
3 N
Po (O,z) = ~ a Ji-eu(O,z) (4c) i 2N+l
in which the variables p,, p,. and Po represent the normal wall pressure, the vertical wall frictional traction, and the circumferential wall frictional traction at any point. The functionsfj,f2,... ,fu are used to represent the assumed vari- ation of normal pressure and the loading coefficients al, a2,..., a N define the magnitude of each normal pressure term. The coefficients aN+t,..., a2u define the local vertical component of the wall frictional traction, whilst aaN+l , . . . ,
a3N define the horizontal (circumferential) frictional component.
Where this analysis is applied to a problem in which there is no wall friction, only the terms of equation (4a) are required. Similarly, in a silo with completely axisym- metric wall loads, only the terms of equations (4a) and (4b) are needed. Thus, in the remainder of this paper, a gener- ality of description is retained by defining the number of unknown parameters a i as c~N, where a can take the value of 1, 2 or 3 as appropriate. It may be noted that the loading terms represented by equation (4c) do not appear to have been included in any previous theoretical or experimental work on silo pressures.
3.2 Structural analysis o f the silo
Since the strains measured on the silo wall are not direct measures of the wall pressure, a structural analysis is needed to relate the measured strains to the inferred press- ure distribution. If the structural behaviour is assumed to be very simple, with pressures related to wall strains through
°'0 = 1 2 ~ (co+v%) and 0-0 = pR/t, a structural analysis
is still being used, though this analysis is trivially simple and is often in serious error.
The possible forms of structural analysis which could be applied in the present work include the membrane theory of shells 23 and the linear bending theory of shells 24. If the membrane theory of shells is applied to shells under non- symmetric loads, it yields only membrane strains for a given pressure distribution, and ignores the membrane strains arising from bending of the shell; nevertheless, it may be adequate if all the strain observations are distant from sources of local bending (e.g. there are no rapid changes in the pressure distribution) and the shell support is uniform.
The bending theory of shells is much more complicated, and simple algebraic solutions of practical relevance to unsymmetrical loading distributions cannot - - in general - - be obtained. The bending theory does include all the phenomena of local bending. However, it suffers from the disadvantage that the bending strains which are calcu- lated in many places may be only weakly influenced by the pressure distribution parameters being sought, making the
inversion of the relevant matrix in the next section very difficult. For this reason, it is desirable that the technique presented here for interpreting pressures from strain read- ings includes some weighting features which permit the interpretation process to place more emphasis on some observations than on others.
The structural analysis consists of several steps: first the load must be defined as in equation (4), which indicates the target pressure distribution. The parameters ai, a2,..., aau each define the amplitude of a pressure distribution of a certain shape. For each of these a N pressure distributions, a separate structural analysis must be conducted to deter- mine the complete state of strain which that distribution would induce at each of the locations in the shell at which the strains have been measured. To achieve this using the bending theory of shells, it is easiest to use a finite element analysis, which can include all necessary boundary con- ditions, stiffeners, adjacent structural elements, etc. The wall stress resultants (three membrane stress resultants and three bending moments) are calculated at each gauge location by finite element analysis. These must then be transformed into stretching and bending strains at the gauge location using the constitutive equations for the shell. Alter- natively, the wall strains are calculated directly from the displacements using the element strain-displacement relationships.
The aN structural analyses produce M sets of/3 strains {¢} (there being M gauge locations with/3 gauges at each), induced by each of c~N pressure distributions, giving the equation set
{IE}I3M : [S]~3Mx~ N {a},~N ( 5 )
in which [S] is here termed the sensitivity matrix, and the element S o is the value of the strain Ei which is caused by the load (equation (4)) when aj = 1 and all other load parameters equal zero.
Equation (5) is the foundation of the following process for deducing pressures from the strain gauge readings.
3.3 Inversion of pressure-strain relations with error minimisation
The above analyses produce a total of M sets of /3 strain measures on the silo walls. The vector of observed strains in the silo test {~} is given by:
{ ~ M = [~, ~2,...~M] r (6)
The goal of the present analysis is to find the load para- meter vector {a} which has minimum errors in predicting the observations. To obtain this vector, a related vector of strains associated with {a} is defined as the vector of expected strains {~}. The discrepancies between the strain observations vector {~} and the expected strain vector {c} may then be expressed as an error vector {e}
{e} = [ S } {a} - {~}. - ( 7 )
The statistical processing of the observations seeks to minimise the error vector {e}. This is achieved in a least- squares manner by first expressing the errors as a target function.
E = {e} T [W] {e} (8)
Inferring circular silo wall pressures: J. F. Chen et al. 3 2 5
in which [W] is a weighting matrix. If the weighting matrix is set as a unit matrix [I], the target function becomes sim- ply the sum of the squares of the individual errors. The use of the weighting matrix permits different emphasis to be placed on different observations. The vector {a} can now be found by minimising equation (8) as
8E - 0 (9)
which leads to
{a} = ( [S] r [ W ] [S] ) - ' [S] r [ W ] {E} (I0)
which can be written more succinctly as
{a} = [U] {E} ( 11 )
in which the influence matrix [U] is given by
[u] = ([s] ~ [ w ] [s ] ) - ' IS] ~ [ w ] (12)
to verify the use of the technique for complex unsymmetri- cal loading conditions. The results of the interpretation of unsymmetrical strains observed in silo experiments are pre- sented elsewhere 1°, and are not shown here because of space restrictions.
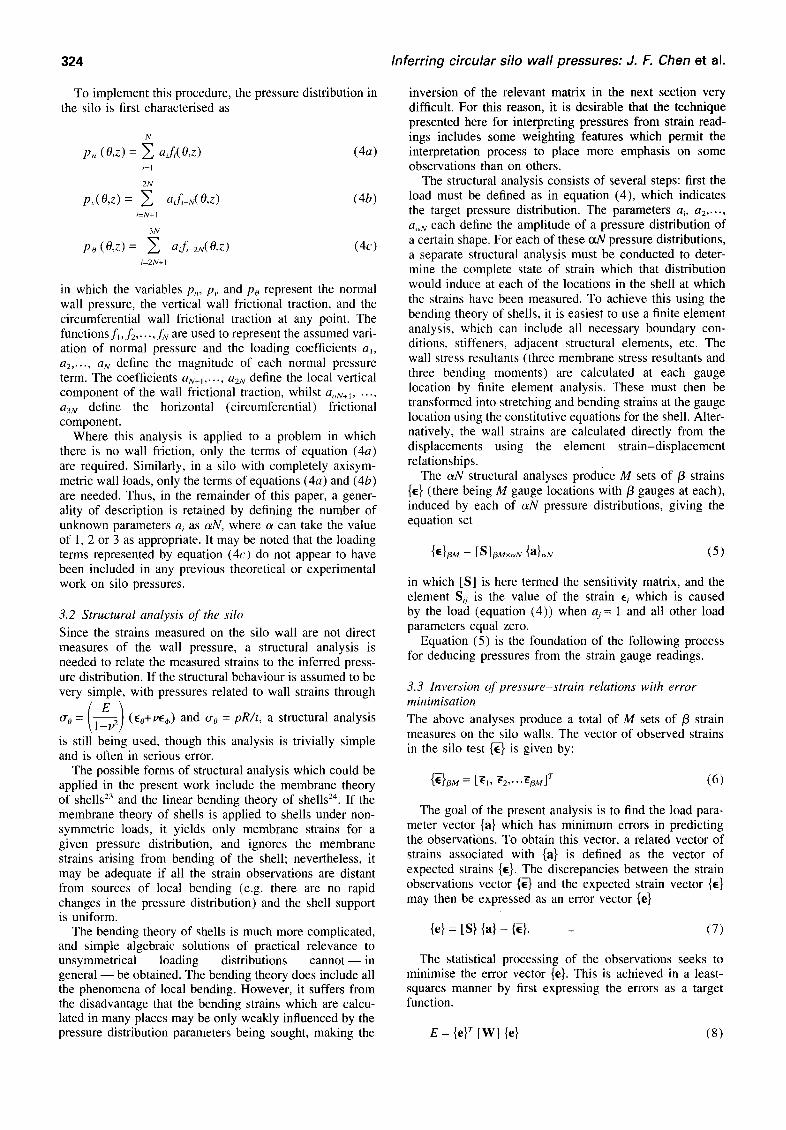
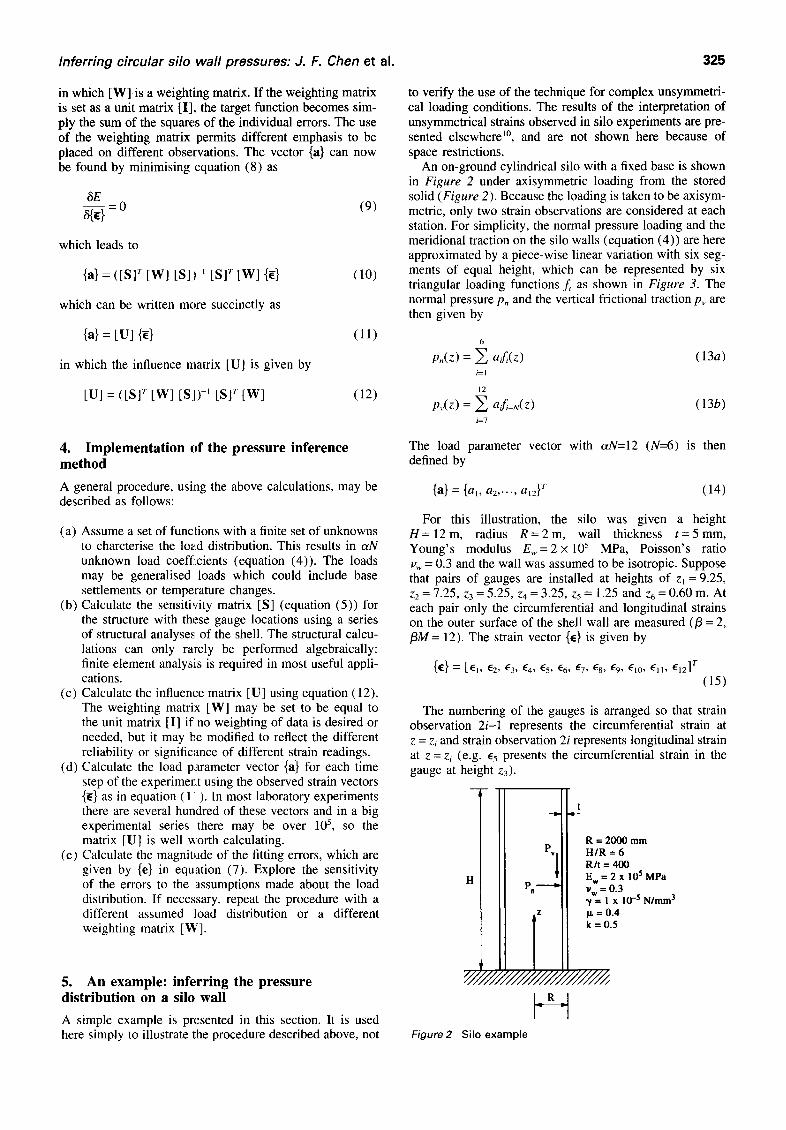
An on-ground cylindrical silo with a fixed base is shown in Figure 2 under axisymmetric loading from the stored solid (Figure 2). Because the loading is taken to be axisym- metric, only two strain observations are considered at each station. For simplicity, the normal pressure loading and the meridional traction on the silo walls (equation (4)) are here approximated by a piece-wise linear variation with six seg- ments of equal height, which can be represented by six triangular loading functions f~ as shown in Figure 3. The normal pressure Pn and the vertical frictional traction Pv are then given by
6
p,(z) = ~ a.fi(z) (13a) i=l
12
p~(z) = ~ a~_~z) (13b) /--7
4. I m p l e m e n t a t i o n o f t h e p r e s s u r e i n f e r e n c e m e t h o d
A general procedure, using the above calculations, may be described as follows:
(a) Assume a set of functions with a finite set of unknowns to charcterise the load distribution. This results in aN unknown load coefficients (equation (4)). The loads may be generalised loads which could include base settlements or temperature changes.
(b) Calculate the sensitivity matrix IS] (equation (5)) for the structure with these gauge locations using a series of structural analyses of the shell. The structural calcu- lations can only rarely be performed algebraically: finite element analysJ:s is required in most useful appli- cations.
(c) Calculate the influence matrix [U] using equation (12). The weighting matrix [W] may be set to be equal to the unit matrix [I] if no weighting of data is desired or needed, but it may be modified to reflect the different reliability or significance of different strain readings.
(d) Calculate the load parameter vector {a} for each time step of the experiment using the observed strain vectors {~} as in equation ( 1 i[ ). In most laboratory experiments there are several hundred of these vectors and in a big experimental series there may be over 105 , so the matrix [U] is well worth calculating.
(e) Calculate the magnitude of the fitting errors, which are given by {e} in equation (7). Explore the sensitivity of the errors to the assumptions made about the load distribution. If necessary, repeat the procedure with a different assumed load distribution or a different weighting matrix [W].
5. A n e x a m p l e : i n f e r r i n g t h e p r e s s u r e d i s t r i b u t i o n o n a s i l o w a l l
A simple example is presented in this section. It is used here simply to illustrate the procedure described above, not
The load parameter vector with aN=12 (N=6) is then defined by
( a } = {al, a2, . . . , a,2} r ( 1 4 )
For this illustration, the silo was given a height H - - 1 2 m , radius R = 2 m , wall thickness t = 5 m m , Young's modulus Ew=2×10⁵ MPa, Poisson's ratio vw = 0.3 and the wall was assumed to be isotropic. Suppose that pairs of gauges are installed at heights of Zl = 9.25, z2 = 7.25, z3 = 5.25, z4 = 3.25, z5 = 1.25 and z6 = 0.60 m. At each pair only the circumferential and longitudinal strains on the outer surface of the shell wall are measured (/3 = 2, /3M = 12). The strain vector {~} is given by
{E} = [E~, E 2, E 3, E4, %, %, e7, %, E9, Elo, Ell, El2] r (15)
The numbering of the gauges is arranged so that strain observation 2i-1 represents the circumferential strain at z = z/and strain observation 2i represents longitudinal strain at z = zi (e.g. E5 presents the circumferential strain in the gauge at height z3).
t
R = 2000 mm Pv HIR = 6
R/t = 400 E w = 2 x 10⁵ MPa
v w = 0.3 ~, = l x 10 -5 N/ram 3 p, =0.4 k=0.5
Figure2 Silo example
326
Figure3 Load functions
n
(n-2) ~n
Inferr ing circular silo wal l pressures: J. F. Chen et al.
z z z
IB
rl 11
rl 11
(n-i-l)~n
{ l-i+.(l-z/H) fi(z) = l + i - n ( I - z / H )
0
f. fn-I
( n - i ) H / n < z_<(n-i + l )H/n
( n - i - l ) H / n < z < ( n - i ) H / n elsewhere
The measured strain at each gauge is a linear function of the load parameters (equation (14)), and the coefficients in the matrix of these linear relationships are known as the sensitivity functions (for each strain with respect to each loading parameter). These sensitivity functions were evalu- ated using the FELASH suite of finite element programs for the analysis of axisymmetric shells 25 with 12 load cases as shown in Figure 3 (with p, =fj for i = 1, 6 and pv =f~-6 for i=7 , 12),
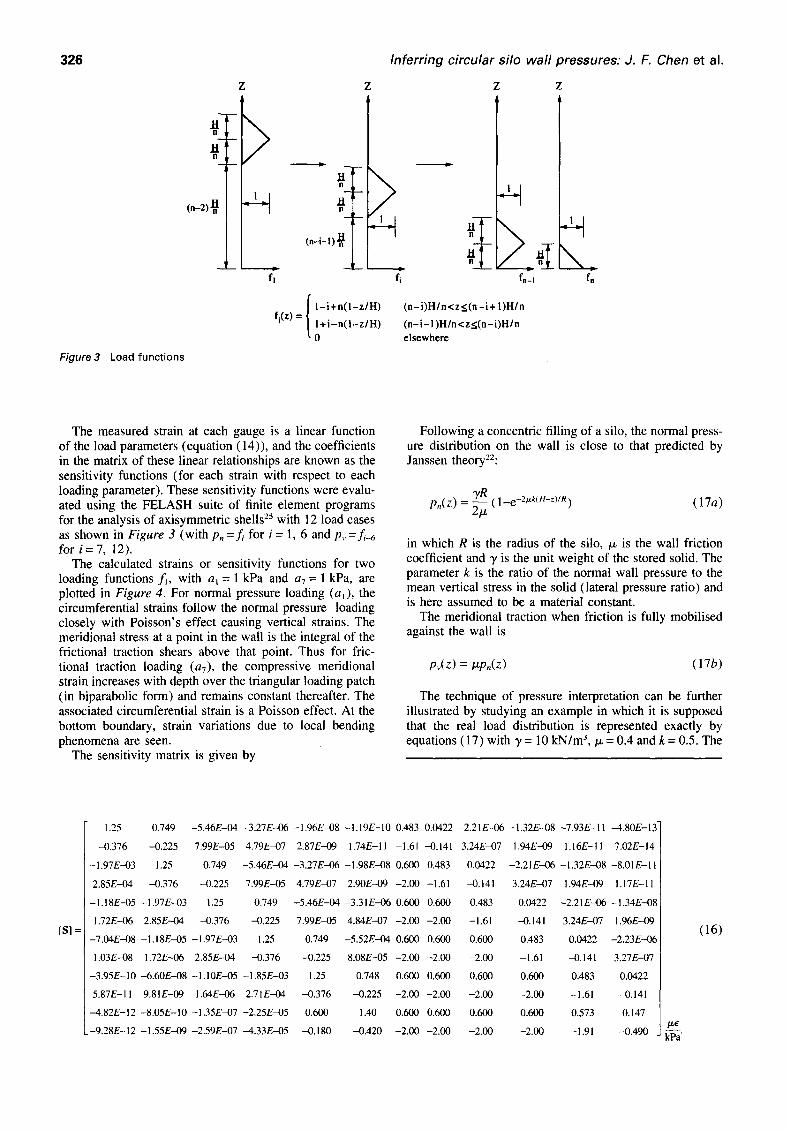
The calculated strains or sensitivity functions for two loading functions f~, with at = 1 kPa and a7 = 1 kPa, are plotted in Figure 4. For normal pressure loading (a~), the circumferential strains follow the normal pressure loading closely with Poisson's effect causing vertical strains. The meridional stress at a point in the wall is the integral of the frictional traction shears above that point. Thus for fric- tional traction loading (a7), the compressive meridional strain increases with depth over the triangular loading patch (in biparabolic form) and remains constant thereafter. The associated circumferential strain is a Poisson effect. At the bottom boundary, strain variations due to local bending phenomena are seen.
The sensitivity matrix is given by
Following a concentric filling of a silo, the normal press- ure distribution on the wall is close to that predicted by Janssen theory22:
p,(z) = ~ ( 1 "-e-2tzk(H-z)/R) (17a)
in which R is the radius of the silo, ~ is the wall friction coefficient and 3/is the unit weight of the stored solid. The parameter k is the ratio of the normal wall pressure to the mean vertical stress in the solid (lateral pressure ratio) and is here assumed to be a material constant.
The meridional traction when friction is fully mobilised against the wall is
Pv(Z) = ~pn(Z) ( 1 7 b )
The technique of pressure interpretation can be further illustrated by studying an example in which it is supposed that the real load distribution is represented exactly by equations (17) with 3/= 10 kN/m 3,/x = 0.4 and k = 0.5. The
[S] =
1.25 0.749 -5.46E-04 -3.27E--06 -1.96E-08 -I .19E-10 0.483
-0.376 --0.225 7.99E-05 4.79E-07 2.87E-09 1.74E-11 -I.61
-1.97E--03 1.25 0.749 -5.46E-04 -3.27E--06 -1.98E-08 0.600
2.85E-04 -0.376 -0.225 7.99E-05 4.79E-07 2.90E--09 -2.00
-I .18E-05 -1.97E-03 1.25 0.749 -5.46E-04 -3.31E-06 0.600
1.72E--06 2.85E--04 -0.376 -0.225 7.99E-05 4.84E-07 -2.00
-7.04E-08 -I .18E-05 -1.97E-03 1.25 0.749 -5.52E-04 0.600
1.03E-08 1.72E-06 2.85E--04 -0.376 -0.225 8.08E-05 -2.00
-3.95E-10 -6.60E-08 -1.10E-05 -1.85E-03 1.25 0.748 0.600
5.87E-11 9.81E-09 1.64E-06 2.71E-04 -0.376 -0.225 -2.00
--4.82E-12 -8.05E-10 -1.35E-07 -2.25E-05 0.600 1.40 0.600
-9.28E-12 -1.55E-09 -2.59E-07 -4.33E-05 -0.180 -0.420 -2.00
0.0422 -2.21E-06 -1.32E-08 -7.93E-11 -4.80E-13"
--0.141 3.24EM)7 1.94E-09 1.16E-I 1 7.02E-14
0.483 0.0422 -2.21E--06 -1.32E-08 -8.01E-11
-1.61 --0.141 3.24E-07 1.94E--09 1.17E-11
0.600 0.483 0.0422 -2.21E-06 -1.34E-08
-2.00 -1.61 -0.141 3.24E-07 1.96E--09
0.600 0.600 0.483 0.0422 -2.23E-06
-2.00 -2.00 -1.61 -0.141 3.27E-07
0.600 0.600 0.600 0.483 0.0422
-2.00 -2.00 -2.00 -1.61 -0.141
0.600 0.600 0.600 0.573 0.147
-2.00 -2.00 -2.00 -1.91 --0.490
(16)
kPa"
Inferring circular silo wall pressures: J. F. Chen et al. 327
1.0
0.9
0.8
0.7 N
0.6 ¢ -
-~ 0.5
0.4
0.3
0.2
0.1
0 -~.5 -~.0
, . c i r c u m f e r e n t i a i s t rain for [ normal pressure al = lkPa /
-Mer id iona l s t rain for [ normal pressure al = lkPa /
- - -~ -~Ci rcumferen t i a l s train for / vert ical t ract ion a 7 = lkPa
- - - , - - -Mer id iona l s t rain for / vert ical traction a 7 -- l kPa |
~1.5
Figure 4 Distribution of sensitivity functions
-1.0 -0.5 0 0.5 1.0 1.5 2.0
Sensi t iv i ty funct ion (Ix~/kPa)
exact strains which woLdd be observed at each gauge location may be calculated numerically as
= 1 0 4 × [23.06,-12.69,35.71,-26.04,46.18,
-41.57,55.17,-58.58,63.17,
-76.58,65.58,-82.56] r
(18)
which are here treated as the observed strains. The above technique may now be applied to these 'observed' strains to see how satisfactory the procedure is in inferring the 'known' Janssen distribution under perfect conditions and when experimental errors are present.
The load parameter vector {a} was found by applying equation (11) (which describes the load distribution as piece-wise linear) to {-~}, and resulted in
{a} = [ 8.54,13.97,17.60,20.06,21.66,22.78,
3.46,5.56,7.02,8.01,8.68,9.05 ]r kPa (19)
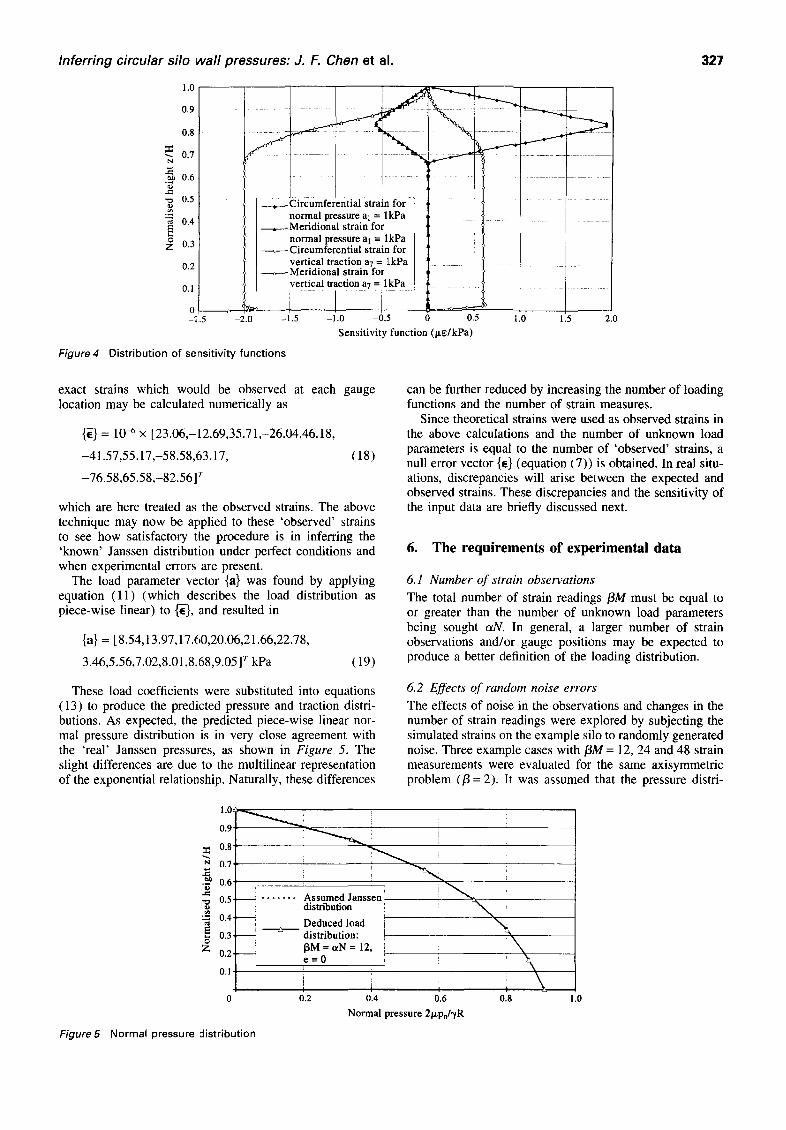
These load coefficients were substituted into equations (13) to produce the predicted pressure and traction distri- butions. As expected, the predicted piece-wise linear nor- mal pressure distribution is in very close agreement with the 'real' Janssen pressures, as shown in Figure 5. The slight differences are due to the multilinear representation of the exponential relationship. Naturally, these differences
can be further reduced by increasing the number of loading functions and the number of strain measures.
Since theoretical strains were used as observed strains in the above calculations and the number of unknown load parameters is equal to the number of 'observed' strains, a null error vector {~} (equation (7)) is obtained. In real situ- ations, discrepancies will arise between the expected and observed strains. These discrepancies and the sensitivity of the input data are briefly discussed next.
6. The requirements of experimental data
6.1 Number of strain observations
The total number of strain readings /3M must be equal to or greater than the number of unknown load parameters being sought o~N. In general, a larger number of strain observations and/or gauge positions may be expected to produce a better definition of the loading distribution.
6.2 Effects of random noise errors
The effects of noise in the observations and changes in the number of strain readings were explored by subjecting the simulated strains on the example silo to randomly generated noise. Three example cases with/3M = 12, 24 and 48 strain measurements were evaluated for the same axisymmetric problem (/3 = 2). It was assumed that the pressure distil-
Z
1.0-'
0 .9
0.8'
0.7
0.6"
0.5'
0.4~
0.3:
0 .2 [
0.1,
. . . . . . . A s s u m e d J a n s s e n distribution
D e d u c e d load distr ibution: 13M = a N = 12, e = 0 J
I I
0 0.2 0.4 0.6
Figure 5 Normal pressure distribution
\
0.8 1.0
Normal pressure 2p, p./~/R
328 Inferring circular silo wall pressures: J. F. Chen et al.
Figure 6
::L
607
40
20
0
- 2 0
- 4 0
- 6 0
I i r i
[ C i r c u m f e r e n t i a l s t r a in i /
I a t z = 5 . 2 5 m i
! - - M e r i d i o n a l s t r a i n : i , a t z = 5 . 2 5 m I
0 30 60 90 120 150
T i m e
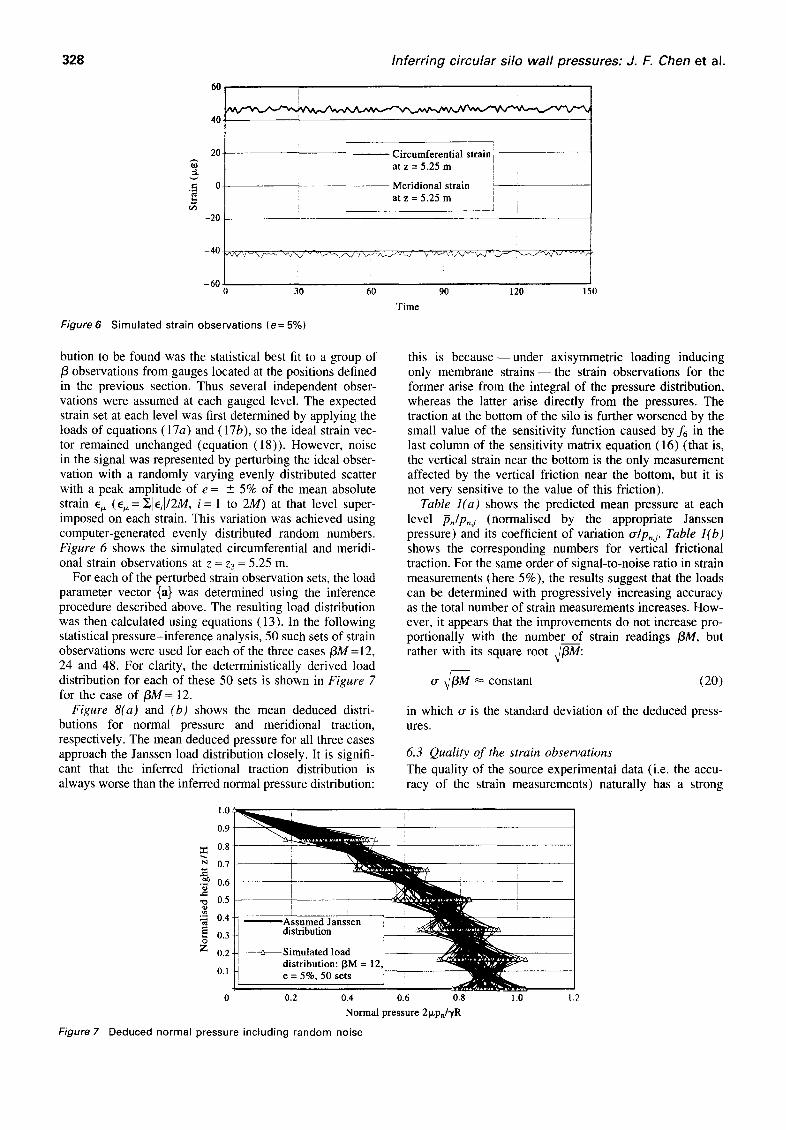
Simulated strain observations (e= 5%)
bution to be found was the statistical best fit to a group of /3 observations from gauges located at the positions defined in the previous section. Thus several independent obser- vations were assumed at each gauged level. The expected strain set at each level was first determined by applying the loads of equations (17a) and (17b), so the ideal strain vec- tor remained unchanged (equation (18)). However, noise in the signal was represented by perturbing the ideal obser- vation with a randomly varying evenly distributed scatter with a peak amplitude of e = + 5% of the mean absolute strain % (E, = XIE, I/2M, i-- 1 to 2M) at that level super- imposed on each strain. This variation was achieved using computer-generated evenly distributed random numbers. Figure 6 shows the simulated circumferential and meridi- onal strain observations at z -- z3 = 5.25 m.
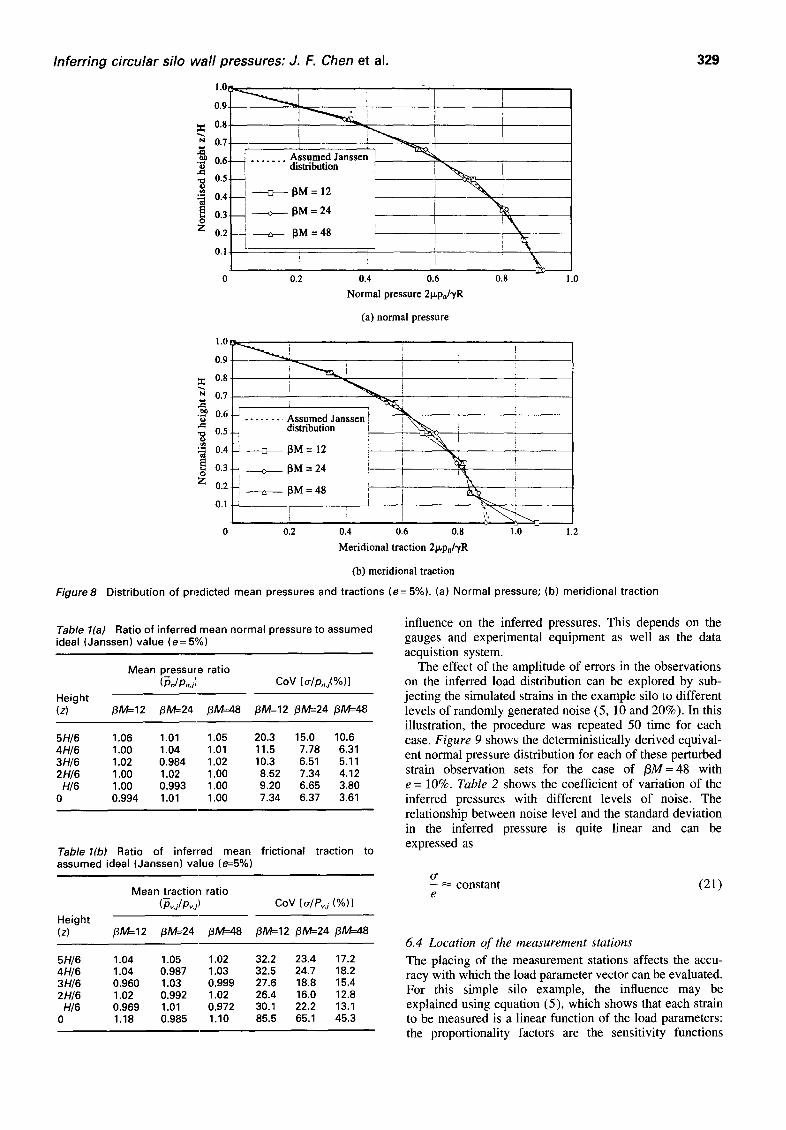
For each of the perturbed strain observation sets, the load parameter vector {a} was determined using the inference procedure described above. The resulting load distribution was then calculated using equations (13). In the following statistical pressure-inference analysis, 50 such sets of strain observations were used for each of the three cases/3M =12, 24 and 48. For clarity, the deterministically derived load distribution for each of these 50 sets is shown in Figure 7 for the case of/3M-- 12.
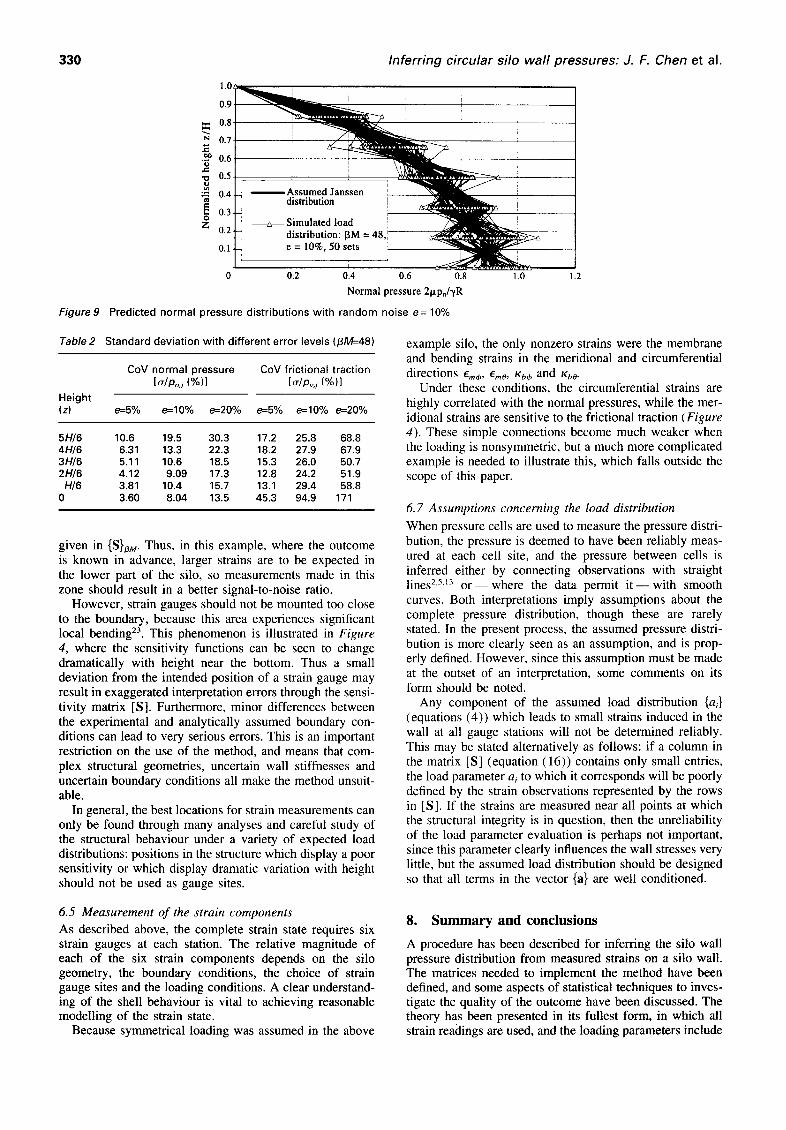
Figure 8(a) and (b) shows the mean deduced distri- butions for normal pressure and meridional traction, respectively. The mean deduced pressure for all three cases approach the Janssen load distribution closely. It is signifi- cant that the inferred frictional traction distribution is always worse than the inferred normal pressure distribution:
this is because- -under axisymmetric loading inducing only membrane s t r a i n s - the strain observations for the former arise from the integral of the pressure distribution, whereas the latter arise directly from the pressures. The traction at the bottom of the silo is further worsened by the small value of the sensitivity function caused by f6 in the last column of the sensitivity matrix equation (16) (that is, the vertical strain near the bottom is the only measurement affected by the vertical friction near the bottom, but it is not very sensitive to the value of this friction).
Table l(a) shows the predicted mean pressure at each level ~.lp.j (normalised by the appropriate Janssen pressure) and its coefficient of variation tr/pnj. Table l(b) shows the corresponding numbers for vertical frictional traction. For the same order of signal-to-noise ratio in strain measurements (here 5%), the results suggest that the loads can be determined with progressively increasing accuracy as the total number of strain measurements increases. How- ever, it appears that the improvements do not increase pro- portionally with the number of strain readings tiM, but rather with its square root ~/3M:
o- x//3M ~ constant (20)
in which tr is the standard deviation of the deduced press- ures.
6.3 Quality of the strain observations The quality of the source experimental data (i.e. the accu- racy of the strain measurements) naturally has a strong
1 . 0
0.9
= o.sp !~-~~ "~ 0 " 7 ~ I Iz
0 . 6 ~ ~ !
0.5 i i • - 0.4 A s s u m e d J a n s s e n :
03 i ,s ibu.on
° i Z 0.2 ~ - - - - S i r n u l a t e d l o a d i d i s t r i b u t i o n : 13M = 12,:
e = 5 % , 5 0 s e t s 0.1
0 0.2 0.4 0.6 0.8
N o r m a l p r e s s u r e 21xpn/~,R
1.0 1.2
Figure 7 Deduced normal pressure including random noise
Inferring circular silo wall pressures: J. F. Chen et al.
1.0t ! ,
08 1
0.7 e ~ t A ed n . . . . . . .
0 " 5 i + ~M = 12 ~ ' ~
0.3.
0.2--~ ~ 13M = 48 i " ~
01 t ~
1.0
=
z= '5 ,==
=o t~
C Z
0.2 0.4 0.6 0.8
Normal pressure 2p, pn/3,R
0.9
0.8
"~ 0.7
0.6 ,m
0.5
'-- 0.4
0.3 0
Z 0.2
0.1
(a) normal pressure
. . . . . . . . Assumed Janssen i distribution
13M = ]2
~M = 24 I
~M = 48
I i
1.0
0 0.2 0.4 0.6 0.8 1.0 1.2
Figure 8
Meridional traction 2p, pn/~/R
(b) meridional traction
Distribution of predicted mean pressures and tractions (e= 5%). (a) Normal pressure; (b) meridional traction
329
Table l(a) Ratio of inferred mean normal pressure to assumed ideal (Janssen) value (e= 5%)
Mean pressure ratio (-~./p..j}, CoY [(~/p..,~ %)]
Height (z) /3M=-12 /3M=24 /3M--48 /3M=-12 /3M=-24 /3M=-48
5H/6 1.06 1.01 1.05 20.3 15.0 10.6 4H/6 1.00 1.04 1.01 11.5 7.78 6.31 3H/6 1.02 0.984 1.02 10.3 6.51 5.11 2H/6 1.00 1.02 1.00 8.52 7.34 4.12
H/6 1.00 0.993 1.00 9.20 6.65 3.80 0 0.994 1.01 1.00 7.34 6.37 3.61
Table l(b) Ratio of inferred mean frictional traction to assumed ideal (Janssen) value (~5%)
Mean traction ratio (-Pv,j/ Pv,j) CoV [ cr/ Pv, i (%)1
Height (z) /3M=-12 /3M=24 /3M-~8 /3M=-12 /3M=24 /3M=-48
5H/6 1.04 1.05 1.02 32.2 23.4 17.2 4H/6 1.04 0.987 1.03 32.5 24.7 18.2 3H/6 0.960 1.03 0.999 27.6 18.8 15.4 2H/6 1.02 0.992 1.02 26.4 16.0 12.8
H]6 0.969 1.01 0.972 30.1 22.2 13.1 0 1.18 0.985 1.10 85.5 65.1 45.3
influence on the inferred pressures. This depends on the gauges and experimental equipment as well as the data acquistion system.
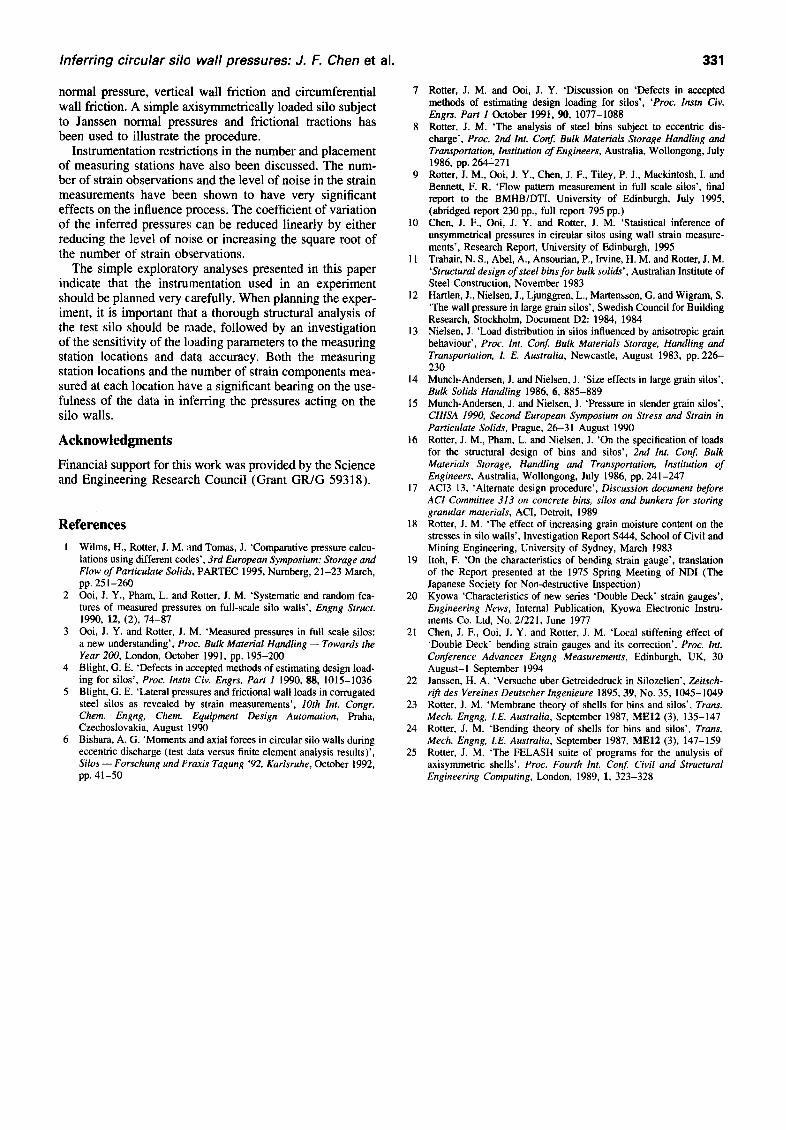
The effect of the amplitude of errors in the observations on the inferred load distribution can be explored by sub- jecting the simulated strains in the example silo to different levels of randomly generated noise (5, 10 and 20%). In this illustration, the procedure was repeated 50 time for each case. Figure 9 shows the deterministically derived equival- ent normal pressure distribution for each of these perturbed strain observation sets for the case of /3M=48 with e = 10%. Table 2 shows the coefficient of variation of the inferred pressures with different levels of noise. The relationship between noise level and the standard deviation in the inferred pressure is quite linear and can be expressed as
o" - ~ constant (21) e
6.4 Location of the measurement stations
The placing of the measurement stations affects the accu- racy with which the load parameter vector can be evaluated. For this simple silo example, the influence may be explained using equation (5), which shows that each strain to be measured is a linear function of the load parameters: the proportionality factors are the sensitivity functions
330 Inferring circular silo wall pressures: J. F. Chen et al.
1.0_~
0.9.
0.8~
0.7
.~ 0.6 0.5
:.= 0.4
0.3 0 Z 0.2
0.1
i Assumed Janssen I distribution !
Simulated load i distribution: [$M = 48,1 e = 10%, 50 sets
Figure 9
0 0.2 0.4 0.6 0.8
Normal pressure 2p, pn/3'R
Predicted normal pressure distr ibutions with random noise e= 10%
1.0 1.2
Table 2 Standard deviation with different error levels (/3M=-48)
CoV normal pressure CoY frictional traction [~/P.,i (%)] [~/Pv,j (%)]
Height (z) e=5% e=-10% e=20% e=5% e=10% e=20%
5H/6 10.6 19.5 30.3 17.2 25.8 68.8 4H/6 6.31 13.3 22.3 18.2 27.9 67.9 3H/6 5.11 10.6 18.5 15.3 26.0 50.7 2H/6 4.12 9.09 17.3 12.8 24.2 51.9 HI6 3.81 10.4 15.7 13.1 29.4 58.8
0 3.60 8.04 13.5 45.3 94.9 171
given in {S}eM. Thus, in this example, where the outcome is known in advance, larger strains are to be expected in the lower part of the silo, so measurements made in this zone should result in a better signal-to-noise ratio.
However, strain gauges should not be mounted too close to the boundary, because this area experiences significant local bending 23. This phenomenon is illustrated in Figure 4, where the sensitivity functions can be seen to change dramatically with height near the bottom. Thus a small deviation from the intended position of a strain gauge may result in exaggerated interpretation errors through the sensi- tivity matrix [S]. Furthermore, minor differences between the experimental and analytically assumed boundary con- ditions can lead to very serious errors. This is an important restriction on the use of the method, and means that com- plex structural geometries, uncertain wall stiffnesses and uncertain boundary conditions all make the method unsuit- able.
In general, the best locations for strain measurements can only be found through many analyses and careful study of the structural behaviour under a variety of expected load distributions: positions in the structure which display a poor sensitivity or which display dramatic variation with height should not be used as gauge sites.
example silo, the only nonzero strains were the membrane and bending strains in the meridional and circumferential d i r e c t i o n s Emdo, ~'mO, Kbd~ and Kh0.
Under these conditions, the circumferential strains are highly correlated with the normal pressures, while the mer- idional strains are sensitive to the frictional traction (Figure 4). These simple connections become much weaker when the loading is nonsymmetric, but a much more complicated example is needed to illustrate this, which falls outside the scope of this paper.
6. 7 Assumptions concerning the load distribution When pressure cells are used to measure the pressure distri- bution, the pressure is deemed to have been reliably meas- ured at each cell site, and the pressure between cells is inferred either by connecting observations with straight lines 2,5,~3 o r - - w h e r e the data permit i t - - w i t h smooth curves. Both interpretations imply assumptions about the complete pressure distribution, though these are rarely stated. In the present process, the assumed pressure distri- bution is more clearly seen as an assumption, and is prop- erly defined. However, since this assumption must be made at the outset of an interpretation, some comments on its form should be noted.
Any component of the assumed load distribution {ai} (equations (4)) which leads to small strains induced in the wall at all gauge stations will not be determined reliably. This may be stated alternatively as follows: if a column in the matrix [S] (equation (16)) contains only small entries, the load parameter ai to which it corresponds will be poorly defined by the strain observations represented by the rows in [S]. If the strains are measured near all points at which the structural integrity is in question, then the unreliability of the load parameter evaluation is perhaps not important, since this parameter clearly influences the wall stresses very little, but the assumed load distribution should be designed so that all terms in the vector {a} are well conditioned.
6.5 Measurement of the strain components As described above, the complete strain state requires six strain gauges at each station. The relative magnitude of each of the six strain components depends on the silo geometry, the boundary conditions, the choice of strain gauge sites and the loading conditions. A clear understand- ing of the shell behaviour is vital to achieving reasonable modelling of the strain state.
Because symmetrical loading was assumed in the above
8. Summary and conclusions
A procedure has been described for inferring the silo wall pressure distribution from measured strains on a silo wall. The matrices needed to implement the method have been defined, and some aspects of statistical techniques to inves- tigate the quality of the outcome have been discussed. The theory has been presented in its fullest form, in which all strain readings are used, and the loading parameters include
Inferring circular silo wall pressures: J. F. Chen et al. 331
normal pressure, vertical wall friction and circumferential wall friction. A simple axisymmetrically loaded silo subject to Janssen normal pressures and frictional tractions has been used to illustrate the procedure.
Instrumentation restrictions in the number and placement of measuring stations have also been discussed. The num- ber of strain observations and the level of noise in the strain measurements have been shown to have very significant effects on the influence process. The coefficient of variation of the inferred pressures can be reduced linearly by either reducing the level of no:ise or increasing the square root of the number of strain observations.
The simple exploratory analyses presented in this paper indicate that the instrumentation used in an experiment should be planned very carefully. When planning the exper- iment, it is important that a thorough structural analysis of the test silo should be made, followed by an investigation of the sensitivity of the loading parameters to the measuring station locations and data accuracy. Both the measuring station locations and the number of strain components mea- sured at each location have a significant bearing on the use- fulness of the data in inferring the pressures acting on the silo walls.
Acknowledgments
Financial support for thi,~ work was provided by the Science and Engineering Research Council (Grant GR/G 59318).
References 1 Wilms, H., Rotter, J. M. ~md Tomas, J. 'Comparative pressure calcu-
lations using different codes', 3rd European Symposium: Storage and Flow of Particulate Solids, PARTEC 1995, Nurnberg, 21-23 March, pp. 251-260
2 Ooi, J. Y., Pham, L. and Rotter, J. M. 'Systematic and random fea- tures of measured pressures on full-scale silo walls', Engng Struct. 1990, 12, (2), 74-87
3 Ooi, J. Y. and Rotter, J. M. 'Measured pressures in full scale silos: a new understanding', Proc. Bulk Material Handling - - Towards the Year 200, London, October 1991, pp. 195-200
4 Blight, G. E. 'Defects in accepted methods of estimating design load- ing for silos', Proc. lnstn Civ. Engrs, Part 1 1990, 88, 1015-1036
5 Blight, G. E. 'Lateral pressures and frictional wall loads in corrugated steel silos as revealed by strain measurements', lOth Int. Congr. Chem. Engng, Chem. Equipment Design Automation, Praha, Czechoslovakia, August 1990
6 Bishara, A. G. 'Moments and axial forces in circular silo walls during eccentric discharge (test ,data versus finite element analysis results)', Silos - - Forschung und Praxis Tagung '92, Karlsruhe, October 1992, pp. 41-50
7 Rotter, J. M. and Ooi, J. Y. 'Discussion on 'Defects in accepted methods of estimating design loading for silos', 'Proc. Instn Civ. Engrs. Part 1 October 1991, 90, 1077-1088
8 Rotter, J. M. 'The analysis of steel bins subject to eccentric dis- charge', Proc. 2nd Int. Conf. Bulk Materials Storage Handling and Transportation, Institution of Engineers, Australia, Wollongong, July 1986, pp. 264"271
9 Rotter, J. M., Ooi, J. Y., Chert, J. F., Tiley, P. J., Mackintosh, I. and Bennett, F. R. 'Flow pattern measurement in full scale silos', final report to the BMHB/DTI, University of Edinburgh, July 1995, (abridged report 230 pp., full report 795 pp.)
l0 Chen, J. F., Ooi, J. Y. and Rotter, J. M. 'Statistical inference of unsymmetrical pressures in circular silos using wall strain measure- merits', Research Report, University of Edinburgh, 1995
11 Trahair, N. S., Abel, A., Ansourian, P., Irvine, H. M. and Rotter, J. M. 'Structural design of steel bins for bulk solids', Australian Institute of Steel Construction, November 1983
12 Hartlen, J., Nielsen, J., Ljunggren, L., Martensson, G. and Wigram, S. 'The wall pressure in large grain silos', Swedish Council for Building Research, Stockholm, Document D2: 1984, 1984
13 Nielsen, J. 'Load distribution in silos influenced by anisotropic grain behaviour', Proc. Int. Conf. Bulk Materials Storage, Handling and Transportation, 1. E. Australia, Newcastle, August 1983, pp. 226- 230
14 Munch-Andersen, J. and Nielsen, J. 'Size effects in large grain silos', Bulk Solids Handling 1986, 6, 885-889
15 Munch-Andersen, J. and Nielsen, J. 'Pressure in slender grain silos', CHISA 1990, Second European Symposium on Stress and Strain in Particulate Solids, Prague, 26-31 August 1990
16 Rotter, J. M., Pham, L. and Nielsen, J. 'On the specification of loads for the structural design of bins and silos', 2nd Int. Conf. Bulk Materials Storage, Handling and Transportation, Institution of Engineers, Australia, Wollongong, July 1986, pp. 241-247
17 ACI3 13, 'Alternate design procedure', Discussion document before ACI Committee 313 on concrete bins, silos and bunkers for storing granular materials, ACI, Detroit, 1989
18 Rotter, J. M. 'The effect of increasing grain moisture content on the stresses in silo walls', Investigation Report $444, School of Civil and Mining Engineering, University of Sydney, March 1983
19 Itoh, F. 'On the characteristics of bending strain gauge', translation of the Report presented at the 1975 Spring Meeting of NDI (The Japanese Society for Non-destructive Inspection)
20 Kyowa 'Characteristics of new series 'Double Deck' strain gauges', Eng(neering News, Internal Publication, Kyowa Electronic Instru- ments Co. Ltd, No. 2/221, June 1977
21 Chen, J. F., Ooi, J. Y. and Rotter, J. M. 'Local stiffening effect of 'Double Deck" bending strain gauges and its correction', Proc. Int. Conference Advances Engng Measurements, Edinburgh, UK, 30 August- l September 1994
22 Janssen, H. A. 'Versuche uber Getreidedruck in Silozellen', Zeitsch- rift des Vereines Deutscher lngenieure 1895, 39, No. 35, 1045-1049
23 Rotter, J. M. 'Membrane theory of shells for bins and silos', Trans. Mech. Engng, I.E. Australia, September 1987, ME12 (3), 135-147
24 Rotter, J. M. 'Bending theory of shells for bins and silos', Trans. Mech. Engng, I.E. Australia, September 1987, ME12 (3), 147-159
25 Rotter, J. M. 'The FELASH suite of programs for the analysis of axisymmetric shells', Proc. Fourth Int. Conf. Civil and Structural Engineering Computing, London, 1989, 1, 323-328