Embed Size (px)
Citation preview

Arizona State University
Demographic Reality
Who are these Children?
Eugene GarciaArizona State University

Changing U.S. Cities: Census 2000
For the first time, ½ of the nation’s 100 largest cities are home to more Blacks, Hispanics, Asians, and other minorities than Whites.
The vast majority of American cities – 71 of the top 100 - - lost white residents
White, N/H residents are now a minority of the total population in the 100 largest urban centers
New York Times on the web, 4/30/01

U.S. Population Growth (April 1, 2000 – July 1, 2003)
4.6
9.4
1.8 1.6 1.40.4
0
2
4
6
8
10
Total U.S. Hispanic White,Non-
Hispanic
Black Asian AmIndian
(Million
(Source: U.S. Bureau of Census, June 2004)

U.S. Population Projections
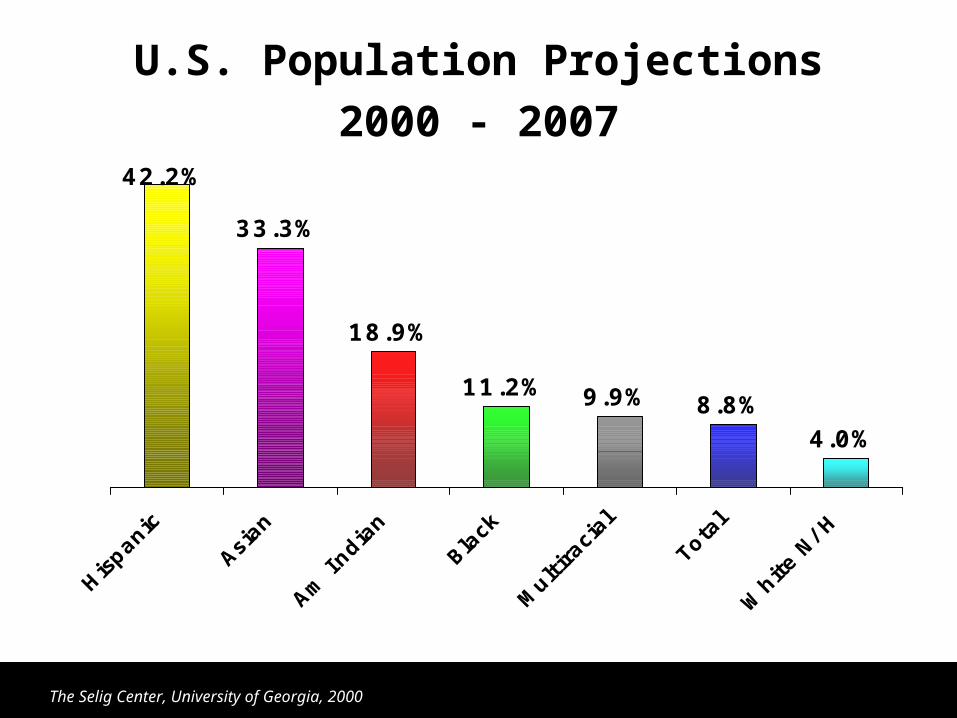
U.S. Population Projections2000 - 2007
42.2%
33.3%
18.9%
11.2% 9.9% 8.8%4.0%
Hispa
nic
Asian
Am Ind
ian
Black
Mul
tirac
ial
Tota
l
Whi
te N
/ H
The Selig Center, University of Georgia, 2000

U.S. Population Projections2007 (millions)
306.1
255.9
50.2 38.514.1 2.9
Total White N/ H Hispanic Black Asian Am Indian
The Selig Center, University of Georgia, 2002
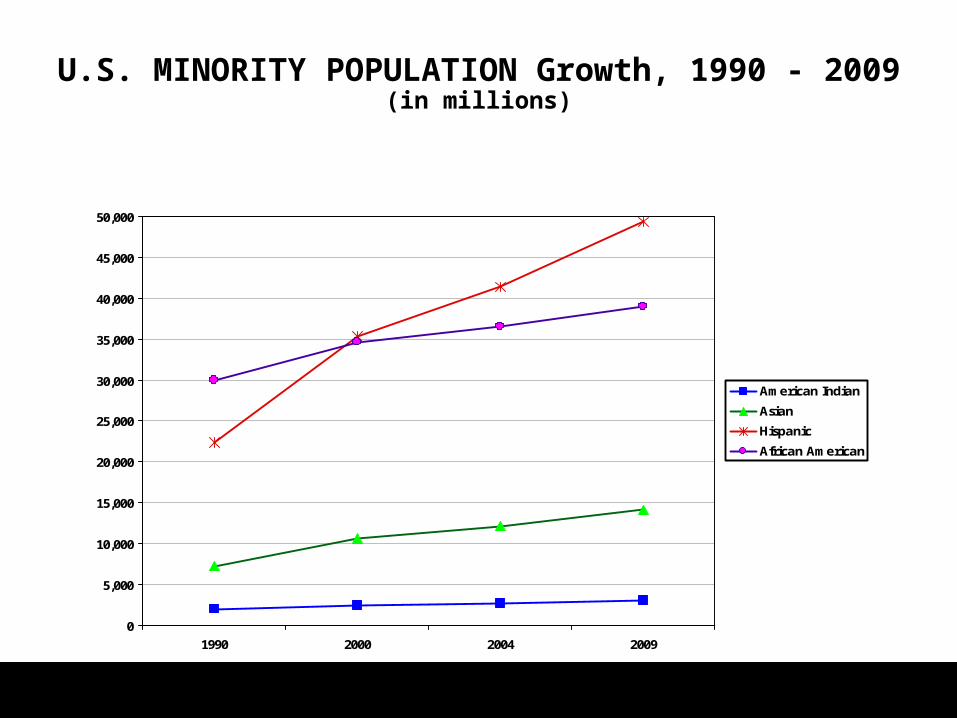
U.S. MINORITY POPULATION Growth, 1990 - 2009(in millions)
0
5,000
10,000
15,000
20,000
25,000
30,000
35,000
40,000
45,000
50,000
1990 2000 2004 2009
American Indian
Asian
Hispanic
African American
(Source: The Selig Center for Economic Growth, 2004)

Percent Distribution of the U.S. Population by Race/Ethnicity
2000 to 2050
0%
10%
20%
30%
40%
50%
60%
70%
80%
2000 2010 2020 2030 2040 2050
Year
White, Non-HispanicHispanic
Black
Asian
Am. Indian
U.S. Bureau of the Census, Population Projections of the United States by Age, Sex, Race, and Hispanic Origin, p. 25-1130, Table I, CPS Report, April 1999

U.S. Fertility Projections (2025)
U.S. Bureau of Census, Population Projections for States by Age, Sex, Race & Hispanic Origin, October 1996
2.4
3.0
2.11.8 1.9
0.0
0.5
1.0
1.5
2.0
2.5
3.0
3.5
White,Non-
Hispanic
Asian AmericanIndian
Black Hispanic
Fer
tili
ty R
ate

U.S. Population Projection: Median Age(2000 and 2025)
29.833.8
43.238.6
28.5
26.6
30.6 32.4
36.935.3
0
10
20
30
40
50
Hispanic Native
American
Black Asian White, Non-
Hispanic
(years
)
2000
2025
(Source: American Demographics, August 2003)
Years

U.S. K-12 Enrollment Trends
&
Projections
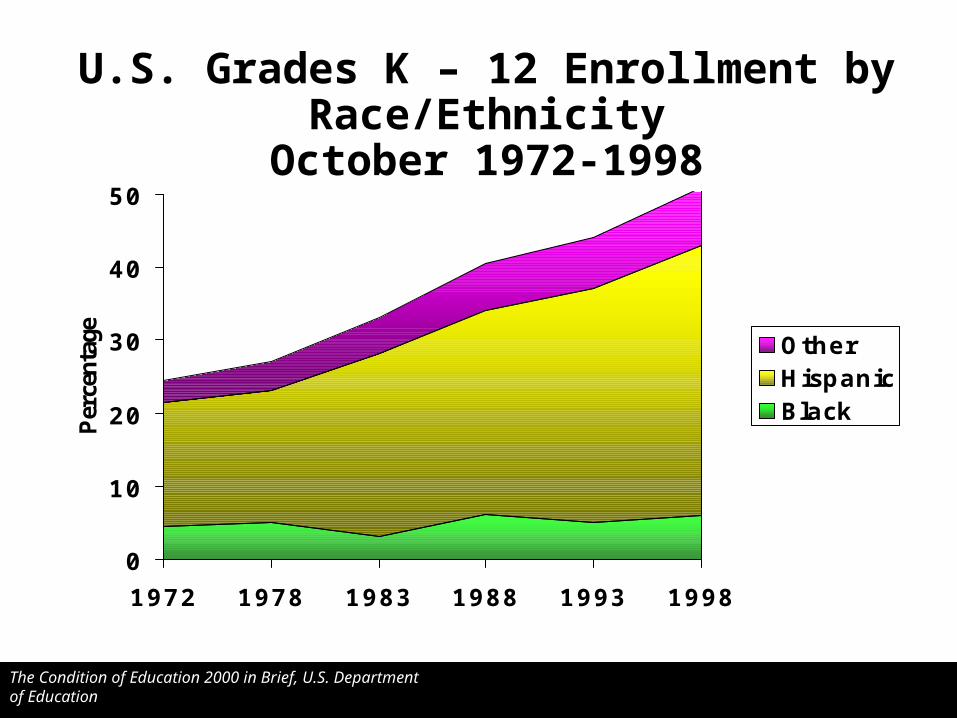
U.S. Grades K – 12 Enrollment by Race/Ethnicity
October 1972-1998
0
10
20
30
40
50
1972 1978 1983 1988 1993 1998
Percentage
OtherHispanicBlack
The Condition of Education 2000 in Brief, U.S. Department of Education

Hispanics will make up 33%
of the U.S. PreK-12
population by 2025.
Hispanic, Univ. of Georgia, December 2002

U.S. Classrooms: Projected Student Composition: Ages 5-17
62%
38%
56%
44%
46%
54%
0%
50%
100%
2005 2020 2040
Majority Minority
Census, 2000
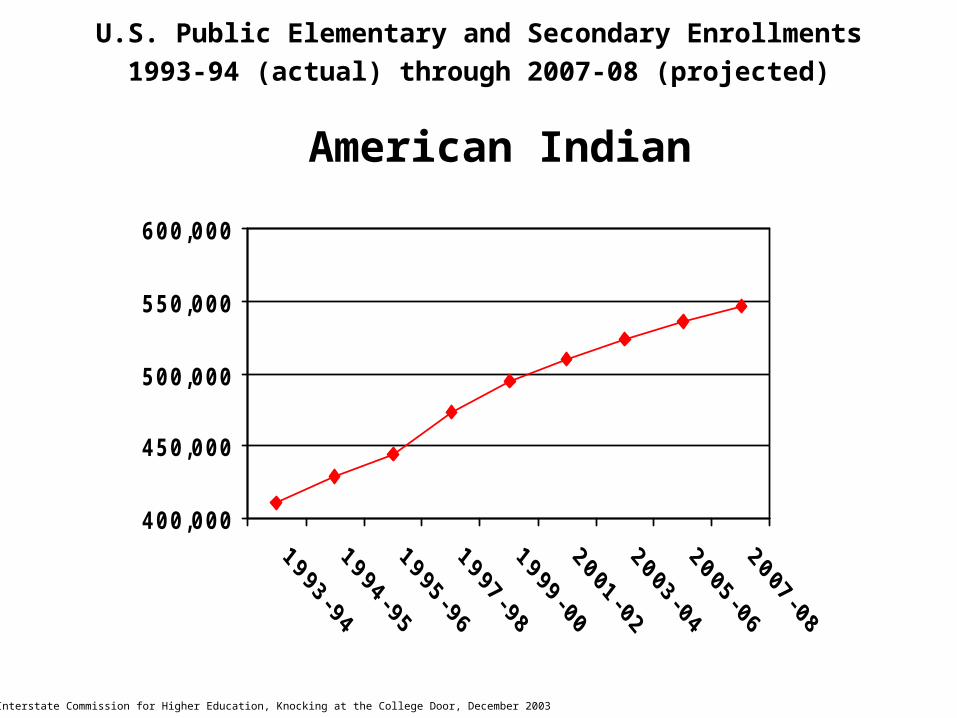
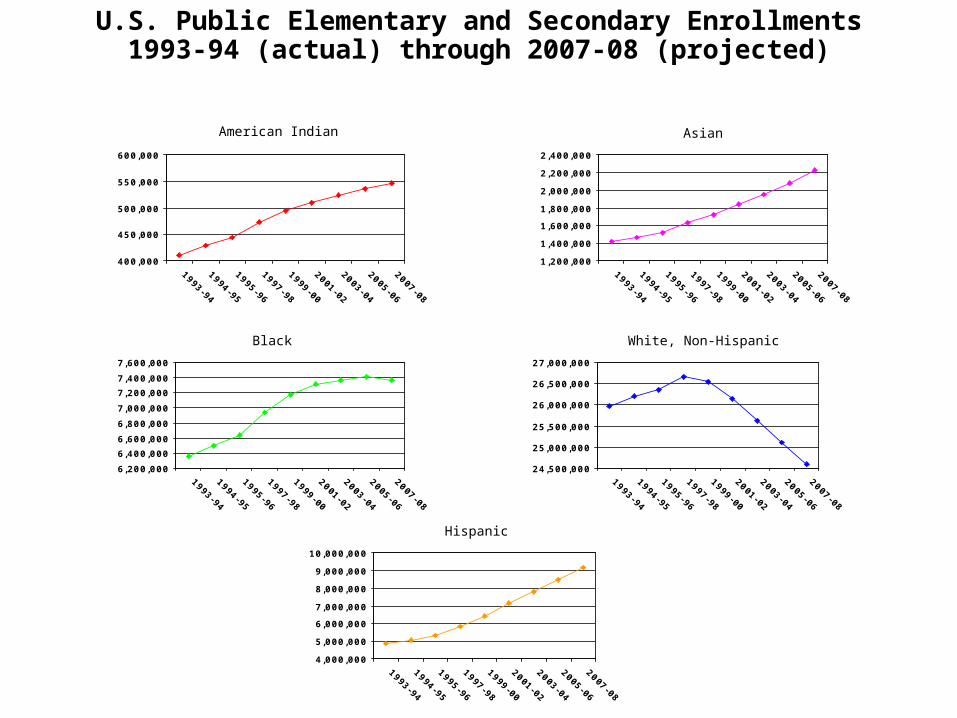
U.S. Public Elementary and Secondary Enrollments1993-94 (actual) through 2007-08 (projected)
400,000
450,000
500,000
550,000
600,000
American Indian
Western Interstate Commission for Higher Education, Knocking at the College Door, December 2003

U.S. Public Elementary and Secondary Enrollments1993-94 (actual) through 2007-08 (projected)
1,200,000
1,400,000
1,600,000
1,800,000
2,000,000
2,200,000
2,400,000
Asian
Western Interstate Commission for Higher Education, Knocking at the College Door, December 2003

U.S. Public Elementary and Secondary Enrollments1993-94 (actual) through 2007-08 (projected)
6,200,000
6,400,000
6,600,000
6,800,000
7,000,000
7,200,000
7,400,000
7,600,000
Black
Western Interstate Commission for Higher Education, Knocking at the College Door, December 2003

U.S. Public Elementary and Secondary Enrollments1993-94 (actual) through 2007-08 (projected)
24,500,000
25,000,000
25,500,000
26,000,000
26,500,000
27,000,000
White, Non-Hispanic
Western Interstate Commission for Higher Education, Knocking at the College Door, December 2003

U.S. Public Elementary and Secondary Enrollments1993-94 (actual) through 2007-08 (projected)
4,000,000
5,000,000
6,000,000
7,000,000
8,000,000
9,000,000
10,000,000
Hispanic
Western Interstate Commission for Higher Education, Knocking at the College Door, December 2003
U.S. Public Elementary and Secondary Enrollments1993-94 (actual) through 2007-08 (projected)
400,000
450,000
500,000
550,000
600,000
1993-94
1994-95
1995-96
1997-98
1999-00
2001-02
2003-04
2005-06
2007-08
American Indian
1,200,000
1,400,000
1,600,000
1,800,000
2,000,000
2,200,000
2,400,000
1993-94
1994-95
1995-96
1997-98
1999-00
2001-02
2003-04
2005-06
2007-08
Asian
6,200,000
6,400,000
6,600,000
6,800,000
7,000,000
7,200,000
7,400,000
7,600,000
1993-94
1994-95
1995-96
1997-98
1999-00
2001-02
2003-04
2005-06
2007-08
Black
24,500,000
25,000,000
25,500,000
26,000,000
26,500,000
27,000,000
1993-94
1994-95
1995-96
1997-98
1999-00
2001-02
2003-04
2005-06
2007-08
White, Non-Hispanic
4,000,000
5,000,000
6,000,000
7,000,000
8,000,000
9,000,000
10,000,000
1993-94
1994-95
1995-96
1997-98
1999-00
2001-02
2003-04
2005-06
2007-08
Hispanic
Western Interstate Commission for Higher Education, Knocking at the College Door, December 2003

Immigrant and Native Children Enrolled in K-12 Schooling in US: 1970-2000 (in thousands)
K-12 Enrollment
Year Children of Immigrants*
Children of Native Parents
Total K-12 Enrollment
Percentage of Immigrant
Enrollment in Total K-12 Population
Foreign-born (1st generation)
U.S.-Born (2nd
generation)
1970 770 (24.8%) 2,334 (75.2%) 45,676 48,780 6.4%
1980 1,506 (32.2%) 3,169 (67.8%) 41,621 46,296 10.1%
1990 1,817 (31.6%) 3,926 (68.4%) 35,523 41,266 13.9%
1995 2,307 (29.2%) 5,590 (70.8%) 41,451 49,348 16.0%
2000 2,700 (25.7%) 7,800 (74.3%) 44,200 54,700 20.1%*Percentages of total children of immigrant populationSources: Fix, M., & Passel, J. (2003). U.S. immigration: Trends and implications for schools. Washington DC, The Urban Institute.Van Hook, J., & Fix, M. (2000). A Profile of the Immigrant Student Population. In J. R. DeVelasco, M. Fix and T. Clewell (Eds.), Overlooked and underserved: Immigrant children in U.S. secondary schools. Washington D.C.: The Urban Institute Press.

22

23

24

25

26

27

28