Embed Size (px)
Citation preview
Ann Oper ResDOI 10.1007/s10479-014-1650-2
A road map to new product success: warranty,advertisement and price
Arda Yenipazarli
© Springer Science+Business Media New York 2014
Abstract In today’s hyper-competitive marketplace, new product introduction is commonlyviewed as a vehicle for profitably growing businesses, yet market success remains rare andnew innovative products fail at stunning rates. Current corporate thinking identifies a numberof potential reasons, one of which lies in the poor execution of marketing-mix strategies. Inthis paper, we analyze how best to structure the marketing strategy of a company to fosterand leverage his innovative new product with a focus on three variables—namely warrantyduration, advertising spending and selling price—and attempt to provide a theoretical expla-nation for factors that affect optimal trajectories of these variables over time. We also conducta detailed numerical study in order to test which market- and product-related factors havethe most influence on and best explain the company’s new product introduction strategy, andillustrate the associated profit impacts. Our analysis proposes a time-variant threshold onadvertising spending that structures the company’s marketing strategy over time. Secondly,we point out that warranty duration and price collectively follow the pattern of the diffusioncurve of the new product, but reach their maximum levels before the new product matures.We also provide guidance about the effect of such market- and product-related factors asreferral power, failure rates and effectiveness of advertising spending on a company’s newproduct introduction strategy.
Keywords Warranty · Advertisement · Pricing · Optimal control · Diffusion models
1 Introduction
Remember the MessagePad, the Segway or the Cell Zone? All these high-profile innovationshave garnered seasoned financial support and been attached to established companies, butfailed nonetheless to gain traction in the marketplace and not been guaranteed longevity.Consider the fate of the MessagePad. Developed and released as a personal digital assistant
A. Yenipazarli (B)Department of Management, Georgia Southern University, Statesboro, GA 30460, USAe-mail: [email protected]
123
Ann Oper Res
by Apple in 1993 that ran on Apple’s Newton operating system and that could take notes, storecontacts and manage calendars with a handwriting recognition software, Apple abandonedthe MessagePad 5 years after its introduction because their revenue remained substantiallybelow expectations.1 Likewise, unveiled as nothing less than a technologically advanced, two-wheeled but self-balancing, battery-powered scooter that would revolutionize transportation,the Segway (known prelaunch by code name “Ginger”) came out in 2001. In spite of thehype behind the launch that pushed the Segway into high gear, with a $5, 000 price tag,consumers were not so convinced on the glories of the gadget which sold a mere 6,000 unitsin the 18 months after its launch and 24,000 units in the first 5 years—a far cry from the10,000 units per week projected.2 Nowadays, it is commonly known as a patrol vehicle usedin shopping centers and as a tourist-toting cart. Last but not least, take the Cell Zone. Whenthe sound resistant phone booth made by Salemi Industries was rolled out in 2006, it wasspotlighted as a surefire moneymaking product that would give callers a private place tohave their conversations and not to annoy others around them in restaurants and other publicplaces. Although early signs were good and the Cell Zone proved to be a huge hit at thatyear’s Restaurant Show, the company has sold fewer than 300 units to date and lost morethan $650, 000 in the process.3 While the stories of the Segway and Cell Zone have yet toplay out fully, their endings seem to be far from being happy.
In midst of today’s fiercely competitive marketplace, companies must perpetually intro-duce buoyant new products that appeal to and excite consumers in order to prosper andprogress beyond their rivals, despite feeling obliged to trim their spending billions of dollarson new products in a down economy. Most new products—those that are objectively superiorto incumbent ones, create new categories or offer technological leaps—are doomed to failureor mediocrity, though. Every year witnesses the introduction of 30,000 new products intothe market with all the excitement surrounding them, yet these prospective products fail ata staggering rate of 40–90 %, depending on the product category.4 Furthermore, accordingto one study that analyzed 500 brands in 50 product categories, 47 % of the companies thatinaugurated new product categories later pulled out of those promising enterprises.5 The oddshave not changed noticeably since then and are untenable to change over time. What is wrongwith this bleak backdrop? Apparently, it is neither the lack of opportunities in the market northe lack of resources. Numerous factors can be cited as causes of new product failures, but themost chronic (and frequently fatal) flaw turns out to be companies’ myopic focus on highlydesirable features their new products would embody and so viewing road to adoption as amonolithic process. Companies have become so deeply entrenched over the idea that cus-tomers would embrace new products as long as they offer distinct improvements over existingones and ceaselessly failed to internalize the fact that in the first place customers should havesufficient incentive to purchase them (see Rogers 1983). People evaluate the attractiveness ofa prospective new product in the marketplace based on its perceived/subjective value besideits actual/objective value.
1 http://www.wired.com/design/2013/08/remembering-the-apple-newtons-prophetic-failure-and-lasting-ideals/, accessed on January 10, 2014.2 http://woolmilk.wordpress.com/2012/05/03/segway-inc-analysis-of-an-innovation-that-failed-to-commercialize/, accessed on January 10, 2014.3 http://www.fastcompany.com/3009809/every-entrepreneurs-biggest-mistake-and-how-to-avoid-it, acces-sed on January 15, 2014.4 http://hbr.org/web/special-collections/insight/marketing-that-works/marketing-malpractice-the-cause-and-cure, accessed on January 16, 2014.5 http://www-bcf.usc.edu/~tellis/pioneering, accessed on January 16, 2014.
123

Ann Oper Res
As once written by Peter Drucker, because the purpose of any business is to seek outshoppers who are not in present customer base yet and to stay afloat, a company must havetwo elemental—and interdependent—functions: innovation and marketing.6 That is, it isnot enough to create value for consumers through innovative product launches—marketingstrategy of the new product must jibe with its market appeal as well, along with better per-formance, to capitalize fully on a new offering. The managers tasked with introducing a newproduct almost always face the challenge of framing its value proposition in the most conciseand compelling way and hence maximizing its value. All too often, companies roll out a newproduct that offers highly desirable new features and/or meets newly critical market needs.However, customers fail to buy the prospective product and the reason lies in the company’sfailure to align the position, messaging and pricing of the product with shopping attitudesconsumers bring to decision making. Then, what can companies do to create perceptionsof additional value among customers and/or to simplify their purchasing decision for newproducts? In study after study, a strategic framework is built around mostly-pronounced threemarketing variables that support the sales effort, foster the adoption and derive the marketpotential of any durable new product: pricing regime, advertising expenditures and warrantyterms.7 The new products stand the best chance of both short-term and long-term success,only if companies treat new product adoption as a long, drawn-out process and manage thesemarketing variables accordingly.8
These observations motivate the focus of this paper. In this paper, we concentrate onmaximizing the value of a new innovative product that has been cleared for developmentand introduced into the market by scrutinizing three marketing variables highly spotlightedin the literature: warranty duration, advertising spending and price. Our focus is on durableproducts that last a long time and so that do not need to be repurchased for long periods of timeonce adopted by a customer, meaning that the market potential of durable products depleteswith sales and they are on track to saturate markets over time. In addition, we treat product-related decisions (e.g., features and quality) as exogenous, because adjustments in warrantyduration, advertising spending and price can be made almost immediately in comparison tomodifications in product quality. We also rule out the product valuation of consumers andthe negative impact of the psychology of behavior change a new product might demand fromconsumers that can cause the new product to fail to live up the corporate expectations. Inessence, we seek to answer the following relevant questions on new product introduction:(1) How should a company orchestrate the marketing-mix variables for his new product toimprove his chances of success (so that to justify new product introduction)? (2) Is there aportfolio of marketing tactics from which the company can assemble just the right sequenceto obtain sustainable profits? (3) What should be the difference in advertising levels when andafter the market opens? (4) How can a company exploit the full power of direct advertising andword of mouth marketing? (5) To what extent does the relationship between risks of failureand costs affect the climb of a new product along its sales curve? and (6) What is effectof various parameters (e.g., referral power, price elasticity and failure rate) on the optimalpolicies? Apparently, many high-profile new products fail at a stunning rate or fall shortof corporate expectations because companies remain enslaved to common misconceptionsabout the marketing variables. Before companies can reap the total benefits of introducing a
6 http://www.forbes.com/2006/06/30/jack-trout-on-marketing-cx_jt_0703drucker.html, accessed on Janu-ary 16, 2014.7 The reader is referred to Sect. 2 for a glimpse of articles that empirically and theoretically analyze pricing,advertising or warranty as the most critical driver(s) of new product adoption.8 http://www.pdma.org, accessed on January 18, 2014.
123
Ann Oper Res
new innovative product, they must understand the principles of how marketing-mix variableswork, and doing so requires a close examination of the interplay of those critical variables.
The remainder of this paper is organized as follows. Section 2 presents a comprehensivereview of the literature on diffusion models that incorporate marketing variables. Section3 details the modeling assumptions and provides the derivation of the profit-maximizationproblem. The proposed model is solved by means of a system of first order differentialequations in Sect. 4, and the optimal trajectories of warranty duration, advertising spendingand selling price are qualitatively characterized in Sect. 5. Section 6 presents a numericalexample to validate analytical results and then undertakes a detailed sensitivity analysisto evaluate the effect of key model parameters on the optimal trajectories. Finally, Sect. 7concludes the paper with a summary of structural and managerial insights, and with somevaluable extensions worthy of further investigation.
2 Literature review
In the marketing and management literature, the seminal new product adoption model pub-lished by Bass (1969) became the standard for analyzing the growth of new consumerdurables. The survival and success of the Bass model can be attributed to three importantcharacteristics. First, the model strictly adheres to widely observed sales growth pattern ofnew durables. Secondly, the model is theoretically sound and found to be empirically robustwith many empirical data sets. Lastly, estimates of two key parameters of the model, beingthe pivotal drivers of the theory that underlies the Bass model, have intuitively appealinginterpretations as coefficients of innovation and imitation. Despite its outspoken strengths,the Bass model suffers from pervasive limitations. As a case in point, the parameters utilizedin the model are unstable such that they can fluctuate substantially over time along with theaddition of new observations — particularly prior to the first peak in sales [see, for example,Mahajan et al. (2005), Bulte and Lilien (1997), among others]. Stemming from this insta-bility, the Bass model’s forecasts are not accurate estimates-unless the entire growth historyof new durable is used where waiting for the complete data reduces the usefulness of themodel. More notably than those, the Bass model is descriptive in nature such that it viewsdiffusion of new durables primarily as communication between two groups of consumers,namely innovators and imitators, presents diffusion as a social theory of communication, andoverlooks the role of marketing variables (e.g., pricing regimes, advertising expenditures andwarranty terms) in expounding the spread of new durables in the market over time. As a result,it is criticized for having constant parameters and its failure to provide normative guidelines.
Numerous extensions have been proposed to capture such economic factors and demythol-ogize the new product growth over time by letting the parameters depend on relevant mar-keting variables. In the economics and management literature, three prevalent marketingvariables that characterize and support diffusion of new products turn out to be price, adver-tising spending and warranty duration, and the temporal topical trend has been to extendthe Bass model by incorporating at least one of these economic factors that may influenceproduct growth. Early new product growth models building the price as a marketing variableinto the Bass model propose that price shapes either the diffusion rate through coefficients ofinnovation and imitation [see, for example, Robinson and Lakhani (1975), Kamakura and Bal-asubramanian (1988), Jain and Rao (1990), among others] or the potential market size [see,for example, Kalish (1983), Jorgensen (1983), among others]. Using a diffusion model whereprice merely affects the diffusion rate, Mesak and Berg (1995) characterize optimum pricingpolicies for new durables theoretically and empirically, and state that a penetration pricing
123
Ann Oper Res
policy should be employed in the beginning followed by later by a skimming pricing policy.Teng and Thompson (1996) consider learning curve and diffusion effects on the productionand demand sides, respectively, and study separable demand functions in price. Similarly,Jorgensen et al. (1999) develop a dynamic model of pricing which allows for learning effectsboth on the demand and production side and obtain closed-form characterizations of optimalpricing strategies. Krishnan et al. (1999) explicitly incorporate the effect of price on the rateof new product diffusion and observe either a monotonically declining pricing pattern or anincrease-decrease pricing pattern depending on the magnitude of discount rate. When priceonly affects adoption or market penetration and the coefficient of imitation is zero, Sethiand Bass (2003) point out that price declines over time regardless of the discount rate andlength of the finite planning horizon. Recently, by using a demand function multiplicativelyseparable in price and cumulative sales and taking learning curve effects into account, Lin(2008) analyzes optimal time trajectory for the price over the life-cycle of a durable.
Regarding the studies subscribing to the proposition that advertising has to be the majormarketing variable shaping the adoption of a new durable product, Dodson and Muller (1978)extend the Bass model where awareness is generated by advertising efforts. In an attempt toextend the Bass model, Horsky and Simon (1983) embed advertising into the coefficient ofinnovation and empirically support the effects of advertising on the sales growth function.Dockner and Jorgensen (1988a), and Dockner and Jorgensen (1988b) present modified diffu-sion models where either innovation coefficient or imitation coefficient (or both) are depen-dent upon advertising, and obtain monotonic advertising strategies over the entire planninghorizon in all three cases. Favaretto and Viscolani (1999) analyze the diffusion of a seasonalproduct whose sales rate is multiplicatively separable in price which is set exogenously andgoodwill whose rate of change is a function of advertising. Under a limited product avail-ability, Swami and Khairnar (2006) develop advertising policy for a product and proposethat sales rate is a log-linear function of two distinct advertising expenditures: awarenessadvertising targeted at innovators and availability advertising targeted at imitators. Krishnanand Jain (2006) elaborate on policies on how the advertising should optimally change overtime after a new product is introduced and the diffusion progresses. Swami and Dutta (2010)derive optimal advertising policy of a firm by proposing new durable growth model as afunction of advertising expenses. The optimal normative advertising policy recommends amonotonic decreasing advertising expenditure rate over time for most practical situations.
Another stream of research focuses on finding the optimal patterns for two marketingvariables, assuming sales growth curve follow the Bass model. For the case of a sales ratefunction depending on price, advertising rate and cumulative output, Teng and Thompson(1985) state that the optimal advertising rate should increase for the undiscounted case ifadvertising becomes more efficient during the product life-cycle. Kalish (1985) introducestwo-differential equation model to represent the awareness and adoption processes, in whichadvertising appears in the awareness equation whereas price is assumed to affect the marketpotential of the adoption equation. Cultivating a separable dynamic demand function similarto the one adopted in this paper, where sales rate incorporates price and advertising (withoutaddressing warranty duration considerations), Dockner et al. (1989) show that skimmingpricing corresponds to high introductory advertising while penetration corresponds to lowinitial advertising. Mesak (1996, 1998) study optimal trajectories for price, advertising anddistribution policies over time in a deterministic new product growth model. Barucci andGozzi (1999) consider a firm that continuously launches new products into the market andpropose that the customer demand is a function of the price of the product and of the goodwillaccumulated through advertising. Sethi et al. (2008) propose a new durable growth modelincorporating price and advertising effects, based on what they formulate and explicitly
123
Ann Oper Res
solve two optimal control problems, one for linear demand and one for iso-elastic demand.Krishnamoorthy et al. (2010) consider advertising and price interaction, market saturationand feedback solutions in a dynamic market, and obtain the optimal advertising and pricingdecisions for linear and iso-elastic demand specifications.
Several papers view warranty as a major marketing variable and consider its impact onsales rate in addition to costs. Menezes and Currim (1992) posit a general demand functionwherein the quantity sold by a firm is a function of warranty duration and price, and deriveresults for optimal warranty length for three different generic types of warranties. Lin andShue (2005) investigate the optimal path of price and warranty length under various life-time distributions when a new product is sold under free replacement warranty policy butdisregard learning effect on production cost. Similarly, Wu et al. (2006) propose a static salesrate function with a positive discount rate and a separable sales rate function with a zerodiscount rate to determine the optimal price and warranty length. In order to investigate thedynamic relationship between warranty periods and optimal pricing strategy, Kim and Park(2007) develop a diffusion model where warranty period and price affect the sales rate in anadditive way. Huang et al. (2007) develop a model to determine the optimal price, warrantylength and product reliability for a durable sold with a free replace-repair warranty policy ina stable and in a dynamic market by incorporating the learning curve effect. Likewise, Wu etal. (2009) develop a model, consisting of price and warranty length as marketing variables,under a fee renewal warranty policy, but disregard saturation and learning effects throughzeroing in on a static market. Apart from these studies, for two additional papers that are ofperipheral relevance to our paper, the reader is referred to Katehakis and Smit (2012) and Shiet al. (2013). Considering a multi-breakpoint discount pricing structure, Katehakis and Smit(2012) provide efficient algorithms for a continuous review inventory model with Poissonarrivals and a fixed lead time. Shi et al. (2013) address the problem of inventory penaltypricing under the risk- neutral valuation principle production for an inventory system thathas a constant replenishment rate and a compound renewal demand stream and that is subjectto underage and overage penalties.
The extensions of the Bass model outlined above are largely successful attempts in factor-ing certain marketing variables in the new product diffusion analysis, yet they come at a greatcost: simplicity. It is admittedly hard to retain the simplicity of the Bass model while comingto grips with one of its repeatedly cited limitations. More importantly, even though warrantyduration, advertising spending and price are featured in the proposed diffusion models indi-vidually or paired up as control variables, no single study has simultaneously incorporatedall of these outspoken marketing variables into the Bass’ new product growth model. Thispaper is an attempt to provide a unified theoretical framework through plugging these vari-ables into the new product adoption model in a way so that it can be boiled down to formermodels in the extant literature by playing out with underlying parameters. Based on thatwe extend the Bass model by resting on a number of assumptions, supported by conclusiveevidence, to gain additional analytical (and so managerial) insights into the problem whileobtaining a reasonable balance between complexity and tractability. Our approach involvesa risk that the proposed marketing strategies may be highly sensitive—at least to a certainextent—to the particular functional forms chosen for analysis and so the conclusions drawnfrom our analysis may be more specific than the qualitative recommendations obtained frommore flexible models. On the other hand, our specialized model is completely built upontheoretically and empirically validated modeling efforts put forth by respective studies inliterature and provides more clearcut prescriptions than do general diffusion models to date.In addition, explicitly integrating key parameters appertaining to warranty, advertising andprice into a single model enables us to test which ones have the most significant influence on
123
Ann Oper Res
a company’s new product introduction strategy and the resulting profit. Thus, we contributeto this literature by developing an understanding of how market- and product-related factorswould affect a company’s marketing-mix decisions.
3 Modeling framework
In this section, we detail our modeling assumptions and formulate the profit function of acompany that would attempt to introduce a new product into the market. The proposed modelis composed of three main concepts: manufacturing learning curve, cost of responding tobreakdowns and new product adoption scheme. We start structuring our framework with thedescription of each of these components and then formulate the profit-maximization problem.
3.1 Manufacturing learning curve
The concept of a learning curve is the cradle of manufacturing.9 A brand new product doesnot spring up from a fully reliable and/or a completely functional manufacturing process.Instead, it arises from and goes through an iterative learning process. Start-ups and estab-lished companies launching new products follow a manufacturing learning curve that unfoldsthrough a back-and-forth transfer of knowledge and experience between a production line andback-office operations of a company such as purchasing, product development, manufactur-ing, operations and the factory floor. Over time, the entire process associated with producingthe product becomes more effective and offers better economics. As production process isrepeated numerous times, a host of issues and unexpected problems arising shortly after thelaunch are identified and resolved. The more the company learns about the production process,the more efficient it becomes and the lower the unit production cost goes. Thanks to the learn-ing curve, Arrow (1962) points out that when a company—that has deployed a new product—moves deeper into the manufacturing cycle, he cuts unit cost of his production by 10–50 %each time the accumulated production volume doubles. Gaining knowledge does not happenall at once and a large production volume helps a company climb the learning curve faster.This is particularly the case for companies such as Siemens with his medical equipment, GEwith his jet engines and locomotives, Honeywell with his aerospace equipment and ABB withhis power plant equipment, where there are complex labor operations in a production process.
Note that no matter whether it is a start-up or an established company, the learning curvecan be applied as a strategic construct by savvy managers that would enable companies tointegrate such consumption experiences as word of mouth, saturation and carry-over effectsinto their decision making process which in turn could allow them to speed up achievinga sustainable profit and the cost of breaking even. All too often, companies launching newproducts measure their progress along the learning curve by tracking their production volumesalong with their unit production costs over time. In the literature, two most prevalent functionalforms used to characterize the learning curve are the power form and the exponential form.10
Based on that the unit production cost of a new product at time t can be expressed as
9 The first reported use of the learning curve is by Wright (1936). From the time it came out, numerous articleshave investigated its use in industrial applications and research settings empirically and theoretically [see, forexample, Bohn (1995), Epple et al. (1996), Mazzola and McCardle (1997), Jorgensen et al. (1999), Lin (2008),among others].10 See Yelle (1979) for an in-depth review of the learning curve literature.
123
Ann Oper Res
C (Q(t)) = K c0
(Q0
Q(t)
)γ
, (1)
where K represents the effect of such factors as inflation and production rate, c0 and Q0 arethe unit production cost and accumulated production volume at the outset, respectively, andγ ∈ (0, 1) denotes the learning parameter.
3.2 Cost of warranty
Companies bundle after-sales warranty services (i.e., replacing a failed product with a standbyend product or replacing only the broken parts) with their products in order to deliver addi-tional value their customers get out of using those products and increase their financial returnsfrom them.11 Customers have good reasons to hate product failures, considering the finan-cial burden of untimely repair bills, time wasted to seek a company out to undertake therepair and niggling concern of being ripped off on the repair, to say the least. Based on thatafter-sales services provided under warranties could help companies improve their customerrelationships by entitling customers to benefits under specific conditions, and hence wouldbe a long-lasting source of additional revenues and profits. That’s said, even though ignoringthe promise of warranties that are wrapped around new products seems to be imprudent,handling the repair and/or replacement of failed products can be notoriously difficult to man-age and company managers may perceive it as a needless expense. For products sold with awarranty package, companies must be aware of two major pitfalls of warranty management:uncertainty and cost. Because demands for repairs or replacements crop up unexpectedly,the number of product returns or warranty claims received until the moment the warrantyperiod ends appears only as probability-based forecasts, and more importantly, fulfilling thewarranty contracts companies have signed can drain a sizable percentage of revenues overtime, particularly if failure rates are high. For that reason, it is not surprising to see companiesthat find it tough to handle the repair or replacement of failed products.
To effectively offer new products that are covered by warranties, companies must carefullyhandle the main customer-focused metric that governs warranty-related after-sales services:the duration of the warranty coverage.12 Studies show that from customers’ viewpoint, thereis a direct correlation between the period of the initial warranty and perceived quality of newproducts such that customers weigh warranty duration against the prices they are willing topay at the point of purchase. In this paper, the company is assumed to bundle his product with afree renewal warranty service, under what he is obliged to replace failed products with standbyunits or repair them during the warranty duration at no additional cost to customers.13 Oncecompanies have figured out how many failed products will be returned approximately overthe length of the warranty, their costs of responding to breakdowns can be calculated. Becausebreakdowns occur unexpectedly and sporadically, companies deal with expected number of
11 See Murthy (2006) for an overview of product warranties with a focus on the concepts and role, productcategories, and different warranty policies, and for a discussion of the integrated approach needed for warrantymanagement.12 In addition to being the most heavily promoted element of warranty contracts, the period of the initialwarranty is the most visible customer-focused metric that would help consumers quantify the quality levelof products they purchase [see, for example, Menezes and Currim (1992), DeCroix (1999), among others].Moreover, as proved by Gerner and Bryant (1981), the source of variance in a warranty coverage is predicatedonly on the duration of the initial warranty.13 As validated by Mamer (1987) and many other succeeding studies, among different types of warrantiesseen in the marketplace (e.g., unlimited free renewal warranty and pro-rate warranty), ordinary free renewalwarranty is the most prevalent warranty package offered along new products in practice.
123
Ann Oper Res
product returns, based on which the expected warranty cost of a product, ω (W (t)) , can bestated as
ω (W (t)) = cr M (W (t)) , (2)
where M (W (t)) represents the average number of failed product returns over the durationW (t) of the warranty bundled with the product and cr represents the unit cost incurred inresponding to breakdowns.14
Information about product failure rates is necessary for predicting the demand for repairsor replacements and so estimating the expected cost of responding to breakdowns. However,since it is not easy to forecast those demands, companies must rely on probability distribu-tions. Because it is prevalently used as a parametric family of failure rate distributions in reli-ability engineering [see, for example, Ebeling (1997), Savsar (2006), among others], whichbears a close resemblance to many descriptions of variations in service environment based onthe value of its shape parameter, the model proposed here is built upon the Weibull distributionthat is characterized by the cumulative distribution function D (W (t)) = 1−e−(κW (t))ρ withfailure rate κ ≥ 0 and shape parameter ρ > 0.15 Then, the average number of breakdownsof a product over the span of its warranty duration gets equal to (κW (t))ρ , based on what theclosed-form expression for the expected cost of responding to breakdowns can be obtainedas follows:
ω (W (t)) = cr (κW (t))ρ (3)
On the basis of the closed-form expression presented above, note thatωW = ∂ω (W (t))/∂W (t)is always greater than zero, whereas ωW W = ∂2ω (W (t))/∂W (t)2 can be either positive ornegative, depending on whether ρ > 1 or ρ < 1, respectively.16 To put it bluntly, extend-ing the period of the initial warranty increases the expected renewal frequency and so thepredicted costs of responding to product failures, yet it is not necessarily true that costskeep increasing significantly for over-extended warranty durations—as generally assumedin related literature (see, for example, Teng and Thompson 1996).
3.3 New product adoption scheme
The new product adoption scheme introduced by Bass (1969) explicitly takes into accounttwo dimensions: the purchase and word of mouth. According to this model, the value of anyone customer does not reside only in what that person buys, but the positive word of mouth
14 Note that even though a company’s response to breakdowns (e.g., handling repairs and disposal of failedcomponents) can bear a different cost, constant repair cost for each failed product is a valid approximationin practice, particularly when the labor costs of handling and diagnosis dominate the cost of failed product(Glickman and Berger 1976). The assumption is also valid in cases where failed products are replaced withstandby units (Menke 1969).15 Exponential distribution can be considered to be effective for structuring failure rate distributions in numer-ous applications but it would be appropriate as long as products break down at a constant rate, meaning thatthe probability of a failure within a given time period would be same regardless of the age of the product. Onthe other hand, it should be noted that failure rates associated with new products can be extremely high at theoutset owing to such factors as inherent weakness of the design or manufacturing faults. Most new productsdo not fail at a constant rate and the Weibull distribution is widely used as a versatile distribution that is ableto describe the increasing and decreasing failure rates—in addition to the constant failure—by appropriateselection of parameter values.16 Contrary to widely-adopted approach in literature when predicting the warranty costs [see, for example,Kouvelis and Mukhopadhyay (1995), Teng and Thompson (1996), among others], by using the closed-formexpression provided in (3), we do not restrict our analysis to the specific case where the warranty costs increaserapidly for longer warranty durations.
123

Ann Oper Res
spread by that customer about the product he/she has chosen matters just as much. Thatis, customers’ engagement with a company does not end with a purchase of the company’sproduct. When they are pleased with the purchase, they pass on the good word for the productto other people, which in turn invigorates the new product’s potential by creating fodder forothers’ evaluations and bringing in new customers. In this framework, shoppers who buythe new product and become a customer without word of mouth are named innovators,while others acquired merely by word of mouth are named imitators. Given that total marketpotential is represented by QM and cumulative number of adopters at time t by Q(t), thesales rate of a new product at time t is modeled as q(t) = (α1 + α2 Q(t)) (QM − Q(t)),where α1 > 0 denotes the coefficient of innovation that is independent of the number ofprevious adopters and α2 > 0 denotes the coefficient of imitation that is dependent upon thenumber of previous buyers. As explicated in Sect. 2, in spite of its strengths, this model hasa conspicuous shortcoming: it does not refer to any marketing variables and the coefficientsα1 and α2 are strictly constant.
In an attempt to factor in the effect of two marketing variables on the new product adoption,Huang et al. (2007) hypothesize and support that extended warranty duration offered alonga new product, coupled with a low selling price, applies to both innovators and imitators indriving consideration and inspiring purchase, and refers to Glickman and Berger (1976) inproposing the displaced log-linear sales rate function of the form
q(t) = k1 P(t)−a (W (t) + k2)b (α1 + α2 Q(t)) (QM − Q(t)) , (4)
where k1 > 0 is a constant amplitude factor to represent market influences (e.g., consumerpurchasing power) and k2 ≥ 0 is constant of time displacement that allows for the possibilityof nonzero demand when warranty duration W (t) is zero. Parameters a > 1 and b ∈ (0, 1)
denote price and displaced warranty length elasticities, respectively. Note that the sales ratefunction in (4) manifests the concept of sales as a diffusion process that involves innovatorsand imitators as in the Bass model, yet coefficients α1 and α2 are still assumed to be strictlyconstant, which should be a function of such economic variables as advertising and promotioninstead of being held constant (Bagwell 2007). Take α2, the coefficient of imitation. Toencourage word of mouth and advocacy for his new product (so increase the value of α2),a company can aggressively develop programs, including online initiatives, contests and e-mail promotions, and use traditional media to distribute positive third-party reviews online.At this point, even though word of mouth (or someone else’s advocacy) surfaces as the mostpowerful stimulus to buy a product in many product categories, companies keep spending thebulk of their advertising budgets on building awareness of their products among innovators(i.e., increasing the value of α1) and so getting them on board. A recent analysis of dozensof marketing budgets reveals that 70–90 % of advertising spending is aimed at innovatorsto get a new product into their hands, knowing that it can pay off exponentially in how themass market ultimately responds.17 Down the road, all customers are not created equal andsome have a disproportionate ability to shape the rest of the consumer market. Based on thatinnovators—as early adopters in the early stages of the product’s market penetration—arevery likely to attract others through word of mouth and draw in more customers over time.It should also be noted that imitators act as word of mouth marketers for the new productand so require fewer advertising efforts than innovators who must be acquired through directadvertising.
Clearly, companies spend the lion’s share of their advertising budgets on building aware-ness, driving consideration and ultimately inspiring purchase for innovators, whose word of
17 http://www.dealer.com/assets/APC-Study-21, accessed on January 24, 2014.
123
Ann Oper Res
mouth in turn appears to bring in new customers over time. This observation pinpoints theneed for identifying the innovation coefficient α1 as a function of advertising spending A(t)in formulating the sales rate of a new product at time t . If α1 in (4) is recognized as a functionof A(t), i.e., f (A(t)), then a dynamic model of demand tailored to real business situationscan be obtained. Related to this point, the ample statistical evidence in previous advertisingmodels underline two commonly accepted properties of advertising (i.e., lagged effects anddiminishing returns) and propose the following behavior of advertising effectiveness functionf (A(t)): ∂ f (A(t))/∂ A(t) > 0 and ∂2 f (A(t))/∂ A(t)2 < 0. A functional form of advertis-ing effectiveness that satisfies these requirements and that is validated empirically [see, forexample, Horsky and Simon (1983), Swami and Dutta (2010), among others] is proposed asfollows:
f (A(t)) = α + β ln A(t) (5)
where α > 0 represents the new product information conveyed to the innovators throughalternative means and β > 0 reflects the effectiveness of advertising spending.18 Combining(4) and (5) leads to the following model of new product adoption:
q(t) = k1 P(t)−a (W (t) + k2)b (α + β ln A(t) + α2 Q(t)) (QM − Q(t)) (6)
On the basis of the cost structure pertaining to manufacturing learning curve articulated in(1), cost of responding to random product breakdowns provided in (3) and sales rate functionpresented in (6), the discounted profit-maximization problem of the company that aims tofind the optimal trajectories of warranty duration W (t), advertising spending A(t) and sellingprice P(t) over a time period T is formulated as follows for a discount rate r ≥ 0:
maxW (t),A(t),P(t)≥0
=T∫
0
[(P(t) − C (Q(t)) − ω (W (t))) q(t) − A(t)] e−r t dt (7a)
subject to
q(t) = k1 P(t)−a (W (t) + k2)b (α + β ln A(t) + α2 Q(t)) (QM − Q(t)) (7b)
Q(0) = Q0 (7c)
4 Model analysis
The discounted-profit maximization problem under dynamic market conditions is solved byapplying the the necessary and sufficient optimality conditions of Pontryagin’s maximumprinciple. Based on that the current value Hamiltonian function of the optimization problemoutlined in (7) is written as
H = (P(t) − C (Q(t)) − ω (W (t)) + λ(t)) q(t) − A(t), (8)
18 Note that the above form ensures that advertising effectiveness increases at a decreasing rate and that thereare diminishing returns to scale, meaning that it is never optimal to increase advertising expenses withoutbound. It should also be noted that advertising is considered to be any expenditure that takes place in thecompany’s cost function as a fixed cost (i.e., independent of sales amount) and that has a direct impact on theadoption curve of the company’s product.
123
Ann Oper Res
where λ(t) is the current value adjoint variable that satisfies the following conditions (omittingfunction arguments for clarity):
dλ
dt= rλ − ∂ H
∂ Q= rλ + CQq − (P − C − ω + λ) qQ (9)
with the transversality condition λ(T ) = 0. The dollar value of a marginal increase in cumu-lative sales Q(t) at time t can then be obtained through integrating (9) with the transversalitycondition which yields
λ(t) =T∫
t
((P − C − ω + λ) qQ − CQq
)e−r(s−t)ds. (10)
Typically, sales for a new product starts out slowly but accelerates after a while and thenflattens out as the product matures, in a classic S-shape curve. Notice from (10) that λ(t) isalways positive during the initiation stage of the product launch (i.e., qQ > 0) and decreasesmonotonically if discount rate applied by the company is sufficiently low. This means thatif he is almost indifferent between having one dollar today or sometime in the future, thecompany applies conventional sales wisdom to his new product launch to hit early adoptercommunity first and create a market for the unfamiliar product at the cost of disappointingrevenue growth at this early stage. Furthermore, since early adopters are acquired by directadvertising, the company’s go-to-market strategy could be to immediately allocate majorityof his resources to building awareness through advertising and encouraging purchase—sothe learning process of the company can be far quicker. Then, he would gradually decreaseadvertising spending over time as a critical mass of customers are acquired and sales arebeginning to accelerate. This seems to be reasonable because compared to early adopters(i.e., innovators), imitators require fewer marketing efforts and so are likely to generate morerevenue at a lower cost. It should also be noted that when the manufacturing learning processis short and simple (i.e., γ � 0), λ(t) always becomes negative as the new product movesdeeper into the sales cycle (i.e., qQ < 0), in which case the selling price can be predicted todecrease monotonically over time.
The current value Hamiltonian H obtained in (8) is the sum of the current profit and futurebenefit, and represents the instantaneous total profit of the company at any time t ∈ [0, T ].According to Pontryagin’s maximum principle, the partial derivatives of H with respect to P ,W and A satisfy the following necessary first-order conditions held for an optimal solution;
HP = 0 ⇒ P − C − ω + λ = − q
qP,
HW = 0 ⇒ P − C − ω + λ = ωW q
qW,
HA = 0 ⇒ P − C − ω + λ = 1
qA, (11)
and
HM =⎡⎢⎣
HP P HPW HP A
HW P HW W HW A
HAP HAW HAA
⎤⎥⎦
is a negative definite matrix. Note that H M is the non-singular Heissian matrix of the second-order partial derivatives of Hamiltonian. The second-order conditions for H-maximizationare;
123

Ann Oper Res
HPP < 0 ⇒ 2qP −(
q
qP
)qP P < 0,
HWW < 0 ⇒ −ωW W q − 2ωW qW +(
ωW q
qW
)qW W < 0,
HAA < 0 ⇒ qAA
qA< 0, (12)
and
HPP HWW − H2PW > 0,
HPP HAA − H2PA > 0,
HWW HAA − H2WA > 0, (13)
where
HPW = HWP = 2qW −(
q
qP
)qPW ,
HWA = HAW =(
qW
qP
)qA −
(q
qP
)qWA,
HPA = HAP = qA −(
q
qP
)qP A. (14)
Note that the new product adoption function detailed in (6) is multiplicatively separable inpairs (P, W ) and (A, Q), and it can be restated for ease of analytical tractability in a simpleform as follows:
q = F (P, W ) G (A, Q) (15)
where F (.) is a multivariate function of price and warranty duration, and G (.) is a multivariatefunction of advertising spending and cumulative sales. To analyze the interplay among price,advertising expenditure and warranty duration, we simultaneously solve equations providedin (11) by using equations in (9) and (15), and subsequently derive the following set ofequations that characterizes the optimal solution:19
HPP P + HPW W + HP A A = (−rλFP − F2G Q)
G
HWP P + HWW W + HWA A = FW(−rλFP − F2G Q
)G/FP
HAP P + HAW W + HAA A = F(−rλG A + G Q − GG AQ/G A
)On the basis of above equations, the optimal trajectories of price, warranty duration andadvertising spending can be determined by Cramer’s rule as summarized below:
P =(
HW W + ωW HPW
HPP HW W − H2PW
) (−rλFP − F2G Q)
G (16)
W = −(
HPW + ωW HP P
HPP HW W − H2PW
) (−rλFP − F2G Q)
G (17)
A =(
1
HAA
)F
(−rλG A + G Q − GG AQ/G A)
(18)
19 Dot notation is adopted to represent the derivative with respect to time.
123
Ann Oper Res
Provided in (13) that the term HPP HWW − H2PW is always positive at optimality, whether
the time derivative of price and warranty duration is strictly greater than or less than zerodepends on the signs of HW W + ωW HPW and HPW + ωW HP P , respectively. On the basisof necessary first order conditions, the latter turns out to be strictly greater than zero, yet thesign of the former is not apparent and proclaimed by the following lemma.
Lemma 1 Given that HPW + ωW HPP is strictly greater than 0, HWW + ωW HPW is alwaysless than 0.
Proof See Appendix A. ��
5 Implementation considerations
In this section, we characterize the optimal trajectories of advertising spending, warrantyduration and selling price for a new product rolled out into the market and outline implicationsfor the marketing strategy of the company.
Proposition 1 There exists a threshold level A = rβλ/α2 for the optimal advertising spend-ing at any t ∈ [0, T ) such that if advertising expenditure at a given t reaches this level, itis optimal to maintain it at this amount. If it is below or above this level, then the optimalpolicy is to drive advertising spending towards this level.
Proof See Appendix B. ��Proposition 1 states that a time-variant threshold A on A(t) exists, structuring the adver-
tising strategy of a company for his new product over time. The threshold would shift downwith α2 > 0, whereas r ∈ [0, 1] and β > 0 simply shift the threshold higher. Note that thethreshold is very sensitive to changes in discount rate r and hence the choice of rate has aprominent impact on the optimal trajectory of advertising spending over time. The rate atwhich to discount cash flows reflects a company’s patience—the lower the discount rate, themore patient one is. Settling on a discount rate that is too low (i.e., r � 0) signals that the com-pany is extremely patient and almost guarantees his advertising spending at any time wouldexceed the threshold A provided in Proposition 1. Then, the company should overhaul hisgo-to-market strategy to get his new product into the hands of the early adopters by besiegingthese consumers with heavy advertising and then to gradually cut his advertising expenditureover time. The aim here is to somehow encourage innovators to use the new product so that itis noticed by other people and then rely on word of mouth promotion to harness the consid-erable power of buzz. Interestingly, when r � 0, cutting high advertising outlay continuallyover time turns out to be the optimal strategy even if the new product is a not a good candidatefor buzz marketing and demand is not driven by word of mouth hype among potential buyers.
The threshold A in Proposition 1 also underscores that unless a company sets the discountrate at extremely low values, it is important not to lose sight of the connection between twometrics α2 (i.e., a customer’s referral value) and β (i.e., effectiveness of advertising spending)since these two measures collectively govern the optimal advertising spending. For moderatevalues of r , estimating the value of a customer’s referral power (i.e., his/her ability to bring innew customers) accurately can pay off handsomely as it is positively correlated with the opti-mal trajectory of the company’s advertising expenditure and so with his profit growth. If thecompany ensures that his shoppers communicate positive information about his new productto others, it would shift down the threshold value which in turn orientates the company toward
123
Ann Oper Res
cutting his advertising budget. A high value of referral power is capable of catapulting thenew product from obscurity into a runaway commercial success, and in such cases, the com-pany tunes out budgeting to acquire new customers by means of direct advertising, but ratherattempts to harness the considerable power of buzz, dubbed as “explosive self-generatingdemand.” That is, the company makes his customers his most potent marketing force. On theother hand, high values of α2 and/or low values of β shifts the threshold higher, where theadvertising expenditure at any time will be more likely to beneath the threshold level.
Proposition 1 shows that a company can benefit in several strategic ways by focusingon buzz-worthiness of his new product and the rate at which to discount the cash flows. Itis certain that buzz-worthy factors might be missing in a new product, making the producta bad candidate for buzz marketing.20 Or, the company might be able to launch effectiveadvertising campaigns tailored to the particular customers who typically delight in being thefirst to know about a product. In such cases, the temptation of the company turns out to be toramp up advertising budget to acquire customers as quickly as possible, which should alsoallow him to sell the product efficiently. The bottom line is estimating the discount rate andthen predicting the spread of buzz are integral parts of the new product introduction exercise.Of course, not all new product introduction projects are sensitive to discount rate changes,but even so, applying too high or too low a discount rate in valuations can cause a companyto squander valuable opportunities that it would otherwise snap up. It should be noted thatfor a company that is not extremely patient, assessing the buzz-worthiness of his new productaccurately can help him commit his budget to advertising campaigns effectively over time,which would be integral to the long-term success of the company.
Proposition 2 The optimal trajectories for warranty duration and selling price for a newproduct jointly follow a concave curve over time, reaching a maximum at time t∗ ∈ (0, T )
such that P (t∗) = rλa/qQ.
Proof See Appendix C. ��Turning to collective wisdom, when a company launches a new product, his temptation
should be to immediately ramp up its market price and shorten the period of its initialwarranty in order to capitalize on non-price conscious pioneering customers who typicallyrevel in being the early adopters of a new product and absorb risks on unproven technology.Yet as pronounced in Proposition 2, it would be potentially dysfunctional and inefficient inthe initiation phase of the new product. If a company applies conventional sales wisdomto his new product launch and soar the prices too fast under short-range warranties, theresult is most likely to be disappointing revenue growth and a cash shortfall over time. That’sbecause the conventional wisdom fails to address two factors involved in creating markets fornew products: there is a distinct correlation between the selling price and after-sales warrantyservices, and the sales process of the unfamiliar product unfolds through transfer of experiencebetween early adopters and late adopters. Breaking new ground on collective sales wisdom,Proposition 2 states that it is essential to the success of a new product launch to develop animble schedule where the company would price and offer after-sales warranty support on thediffusion curve. That is, the company should deliberately set selling prices low and the periodof the warranty short on the early production runs to stimulate volume that will underwrite hisefforts to learn more about the production process of the unfamiliar product that would lower
20 Products ripe for word of mouth are often unique in some respect such as in functionality, ease of use orefficacy. As a case in point, the degree of difference for the PT Cruiser of Chrysler from the competing brandsclearly lies in its retro look. In case of collapsible scooters, functionality and ease of use can be named as thekey buzz-worthy factors.
123
Ann Oper Res
production costs and make it more efficient at selling, and increase both collectively as morecustomers adopt and use the product. During this learning phase, the revenue expectationsare set to be lower and the negative effect of mounting prices over time is offset by extendingthe period of the warranties. In other words, with increasing market prices, the companystarts delivering additional value that customers get out of using his new product, havingrecognized that otherwise the sales would slow down and profit margins could implode.
Applying the concept of a new product diffusion curve as a strategic construct means thatselling price and warranty duration start out at low levels, increase promptly for a while,and then flattens out in a classic S-shape curve. Related to this point, the second part ofProposition 2 unveils that the steepness of the curve for price and warranty period variesslightly from the S-shape sales curve. To put it bluntly, the pricing and after-sales supportprocess result in a curve that is shifted to the left and slightly steeper in comparison to salescurve which is initially longer and flatter. Clearly, the shorter the curve, the shorter it takes toreach the maximum levels. This means that selling price and warranty duration reach theirmaximum levels before the new product matures. When the formula for success is in place,this finding implies that once new product achieves traction in the marketplace, the companyshould already have started to offer lower levels of after-sales support to his customers whichin turn necessitates lowering the market price of the product. At later stages, the companyoffers the product to late adopters (e.g., late majority and laggards) at throwaway prices,knowing that they have the lowest financial liquidity, and shortens the warranty duration at arate commensurate with the fall in the prices to reduce the costs of responding to breakdowns.The bottom line is pricing and after-sales warranty support decisions are interrelated and varyat different stages of a new product’s market penetration, and the company must study salescurve and act upon accordingly not to leave profits behind on the table.
6 Numerical analysis
The analysis carried out so far embodies a major challenge: an analytical representation ofthe optimal trajectories of marketing-mix variables is out of reach due to the complexity ofthe sales rate function. Therefore, we resort to a numerical benchmark example and thento a numerical sensitivity analysis with numerous cases in order to characterize the effectsof market-related and product-related parameters on the market penetration of new productover time and to provide the basis for the discussion of important insights.
6.1 Benchmark case
In this section, we develop a numerical example, where the parameter values are drawnupon prior empirical studies, to illustrate how a company can sell a new product efficientlyand how customers acquire.21 In the succeeding section, we will look at it as a frameworkfor analyzing how to develop thoughtful new product introduction strategies, reduce boththe time and money required to reach sustainable profitable levels of sales, and so avoidpremature abortion of a promising offering.
As is apparent from the sales rate function, there are several parameters of interest impact-ing the adoption of a new product over time. To start with, on the supply side, the per unitproduction cost of a new durable consists of the concept of manufacturing learning curve and
21 For the reference values of parameters used in our numerical analysis, see Robinson and Lakhani (1975),Glickman and Berger (1976), Horsky and Simon (1983) and Huang et al. (2007).
123

Ann Oper Res
Table 1 Optimal trajectories ofadvertising, warranty durationand price
Period A∗i W∗
i P∗i
0 – – –
1 15,329.09 0.30 436.14
2 5,024.65 3.15 1,419.29
3 3,326.40 6.20 1,992.16
4 2,237.21 7.68 2,217.88
5 1,599.61 6.96 2,110.26
6 1,461.93 2.56 1,279.10
the cost of responding to random product breakdowns. For the former, the parameters K , c0,Q0 and γ are set at 2, 100, 100 and 0.4, respectively. The value of γ = 0.4 means that as thecompany progresses along the learning curve, the unit production cost falls 25 % each timehis accumulated production volumes double. For the latter, the parameters κ , cr and ρ are setat 1, 80 and 0.5, respectively. Note that the Weibull shape factor ρ reflects whether the failurerate is increasing, decreasing or stable, and the value of ρ = 0.5 designates a decreasing rate.In addition to parameters structuring the costs of production and costs of warranty, the salesrate function is composed of parameters k1, a, k2, b, α, β, α2 and QM , which are set at 2, 2,0, 0.1, 200, 800, 100, and 10,000, respectively. Finally, suppose the rate at which to discountcash flows is r = 0.1, and terminal time of the planning horizon is T = 6. Based on theseparameter values, the discounted expected profit of the company can be presented as follows:
=6∫
0
((P (t) − 200
(100
Q(t)
)0.4
− 80 (W (t))0.5
)q (t) − A (t)
)e−0.1t dt (19)
In order to solve the continuous optimal control problem of this benchmark case with theobjective function given in (19), we initially convert it into an analog discrete problem usingthe discretization method introduced by Rosen (1968). Then, we solve the respective discrete-time problem and obtain the numerical results summarized below.
The numerical results presented in Table 1 demonstrate the analytical findings of Propo-sitions 1 and 2 on the optimal trajectories of the marketing variables of interest. We observethat the company would heavy-up his advertising spending at an outlay of $15, 329.09 in theinitiation phase of the new product to be heard by the innovators in the marketplace and cutit at a diminishing rate over time. The underlying reason behind the cut in advertising budgetafter each period lies in the threshold level A proposed in Proposition 1. Knowing that A isvery sensitive to discount rate r , settling on a value of r = 0.1 ensures that advertising spend-ing at any period would fall above the threshold and so would drive the company to decreasehis advertising spending. Even though the ratio of effectiveness of advertising spending to acustomer’s referral power is relatively high, this company with high appetite for distant pay-backs relies on word of mouth marketing. Secondly, note that heavy advertising investmentin period 1 is not coupled with a commonsense pricing and after-sales support policy. Insteadof falling victim to the conventional wisdom and marrying up high advertising expenditurewith premium prices, the company introduces the product into the market at a price of just$436.14 under a warranty duration of 0.30 time units. That is to say, by spending at a levelloud enough to be heard at all by the innovators and pricing the product at throwaway lev-els, the company resists the lure of short-term profits. Nonetheless, the net benefit would besubstantial. Table 1 also shows that pricing and after-sales support strategy of the companymarch hand in hand at optimality: these two variables follow a diffusion-curve pattern, both
123
Ann Oper Res
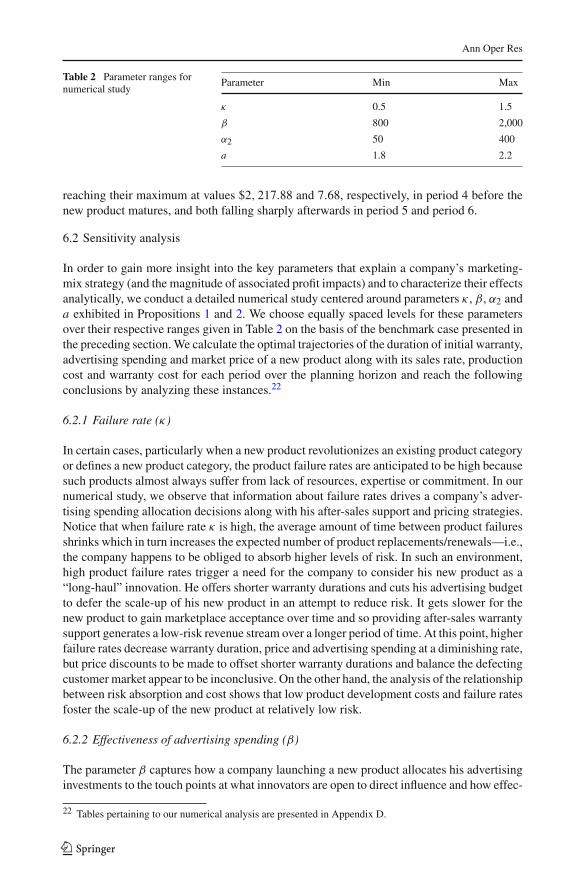
Table 2 Parameter ranges fornumerical study
Parameter Min Max
κ 0.5 1.5
β 800 2,000
α2 50 400
a 1.8 2.2
reaching their maximum at values $2, 217.88 and 7.68, respectively, in period 4 before thenew product matures, and both falling sharply afterwards in period 5 and period 6.
6.2 Sensitivity analysis
In order to gain more insight into the key parameters that explain a company’s marketing-mix strategy (and the magnitude of associated profit impacts) and to characterize their effectsanalytically, we conduct a detailed numerical study centered around parameters κ , β, α2 anda exhibited in Propositions 1 and 2. We choose equally spaced levels for these parametersover their respective ranges given in Table 2 on the basis of the benchmark case presented inthe preceding section. We calculate the optimal trajectories of the duration of initial warranty,advertising spending and market price of a new product along with its sales rate, productioncost and warranty cost for each period over the planning horizon and reach the followingconclusions by analyzing these instances.22
6.2.1 Failure rate (κ)
In certain cases, particularly when a new product revolutionizes an existing product categoryor defines a new product category, the product failure rates are anticipated to be high becausesuch products almost always suffer from lack of resources, expertise or commitment. In ournumerical study, we observe that information about failure rates drives a company’s adver-tising spending allocation decisions along with his after-sales support and pricing strategies.Notice that when failure rate κ is high, the average amount of time between product failuresshrinks which in turn increases the expected number of product replacements/renewals—i.e.,the company happens to be obliged to absorb higher levels of risk. In such an environment,high product failure rates trigger a need for the company to consider his new product as a“long-haul” innovation. He offers shorter warranty durations and cuts his advertising budgetto defer the scale-up of his new product in an attempt to reduce risk. It gets slower for thenew product to gain marketplace acceptance over time and so providing after-sales warrantysupport generates a low-risk revenue stream over a longer period of time. At this point, higherfailure rates decrease warranty duration, price and advertising spending at a diminishing rate,but price discounts to be made to offset shorter warranty durations and balance the defectingcustomer market appear to be inconclusive. On the other hand, the analysis of the relationshipbetween risk absorption and cost shows that low product development costs and failure ratesfoster the scale-up of the new product at relatively low risk.
6.2.2 Effectiveness of advertising spending (β)
The parameter β captures how a company launching a new product allocates his advertisinginvestments to the touch points at what innovators are open to direct influence and how effec-
22 Tables pertaining to our numerical analysis are presented in Appendix D.
123
Ann Oper Res
tively he tailors his advertising campaigns to the particular needs of these customers at thosepoints. A small value of β points out a mismatch between advertising investments and thetouch points at which a company contacts innovators, precluding him from building aware-ness among these consumers, driving their consideration and subsequently inspiring them topurchase the new product. Based on that our numerical analysis proclaims that interactingappropriately with innovators at the touch points by means of advertising campaigns enablesa company to achieve superior returns on his advertising investments. Even though the basicpremise of the increasing values of β on the sales rate of a new product is not noticeable sothat its diffusion pattern is almost not influenced, its implications for marketing appear to beprofound. Two in particular stand out. First, with higher values of β, the company generatesever-escalating amounts of advertising content, coupled with premium prices and extendedwarranties—all increase at an increasing rate for a given period of time. Yet the optimalprofit does not reflect the same pattern of change as do the marketing variables and increasesat a diminishing rate. Secondly, when β ≥ 1,600, the company cuts his advertising budgetat a decreasing rate and uses decreasingly less resources to build awareness over time untilperiod 5. However, from this period onwards, he realigns his advertising spend and starts toallocate/use more resources to drive purchase. The optimal trajectory of advertising invest-ment in this environment underscores the importance of recognizing the need for differentmind-sets in early- and late-stage product adoption process when effectiveness of advertisingspending is high. Therefore, determining which touch points are powerful to exploit salesinteractions with innovators and so should be priorities for the company, how to reach andleverage them, and how to allocate advertising resources accordingly at these points shouldbe central to new product introduction strategy.
6.2.3 Effectiveness of word of mouth (α2)
In many product categories, essentially in slow-moving consumer goods markets, the singlemost powerful impetus for a potential customer to buy a new product turns out to be someoneelse’s advocacy. In these instances, consumers seek input from their peers and their outreachto those sources of information significantly shapes their ensuing purchasing decisions—rather than does the company’s push to persuade them. The parameter α2 in our modelrepresents a customer’s referral power. That is, it reflects a person’s ability to bring on boardnew profitable customers such that with a higher value of α2, a customer passes on the goodword to an increasing number of people and subsequently acquires them for the company.In this line, our numerical analysis reveals that referral power is positively correlated withthe company’s profit growth. The increase in referral value chalks up substantial increasesin profits. Doubling up α2 from 200 to 400, for instance, increases the overall profits by anaverage of $6, 744, 076, representing almost a 50 % increase, which is a vast improvement onthe returns the company gets from his investments. Any action that would increase the referralpower also raises the warranty duration and price geometrically for each period at optimality.Yet this is not the case with the advertising spending of the company—it follows a concavepath with increasing values of α2. That is, while moderate values of referral power translatesinto higher advertising expenditures at a given period, advertising spending decreases as thereferral power of a customer moves toward extremes. More notably, when α2 = 400, weobserve as in the case of β that the company pursues two different advertising strategiesin early- and late-stage product adoption process. The advertising spending decreases at adiminishing rate until period 5 and then raises rapidly in period 6. All these observations showthat a company earns a better return on his marketing investment if he focuses on drivingadvocacy and accurately targets those of his customers that are likely to make profitable
123
Ann Oper Res
referrals. Then, in many situations, the company should ensure that he not only focuses hisefforts on increasing purchases but also makes it easier for his customers to pass on thepositive information about his new product to others in the market.
6.2.4 Price elasticity (a)
Positioning a new product presents a company with a major challenge: the company mustensure that his new product appeals to the price-consciousness of customers he wants to courtwhile sustaining a profit. Take, for example, low- and middle-income new adopters. Theseshoppers are likely to be price-sensitive customers who do not want to pay premium pricesfor an unfamiliar product. This behavior is factored into the model by using higher a values,in which case the obvious strategic response of the company appears to be a price reduction.For instance, when a is increased from 2.0 to 2.2, the company slashes prices on his newproduct by 53 % on average to attract budget conscious shoppers and so boost sales. Yet pricecuts reduce profits—the company sees an average of 55 % drop in profits. Steep price cutserode the new product’s profits because the company matches his new product’s low priceswith aggressively shorter warranty durations in order to keep the product above the fray. Thedurations of the warranty are shortened by 81 % on average over the planning horizon and thisin turn increases customers’ perception of risk on their buying decision. Then, deep discountsindirectly devalue the new product, preventing the company from transferring more of his cus-tomers’ money to his bottom line. It should also be noted that the advertising spending dropsfollowing the price cuts and shortened warranties. On the other hand, when a is decreasedfrom 2.0 to 1.8, the company prices his new product at a level that is 162 % higher than theprevious price points on average and extends the warranty durations accordingly, recogniz-ing that customers demand more compensation to endure price premiums. As a result, thecompany sees his profits jump sharply by 164 %. Lastly, as price-sensitivity of customersapproaches extremes, the advertising strategy of the company and so the optimal trajectory ofhis advertising spending changes. When a = 1.8 or a = 2.2, the optimal advertising expen-diture decreases at a diminishing rate until period 5 and then suddenly increases in period 6.
7 Concluding remarks
New product introduction is seen as a path to the long-term success of any company, sinceproducts under development at any point in time represent potential sales long into the future.In today’s hyper-competitive marketplace, companies that successfully introduce innovativenew products are more likely to flourish than those that fail at introducing those products.That’s said, new product introduction is an intrinsically risky endeavor nowadays and it is hardfor any new product to gain marketplace acceptance. Recent studies consistently show thatthe failure rates of new products are strikingly high with estimates varying from 40 to 90 %,depending upon the product categories, and failure rates are widely reported to be higher forhighly innovative new products compared to less-innovative ones. Recent examples includethe MessagePad, the Segway and the Cell Zone, all of which have struggled or failed inthe marketplace. In the end, one is left with a sobering view of new product introductionand two significant questions to be answered: (1) Why do innovative new products fail?and (2) Given that many companies’ ultimate success or failure depends on the successfuladoption of innovative products, how can managers increase the odds that innovative newproducts will succeed? Current thinking may identify a number of potential solutions, oneof which lies in the marketing-mix strategies adopted by companies. That is, managers can
123
Ann Oper Res
help innovative new products to succeed in the consumer market by understanding the roleof certain marketing-mix variables in new product adoption process, anticipating the rate ofproduct adoption and tailoring marketing efforts accordingly.
In this paper, on the basis of extant literature in fields ranging from operations to marketingto entrepreneurship, we explore how best to structure the marketing strategy of a companyto foster and leverage his innovative new product with a focus on three variables—namelywarranty duration, advertising spending and selling price—and attempt to provide a theo-retical explanation for factors affecting trajectories of these variables over time. In doingso, we treat such product-related decisions as features and quality as exogenous, and hencerule out such product-based causes of new product failures as compatibility and complexity.Instead, we focus on consumer-based and developer-based causes of new product failuresby placing potential shoppers into one of two categories—innovators and imitators—andfactoring certain market- and product-related parameters into the analysis. Based on thatour framework starts with an analytical structuring of the optimal trajectories of warrantyduration, advertising spending and selling price for a new product over the planning horizon.Drawing upon the empirical and theoretical findings, we formulate the profit-maximizationproblem of a company that rolls out a new product into the market and investigate how thiscompany should adjust his marketing-mix strategies over time in order to reach sustainableprofitable levels of sales and so to avoid premature abortion of his promising offering. Then,we conduct a detailed numerical study in order to test which market- and product-relatedfactors have the most influence on and best explain the company’s new product introductionstrategy, and to illustrate the magnitude of associated profit impacts.
The key structural and managerial insights from our analysis are as follows. First, ouranalysis proposes a time-variant threshold on advertising spending. Being dependent uponthe discount rate set by the company, referral power of customers in the market and effec-tiveness of the company’s advertising spending, we show that the threshold structures thecompany’s advertising over time such that if the advertising expenditure at any time overthe planning horizon is below or above the threshold, then the firm drives his advertisingspending towards this level. Secondly, our analysis points out that the company should priceand offer after-sales warranty support on the diffusion curve of this new product, and thesetwo marketing variables collectively reach their maximum levels before this new productmatures. Then, in order to drive future revenues and profits, company managers should applythe concept of a new product diffusion curve as a strategic construct to recalibrate the after-sales support and pricing strategies of their promising new offerings. Our numerical resultsalso provide guidance about the effect of certain market oriented factors on a company’s newproduct introduction strategy. First, the analysis of the relationship between risk absorptionand cost shows that low failure rates coupled with low product development costs foster thescale-up of the new product at relatively low risk. Secondly, we demonstrate that determiningthe touch points at which consumers are best influenced, how to reach and leverage them,and how to allocate advertising resources accordingly at these points should be a priority ina company’s new product introduction strategy. Third, companies should identify the cus-tomers who bring in the most referrals and then attempt to capitalize on that knowledge bymaking it easier for their customers to communicate positive information about their prod-ucts to others rather than just putting forth their marketing efforts on increasing purchases.Besides, when advertising spending effectiveness of company and/or referral power value ofa customer are high, two different mind-sets should shape the company’s advertising strategyin early- and late-stage product adoption process.
Among the many possible extensions of our work, two in particular seem promising.First of all, it should be noted that most new products that pioneer new product categories or
123

Ann Oper Res
improve upon old ones require customers to change their behavior. And, when shoppers adoptsuch products that deliver more value than incumbent products, those behavior changes entailcosts. For example, in switching to an electric car from a gasoline-only alternative, consumersincur the loss of easy refueling and convenience. Similarly, by buying and using a Segwayscooter, consumers gain mobility but this comes at the cost of health benefits of walking.The greater the product change, the more behavior change the new products demand fromconsumers. And, the bigger the behavior change, the bigger the resistance from consumersis likely to be. This means that it is not enough for a new product simply to be better than orsuperior to incumbent products. Consumers consider to adopt it only if the gains outweighthe losses to be incurred from using it. In other words, consumers often fail to buy productscompanies expect them to adopt and the reason does not necessarily lie in the economic valueof the new product but rather can be tied up to the degree of behavior change it requires. Inthis line, bringing the effect of behavior change demanded by a new product to the decisionmaking process might be a valuable and interesting extension. Secondly, recall that the valueof any customer resides both in what that person buys and in that person’s ability to bring innew customers. The referral power of a customer can substantially influence revenues andprofits, and that’s why both purchase and referral dimensions are taken into consideration inthis paper. Yet it should also be underlined that not all customers have the same referral values— while some of them might be very active in passing on the good word to others, goodintensions might remain just good intensions for some. In this line, a worthwhile extensionwould be to segment the customers in the marketplace according to their referral values andto incorporate that segmentation scheme into the analysis to examine how different referralvalues of customers affect the marketing strategy of the company.
Appendix A: Proof of Lemma 1
The proof is by contradiction. Suppose that HW W + ωW HPW > 0. Then, HW W >
−ωW HPW , and multiplying both sides of the inequality by HP P results in the followinginequality;
HPP HW W < −ωW HPP HPW ,
where the direction of the inequality changes as HPP < 0. Recall from the second-orderconditions provided in (13) that HPP HW W > H2
PW . Thus,
H2PW < HPP HW W < −ωW HPP HPW ,
meaning that H2PW < −ωW HPP HPW and HPW (HPW + ωW HPP) < 0. Since HPW > 0,
the value of (HPW + ωW HPP) must be less than 0 and this is a contradiction. The prooffollows. ��
Appendix B: Proof of Proposition 1
In (18), the optimal advertising trajectory is defined by
A =(
1
HAA
)F
(−rλG A + G Q − GG AQ/G A). (20)
Since HAA < 0 and F > 0, the sign of A is determined by(−rλG A + G Q − GG AQ/G A
).
That is, if
123

Ann Oper Res
− rλG A + G Q − GG AQ
G A> 0, (21)
then A < 0, and A > 0 otherwise. Recall that G is given by (QM − Q (t)) (α + β ln A(t)+α2 Q(t)), and substituting this into (21) results in
A(t) >rβλ
α2. (22)
Let A represent rβλ/α2. Then, at any time t , A < 0 if A(t) > A, A = 0 if A(t) = A andA > 0 if A(t) < A. The proof follows. ��
Appendix C: Proof of Proposition 2
The concave trajectory followed collectively by warranty duration and price over time isobtained from (6), (16), (17), (18), Lemma 1 and Proposition 1 through retracing similarsteps taken in the proof of Proposition 1.
Regarding the time t at which both variables attain their maximum, note that the timederivatives of warranty duration and price must be equal to 0 at t . In other words, rλFP +F2G Q must be equal to 0 on the basis of expressions in (16), (17) and (18). Substitutingsales rate function in (6) for the terms in this equality leads to the following condition:
k1
((W (t) + k2)
b
P(t)−a
) [− rλa
P(t)+ k1 (W (t) + k2)
b P(t)−a (−α − β ln A(t)
+ α2 (QM − 2Q(t)) )
]= 0 (23)
Notice that the second term in the brackets is the explicit representation of qQ and themultiplier in front of the brackets is positive. Then, the condition provided in (23) can berestated in a simpler form so that P(t) = rλa/qQ , and the proof follows. ��
Appendix D: Tables for numerical analysis
See Tables 3, 4, 5 and 6.
Table 3 Sensitivity to failure rate (κ)
Period κ = 0.5 κ = 1.0 κ = 1.5
W∗i A∗
i P∗i W∗
i A∗i P∗
i W∗i A∗
i P∗i
1 0.30 15,329.1 436.1 0.37 15,347.7 483.5 0.19 15,329.8 427.5
2 3.15 5,024.6 1,419.3 3.24 5,116.5 1,441.1 2.01 5,024.5 1,385.7
3 6.20 3,326.4 1,992.2 6.36 3,290.6 2,010.4 3.94 3,325.7 1,944.0
4 7.68 2,237.2 2,217.9 7.81 2,249.4 2,228.0 4.91 2,237.3 2,168.7
5 6.96 1,599.6 2,110.3 6.96 1,678.6 2,115.7 4.44 1,600.6 2,062.9
6 2.56 1,461.9 1,279.1 2.58 1,569.1 1,282.4 1.63 1,463.6 1,250.5
Profit $9, 468, 698 $9, 588, 981 $9, 243, 494
123

Ann Oper Res
Table 4 Sensitivity to advertising effectiveness (β)
Period β = 800 β = 1,200 β = 1,600 β = 2,000
W∗i A∗
i P∗i W∗
i A∗i P∗
i W∗i A∗
i P∗i W∗
i A∗i P∗
i
1 0.30 15,329.1 436.1 0.37 15,347.7 483.5 0.44 19,435.0 532.3 0.56 67,811.2 597.1
2 3.15 5,024.6 1,419.3 3.24 5,116.5 1,441.1 3.35 9,419.4 1,466.0 3.50 13,425.4 1,497.1
3 6.20 3,326.4 1,992.2 6.36 3,290.6 2,010.4 6.41 6,669.7 2,024.3 6.52 8,443.1 2,043.5
4 7.68 2,237.2 2,217.9 7.81 2,249.4 2,228.0 7.84 5,610.8 2,241.0 7.94 5,415.6 2,254.7
5 6.96 1,599.6 2,110.3 6.96 1,678.6 2,115.7 7.07 5,069.2 2,126.9 7.14 4,748.1 2,137.8
6 2.56 1,461.9 1,279.1 2.58 1,569.1 1,282.4 2.58 5,077.1 1,286.3 2.60 9,486.0 1,290.7
Profit $9, 468, 698 $9, 588, 981 $9, 709, 850 $9, 815, 848
Table 5 Sensitivity to word of mouth effectiveness (α2)
Period α2 = 50 α2 = 100 α2 = 200 α2 = 400
W ∗i A∗
i P∗i W ∗
i A∗i P∗
i W ∗i A∗
i P∗i W ∗
i A∗i P∗
i
1 0.22 14,550.3 373.2 0.30 15,329.1 436.1 0.46 14,493.4 545.7 0.79 14,438.1 727.1
2 1.46 4,340.6 965.1 3.15 5,024.7 1,419.3 6.87 3,840.5 2,096.07 14.28 4,069.8 3,061.8
3 2.85 2,449.8 1,353.7 6.20 3,326.4 1,992.2 13.58 2,281.3 2,942.64 29.68 2,164.9 4,367.6
4 3.58 1,729.9 1,512.1 7.68 2,237.2 2,217.9 16.63 1,640.2 3,263.94 35.41 1,401.5 4,790.4
5 3.21 1,367.2 1,434.1 6.96 1,599.6 2,110.3 14.97 1,326.8 3,098.87 33.92 1,036.0 4,607.1
6 1.21 1,406.9 872.8 2.56 1,461.9 1,279.1 5.53 1,314.3 1,879.67 11.77 1,083.1 2,758.7
Profit $6, 401, 083 $9, 468, 698 $14, 026, 805 $20, 770, 881
Table 6 Sensitivity to price elasticity (a)
Period a = 1.8 a = 2.0 a = 2.2
W∗i A∗
i P∗i W∗
i A∗i P∗
i W∗i A∗
i P∗i
1 1.40 25,531.2 851.5 0.30 15,329.1 436.1 0.09 9,615.4 260.4
2 31.35 12,928.7 4,030.8 3.15 5,024.6 1,419.3 0.50 3,041.4 619.1
3 62.50 10,045.1 5,695.1 6.20 3,326.4 1,992.2 0.96 1,268.2 864.3
4 76.57 9,144.7 6,294.9 7.68 2,237.2 2,217.9 1.21 1,029.5 969.3
5 65.97 8,711.9 5,847.5 6.96 1,599.6 2,110.3 1.14 486.2 940.3
6 19.07 8,871.3 3,141.3 2.56 1,461.9 1,279.1 0.50 620.1 621.3
Profit $24, 955, 485 $9, 468, 698 $4, 218, 869
References
Arrow, K. J. (1962). The economic implications of learning by doing. Review of Economic Studies, 29(3),155–173.
Bagwell, K. (2007). The economic analysis of advertising, handbook of industrial organization, vol 3. Elsevier,chap 28, pp. 1701–1844.
Barucci, E., & Gozzi, F. (1999). Optimal advertising with a continuum of goods. Annals of OperationsResearch, 88, 15–29.
123

Ann Oper Res
Bass, F. M. (1969). A new product growth model for consumer durables. Management Science, 15, 215–227.Bohn, R. E. (1995). Noise and learning in semiconductor manufacturing. Management Science, 41, 31–42.DeCroix, G. A. (1999). Optimal warranties, reliabilities and prices for durable goods in an oligopoly. European
Journal of Operational Research, 112, 554–569.den Bulte, C. V., & Lilien, G. L. (1997). Bias and systematic change in the parameter estimates of macro-level
diffusion models. Marketing Science, 16, 338–353.Dockner, E., & Jorgensen, S. (1988b). Optimal pricing strategies for new products in dynamic oligopolies.
Marketing Science, 7, 315–334.Dockner, E., & Jorgensen, S. (1988a). Optimal advertising policies for diffusion models of new product
innovations in monopolistic situations. Management Science, 34, 119–130.Dockner, E., Feichtinger, G., & Sorger, G. (1989). Interaction of pricing and advertising under dynamic
conditions. Berlin: Springer.Dodson, J. A., & Muller, E. (1978). Models of new product diffusion through advertising and word-of-mouth.
Management Science, 24(15), 1568–1578.Ebeling, C. E. (1997). An introduction to reliability and maintainability engineering. New York: McGraw-Hill.Epple, D., Argote, L., & Murphy, K. (1996). An empirical investigation of the microstructure of knowledge
acquisition and transfer through learning by doing. Operations Research, 44, 77–86.Favaretto, D., & Viscolani, B. (1999). A multiperiod production and advertising problem for a seasonal product.
Annals of Operations Research, 88, 31–45.Gerner, J., & Bryant, W. K. (1981). Appliance warranties as a market signal. Journal of Consumer Affairs, 15,
75–86.Glickman, T. S., & Berger, P. D. (1976). Optimal price and protection period decisions for a product under
warranty. Management Science, 22(12), 1381–1390.Horsky, D., & Simon, L. S. (1983). Advertising and the diffusion of new products. Marketing Science, 2(1),
1–17.Huang, H. Z., Liu, Z. J., & Murthy, D. N. P. (2007). Optimal reliability, warranty and price for new products.
IIE Transactions, 39, 819–827.Jain, D. C., & Rao, R. C. (1990). Effect of price on the demand for durables: Modeling, estimation and findings.
Journal of Business and Economics Statistics, 8, 163–170.Jorgensen, S. (1983). Optimal control of a diffusion model of a new product acceptance with price dependent
total market potential. Optimal Control Applications and Methods, 4, 269–276.Jorgensen, S., Kort, P. M., & Zaccour, G. (1999). Production, inventory and pricing under cost and demand
learning effects? European Journal of Operational Research, 117, 382–395.Kalish, S. (1983). Monopolist pricing with dynamic demand and production cost. Marketing Science, 31,
1569–1585.Kalish, S. (1985). A new product adoption model with pricing, advertising and uncertainty. Management
Science, 31, 1569–1585.Kamakura, W., & Balasubramanian, S. K. (1988). Long-term view of the diffusion of durables. International
Journal of Research of Marketing, 5(1), 1–13.Katehakis, M. N., & Smit, L. C. (2012). On computing optimal (Q, r) replenishment policies under quantity
discounts. Annals of Operations Research, 200, 279–298.Kim, B., & Park, S. (2007). Optimal pricing, EOL (end of life) warranty, and spare parts manufacturing strategy
amid product transition. European Journal of Operational Research, 188(3), 723–745.Kouvelis, P., & Mukhopadhyay, S. K. (1995). The effects of learning on the firm optimal design qualiy path.
European Journal of Operational Research, 84, 235–246.Krishnamoorthy, A., Prasad, A., & Sethi, S. P. (2010). Optimal pricing and advertising in a durable-good
duopoly. European Journal of Operational Research, 200, 486–497.Krishnan, T. V., Bass, F. M., & Jain, D. C. (1999). Optimal pricing strategy for new products. Management
Science, 45, 1650–1663.Krishnan, T. V., & Jain, D. C. (2006). Optimal dynamic advertising policy for new products. Management
Science, 52, 1957–1969.Lin, P. C., & Shue, L. Y. (2005). Application of optimal control theory to product pricing and warranty with
free replacement under the influence of basic lifetime distributions. Computer and Industrial Engineering,48, 69–82.
Lin, P. C. (2008). Optimal pricing, production rate and quality under learning effects. Journal of BusinessResearch, 61, 1152–1159.
Mahajan, V., Muller, E., & Bass, F. M. (2005). New product diffusion models in marketing: A review anddirections for research. The Journal of Marketing, 54, 1–26.
Mamer, J. W. (1987). Discounted and per unit costs of product warranty. Management Science, 33(7), 916–930.
123
Ann Oper Res
Mazzola, J. B., & McCardle, K. F. (1997). The stochastic learning curve: Optimal production in the presenceof learning-curve uncertainty. Operations Research, 45(3), 440–450.
Menezes, M. A. J., & Currim, I. S. (1992). An approach for determination of warranty length. InternationalJournal of Research in Marketing, 9, 177–195.
Menke, W. W. (1969). Determination of warranty reserves. Management Science, 15, 542–549.Mesak, H. I., & Berg, W. D. (1995). Incorporating price and replacement purchases in new product diffusion
models for consumer durables. Decision Sciences, 26, 425–449.Mesak, H. I. (1996). Incorporating price, advertising and distribution in diffusion models of innovation: Some
theoretical and empirical results. Computers & Operations Research, 23, 1007–1023.Mesak, H. I. (1998). Monopolist optimum pricing and advertising policies for diffusion models of new product
innovations. Optimal Control Applications and Methods, 19, 111–136.Murthy, D. N. P. (2006). Product warranty and reliability. Annals of Operations Research, 143, 133–146.Robinson, B., & Lakhani, C. (1975). Dynamic price models for new-product planning. Management Science,
21(10), 1113–1122.Rogers, E. M. (1983). Diffusion of innovations. New York: The Free Press.Rosen, J. B. (1968). Numerical solution of optimal control problems. American Mathematical Society.Savsar, M. (2006). Effects of maintenance policies on the productivity of flexible manufacturing cells. Omega—
The International Journal of Management Science, 34, 29–39.Sethi, S. P., & Bass, F. M. (2003). Optimal pricing in a hazard rate model of demand. Optimal Control
Applications and Methods, 24, 183–196.Sethi, S. P., Prasad, A., & He, X. (2008). Optimal advertising and pricing in a new-product adoption model.
Journal of Optimization Theory & Applications, 139, 351–360.Shi, J., Katehakis, M. N., & Melamed, B. (2013). Martingale methods for pricing inventory penalties under
continuous replenishment and compound renewal demands. Annals of Operations Research, 208, 593–612.Swami, S., & Khairnar, P. J. (2006). Optimal normative policies for marketing of products with limited
availability. Annals of Operations Research, 143, 107–121.Swami, S., & Dutta, A. (2010). Advertising strategies for new product diffusion in emerging markets: Propo-
sitions and analysis. European Journal of Operational Research, 204, 648–661.Teng, J. T., & Thompson, G. L. (1985). Optimal strategies for general price-advertising models. Amsterdam:
North-Holland.Teng, J. T., & Thompson, G. L. (1996). Optimal strategies for general price-quality decision models of new
products with learning production costs. European Journal of Operations Research, 93(3), 823–831.Wright, T. P. (1936). Factors affecting the cost of airplanes. Journal of Aeronautical Sciences, 3, 122–128.Wu, C. C., Lin, P. C., & Chou, C. Y. (2006). Determination of price and warranty length for a normal lifetime
distributed product. International Journal of Production Economics, 102, 95–107.Wu, C. C., Chou, C. Y., & Huang, C. (2009). Optimal price, warranty length and production rate for free replace-
ment policy in the static demand market. Omega—The International Journal of Management Science, 37,29–39.
Yelle, L. E. (1979). The learning curve: Historical review and comprehensive survey. Decision Sciences, 10,302–328.
123