Embed Size (px)
Citation preview
Research article
1444 The Journal of Clinical Investigation http://www.jci.org Volume 114 Number 10 November 2004
A role for proteinase-activated receptor–1 in inflammatory bowel diseases
Nathalie Vergnolle,1 Laurie Cellars,1 Andrea Mencarelli,2 Giovanni Rizzo,2 Sunita Swaminathan,3 Paul Beck,3 Martin Steinhoff,4 Patricia Andrade-Gordon,5 Nigel W. Bunnett,6
Morley D. Hollenberg,1 John L. Wallace,1 Giuseppe Cirino,7 and Stefano Fiorucci2
1Department of Pharmacology and Therapeutics, University of Calgary, Calgary, Alberta, Canada. 2Department of Internal Medicine, University of Perugia, Perugia, Italy. 3Department of Medicine,
University of Calgary, Calgary, Alberta, Canada. 4Department of Dermatology, University of Münster, Münster, Germany. 5Drug Discovery, Johnson & Johnson Pharmaceutical Research and Development, Spring House, Pennsylvania, USA. 6Department of Surgery and Physiology, UCSF, San Francisco, USA.
7Department of Experimental Pharmacology, University of Naples, Naples, Italy.
Proteinase-activated receptor–1 (PAR1), a G protein–coupled receptor activated by thrombin, is highly expressed in different cell types of the gastrointestinal tract. The activity of thrombin and of other proteinases is significantly increased in the colon of inflammatory bowel disease (IBD) patients. Since PAR1 activation in tissues other than the gut provoked inflammation, we hypothesized that PAR1 activation in the colon is involved in the pathogenesis of IBD. Here, we demonstrate that PAR1 is overexpressed in the colon of IBD patients. In mice, intracolonic administration of PAR1 agonists led to an inflammatory reaction character-ized by edema and granulocyte infiltration. This PAR1 activation–induced inflammation was dependent on B and T lymphocytes. Moreover, PAR1 activation exacerbated and prolonged inflammation in a mouse model of IBD induced by the intracolonic administration of trinitrobenzene sulfonic acid (TNBS), while PAR1 antagonism significantly decreased the mortality and severity of colonic inflammation induced by TNBS and dextran sodium sulfate. In these 2 models, colitis development was strongly attenuated by PAR1 deficiency. Taken together, these results imply an important role for PAR1 in the pathogenesis of experimental colitis, supporting the notion that PAR1 inhibition may be beneficial in the context of IBD and possibly in other chronic intestinal inflammatory disorders.
IntroductionProteinase-activated receptors (PARs) are a family of G protein–coupled receptors activated by the proteolytic cleavage of their N-terminal extracellular domain (1, 2). The newly exposed amino-terminal domain acts as a tethered ligand, self-activating the recep-tor. Synthetic peptides corresponding to the receptor-tethered ligand domain can selectively activate PARs, providing useful phar-macological tools to understand the physiology of these receptors (3). a number of endogenous proteinases are able to activate mem-bers of the PAR family: thrombin cleaves the N-terminal domain of PAR1, PAR3, and PAR4, trypsin activates PAR2, PAR4, and to a lesser extent PAR1, cathepsin G activates PAR4, and mast cell trypt-ase can activate PAR2 (4). Like trypsin and thrombin, exogenous proteinases, such as pathogen proteinases, can either activate or disarm PARs, by removing the N-terminal activation site (4, 5).
PAR1 was the first member of this family to be cloned and was the first receptor for which this unique mechanism of activation was described (6). The interest in PAR1 was initially driven by research on the receptor responsible for thrombin-induced activation of plate-lets. However, PAR1 activation mediates several effects of thrombin other than platelet activation, especially inflammation. PAR1 activa-tion induces changes in vascular tone, increased vascular permeabil-
ity, and granulocyte chemotaxis (4, 7). In lung epithelial cells, PAR1 agonists stimulate the release of proinflammatory cytokines (IL-6 and IL-8) (8). In vivo, PAR1 agonists can induce inflammation when injected into the paw, the liver, or the brain of rodents (9–12).
In the gut, PAR1 is expressed by a variety of cell types, includ-ing enterocytes; endothelial cells; enteric neurons, where it coex-presses with excitatory and inhibitory neurotransmitters (13); terminals of mesenteric afferent nerves; myocytes; and immune cells such as monocytes/macrophages, neutrophils, and lympho-cytes (14, 15). PAR1 agonists are capable of inducing calcium-dependent chloride secretion in rodent and human enterocytes (14, 16, 17). Moreover, PAR1 agonists are able to increase intes-tinal permeability both in vivo and in cultured enterocytes, by a mechanism involving the induction of enterocyte apoptosis (17). In the colon, PAR1 agonists also seem to act as growth factors: in human colon cancer cell lines, PAR1 is overexpressed compared with nontransformed cells, and PAR1 activation induces cell proliferation and motility (18). In colonic myofibroblasts, PAR1 agonists increased both COX-2 expression and prostaglandin E2 synthesis, suggesting a mechanism through which PAR1 activa-tion might regulate intestinal functions (19). Intestinal motility also seems to be affected by PAR1 activation. Administration of a PAR1-activating peptide causes a reduction of the spontane-ous contractions in intestinal circular muscle preparations and a contractile effect or a biphasic relaxation followed by contraction in a longitudinal muscle preparation of rat intestine (20, 21).
The pathogenesis of inflammatory bowel disease (IBD) is believed to be multifactorial, involving genetic and immune fac-tors, as well as environmental factors, and endogenous factors
Nonstandard abbreviations used: DSS, dextran sodium sulfate; IBD, inflammatory bowel disease; LPMC, lamina propria mononuclear cell; MLCK, myosin light chain kinase; MPO, myeloperoxidase; NK-1, neurokinin-1; PAR, proteinase-activated recep-tor; TNBS, trinitrobenzene sulfonic acid.
Conflict of interest: The authors have declared that no conflict of interest exists.
Citation for this article: J. Clin. Invest. 114:1444–1456 (2004). doi:10.1172/JCI200421689.

research article
The Journal of Clinical Investigation http://www.jci.org Volume 114 Number 10 November 2004 1445
such as defects in barrier function, vascular supply, or enteric nerve function (22). Considering the proinflammatory effects observed upon PAR1 activation in different tissues or cells, the abundant expression of PAR1 in the gastrointestinal tract, and the fact that proteinases that activate PAR1 (not only thrombin and trypsin, but also pathogen-derived proteinases) are found in increased concen-trations in the intestine of IBD patients (23, 24), we hypothesized that PAR1 activation in the intestine may be involved in the patho-genesis of IBD. To test this hypothesis, we first evaluated the abun-dance of PAR1 in colonic tissue biopsies from IBD patients. Upon finding an increase in PAR1 expression in those samples, we went on to assess the ability of a PAR1 agonist to cause an inflammatory response in the colon of both normal and PAR1-deficient (PAR1
–/–) mice. We then characterized the PAR1-induced colitis, investigat-ing the involvement of permeability, apoptosis, and lymphocyte functions. Further, we used 2 murine models of colitis induced by the intracolonic administration of trinitrobenzene sulfonic acid (TNBS) and dextran sodium sulfate (DSS) to evaluate whether PAR1 antagonism protects against colitis development. Finally, we compared the colonic inflammatory response induced by TNBS and DSS administration in WT and PAR1
–/– mice. Our data sup-port the hypothesis that PAR1 plays an important role in IBD.
ResultsPAR1 expression in the colon of IBD patients and mice with colitis. A PCR product of the predicted size of 708 bp was amplified from RNA prepared from the colon of normal and IBD (ulcerative colitis and Crohn disease) patients, showing the presence of PAR1 in those tissues. Compared with the level of expression of PAR1 in
normal colon, the level of expression of PAR1 was significantly higher in IBD patients (Figure 1A). In Crohn disease patients, a 7-fold increase in the level of PAR1 expression was observed com-pared with that in normal colons. PAR1 expression in ulcerative colitis patients was increased 3.5-fold compared with that in nor-mal colon. Histological assessment confirmed the endoscopic and clinical diagnosis of IBD in all such subjects and confirmed the endoscopically normal-appearing mucosa in those undergo-ing screening colonoscopies. Real-time RT-PCR confirmed the overexpression of PAR1 in the same tissues as shown in Figure 1A (not shown). Moreover, in other Crohn disease patients, we showed using real-time PCR that PAR1 overexpression was restricted to inflamed colonic tissues (Figure 1B). In the colon of mice that developed colitis after intracolonic administration of TNBS or DSS, PAR1 mRNA expression was also upregulated compared with that in naive controls (Figure 1C).
Immunolocalization of PAR1 in colons from Crohn disease patients showed that PAR1 in noninflamed areas was mainly located on endothelial cells of the submucosal vessels (Figure 2A, arrows). Smooth muscle cells also showed some immunoreactivity for PAR1 (Figure 2A, arrowhead). PAR1 staining was abrogated in endothelial and smooth muscle cells by addition of PAR1 block-ing peptide to the anti-PAR1 antibody solution (Figure 2B; arrow indicates the same vessel as shown in Figure 2A). Extensive tis-sue necrosis was observed in tissue sections of a Crohn disease patient, taken from an inflamed part (Figure 2C). Here again, PAR1-stained cells were revealed on vessels (Figure 2C, arrow) and in lymphomonocytic cells infiltrated in the lamina propria (Fig-ure 2C, inset). At a higher magnification (Figure 2D), endothelial cells (arrows) and inflammatory cells in the blood vessel lumen stained positive for PAR1. In the colon of mice, PAR1 expression was detected in normal tissues with staining of the epithelium surface (Figure 2E, arrows) and some blood vessels (not shown). In inflamed tissues (7 days after the induction of colitis), PAR1 was upregulated with a prominent expression by infiltrated cells of the lamina propria (Figure 2F, arrowheads), while the addition of the blocking peptide to this condition showed no staining for PAR1 (Figure 2G). Disrupted staining for PAR1 on epithelial surfaces (Figure 2F, arrows) highlighted mucosal ero-sion due to TNBS-induced colitis. At a higher magnification (400), immunoreactivity for PAR1 revealed staining in infiltrated inflammatory cells (Figure 2H).
Proinflammatory effects of PAR1 activation in mouse colon. When administered directly into the lumen of the colon of mice, the selective PAR1 agonist TFLLR-NH2 caused time-dependent dam-age of the colon, with a maximal effect 24 hours after its adminis-tration (Figure 3A). The PAR1 agonist–induced damage observed
Figure 1PAR1 mRNA detection in humans and mice. (A and B) PAR1 mRNA detection in colonic biopsies from control (normal), ulcerative colitis (UC), or Crohn disease (CD) patients, by RT-PCR (A) and real-time RT-PCR (B). A minimum of 5 patients per group was considered for quantification, and representative RT-PCR for 3 patients per group is shown (blots). hPAR1, human PAR1. (C) PAR1 mRNA detection in colonic tissues from naive mice or mice with TNBS- or DSS-induced colitis. PAR1 mRNA detection was assessed by the amplification of a specific PCR fragment and was expressed as percentage of amplified GAPDH fragment. For quantification, values are mean ± SEM; n = 5 per group. *P < 0.05, **P < 0.01, ***P < 0.001.

research article
1446 The Journal of Clinical Investigation http://www.jci.org Volume 114 Number 10 November 2004
24 hours after its intracolonic administration was dose-depen-dent (Figure 3B). Microscopically, the intracolonic injection of TFLLR-NH2 provoked mucosal erosions (Figure 3C, arrowheads) and submucosal edema (arrows), while the control peptide had no effect (Figure 3D). Granulocyte infiltration, as observed by elevat-ed myeloperoxidase (MPO) activity, was significantly increased 24 hours and 48 hours after a single intracolonic administration of TFLLR-NH2 (Figure 3E) and declined to normal levels by 72 hours (not shown). The PAR1-activating peptide–induced increase in MPO activity was dose-dependent and started to show significant increase in granulocyte infiltration at doses that did not cause macroscopic damage, such as 50 μg per mouse (Figure 3F). The effects of the control peptide, RLLFT-NH2, or vehicle on MPO activity (Figure 3E) and macroscopic-damage score (Figure 3A) were not significantly different from those in untreated mice. No significant increase in damage score or MPO activity was observed in PAR1
–/– mice after the intracolonic administration of TFLLR-NH2 (Figure 4), which demonstrates that PAR1 activation is responsible for the tissue-damaging effects of the PAR1 agonist.
Mechanisms involved in PAR1-induced colitis. In contrast to PAR2-induced colitis (25), the proinflammatory effects of PAR1-activat-ing peptide did not involve activation of capsaicin-sensitive sen-sory nerves, or activation of neurokinin-1 (NK-1) receptors, since no significant inhibition of the inflammatory response (macro-scopic-damage score and MPO activity) was observed in mice that had been pretreated with capsaicin, or with the NK-1 antagonist SR140333 (data not shown).
Since PAR1 agonists have been shown to induce increased intestinal permeability in vivo (17), we wanted to investigate whether or not PAR1-induced intestinal barrier breakage was
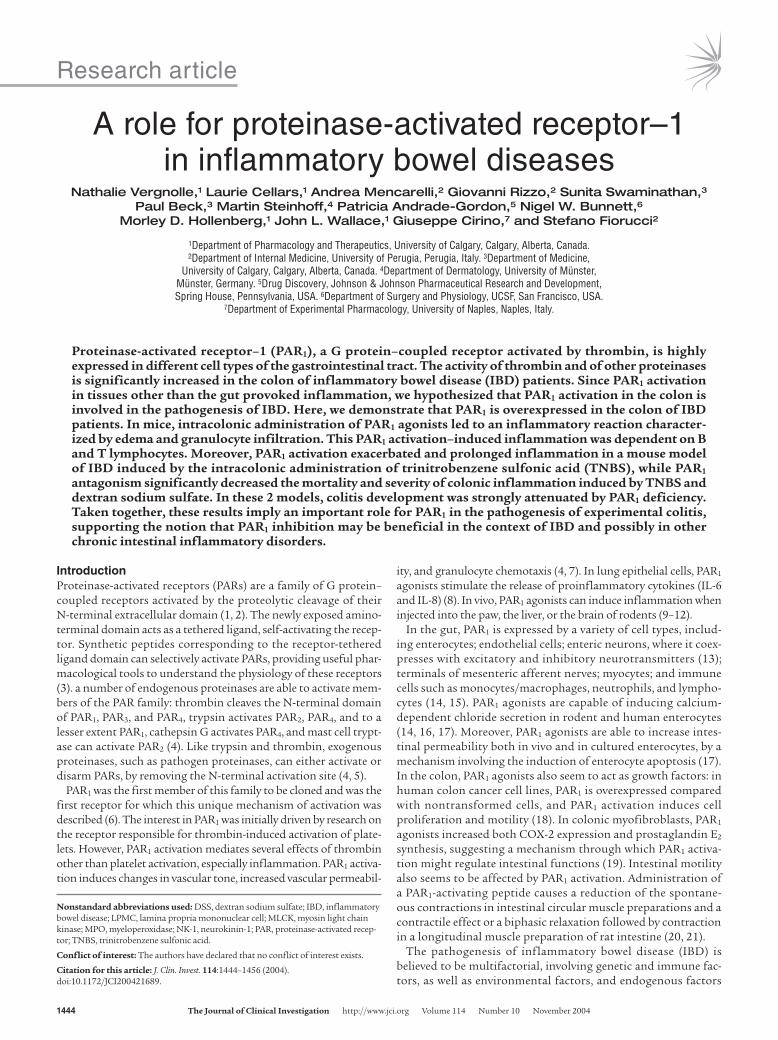
a s s o c i a t e d w i t h PA R 1 -induced inf lammation in mouse colon. Thus, we used a selective kinase inhibi-tor of myosin light chain, because myosin light chain kinase (MLCK) is known to be implicated in cytoskeletal rearrangements associated with epithelial tight junc-tion functions, and MLCK inhibitors inhibit changes in permeability (17). The PAR1-induced increase in intestinal permeability was completely inhibited by pre-treatment of mice with the MLCK inhibitor ML-7 (Fig-ure 5A). However, MLCK inhibitor failed to signifi-cantly reduce PAR1-activat-ing peptide–induced macro-scopic-damage score (Figure 5B). Granulocyte infiltration was significantly reduced in ML-7–treated compared with vehicle-treated mice that received intracolonic admin-istration of TFLLR-NH2 but was still significantly higher
than in saline-administered mice, demonstrating only a partial inhibition of MPO activity by ML-7 pretreatment.
In order to assess the role of B and T lymphocytes in PAR1 agonist–induced colitis, we investigated the effect of TFLLR-NH2 administration in the colon of immunodeficient mice. SCID mice are homozygous for the severe combined immunodeficiency mutation, which is characterized by the absence of functional T and B cells, lymphopenia, and hypogammaglobulinemia. RAG1–/– mice, which have undergone a targeted deletion of the recombina-tion-activating gene 1, lack mature B and T lymphocytes. In both SCID and RAG1–/– mice, daily intracolonic administration of the PAR1-activating peptide TFLLR-NH2 for 7 days (50 μg/mouse) failed to induce inflammation (macroscopic-damage score, MPO activity, and increased wall thickness), compared with administra-tion of the control peptide RLLFT-NH2. WT mice (C57BL/6) that received intracolonically the PAR1-activating peptide TFLLR-NH2 showed a significant increase in damage score, MPO activity, and wall thickness (Figure 5, D–F).
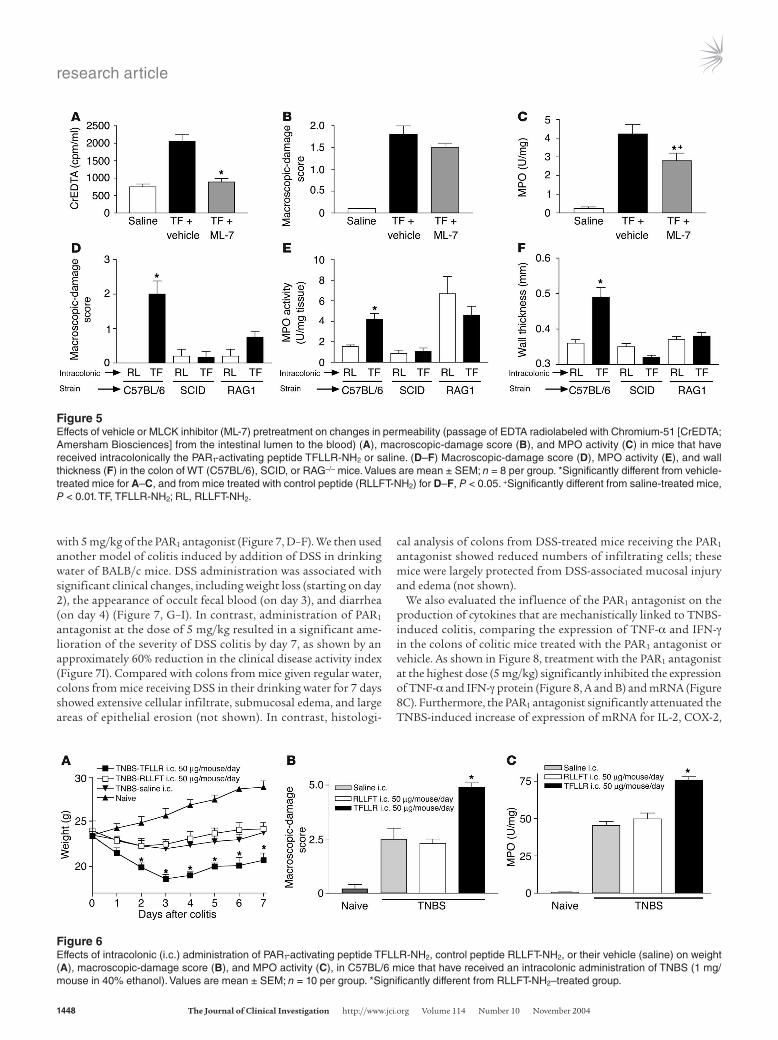
PAR1 activation exacerbates inflammation in a mouse model of IBD. Intracolonic administration of TNBS (1 mg/kg) resulted in weight loss (Figure 6A), increased damage score (Figure 6B), and increased MPO activity (Figure 6C). Daily intracolonic adminis-tration of the selective PAR1-activating peptide TFLLR-NH2 fur-ther reduced body weight after TNBS administration, compared with that of mice treated with the control peptide or saline (Figure 6A). Macroscopic-damage score and colonic MPO activity levels were increased in mice that had also received a daily intraco-lonic injection of the PAR1 agonist (Figure 6, B and C) after the induction of TNBS colitis, compared with those in TNBS-treated mice administered daily with the control peptide or saline. Daily
Figure 2Immunohistolocalization of PAR1 protein expression in the muscularis mucosae of human colon (A–D) and in whole colonic tissues from naive mice (E) and mice with TNBS-induced colitis (F–H). (A) Human biopsy section obtained from a macroscopically normal colon resected from a patient diagnosed with Crohn disease. PAR1 immunoreactivity was observed in vessels (arrows) and smooth muscle cells (arrowhead) (original magnification, ×100). (B) The same tissue incubated with a blocking peptide for the anti-PAR1 antibody (original magnification, ×100). PAR1 staining on the vessel was inhibited (arrow). (C) Tissues of the same patient collected in a macroscopically inflamed area, showing extensive necrosis and inflammatory infiltration of lamina propria by lymphomonocytic cells (inset) and PAR1-positive vessels (arrow). (D) A higher magnifi-cation (×400) of the vessel shown in C (arrows). Infiltrated inflammatory cells were observed in the lumen of the blood vessel. (E) Colonic tissues from naive mice, where PAR1 was expressed mainly on the epithelium (arrows). (F) Colonic tissues from TNBS-treated mice, with large tissue disruption, mucosal erosions (arrows), and PAR1 staining in infiltrated cells of the lamina propria (arrowheads) as well as epithelium. (G) The PAR1 antibody was preincubated with a blocking peptide at 20 μg/ml to show specificity (original magnification, ×40). (H) A higher magnification of infiltrated cells of the lamina propria (arrows and arrowheads) positively stained for PAR1 (original magnification, ×400).

research article
The Journal of Clinical Investigation http://www.jci.org Volume 114 Number 10 November 2004 1447
systemic treatment (i.p.) with the PAR1 agonist TFLLR-NH2 did not induce changes in body weight, macroscopic-damage score, or MPO activity after the induction of colitis, compared with those in mice treated with the control peptide or vehicle (not shown).
Anti-inflammatory effects of PAR1 antagonist in 2 mouse models of IBD. C57BL/6 mice were used for all the previous studies, because PAR1
–/– mice were raised in a C57BL/6 background. However, BALB/c mice, which are more susceptible to TNBS-induced coli-tis, are more widely accepted as an animal model of IBD (26). In order to test the effect of a PAR1 antagonist on the development of colitis, we wanted to use the most challenging and reliable animal model. For this reason, we chose to induce TNBS colitis in BALB/c mice treated or not treated with the PAR1 antagonist. Intracolonic administration of 2 mg/kg of TNBS in BALB/c mice resulted in
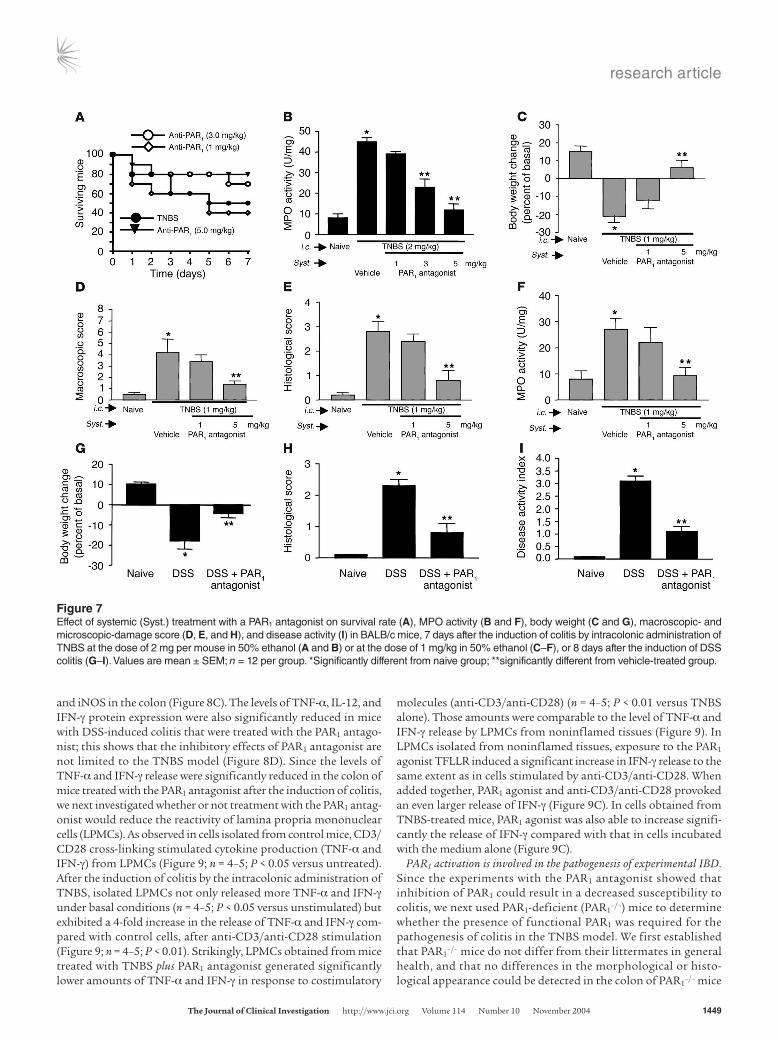
high mortality rates: only 50% of mice survived for 7 days after the induction of colitis (Figure 7A). Daily treatment of mice with a PAR1 antagonist at doses of 3 and 5 mg/kg reduced the mortal-ity by 20% and 30%, respectively. In the same mice, granulocyte infiltration, as measured by MPO activity, was significantly atten-uated in a dose-dependent manner by treatment with the PAR1 antagonist (Figure 7B). In order to assess further the ability of the PAR1 antagonist to mitigate the development of colitis, we used a lower dose of TNBS (1 mg/kg), which produced a lower mortality. The decrease in weight gain observed in mice after the intraco-lonic administration of 1 mg/kg of TNBS was reversed by treat-ment with the PAR1 antagonist at a dose of 5 mg/kg (Figure 7C). The increased macroscopic- and microscopic-damage scores and MPO activity were also significantly attenuated by daily treatment
Figure 3Kinetic and dose-response curves of macroscopic-damage score (A and B) and myeloperoxidase (MPO) activity (E and F) induced by the intra-colonic administration of the PAR1-activating peptide TFLLR-NH2, the control peptide RLLFT-NH2, or their vehicle, in C57BL/6 mice. (C and D) Representative H&E-stained histological sections of colons from WT mice that have received an intracolonic administration of TFLLR-NH2 (C) or RLLFT-NH2 (D). Values are mean ± SEM; n = 8 per group. *Significantly different from RLLFT-NH2–treated group, P < 0.05. Dose-response and histological sections were performed at the 24-hour time point after the intracolonic administration of RLLFT-NH2 or TFLLR-NH2. Scale bar: 15 μm (applies to C and D). In C, arrowheads show mucosal erosion, and arrows show submucosal edema.
Figure 4Macroscopic-damage score (A) and MPO activity (B) induced by the intra-colonic administration of the PAR1-activating peptide TFLLR-NH2 (200 μg/mouse) in PAR1-deficient mice (PAR1
–/–) and their WT littermates (PAR1
+/+), compared with naive mice (time 0). Values are mean ± SEM; n = 8 per group. *Significantly differ-ent from naive mice (time 0) of the corresponding genotype, P < 0.05.
research article
1448 The Journal of Clinical Investigation http://www.jci.org Volume 114 Number 10 November 2004
with 5 mg/kg of the PAR1 antagonist (Figure 7, D–F). We then used another model of colitis induced by addition of DSS in drinking water of BALB/c mice. DSS administration was associated with significant clinical changes, including weight loss (starting on day 2), the appearance of occult fecal blood (on day 3), and diarrhea (on day 4) (Figure 7, G–I). In contrast, administration of PAR1 antagonist at the dose of 5 mg/kg resulted in a significant ame-lioration of the severity of DSS colitis by day 7, as shown by an approximately 60% reduction in the clinical disease activity index (Figure 7I). Compared with colons from mice given regular water, colons from mice receiving DSS in their drinking water for 7 days showed extensive cellular infiltrate, submucosal edema, and large areas of epithelial erosion (not shown). In contrast, histologi-
cal analysis of colons from DSS-treated mice receiving the PAR1 antagonist showed reduced numbers of infiltrating cells; these mice were largely protected from DSS-associated mucosal injury and edema (not shown).
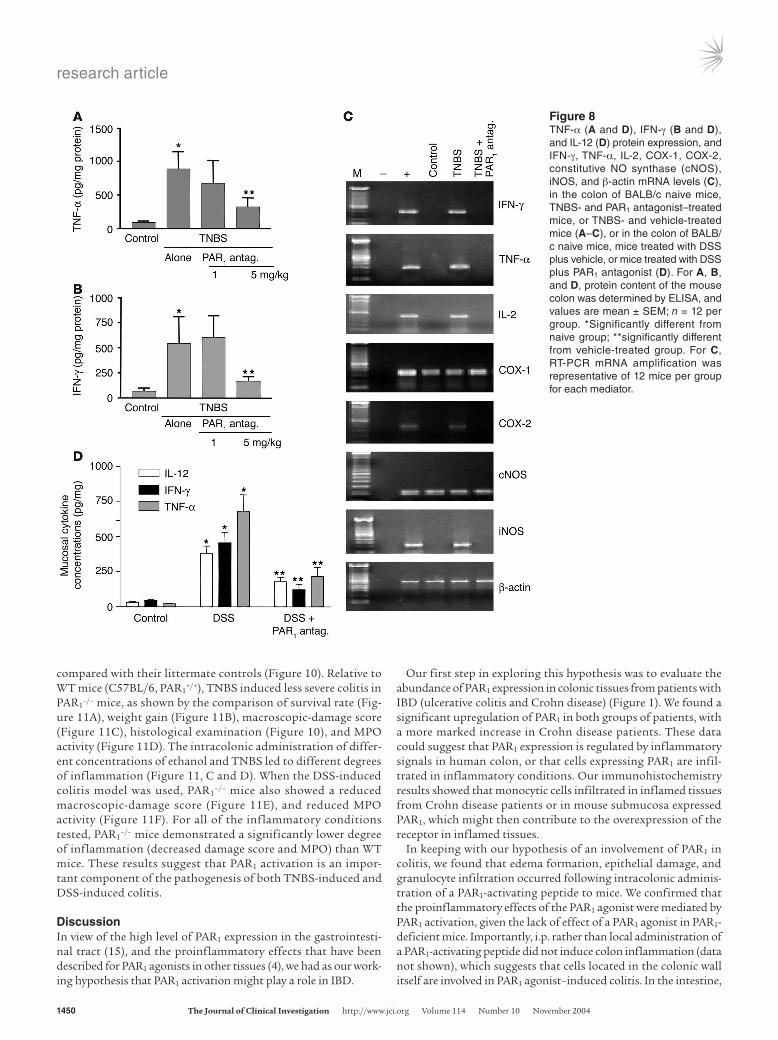
We also evaluated the influence of the PAR1 antagonist on the production of cytokines that are mechanistically linked to TNBS-induced colitis, comparing the expression of TNF-α and IFN-γ in the colons of colitic mice treated with the PAR1 antagonist or vehicle. As shown in Figure 8, treatment with the PAR1 antagonist at the highest dose (5 mg/kg) significantly inhibited the expression of TNF-α and IFN-γ protein (Figure 8, A and B) and mRNA (Figure 8C). Furthermore, the PAR1 antagonist significantly attenuated the TNBS-induced increase of expression of mRNA for IL-2, COX-2,
Figure 6Effects of intracolonic (i.c.) administration of PAR1-activating peptide TFLLR-NH2, control peptide RLLFT-NH2, or their vehicle (saline) on weight (A), macroscopic-damage score (B), and MPO activity (C), in C57BL/6 mice that have received an intracolonic administration of TNBS (1 mg/mouse in 40% ethanol). Values are mean ± SEM; n = 10 per group. *Significantly different from RLLFT-NH2–treated group.
Figure 5Effects of vehicle or MLCK inhibitor (ML-7) pretreatment on changes in permeability (passage of EDTA radiolabeled with Chromium-51 [CrEDTA; Amersham Biosciences] from the intestinal lumen to the blood) (A), macroscopic-damage score (B), and MPO activity (C) in mice that have received intracolonically the PAR1-activating peptide TFLLR-NH2 or saline. (D–F) Macroscopic-damage score (D), MPO activity (E), and wall thickness (F) in the colon of WT (C57BL/6), SCID, or RAG–/– mice. Values are mean ± SEM; n = 8 per group. *Significantly different from vehicle-treated mice for A–C, and from mice treated with control peptide (RLLFT-NH2) for D–F, P < 0.05. +Significantly different from saline-treated mice, P < 0.01. TF, TFLLR-NH2; RL, RLLFT-NH2.
research article
The Journal of Clinical Investigation http://www.jci.org Volume 114 Number 10 November 2004 1449
and iNOS in the colon (Figure 8C). The levels of TNF-α, IL-12, and IFN-γ protein expression were also significantly reduced in mice with DSS-induced colitis that were treated with the PAR1 antago-nist; this shows that the inhibitory effects of PAR1 antagonist are not limited to the TNBS model (Figure 8D). Since the levels of TNF-α and IFN-γ release were significantly reduced in the colon of mice treated with the PAR1 antagonist after the induction of colitis, we next investigated whether or not treatment with the PAR1 antag-onist would reduce the reactivity of lamina propria mononuclear cells (LPMCs). As observed in cells isolated from control mice, CD3/CD28 cross-linking stimulated cytokine production (TNF-α and IFN-γ) from LPMCs (Figure 9; n = 4–5; P < 0.05 versus untreated). After the induction of colitis by the intracolonic administration of TNBS, isolated LPMCs not only released more TNF-α and IFN-γ under basal conditions (n = 4–5; P < 0.05 versus unstimulated) but exhibited a 4-fold increase in the release of TNF-α and IFN-γ com-pared with control cells, after anti-CD3/anti-CD28 stimulation (Figure 9; n = 4–5; P < 0.01). Strikingly, LPMCs obtained from mice treated with TNBS plus PAR1 antagonist generated significantly lower amounts of TNF-α and IFN-γ in response to costimulatory
molecules (anti-CD3/anti-CD28) (n = 4–5; P < 0.01 versus TNBS alone). Those amounts were comparable to the level of TNF-α and IFN-γ release by LPMCs from noninflamed tissues (Figure 9). In LPMCs isolated from noninflamed tissues, exposure to the PAR1 agonist TFLLR induced a significant increase in IFN-γ release to the same extent as in cells stimulated by anti-CD3/anti-CD28. When added together, PAR1 agonist and anti-CD3/anti-CD28 provoked an even larger release of IFN-γ (Figure 9C). In cells obtained from TNBS-treated mice, PAR1 agonist was also able to increase signifi-cantly the release of IFN-γ compared with that in cells incubated with the medium alone (Figure 9C).
PAR1 activation is involved in the pathogenesis of experimental IBD. Since the experiments with the PAR1 antagonist showed that inhibition of PAR1 could result in a decreased susceptibility to colitis, we next used PAR1-deficient (PAR1
–/–) mice to determine whether the presence of functional PAR1 was required for the pathogenesis of colitis in the TNBS model. We first established that PAR1
–/– mice do not differ from their littermates in general health, and that no differences in the morphological or histo-logical appearance could be detected in the colon of PAR1
–/– mice
Figure 7Effect of systemic (Syst.) treatment with a PAR1 antagonist on survival rate (A), MPO activity (B and F), body weight (C and G), macroscopic- and microscopic-damage score (D, E, and H), and disease activity (I) in BALB/c mice, 7 days after the induction of colitis by intracolonic administration of TNBS at the dose of 2 mg per mouse in 50% ethanol (A and B) or at the dose of 1 mg/kg in 50% ethanol (C–F), or 8 days after the induction of DSS colitis (G–I). Values are mean ± SEM; n = 12 per group. *Significantly different from naive group; **significantly different from vehicle-treated group.
research article
1450 The Journal of Clinical Investigation http://www.jci.org Volume 114 Number 10 November 2004
compared with their littermate controls (Figure 10). Relative to WT mice (C57BL/6, PAR1
+/+), TNBS induced less severe colitis in PAR1
–/– mice, as shown by the comparison of survival rate (Fig-ure 11A), weight gain (Figure 11B), macroscopic-damage score (Figure 11C), histological examination (Figure 10), and MPO activity (Figure 11D). The intracolonic administration of differ-ent concentrations of ethanol and TNBS led to different degrees of inflammation (Figure 11, C and D). When the DSS-induced colitis model was used, PAR1
–/– mice also showed a reduced macroscopic-damage score (Figure 11E), and reduced MPO activity (Figure 11F). For all of the inflammatory conditions tested, PAR1
–/– mice demonstrated a significantly lower degree of inflammation (decreased damage score and MPO) than WT mice. These results suggest that PAR1 activation is an impor-tant component of the pathogenesis of both TNBS-induced and DSS-induced colitis.
DiscussionIn view of the high level of PAR1 expression in the gastrointesti-nal tract (15), and the proinflammatory effects that have been described for PAR1 agonists in other tissues (4), we had as our work-ing hypothesis that PAR1 activation might play a role in IBD.
Our first step in exploring this hypothesis was to evaluate the abundance of PAR1 expression in colonic tissues from patients with IBD (ulcerative colitis and Crohn disease) (Figure 1). We found a significant upregulation of PAR1 in both groups of patients, with a more marked increase in Crohn disease patients. These data could suggest that PAR1 expression is regulated by inflammatory signals in human colon, or that cells expressing PAR1 are infil-trated in inflammatory conditions. Our immunohistochemistry results showed that monocytic cells infiltrated in inflamed tissues from Crohn disease patients or in mouse submucosa expressed PAR1, which might then contribute to the overexpression of the receptor in inflamed tissues.
In keeping with our hypothesis of an involvement of PAR1 in colitis, we found that edema formation, epithelial damage, and granulocyte infiltration occurred following intracolonic adminis-tration of a PAR1-activating peptide to mice. We confirmed that the proinflammatory effects of the PAR1 agonist were mediated by PAR1 activation, given the lack of effect of a PAR1 agonist in PAR1-deficient mice. Importantly, i.p. rather than local administration of a PAR1-activating peptide did not induce colon inflammation (data not shown), which suggests that cells located in the colonic wall itself are involved in PAR1 agonist–induced colitis. In the intestine,
Figure 8TNF-α (A and D), IFN-γ (B and D), and IL-12 (D) protein expression, and IFN-γ, TNF-α, IL-2, COX-1, COX-2, constitutive NO synthase (cNOS), iNOS, and β-actin mRNA levels (C), in the colon of BALB/c naive mice, TNBS- and PAR1 antagonist–treated mice, or TNBS- and vehicle-treated mice (A–C), or in the colon of BALB/c naive mice, mice treated with DSS plus vehicle, or mice treated with DSS plus PAR1 antagonist (D). For A, B, and D, protein content of the mouse colon was determined by ELISA, and values are mean ± SEM; n = 12 per group. *Significantly different from naive group; **significantly different from vehicle-treated group. For C, RT-PCR mRNA amplification was representative of 12 mice per group for each mediator.

research article
The Journal of Clinical Investigation http://www.jci.org Volume 114 Number 10 November 2004 1451
PAR1 expression has been detected on neurons coexpressing inflammatory neuropeptides such as substance P (13), and a neurogenic mechanism involving capsaicin-sensitive fibers and NK-1 receptors has been revealed for PAR1 agonist–induced paw inflammation (27). Therefore, we considered that there might be a neurogenic component in PAR1 agonist–induced colitis. How-ever, pretreatment with capsaicin or an NK-1 antagonist did not inhibit PAR1 agonist–induced colitis in mice, which suggests that PAR1 activation of sensory fibers and release of substance P are not involved in this process. PAR1 is expressed at the apical and basolateral membranes of enterocytes. When added either api-cally or basolaterally to monolayers of cultured enterocytes, PAR1 agonists increase permeability (17). Moreover, we have shown in mice that the intraluminal administration of PAR1 agonists can disrupt the integrity of the intestinal barrier, increasing para-cellular permeability and allowing bacterial translocation into peritoneal organs (17). It can be hypothesized that PAR1 activa-tion on enterocytes mediates intestinal barrier breakdown, which then allows pathogen penetration to cause further inflammation. However, our results show here that inhibition of PAR1 agonist–induced permeability does not necessarily inhibit PAR1-induced inflammation (Figure 5, A–C). Increased macroscopic-damage score was not inhibited by MLCK inhibitor treatment, which com-pletely abolished PAR1-induced permeability. Granulocyte infil-tration was only partially reduced by MLCK inhibitor treatment, which suggests that PAR1-induced intestinal barrier breakdown, although participating in PAR1-induced colitis, cannot be con-sidered the major cause of this inflammation. PAR1 agonists have been shown to convey an apoptotic signal to enterocytes (17). It is also possible that PAR1 agonist–induced colitis may be mediated by increased apoptosis at the enterocyte level. This hypothesis is also in accordance with the observation of increased enterocyte apoptosis in IBD patients (28). However, here again, while PAR1-induced apoptosis has been shown to be responsible for increased permeability, the PAR1-induced increase in intestinal barrier per-meability was not fully responsible for the inflammation observed. Our results indicate that PAR1-induced intestinal permeability and/or apoptosis can participate in the generation of colitis but cannot be considered the only factors responsible for this inflam-
mation. In human normal epithelia, the status of PAR1 expression is not clear, as PAR1 has been detected in nontransformed epithe-lial cells (16) but not in the mucosa of control patients (18), and we have detected PAR1 in normal (noninflamed) tissues of Crohn disease patients, mostly in endothelial cells and smooth muscle cells. Thus, changes in permeability due to the possible activation of PAR1 on epithelial cells might not be as relevant in humans as they are in rodents, where PAR1 expression was found on the epi-thelial surface (Figure 2, E and F).
Although the single intraluminal administration of a PAR1 agonist is able to cause colon inflammation, this inflammation is limited in time (resolved by 72 hours) and extent, compared with that in well-established models of IBD, such as the TNBS model. While the response to injury in the normal colon involves an inflammatory response and then a resolution of this inflam-mation, in IBD patients, the response to injury is prolonged and
Figure 9In vitro release of TNF-α (A) and IFN-γ (B and C) by lamina propria monocytic cells that were left unstimulated (Alone) or stimulated with CD3 and CD28 alone, CD3 and CD28 plus PAR1-activating peptide (PAR1-AP), or PAR1-activating peptide alone. Cells were isolated from naive (control) mice (A–C) or were isolated 7 days after intracolonic administration of TNBS from mice that had been treated with the PAR1 antagonist (A and B) or with vehicle (A–C). Values are mean ± SEM; n = 12 per group. *Significantly different from control group in A and B, and significantly dif-ferent from medium alone in C; **significantly different from vehicle-treated group in A and B, and from naive group in C; ψsignificantly different from medium alone of cells from TNBS-treated mice.
Figure 10Representative H&E-stained histological sections from WT (A and C) or PAR1-deficient (B and D) mice, in normal condition (no treatment) (A and B) or 7 days after the intracolonic administration of TNBS (1 mg/kg in 40% ethanol) (C and D). Scale bars: 20 μm.

research article
1452 The Journal of Clinical Investigation http://www.jci.org Volume 114 Number 10 November 2004
characterized by multiple recurrences. We hypothesized that chronic activation of PAR1 might prolong an established inflam-mation such as the chronic inflammatory response observed in IBD. In C57BL/6 mice, the intracolonic administration of TNBS induces a severe inflammatory response that reaches a maxi-mum, in terms of granulocyte infiltration and mucosal damage, 72 hours later and declines thereafter (29). Daily injections of the PAR1 agonist appeared to impair the resolution of inflammation, as high levels of macroscopic damage and MPO activity were still evident 7 days after TNBS administration (Figure 4).
Using both a pharmacological and a gene-knockout approach, we have determined that the absence of functional PAR1 was ben-eficial for the prevention of colitis development in the TNBS and DSS models. Both in mice treated with the PAR1 antagonist and in PAR1-deficient mice, survival rates and weight gain were increased, while mucosal damage and granulocyte infiltration were reduced. Numerous mechanisms may be proposed to explain the involve-ment of PAR1 activation in the pathogenesis of this experimen-tal model of colitis. As previously discussed, the PAR1-mediated increase in intestinal permeability could contribute to pathogen infiltration and further development of inflammation but is not the only factor involved. The results generated with the PAR1 antagonist demonstrated that expression of the proinflammatory cytokines IFN-γ and TNF-α was downregulated in response to PAR1 inhibition after the induction of TNBS colitis. It would appear that the inhibitory effects exerted by the PAR1 antagonist
may be caused by a direct effect on LPMCs, according to the data obtained by the in vitro studies of monocytic cell culture. Lamina propria cells isolated from TNBS-treated mice that were exposed to a PAR1 antagonist were refractory to stimulation with anti-CD3 and anti-CD28 antibodies. While the levels of IFN-γ and TNF-α released by LPMCs from TNBS-treated mice with colitis were sig-nificantly increased compared with those released by cells from normal mice after anti-CD3/anti-CD28 stimulation, PAR1 antago-nist treatment of these mice completely abolished this inflamma-tion-induced increase in cytokine production. PAR1 is known to be expressed in monocytic cells and lymphocytes (30–32), and a grow-ing body of evidence suggests that PAR1 can modulate immune cell functions. The fact that PAR1 agonist–induced inflammation is completely absent at 7 days in SCID and RAG1–/– mice strongly suggests a role for acquired immunity in general, and B and/or T lymphocytes in particular, in the ability of PAR1 activation to cause chronic inflammation of the bowel. Innate immunity through the activation of monocytes and monocyte-derived macrophages might also be implicated, since PAR1 agonists can cause cell activa-tion and cytokine release in those cells (32, 33). Moreover, we have shown here (Figure 8C) that PAR1 agonists were able to induce IFN-γ release from monocytic cells isolated from mouse intestinal lamina propria, thereby further supporting the idea that PAR1 acti-vation on those cells is responsible, at least partly, for the inflam-matory response. In the intestine, inhibition of PAR1 activation in PAR1-expressing monocytes and/or lymphocytes after PAR1
Figure 11Effect of intracolonic TNBS administra-tion (A–D) or DSS treatment (E and F) on survival rate (A), weight (B), macro-scopic-damage score (C and E), and MPO activity (D and F) in PAR1-defi-cient mice (PAR1
–/–) and WT littermates (PAR1
+/+). Values are mean ± SEM; minimum of n = 10 per group. *Signifi-cantly different from PAR1
–/– in B, and significantly different from WT in C–F, P < 0.05.

research article
The Journal of Clinical Investigation http://www.jci.org Volume 114 Number 10 November 2004 1453
antagonist treatment might be responsible for the inhibition of TNBS-induced colitis development. Taken together, these results suggest that PAR1 activation on monocytic cells and the subse-quent release of inflammatory cytokines are responsible, at least in part, for the pathogenesis of TNBS-induced colitis.
Although our results clearly demonstrate a proinflammatory role for PAR1 activation in the colon, other studies have reported a protective role for PAR1 activation in rat gastric mucosa (34). In their study, Kawabata et al. suggested a protective effect in the rat gastric mucosa due to prostaglandin release. This is in accord with the protective effects of prostaglandins in stomach. However, in other tissues, such as the colon of IBD patients, the large pres-ence of prostaglandin E2 is due to the activation of inflammatory cascade and is associated with the severity of inflammation (35). Thus, if PAR1 activation induces prostaglandin release as sug-gested by the study of Kawabata et al. (34), in colonic tissues, we can hypothesize that such release participates in the inflammatory reaction developed by IBD patients.
Thrombin has been shown to activate PAR1 in vitro and is con-sidered the endogenous activator of PAR1 on platelets (36). Other proteases from the coagulation cascade, such as factor Xa or VIIa, have also been shown to activate PAR1 (reviewed in ref. 37). If proteases from the coagulation cascade, such as thrombin, factor Xa, or factor VIIa, are the endogenous activators of PAR1 in the colon of IBD patients, they might not act as primary factors in the development of inflammation but might prolong the inflamma-tory reaction after their release from injured tissue. Although no studies have reported the effects of intestinal bacteria (pathogens or nonpathogens) on PAR activation, studies have reported the possible activation of PAR1 by proteases from pathogens such as Porphyromonas gingivalis (5) or dust mites (38, 39). Therefore, in the context of IBD, we cannot rule out the possibility that bacterial proteases might be implicated in PAR1 activation and might par-ticipate in inflammation. This hypothesis is in accord with the role proposed for bacteria in the development of IBD (22).
In conclusion, our results show that PAR1 expression is upregulated in biopsies from IBD patients, that PAR1 activation in the colon of mice leads to an inflammatory reaction involving lym-phocytes, and that PAR1 activation plays a role in the pathogenesis of an experimental model of IBD. These results support our hypoth-esis that PAR1 activation plays a proinflammatory role in IBD. This role involves, secondarily, an increase in intestinal permeability, and, primarily, the activation of monocytic cells from the lamina propria, leading to cytokine release. As PAR2 was shown to play a role in mod-els of arthritis (40) and is therefore an interesting target for chronic inflammation, the present study highlights another of the PARs, PAR1, as a possible target for the treatment of IBD.
MethodsHuman biopsies. Biopsies of human colon were collected from patients during colonoscopy procedures performed at the Foothills Hospital (Calgary, Alberta, Canada). Control tissues were gathered from patients (4 men, 1 woman) undergoing screening colonoscopies for colon cancer surveillance. Crohn disease patients (4 women, 1 man) and ulcerative colitis patients (4 men, 2 women) underwent colonoscopy for diagnosis or assessment of disease activity. Biopsies from patients with colitis were taken from endoscopically inflamed areas. Histological assessment was carried out on biopsies that were adjacent to the areas that were sampled for RNA assessment. The protocol for these studies was approved by the University of Calgary Ethics Review Committee.
Colon specimens from 5 patients were used for quantitative real-time RT-PCR analysis of PAR1 expression. Patients (3 males, mean age 37.4 ± 5.6) presented a colon localization of Crohn disease in all cases. Two patients also presented intestinal involvement. Diagnosis was made 2–5 years earlier by endoscopy, x-ray examination, and colon biopsies. All patients presented a disease flare at the moment of the examination (mean Crohn disease activity index was 352.0 ± 43.5). All patients were taking 5-ami-nosalycilic acid, and biopsies were harvested before corticosteroid therapy began. Biopsies were taken during colonoscopy from either macroscopi-cally normal or diseased colon. A mean of 6–8 biopsies for each localization were taken and immediately processed for RNA extraction.
Animals. C57BL/6 and BALB/c mice were obtained from Charles River Laboratories Inc., and C57BL/6J SCID mice, B6 mice, 129S-RAG1–/– mice, and congenic controls were purchased from The Jackson Laboratory. C57BL/6 mice were used for all the experiments except those performed with the PAR1 antagonist, for which BALB/c mice were used. PAR1
–/– mice and littermates (C57BL/6 background) were originally provided by John-son & Johnson Pharmaceutical Research and Development and bred at the University of Calgary. All mice were housed in a temperature-controlled room and had free access to food and water. The Animal Care Committee of the University of Calgary and the Animal Care Committee of the Univer-sity of Perugia approved all experimental protocols.
Chemicals. Peptides (the selective PAR1-activating peptide TFLLR-NH2 and the control peptide RLLFT-NH2, which is inactive on PAR1) were obtained from the Peptide Synthesis Facility of the Faculty of Medicine of the University of Calgary. The PAR1 antagonist used is a derivative of RWJ-56110, a known PAR1 antagonist, in which the ethylamino group and the difluorobenzyl group have been substituted with paramethoxybenzenzyl and arginine, respectively. The chemical structure of the PAR1 antagonist used in the present study, L-arininamide-4-methoxy-N-[[[1-[92,6-dichloro-phenyl-methyl]-3-(1-pyrrolidinylmethyl)-1H-indol-6-yl]amino]carbonyl]-l-phenylalanyl-N-(phenylmethyl)-(5). This compound has been shown to inhibit PAR1-mediated platelet activation (41, 42) with an IC50 of 0.6 μM. The PAR1 antagonist was synthesized by G. Caliendo and V. Santagada in the Department of Medicinal Chemistry at the University of Naples. The NK-1 antagonist SR140333 was a gift from X. Edmonds-Alt (Sanofi Recherches, Montpellier, France), and capsaicin was purchased from Sigma-Aldrich. TNBS was purchased from Sigma-Aldrich.
RT-PCR. For human tissues, 2 colonic biopsies per patient were removed, rinsed, and immediately placed in RNAlater (Ambion Inc.) and frozen at –20°C. Samples were then transferred to 1 ml of TRIzol for further pro-cessing. RNA was isolated using TRIzol reagent (Invitrogen Corp.) accord-ing to the instructions of the manufacturer.
The PCR reaction was performed using 2 μl of cDNA. This product was amplified in a final concentration of 1 PCR buffer (PerkinElmer/Cetus), 0.8 μM of each primer, 0.2 mM of dNTPs, and 1 U of Taq polymerase (PerkinElmer/Cetus) in a total volume of 50 μl. Semiquantitative PCR used the “primer-dropping” method, in which GAPDH was coamplified as an internal control in all reactions as described. Aliquots of PCR reactions (approximately 20 μl) were equalized to the equivalent signals from the GAPDH mRNA and separated by electrophoresis through 1% agarose gels containing 0.2 μg/ml ethidium bromide. Gels were photographed and ana-lyzed by densitometry using NIH imaging software. PAR1 mRNA expression is presented as a ratio to GAPDH. The primer sequences for PAR1 were 5′-TGTGAACTGATCATGTTTATG-3′, sense, and 5′-TTCGTAAGATAAGAGA-TATGT-3′, antisense, and the cycling parameters were 30 seconds at 94°C, 30 seconds at 55°C, and 30 seconds at 72°C for 31 cycles, with a product size of 708 bp. The primer sequences for GAPDH were 5′-CGGAGTCAACC-GGATTTGGTCGTAT-3′, sense, and 5′-AGCCTTCTCCATGGTGGT-GAAGAC-3′, antisense, added for 21 cycles, with a product size of 307 bp.

research article
1454 The Journal of Clinical Investigation http://www.jci.org Volume 114 Number 10 November 2004
For RT-PCR performed in mouse tissues, total RNA was isolated using TRIzol reagent (Invitrogen Corp.) as previously described (43). The sense and antisense primers, respectively, were as follows: β-actin (540 bp), 5′-TGTGATGGTGGGAATGGGTCAG-3′ and 5′-TTTGATGTCACGCAC-GATTTCC-3′ (Stratagene); IFN-γ (405 bp), 5′-TACTGCCAGGGCACAGT-CATTGAA-3′ and 5′-GCAGCGACTCCTTTTCCGCTTCCT-3′ (Stratagene); TNF-α (276 bp), 5′-ATGAGCACAGAAAGCATGATC-3′ and 5′-TACAG-GCTTGTCACTCGAATT-3′ (Stratagene); IL-2 (451 bp), 5′-GTCAACAGC-GCACCCACTTCAAGC-3′ and 5′-GCTTGTTGAGATGATGCTTTGACA-3′ (Stratagene); COX-1 (391 bp), 5′-TTTTTTTTCATGTAACATCTTC-3′ and 5′-TTAAAACTGAACTTGGACCC-3′ (Sigma-Aldrich); COX-2 (420 bp), 5′-CATGGGTGTGAAGGGAAATAAG-3′ and 5′-GGCATACATCATCAGAC-CAG-3′ (Sigma-Aldrich); constitutive NO synthase (190 bp), 5′-GAG-TACCGCTGCAGAGGGGG-3′ and 5′-GCTCGCCGCTTCGTGGGGG-3′ (Sigma-Aldrich); iNOS (231 bp), 5′-CTTCAACACCAAGGTTGTCTGCAT-3′ and 5′-ATGTCATGAGCAAAGGCGCAGAAC-3′ (Maxim Biotech Inc.). The cDNA was amplified with a “hot start” reaction (20 μl) containing 5 μl cDNA product, 2 μl PCR buffer (200 mM Tris-HCl, pH 8.4, 500 mM KCl), 200 μM dNTPs, 1 μM of each of the sense and antisense primers, 1.5 mM MgCl2, 1 U Platinum Taq polymerase (Invitrogen Corp.), and water in a Hybaid PCR Sprint thermocycler (Celbio). PCR was carried out for 35 cycles (30 for amplification of β-actin) as follows: 94°C for 30 seconds, 60°C for 15 seconds, and 72°C for 30 seconds, with a final extension at 72°C for 5 minutes. PCR products were separated on a 1.5% agarose gel, and band intensity was quantified using Kodak Digital Science ID Image Analysis software (Eastman Kodak Co.). Each assay was carried out in trip-licate. The β-actin primers were used as a control for both reverse transcrip-tion and the PCR reaction itself.
Quantitative real-time RT-PCR. For quantitative PCR analysis, PCR prim-ers were designed using Primer3 software (http://fokker.wi.mit.edu/cgi-bin/primer3/primer3_www.cgi) and the Primer Express program (Applied Biosystems), using published sequence data from the National Center for Biotechnology Information database (http://www.ncbi.nlm.nih.gov). Total RNA was isolated from colon biopsies using TRIzol reagent (Invitrogen Corp.). One microgram RNA was purified of the genomic DNA by DNase I treatment (Invitrogen Corp.) for 15 minutes at room temperature. The DNase I was inactivated at 95°C for 5 minutes in the presence of 2.5 mM EDTA. The RNA was random-reverse-transcribed with SuperScript III (Invitrogen Corp.) in a 20-μl reaction volume. One hundred nanograms of template was used in a real-time PCR reaction with a final volume of 25 μl, containing 0.3 μM of each primer and 12.5 μl of 2 SYBR Green PCR Master Mix (Bio-Rad Laboratories). All reactions were performed in tripli-cate, and the thermal cycling conditions were 2 minutes at 95°C, followed by 50 cycles of 95°C for 10 seconds and 60°C for 30 seconds in an iCycler iQ instrument (Bio-Rad Laboratories). The mean value of the replicates for each sample was calculated and expressed as cycle threshold (CT; the cycle number at which each PCR reaction reaches a predetermined fluorescence threshold, set within the linear range of all reactions). The amount of gene expression was then calculated as the difference (ΔCT) between the CT value of the sample for the target gene and the mean CT value of that sample for the endogenous control. Relative expression was calculated as the differ-ence (ΔΔCT) between the ΔCT values of the test sample and of the control sample (WT) for each target gene. The relative quantification value was expressed and shown as 2–ΔΔCT.
Immunohistochemistry. For the human biopsies, colon specimens were obtained from a 43-year-old male patient undergoing colon-ileal resec-tion for Crohn disease. Samples, obtained from an injured area and from a macroscopically normal colon immediately close to the rim of resection, were fixed in Zamboni’s fixative for 24 hours at room temperature, and embedded in paraffin. Tissue sections were incubated with a goat anti-
human polyclonal antibody (Santa Cruz Biotechnology Inc.) at a dilution of 1:200 to 1:1,000. The sections were washed 3 times in PBS and incubated with peroxidase-conjugated rabbit anti-goat IgG (Santa Cruz Biotechnol-ogy Inc.) at a dilution of 1:200 for 2 hours at room temperature. Tissue sections were washed 3 times in PBS, postfixed with 4% paraformaldehyde, washed again, and mounted (ProLong; Invitrogen Corp.). The immuno-localization of PAR1 was observed and photographed by light microscopy (Olympus Optical Co.). In blocking experiments, the diluted primary anti-body (1:1,000) was preincubated for 24 hours at 4°C with 20 μg/ml of blocking peptide (Santa Cruz Biotechnology Inc.).
In mice, tissues were harvested, fixed in 10% formalin for 48 hours, and embedded in paraffin. Sections of 5 μm were cut, deparaffinized, and boiled in 0.01 M citrate buffer, pH 6.0, for 10 minutes. Incubation in 0.3% hydrogen peroxide to inhibit endogenous peroxidase activity was followed by washes and incubation with the primary anti-PAR1 antibody (Thrombin R [C18]; Santa Cruz Biotechnology Inc.) at a concentration of 1:100 in 10% normal serum. After 3 series of washes in PBS, sections were incubated with a secondary peroxidase-conjugated antibody (Jackson ImmunoResearch Laboratories Inc.) at a dilution of 1:500 for 1 hour at room temperature. Peroxidase activity in tissue sections was revealed using DAB substrate kit (Vector Laboratories Inc.).
Colitis induction and study design. Mice fasted for 12 hours were lightly anesthetized with halothane, and a polyethylene catheter was inserted intrarectally 4 cm from the anus. All compounds given intracolonically were administered through the catheter at a maximum volume of 100 μl, as previously described (44).
Peptides (TFLLR-NH2 and RLLFT-NH2) were dissolved in 10% ethanol, 10% Tween-80, and 80% saline (0.9% NaCl). At different times after the intracolonic administration of the peptides or their vehicle, mice (8 in each group) were sacrificed and distal colonic tissues were harvested. For all studies except the study with the PAR1 antagonist, macroscopic-dam-age score was assessed as previously described (44), scoring inflammatory parameters such as erythema, hemorrhage, edema, stricture formation, ulceration, presence of blood in the feces, mucus presence, diarrhea, and adhesions. MPO activity was assessed as an index of granulocyte infiltra-tion (44). Other tissues adjacent to the site of inflammation were fixed in neutral-buffered formalin and processed by routine histology techniques for microscopic observation (44). Capsaicin (50 mg/kg s.c.) or its vehicle (80% saline, 10% ethanol, 10% Tween-80) was administered 7 days before the intracolonic administration of PAR1-activating peptide, and the effi-cacy of capsaicin pretreatment in ablating sensory nerves was tested just before the sacrifice of the mice, as previously described (25, 45). The NK-1 receptor antagonist SR140333 was administered i.p. (2 mg/kg in 0.1% DMSO) 1 hour before the intracolonic injection of the PAR1-activating peptide (25). This dose has previously been shown to fully inhibit NK-1 receptor activation (46).
TNBS (0.5, 1, and 2 mg/mouse) was dissolved in a solution of saline (0.9% NaCl) plus ethanol and was injected into the colon of mice to induce colitis. As previously described (47), ethanol was used as a “breaker” of the intestinal barrier, which allows TNBS to penetrate colonic tissues. Different concentrations of ethanol lead to different degrees of TNBS penetration into the tissues, resulting in different degrees of inflammation. Therefore, we used 2 different concentrations of ethanol (40% or 50%), associated with different concentrations of TNBS, in order to evaluate various inflammato-ry states. For the experiments aiming to determine whether PAR1 activation exacerbates colitis, the PAR1-activating peptide TFLLR-NH2 or the control peptide RLLFT-NH2 (each at the dose of 50 μg/mouse) was administrated intracolonically or intraperitoneally, 1 hour before and daily after TNBS administration (1 mg/mouse of TNBS in 40% ethanol). Low concentrations of ethanol (40%) and TNBS (1 mg/mouse) were chosen for this experiment
research article
The Journal of Clinical Investigation http://www.jci.org Volume 114 Number 10 November 2004 1455
because of the potential aggravating effects of PAR1 agonist treatment, in order to reduce potential lethality. Each group consisted of 10 mice. Body weight was recorded daily as an index of disease progression, and the same inflammatory parameters (macroscopic-damage score, MPO) were assessed 7 days after TNBS administration, when mice were sacrificed. For the studies performed with the PAR1 antagonist, BALB/c mice received an intrarectal administration of TNBS on day 1 (1 or 2 mg/mouse in 50% eth-anol), and then different doses of the PAR1 antagonist (1, 3, and 5 mg/kg) or its vehicle (carboxymethyl cellulose) were administered i.p. each day, from day 1 (3 hours after TNBS administration) to day 7, as previously described (42). Here again, 2 concentrations of TNBS were used to evalu-ate the effects of the PAR1 antagonist on different inflammatory states. Each group consisted of 12 mice. Survival rate (for the 2-mg/mouse dose of TNBS only) and body weight were recorded. Seven days after TNBS admin-istration, mice were sacrificed and distal colonic tissues were harvested. Macroscopic- and microscopic-damage scores were assessed, blindly, using a dissecting microscope (5) and graded for macroscopic lesions on a scale from 0 to 10 based on criteria reflecting inflammation, such as hyperemia, thickening of the bowel, and the extent of ulceration (43, 48).
For histological examination, a specimen of colon located precisely 2 cm proximal to the anus was resected, fixed in 10% phosphate-buffered formalin, embedded in paraffin, sectioned, and stained with H&E. Slides were examined and graded in a blinded fashion. Inflammation was graded semiquantitatively from 0 to 4 (0: no signs of inflammation; 1: very low level of inflammation; 2: low level of leukocyte infiltration; 3: high level of leukocyte infiltration, high vascular density, thickening of the colon wall; 4: transmural infiltrations, loss of goblet cells, high vascular density, thickening of the colon wall).
Colonic tissue samples were also used to measure TNF-α and IFN-γ pro-tein content by ELISA. For the studies performed with PAR1
–/– mice and their littermates, different doses of TNBS (0.5, 1, and 2 mg/mouse) were used with different concentrations of ethanol (40% and 50%), in order to evaluate dif-ferent degrees of inflammatory responses. Survival rate was followed for the highest concentration of TNBS and ethanol (2 mg/mouse in 50% ethanol); body weight, macroscopic-damage score, MPO activity, and histological examination were followed for all TNBS and ethanol conditions.
As described previously by Okayasu et al. (49), DSS colitis was induced in BALB/c mice that, for 7 days, received 5% (wt/vol) DSS (molecular weight, 40 kDa; ICN Biomedicals Inc.) dissolved in their drinking water, which was filtered using water purification systems from Millipore Corp. No mortal-ity was observed during the 7 days of DSS administration in all groups.
Development of colitis was assessed daily by measurement of drinking volume and body weight, evaluation of stool consistency, and detection of the presence of blood in the stools using a guaiac paper test (Eiken Chemi-cal Co.). Disease severity was scored as described previously by Cooper et al. (50), using a clinical disease activity index ranging from 0 to 4 that was calculated using the following parameters: stool consistency, presence or absence of fecal blood, and weight loss. Mice were sacrificed at day 8 for the PAR1 antagonist experiments and day 7 for the PAR1
–/– mouse experiments. The colons were removed; length and weight were measured after exclusion of the cecum and prior to division for histology and RNA extraction. Histol-ogy was scored and MPO was measured as described for the TNBS model.
Isolation of LPMCs. LPMCs were isolated from freshly obtained mouse colonic specimens using a modification of a previously described tech-nique (51). In brief, after excision of all visible lymphoid follicles, colons were washed in calcium- and magnesium-free HBSS and treated with 1 mM EDTA in PBS for 20 minutes to remove the epithelium. The tissue was then digested with type IV collagenase (Sigma-Aldrich) for 20 minutes in a shaking incubator at 37°C; this step was repeated twice. The released cells were then layered on a 40–100% Percoll gradient (Amersham Pharmacia Biotech Inc.) and centrifuged at 500 g to obtain the lymphocyte-enriched populations at the 40–100% interface (43).
Culture of LPMCs for assay of cytokine production. LPMCs from the dif-ferent treatment regimens were suspended in complete medium (RPMI 1640, 10% heat-inactivated FCS, 3 mM l-glutamine, 10 mM HEPES buf-fer, 10 μg/ml gentamycin, 100 U/ml penicillin, 100 U/ml streptomycin, 0.05 mM 2-β-Mercapto-Ethanol) and cultured at a concentration of 106 cells per milliliter. To measure cytokine production, 106 LPMCs were placed for 48 hours into uncoated culture wells (to measure produc-tion by unstimulated cells) or into wells containing immobilized murine anti-CD3ε antibody (clone 145-2C11; Pharmingen) and 1 μg/ml soluble anti-CD28 (clone 37.51; Pharmingen) (to measure production by stimu-lated cells) (44). Culture supernatants were harvested and assayed for cytokine concentration by ELISA (Endogen Inc.). Some cells were incu-bated for 24 hours in the presence of 10 μM of the PAR1 agonist TFLLR or the control peptide RLLFT (which is inactive on PAR1), with or with-out anti-CD3/anti-CD28 stimulation.
Data analysis. Comparisons among groups were made using 2-tailed Student’s t tests with Bonferroni correction. Data are expressed as mean ± SEM, and a P value less than 0.05 was considered significant.
AcknowledgmentsWe want to thank Giuseppe Caliendo and Vincenzo Santagada, who have synthesized the PAR1 antagonist. This study was sup-ported by operating grants from the Canadian Institutes of Health Research (CIHR) (to N. Vergnolle, P. Beck, M.D. Hollenberg, and J.L. Wallace), by a Proteases and Inflammation Network group grant from the CIHR (to N. Vergnolle, P. Beck, M.D. Hollenberg, and J.L. Wallace), by the Canadian Association of Gastroenterol-ogy (to N. Vergnolle), by the Crohn’s and Colitis Foundation of Canada (to N. Vergnolle, P. Beck, and J.L. Wallace), and by a John-son & Johnson Focused Giving Grant (to J.L. Wallace, M.D. Hol-lenberg, and N.W. Bunnett).
Received for publication March 23, 2004, and accepted in revised form September 14, 2004.
Address correspondence to: Nathalie Vergnolle, Department of Pharmacology and Therapeutics, University of Calgary, 3330 Hos-pital Drive NW, Calgary, Alberta T2N4N1, Canada. Phone: (403) 220-4588; Fax: (403) 210-8195; E-mail: [email protected].
Nathalie Vergnolle and Stefano Fiorucci contributed equally to this work.
1. Hollenberg, M.D., and Compton, S.J. 2002. Interna-tional Union of Pharmacology. XXVIII. Proteinase-activated receptors. Pharmacol. Rev. 54:203–217.
2. Macfarlane, S.R., Seatter, M.J., Kanke, T., Hunter, G.D., and Plevin, R. 2001. Proteinase-activated receptors. Pharmacol. Rev. 53:245–282.
3. Hollenberg, M.D., Saifeddine, M., Al-Ani, B., and Kawabata, A. 1997. Proteinase-activated receptors: structural requirements for activity, receptor cross-
reactivity, and receptor selectivity of receptor-activat-ing peptides. Can. J. Physiol. Pharmacol. 75:832–841.
4. Vergnolle, N., Wallace, J.L., Bunnett, N.W., and Hol-lenberg, M.D. 2001. Protease-activated receptors in inflammation, neuronal signaling and pain. Trends Pharmacol. Sci. 22:146–152.
5. Lourbakos, A., et al. 2001. Arginine-specific protease from Porphyromonas gingivalis activates protease-activated receptors on human oral epithe-
lial cells and induces interleukin-6 secretion. Infect. Immun. 69:5121–5130.
6. Vu, T., Hung, D., Wheaton, V., and Coughlin, S. 1991. Molecular cloning of a functional thrombin receptor reveals a novel proteolytic mechanism of receptor activation. Cell. 64:1057–1068.
7. Coughlin, S.R., and Camerer, E. 2003. PARticipa-tion in inflammation. J. Clin. Invest. 111:25–27. doi:10.1172/JCI200317564.
research article
1456 The Journal of Clinical Investigation http://www.jci.org Volume 114 Number 10 November 2004
8. Asokananthan, N., et al. 2002. Activation of protease-activated receptor (PAR)-1, PAR-2, and PAR-4 stimulates IL-6, IL-8, and prostaglandin E2 release from human respiratory epithelial cells. J. Immunol. 168:3577–3585.
9. Boven, L.A., et al. 2003. Up-regulation of proteinase-activated receptor 1 expression in astrocytes during HIV encephalitis. J. Immunol. 170:2638–2646.
10. Cirino, G., et al. 1996. Thrombin functions as an inflammatory mediator through activation of its receptor. J. Exp. Med. 183:821–827.
11. Copple, B.L., Moulin, F., Hanumegowda, U.M., Ganey, P.E., and Roth, R.A. 2003. Thrombin and protease-activated receptor-1 agonists promote lipopolysaccharide-induced hepatocellular injury in perfused livers. J. Pharmacol. Exp. Ther. 305:417–425.
12. Vergnolle, N., Hollenberg, M.D., and Wallace, J.L. 1999. Pro- and anti-inflammatory actions of throm-bin: a distinct role for proteinase-activated receptor-1 (PAR1). Br. J. Pharmacol. 126:1262–1268.
13. Corvera, C.U., et al. 1999. Thrombin and mast cell tryptase regulate guinea-pig myenteric neurons through proteinase-activated receptors-1 and -2. J. Physiol. 517:741–756.
14. Dery, O., Corvera, C., Steinhoff, M., and Bunnett, N. 1998. Proteinase-activated receptors: novel mechanisms of signaling by serine proteases. Am. J. Physiol. 274:C1429–C1452.
15. Vergnolle, N. 2000. Review article. Proteinase-activated receptors: novel signals for gastrointes-tinal pathophysiology. Aliment. Pharmacol. Ther. 14:257–266.
16. Buresi, M.C., et al. 2001. Protease-activated recep-tor-1 stimulates Ca(2+)-dependent Cl(-) secretion in human intestinal epithelial cells. Am. J. Physiol. Gastrointest. Liver Physiol. 281:G323–G332.
17. Chin, A.C., et al. 2003. Proteinase-activated receptor-1 induces apoptosis and increases intes-tinal permeability. Proc. Natl. Acad. Sci. U. S. A. 100:11104–11109.
18. Darmoul, D., Gratio, V., Devaud, H., Lehy, T., and Laburthe, M. 2003. Aberrant expression and activation of the thrombin receptor protease-acti-vated receptor-1 induces cell proliferation and motility in human colon cancer cells. Am. J. Pathol. 162:1503–1513.
19. Seymour, M.L., Zaidi, N.F., Hollenberg, M.D., and Macnaughton, W.K. 2003. PAR1-dependent and independent increases in COX-2 and PGE2 in human colonic myofibroblasts stimulated by thrombin. Am. J. Physiol. Cell Physiol. 284:C1185–C1192.
20. Mule, F., Baffi, M.C., and Cerra, M.C. 2002. Dual effect mediated by protease-activated receptors on the mechanical activity of rat colon. Br. J. Pharmacol. 136:367–374.
21. Mule, F., Baffi, M.C., Falzone, M., and Cerra, M.C. 2002. Signal transduction pathways involved in the mechanical responses to protease-activated receptors
in rat colon. J. Pharmacol. Exp. Ther. 303:1265–1272. 22. Kirsner, J.B. 2000. Inflammatory bowel disease. 5th
edition. W.B. Saunders Co. Philadelphia, Pennsyl-vania, USA. 832 pp.
23. Bustos, D., et al. 1998. Colonic proteinases: increased activity in patients with ulcerative colitis. Medicina (B. Aires). 58:262–264.
24. Kjeldsen, J., Lassen, J., Brandslund, I., and Schaf-falitzky de Muckadell, O. 1998. Markers of coagula-tion and fibrinolysis as measures of disease activity in inflammatory bowel disease. Scand. J. Gastroen-terol. 33:637–643.
25. Nguyen, C., et al. 2003. Proteinase-activated recep-tor-2-induced colitis is mediated by a neurogenic mechanism. Can. J. Physiol. Pharmacol. 81:920–927.
26. Elson, C.O., et al. 1996. Hapten-induced model of murine inflammatory bowel disease: mucosa immune responses and protection by tolerance. J. Immunol. 157:2174–2185.
27. de Garavilla, L., et al. 2001. Agonists of proteinase-activated receptor 1 induce plasma extravasation by a neurogenic mechanism. Br. J. Pharmacol. 133:975–987.
28. Strater, J., et al. 1997. CD95 (APO-1/Fas)-mediated apoptosis in colon epithelial cells: a possible role in ulcerative colitis. Gastroenterology. 113:160–167.
29. McCafferty, D.M., Smith, C.W., Granger, D.N., and Kubes, P. 1999. Intestinal inflammation in adhe-sion molecule-deficient mice: an assessment of P-selectin alone and in combination with ICAM-1 or E-selectin. J. Leukoc. Biol. 66:67–74.
30. Naldini, A., Sower, L., Bocci, V., Meyers, B., and Carney, D.H. 1998. Thrombin receptor expression and responsiveness of human monocytic cells to thrombin is linked to interferon-induced cellular differentiation. J. Cell. Physiol. 177:76–84.
31. Colognato, R., et al. 2003. Differential expression and regulation of protease-activated receptors in human peripheral monocytes and monocyte-derived antigen-presenting cells. Blood. 102:2645–2652.
32. Bar-Shavit, R., et al. 2002. Signalling pathways induced by protease-activated receptors and integrins in T cells. Immunology. 105:35–46.
33. Suk, K., and Cha, S. 1999. Thrombin-induced interleukin-8 production and its regulation by interferon-gamma and prostaglandin E2 in human monocytic U937 cells. Immunol. Lett. 67:223–227.
34. Kawabata, A., et al. 2004. A protective role of protease-activated receptor 1 in rat gastric mucosa. Gastroenterology. 126:208–219.
35. Hawkey, C.J., Karmeli, F., and Rachmilewitz, D. 1983. Imbalance of prostacyclin and thromboxane synthesis in Crohn’s disease. Gut. 24:881–885.
36. Coughlin, S.R. 1999. How the protease throm-bin talks to cells. Proc. Natl. Acad. Sci. U. S. A. 96:11023–11027.
37. Vergnolle, N. 2004. Modulation of visceral pain and inflammation by protease-activated receptors.
Br. J. Pharmacol. 141:1264–1274. 38. Sun, G., Stacey, M.A., Schmidt, M., Mori, L., and
Mattoli, S. 2001. Interaction of mite allergens Der p3 and Der p9 with protease-activated recep-tor-2 expressed by lung epithelial cells. J. Immunol. 167:1014–1021.
39. Asokananthan, N., et al. 2002. House dust mite allergens induce proinflammatory cytokines from respiratory epithelial cells: the cysteine protease allergen, Der p 1, activates protease-activated receptor (PAR)-2 and inactivates PAR-1. J. Immunol. 169:4572–4578.
40. Ferrell, W.R., et al. 2003. Essential role for proteinase-activated receptor-2 in arthritis. J. Clin. Invest. 111:35–41. doi:10.1172/JCI200316913.
41. Zhang, H.C., et al. 2001. Discovery and optimiza-tion of a novel series of thrombin receptor (par-1) antagonists: potent, selective peptide mimetics based on indole and indazole templates. J. Med. Chem. 44:1021–1024.
42. Fiorucci, S., et al. 2004. PAR1 antagonism pro-tects against experimental liver fibrosis. Role of proteinase receptors in stellate cell activation. Hepatology. 39:365–375.
43. Fiorucci, S., et al. 2002. Importance of innate immu-nity and collagen binding integrin alpha1beta1 in TNBS-induced colitis. Immunity. 17:769–780.
44. Cenac, N., et al. 2002. Induction of intestinal inflammation in mouse by activation of proteinase-activated receptor-2. Am. J. Pathol. 161:1903–1915.
45. Steinhoff, M., et al. 2000. Agonists of proteinase-activated receptor 2 induce inflammation by a neu-rogenic mechanism. Nat. Med. 6:151–158.
46. Amann, R., Schuligoi, R., Holzer, P., and Donnerer, J. 1995. The non-peptide NK1 receptor antago-nist SR140333 produces long-lasting inhibition of neurogenic inflammation, but does not influ-ence acute chemo- or thermonociception in rats. Naunyn Schmiedebergs Arch. Pharmacol. 352:201–205.
47. Morris, G.P., et al. 1989. Hapten-induced model of chronic inflammation and ulceration in the rat colon. Gastroenterology. 96:795–803.
48. Fiorucci, S., et al. 2001. Proteinase-activated receptor 2 is an anti-inflammatory signal for colonic lamina propria lymphocytes in a mouse model of colitis. Proc. Natl. Acad. Sci. U. S. A. 98:13936–13941.
49. Okayasu, I., et al. 1990. A novel method in the induction of reliable experimental acute and chronic ulcerative colitis in mice. Gastroenterology. 98:694–702.
50. Cooper, H.S., Murthy, S.N., Shah, R.S., and Seder-gran, D.J. 1993. Clinicopathologic study of dextran sulfate sodium experimental murine colitis. Lab. Invest. 69:238–249.
51. Van der Heijden, P.J., and Stok, W. 1987. Improved procedure for the isolation of functionally active lymphoid cells from the murine intestine. J. Immunol. Methods. 103:161–167.