Embed Size (px)
Citation preview
A Second Look at DEM‟s
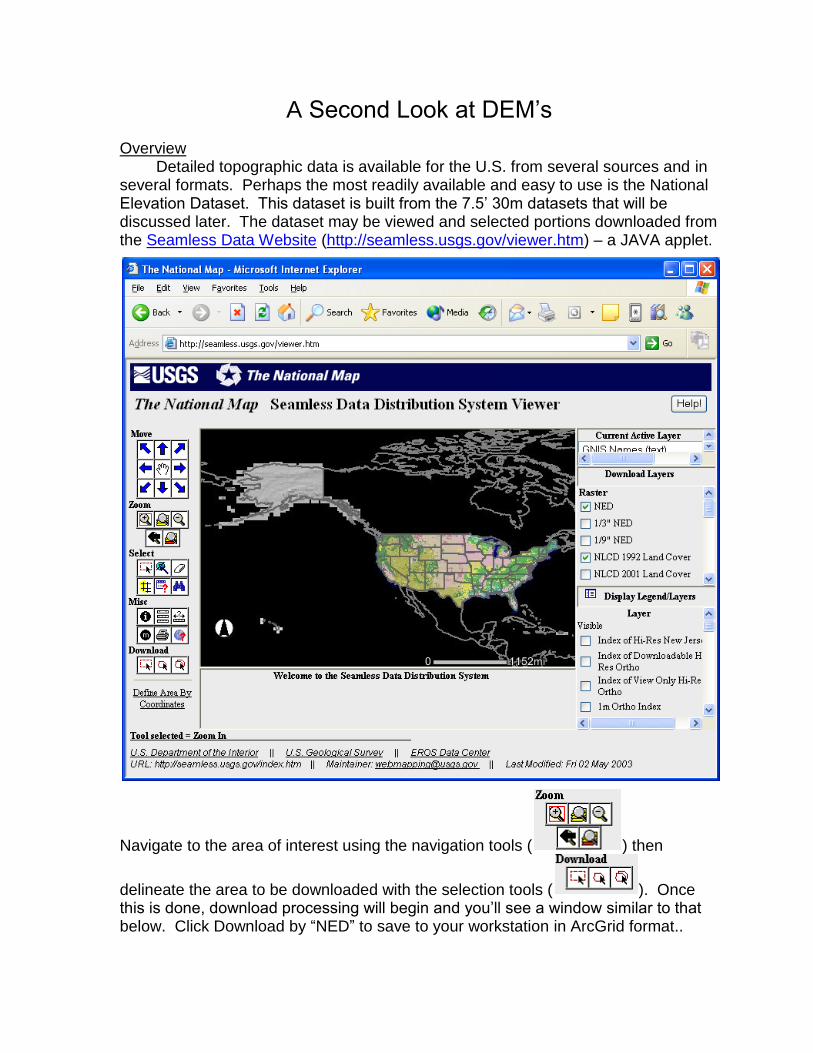
Overview Detailed topographic data is available for the U.S. from several sources and in
several formats. Perhaps the most readily available and easy to use is the National Elevation Dataset. This dataset is built from the 7.5‟ 30m datasets that will be discussed later. The dataset may be viewed and selected portions downloaded from the Seamless Data Website (http://seamless.usgs.gov/viewer.htm) – a JAVA applet.
Navigate to the area of interest using the navigation tools ( ) then
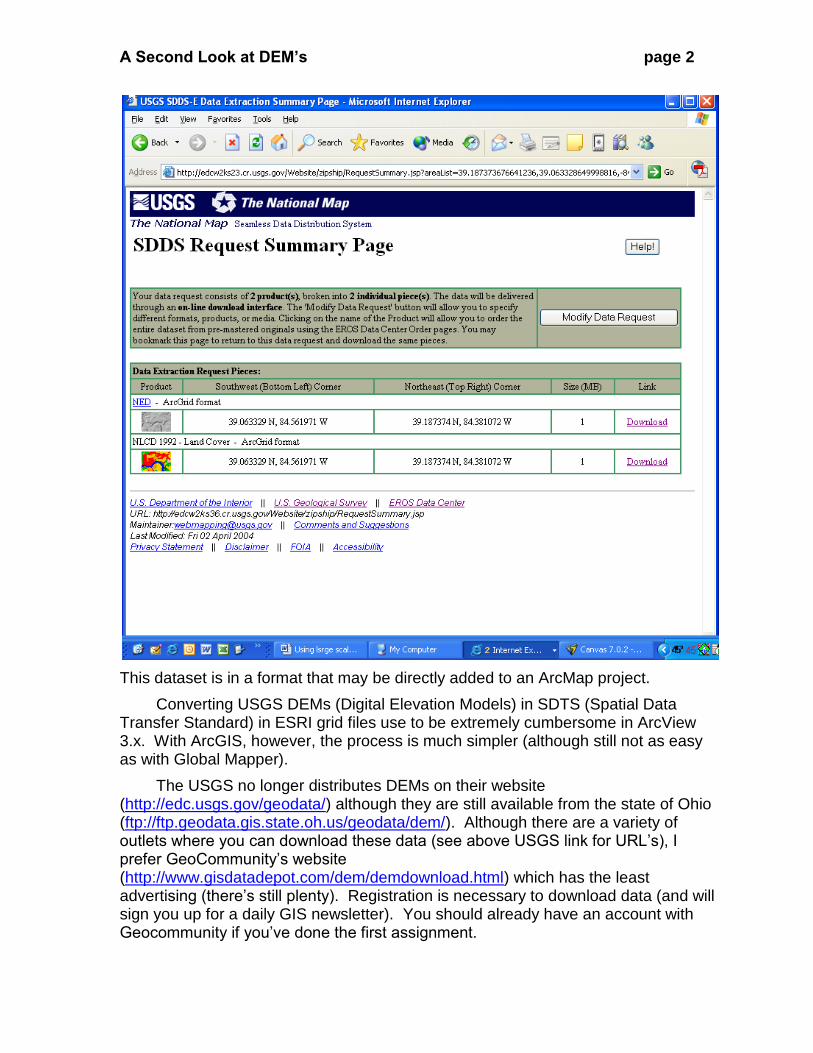
delineate the area to be downloaded with the selection tools ( ). Once this is done, download processing will begin and you‟ll see a window similar to that below. Click Download by “NED” to save to your workstation in ArcGrid format..
A Second Look at DEM’s page 2
This dataset is in a format that may be directly added to an ArcMap project.
Converting USGS DEMs (Digital Elevation Models) in SDTS (Spatial Data Transfer Standard) in ESRI grid files use to be extremely cumbersome in ArcView 3.x. With ArcGIS, however, the process is much simpler (although still not as easy as with Global Mapper).
The USGS no longer distributes DEMs on their website (http://edc.usgs.gov/geodata/) although they are still available from the state of Ohio (ftp://ftp.geodata.gis.state.oh.us/geodata/dem/). Although there are a variety of outlets where you can download these data (see above USGS link for URL‟s), I prefer GeoCommunity‟s website (http://www.gisdatadepot.com/dem/demdownload.html) which has the least advertising (there‟s still plenty). Registration is necessary to download data (and will sign you up for a daily GIS newsletter). You should already have an account with Geocommunity if you‟ve done the first assignment.
A Second Look at DEM’s page 3
Downloading Data from GeoCommunity
1. Go to the URL given above.
2. Click on the appropriate state, then county. Click Digital Elevation Models (DEM) - 2. Click the green (free) download arrow on the right side of the quadrangle you wish to download.
3. Click the save file button on the dialog box and use the browser that then appears to specify a storage location. I suggest placing the file in a folder labeled with the quads name because the file just has a numeric designation. Don‟t use non-DOS characters in the file name (such as space).
4. When the download is complete, unzip the file producing many smaller files (another reason to put each download in a separate folder).
Reading data withArcToolbox
1. Start ArcToolbox from the ESRI ArcGIS folder on the start menu.
2. Open the Import to Raster toolbox (click on „+‟ sign) if it is not open already.
3. Double Click on SDTS raster to grid button which will bring up a browser in which you can navigate to the DEM folder you created above. Note that the folder must not be within any folder which has a space in its label.
4. Enter a name for the output grid.
5. When you click on the appropriate folder, an open dialog box should appear in which the numeric prefix of your DEM should appear in the right-hand panel. Double click on this prefix and your DEM will be converted an ESRI raster. Note that this process produces many files all of which are stored in a folder with the label you specified in step 4.
Reading data into Global Mapper
1. Double click on zipped file.
2. Export file or files (the fact that Global Mapper will mosaic datasets together is one of the many advantages of the program) to a raster file using the Arc ASCII format. It is important that you save this file in a location that does not have spaces in its path name because the ArcToolbox conversion program can‟t handle that.
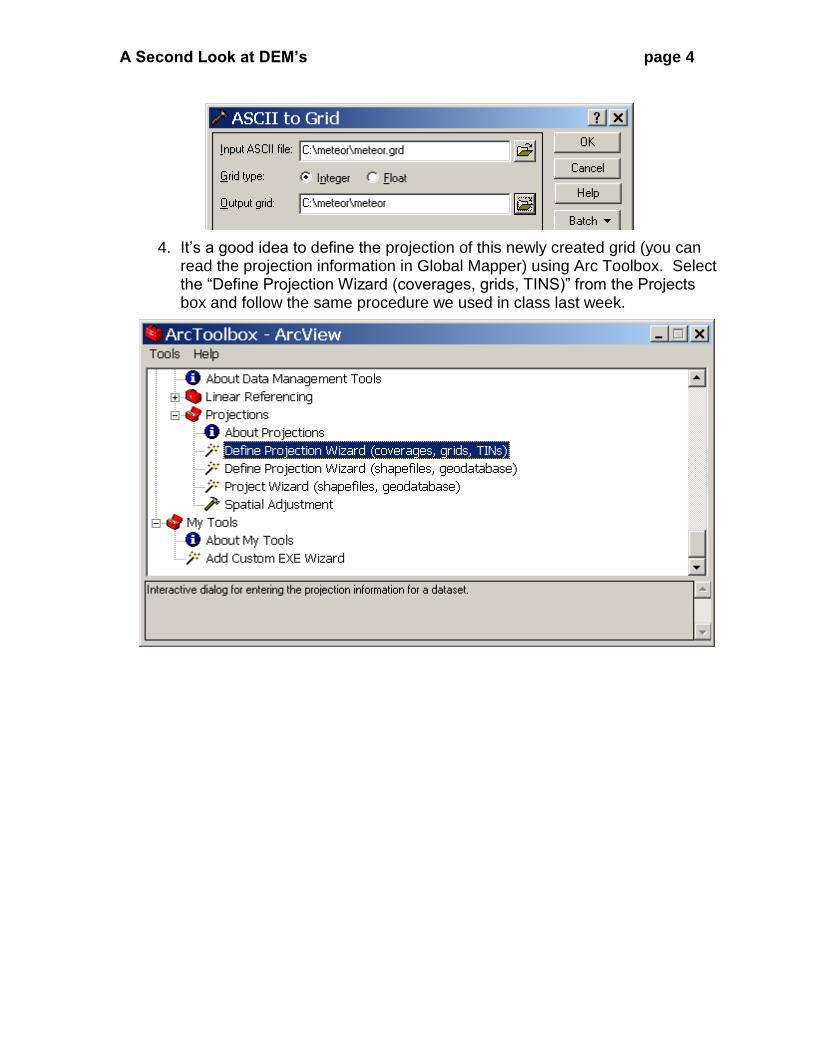
3. Open Arc Toolbox and run “ASCII to Grid” from the “Input to Raster” tool set.
A Second Look at DEM’s page 4
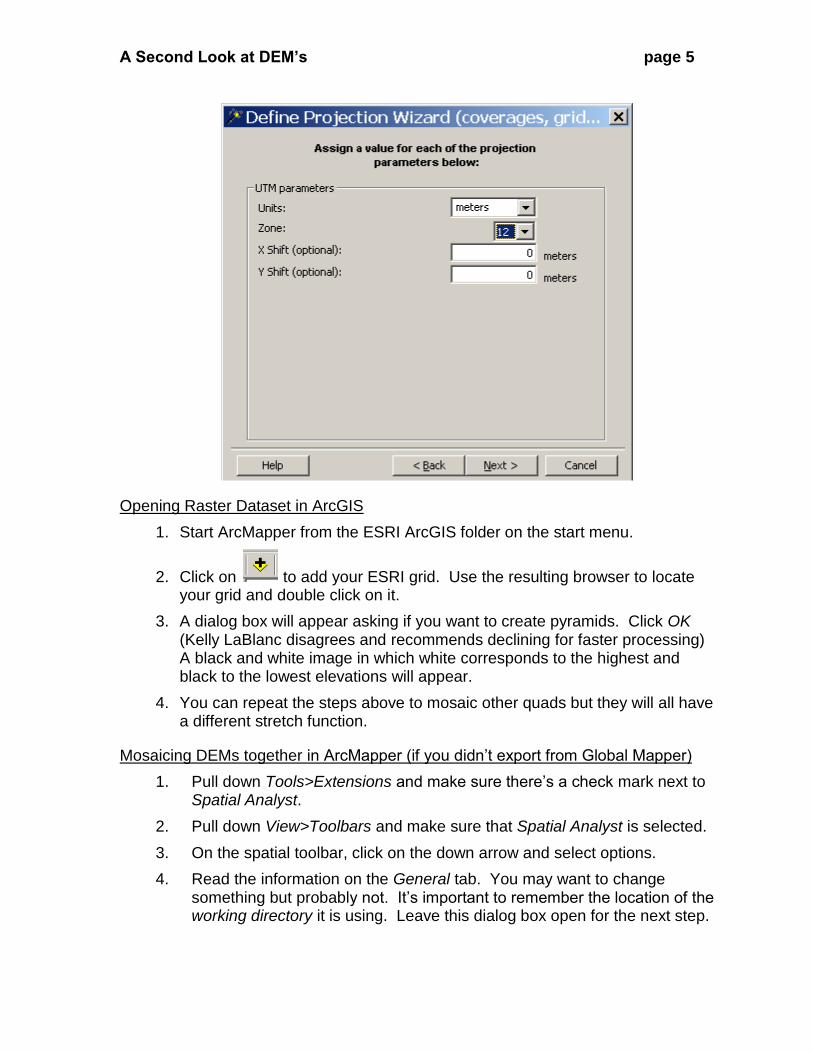
4. It‟s a good idea to define the projection of this newly created grid (you can read the projection information in Global Mapper) using Arc Toolbox. Select the “Define Projection Wizard (coverages, grids, TINS)” from the Projects box and follow the same procedure we used in class last week.
A Second Look at DEM’s page 5
Opening Raster Dataset in ArcGIS
1. Start ArcMapper from the ESRI ArcGIS folder on the start menu.
2. Click on to add your ESRI grid. Use the resulting browser to locate your grid and double click on it.
3. A dialog box will appear asking if you want to create pyramids. Click OK (Kelly LaBlanc disagrees and recommends declining for faster processing) A black and white image in which white corresponds to the highest and black to the lowest elevations will appear.
4. You can repeat the steps above to mosaic other quads but they will all have a different stretch function.
Mosaicing DEMs together in ArcMapper (if you didn‟t export from Global Mapper)
1. Pull down Tools>Extensions and make sure there‟s a check mark next to Spatial Analyst.
2. Pull down View>Toolbars and make sure that Spatial Analyst is selected.
3. On the spatial toolbar, click on the down arrow and select options.
4. Read the information on the General tab. You may want to change something but probably not. It‟s important to remember the location of the working directory it is using. Leave this dialog box open for the next step.
A Second Look at DEM’s page 6
5. Click on the Extent tab and pull down Analysis Extent to Union of inputs. Close the dialog box
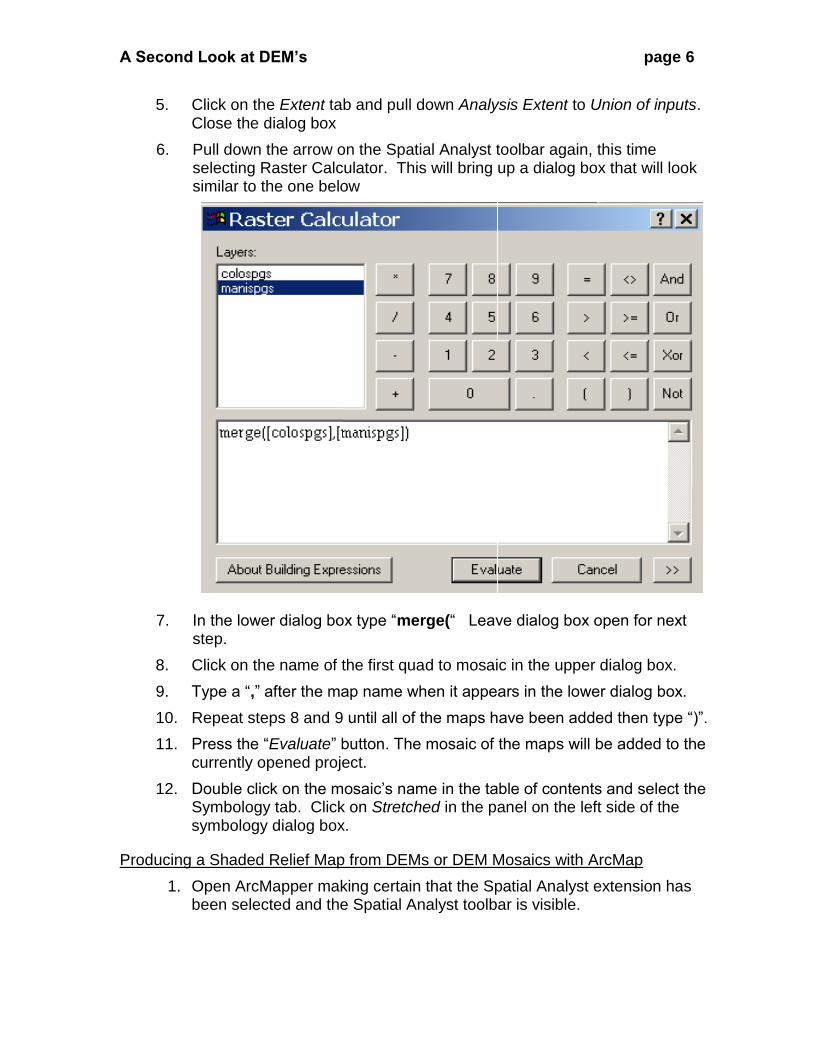
6. Pull down the arrow on the Spatial Analyst toolbar again, this time selecting Raster Calculator. This will bring up a dialog box that will look similar to the one below
7. In the lower dialog box type “merge(“ Leave dialog box open for next
step.
8. Click on the name of the first quad to mosaic in the upper dialog box.
9. Type a “,” after the map name when it appears in the lower dialog box.
10. Repeat steps 8 and 9 until all of the maps have been added then type “)”.
11. Press the “Evaluate” button. The mosaic of the maps will be added to the currently opened project.
12. Double click on the mosaic‟s name in the table of contents and select the Symbology tab. Click on Stretched in the panel on the left side of the symbology dialog box.
Producing a Shaded Relief Map from DEMs or DEM Mosaics with ArcMap
1. Open ArcMapper making certain that the Spatial Analyst extension has been selected and the Spatial Analyst toolbar is visible.
A Second Look at DEM’s page 7
2. Pull down the arrow on the Spatial Analyst toolbar to Surface Analysis and select Hillshade.
3. Select the dataset from which you want to produce the shaded relief map and the name you want to give to the output data set (once again, remember that this name will be given to a folder containing many files). You may also wish to add some vertical exaggeration (Z factor) but don‟t get carried away. I suggest not touching the illumination azimuth and altitude unless you know what you‟re doing.
4. Click okay
Clipping versus Using a Data frame with an ESRI Raster
Frequently it will be necessary or desirable to display only a portion of a raster‟s full extent (e.g., when you wish to only display that portion of a state DEM for a single county). There are several ways this can be done. One way is to clip the raster to produce a smaller subset of the full extent containing only the extent of the area of interest. The other way is to specify a frame that will only display that portion of the raster that is of interest. Both methods have their advantages and disadvantages.
Using a Data frame with an ESRI Raster
To use a data frame to limit the display of a raster‟s full extent
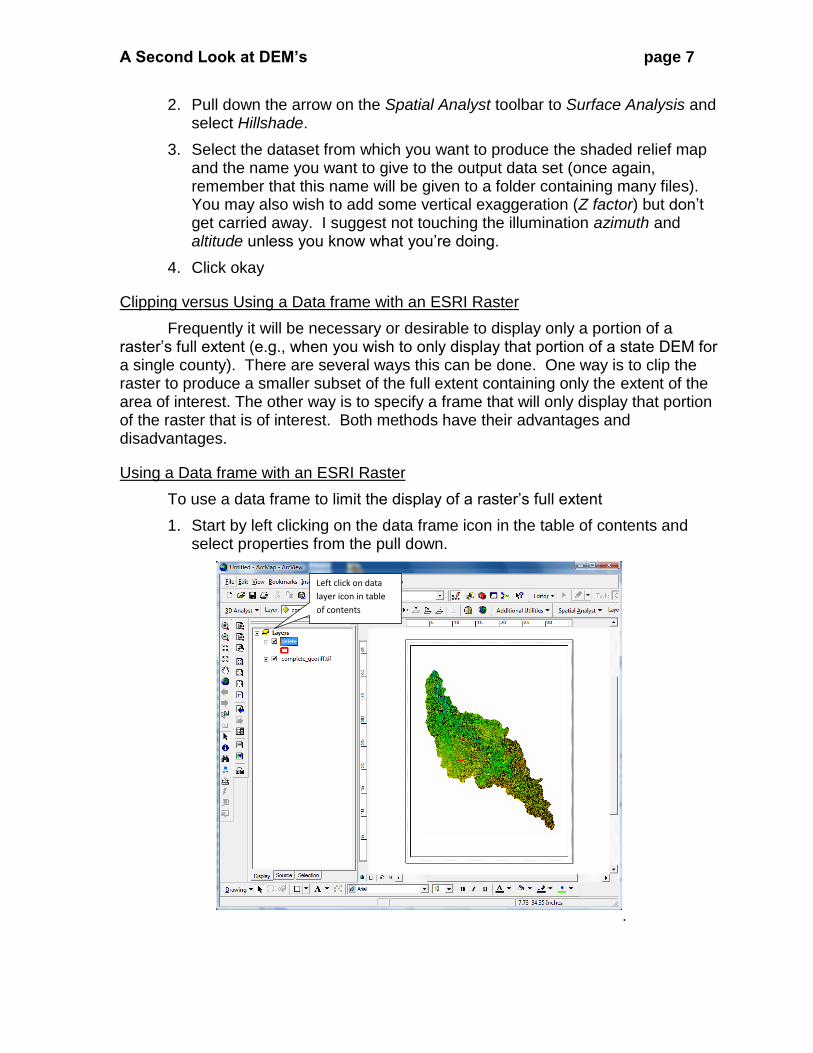
1. Start by left clicking on the data frame icon in the table of contents and select properties from the pull down.
.
Left click on data
layer icon in table
of contents
A Second Look at DEM’s page 8
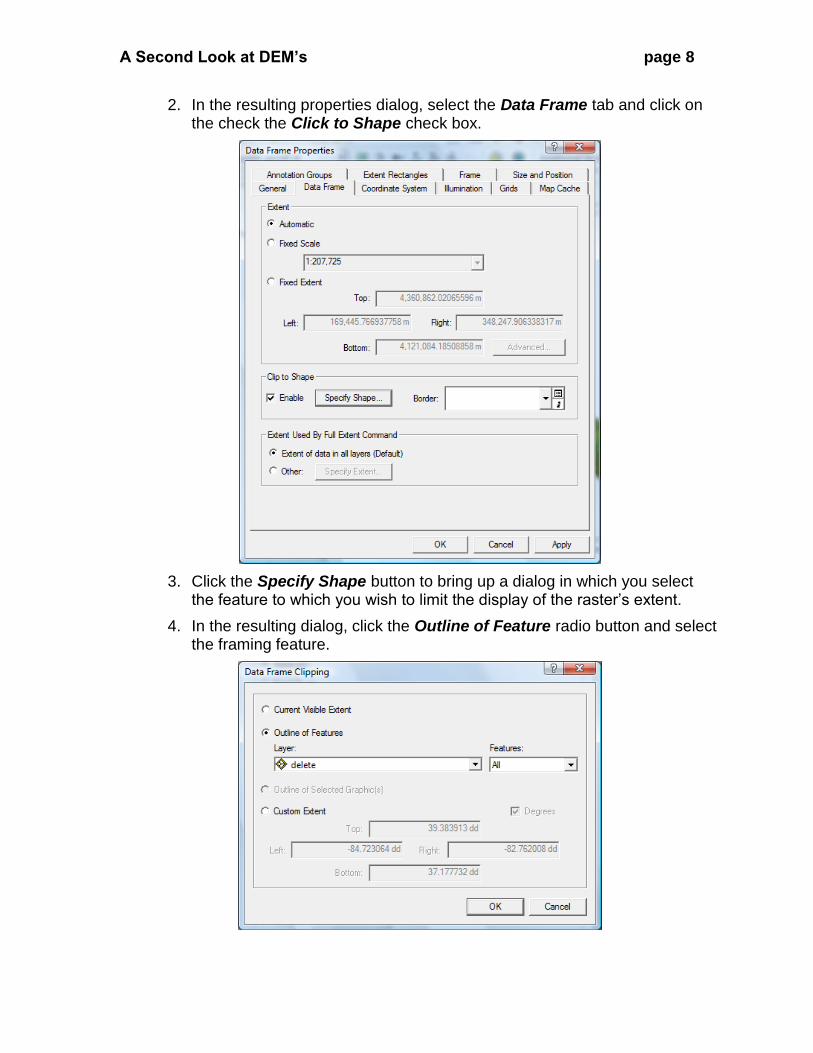
2. In the resulting properties dialog, select the Data Frame tab and click on the check the Click to Shape check box.
3. Click the Specify Shape button to bring up a dialog in which you select the feature to which you wish to limit the display of the raster‟s extent.
4. In the resulting dialog, click the Outline of Feature radio button and select the framing feature.
A Second Look at DEM’s page 9
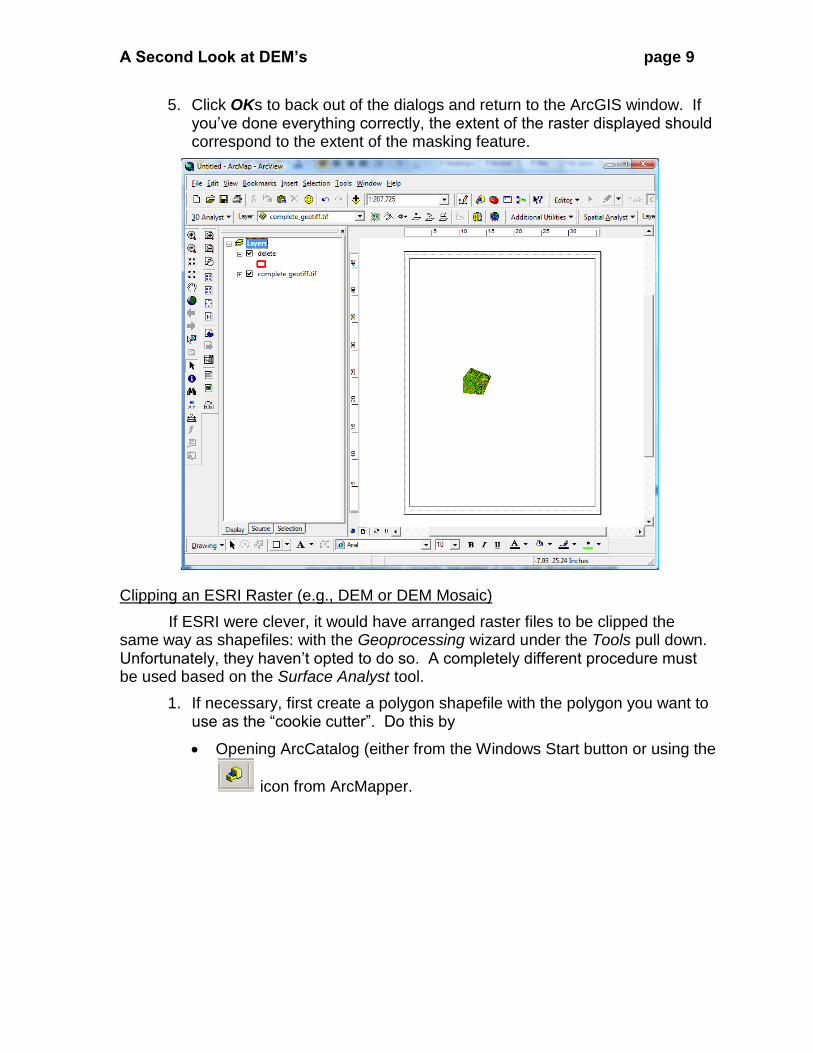
5. Click OKs to back out of the dialogs and return to the ArcGIS window. If you‟ve done everything correctly, the extent of the raster displayed should correspond to the extent of the masking feature.
Clipping an ESRI Raster (e.g., DEM or DEM Mosaic)
If ESRI were clever, it would have arranged raster files to be clipped the same way as shapefiles: with the Geoprocessing wizard under the Tools pull down. Unfortunately, they haven‟t opted to do so. A completely different procedure must be used based on the Surface Analyst tool.
1. If necessary, first create a polygon shapefile with the polygon you want to use as the “cookie cutter”. Do this by
Opening ArcCatalog (either from the Windows Start button or using the
icon from ArcMapper.
A Second Look at DEM’s page 10
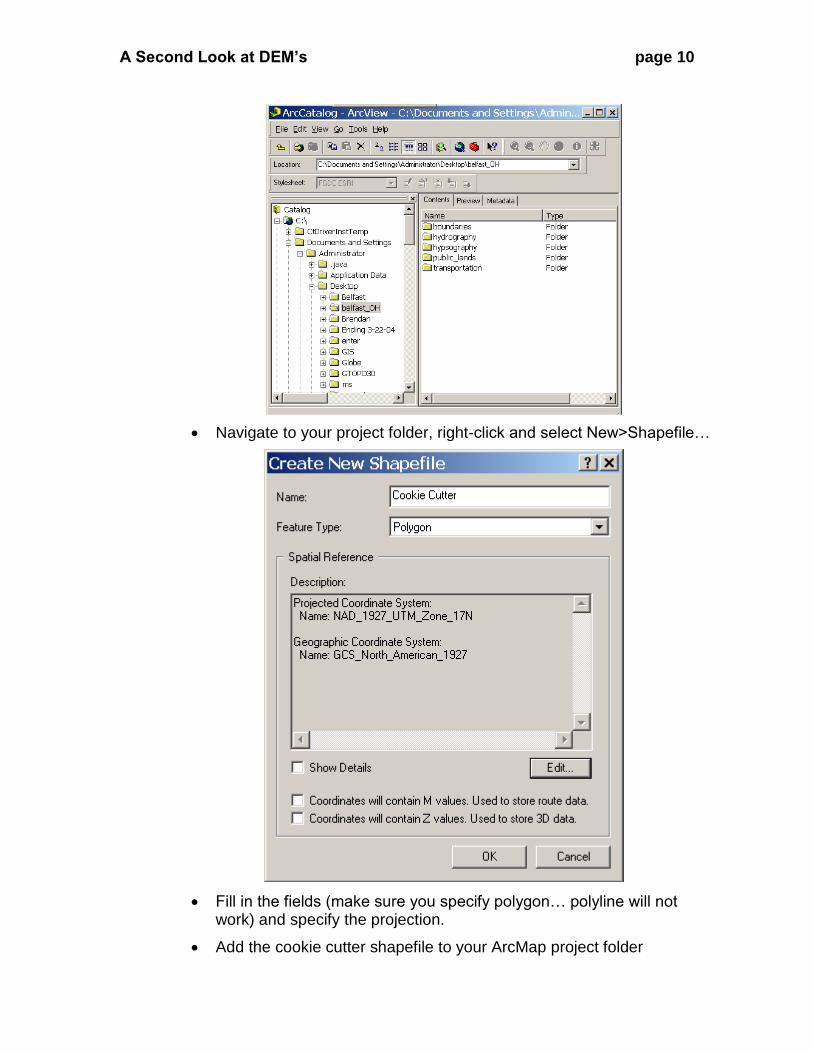
Navigate to your project folder, right-click and select New>Shapefile…
Fill in the fields (make sure you specify polygon… polyline will not work) and specify the projection.
Add the cookie cutter shapefile to your ArcMap project folder
A Second Look at DEM’s page 11
On the editor pull down, select “Start Editting” and select the task as “Create New Feature” and the target as the cookie cutter shapefile.
Click on the pencil ( ) tool and click the mouse to define the cookie cutter shapefile (double click on last point to complete)
Stop editing and save polygon
2. Make certain that the Spatial Analyst extension has been selected and the Spatial Analyst toolbar is visible.
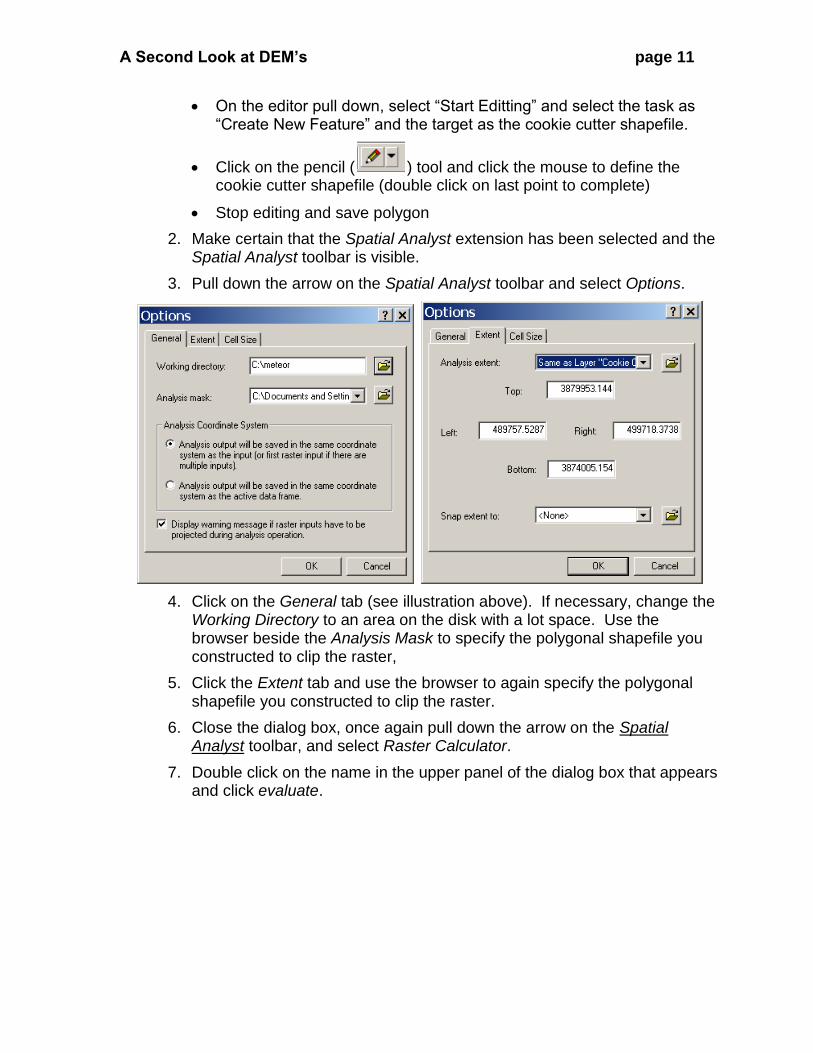
3. Pull down the arrow on the Spatial Analyst toolbar and select Options.
4. Click on the General tab (see illustration above). If necessary, change the Working Directory to an area on the disk with a lot space. Use the browser beside the Analysis Mask to specify the polygonal shapefile you constructed to clip the raster,
5. Click the Extent tab and use the browser to again specify the polygonal shapefile you constructed to clip the raster.
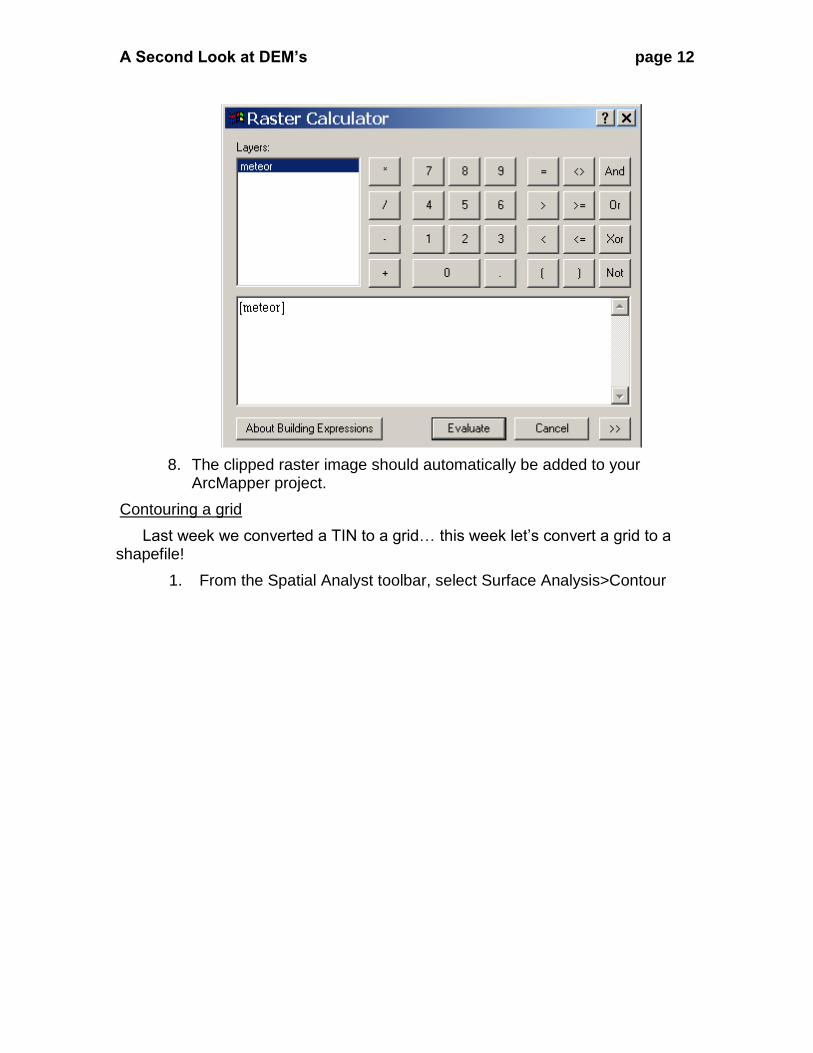
6. Close the dialog box, once again pull down the arrow on the Spatial Analyst toolbar, and select Raster Calculator.
7. Double click on the name in the upper panel of the dialog box that appears and click evaluate.
A Second Look at DEM’s page 12
8. The clipped raster image should automatically be added to your ArcMapper project.
Contouring a grid
Last week we converted a TIN to a grid… this week let‟s convert a grid to a shapefile!
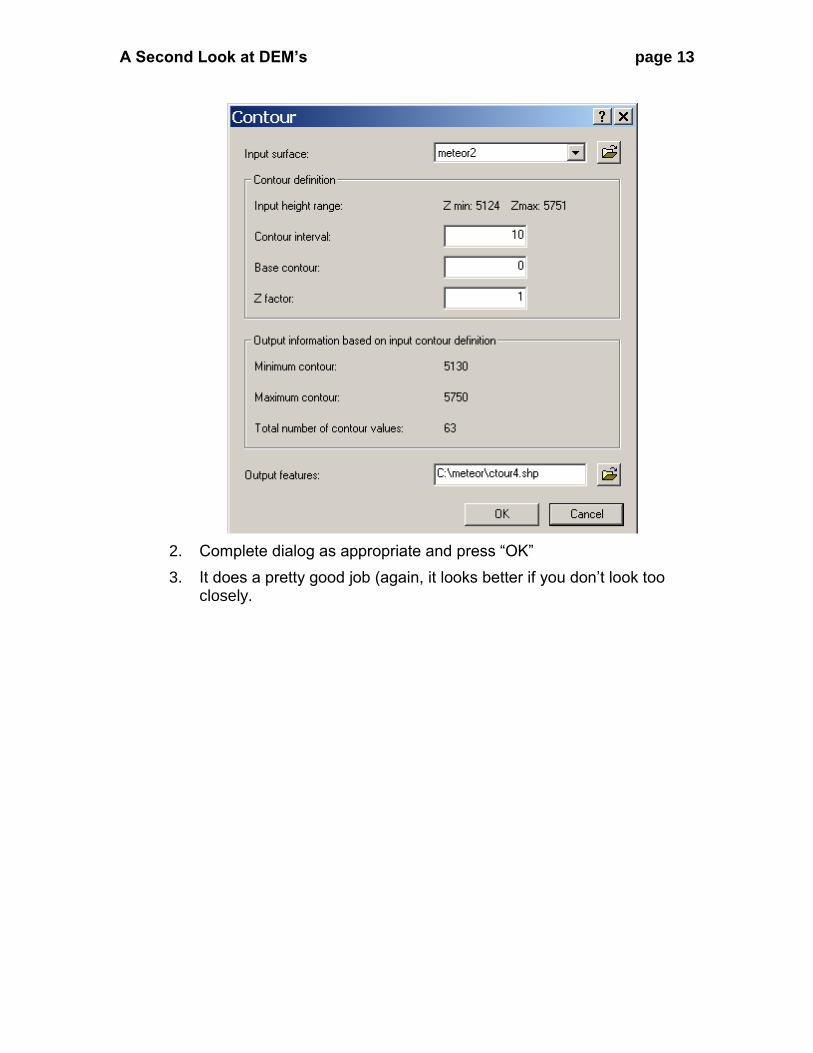
1. From the Spatial Analyst toolbar, select Surface Analysis>Contour
A Second Look at DEM’s page 13
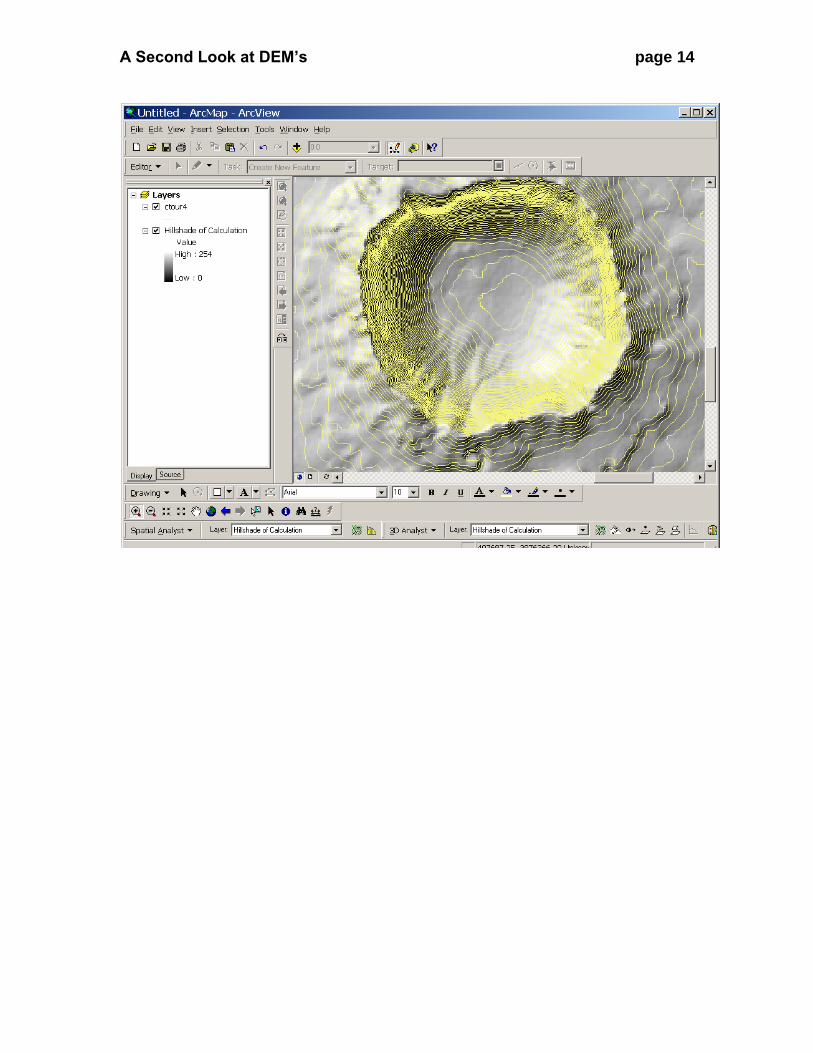
2. Complete dialog as appropriate and press “OK”
3. It does a pretty good job (again, it looks better if you don‟t look too closely.
A Second Look at DEM’s page 14


![A new look at euclid’s second propositioncgm.cs.mcgill.ca/.../Euclid-Second-Proposition-Math-Intell.pdf · A New Look at Euclid's Second Proposition ... Pedoe [27] contains a lively](https://img.pdfslide.net/doc/110x75/5abb5db47f8b9a441d8cbc87/a-new-look-at-euclids-second-new-look-at-euclids-second-proposition-pedoe.jpg)