Embed Size (px)
Citation preview
on July 7, 2018http://rsif.royalsocietypublishing.org/Downloaded from
rsif.royalsocietypublishing.org
ResearchCite this article: Willis L, Cox EJ, Duke T.
2013 A simple probabilistic model of submi-
croscopic diatom morphogenesis. J R Soc
Interface 10: 20130067.
http://dx.doi.org/10.1098/rsif.2013.0067
Received: 23 January 2013
Accepted: 8 March 2013
Subject Areas:biocomplexity, biomathematics
Keywords:diatom morphogenesis, pattern formation,
nonlinear stochastic model
Author for correspondence:L. Willis
e-mail: [email protected]
†Present address: Sainsbury Laboratory,
Cambridge University, Cambridge CB2 1LR, UK.‡These authors contributed equally to this
study.}Recently deceased.
Electronic supplementary material is available
at http://dx.doi.org/10.1098/rsif.2013.0067 or
via http://rsif.royalsocietypublishing.org.
& 2013 The Author(s) Published by the Royal Society. All rights reserved.
A simple probabilistic model ofsubmicroscopic diatom morphogenesis
L. Willis1,†, E. J. Cox2,‡ and T. Duke3,‡,}
1CoMPLEX, University College London, Gower Street, London WC1E 6BT, UK2Natural History Museum, Cromwell Road, London SW7 5BD, UK3London Centre for Nanotechnology, 17 – 19 Gordon Street, London WC1E 0AH, UK
Unicellular algae called diatoms morph biomineral compounds into tough
exoskeletons via complex intracellular processes about which there is much
to be learned. These exoskeletons feature a rich variety of structures from sub-
microscale to milliscale, many that have not been reproduced in vitro. In order
to help understand this complex miniature morphogenesis, here we introduce
and analyse a simple model of biomineral kinetics, focusing on the exoskele-
ton’s submicroscopic patterned planar structures called pore occlusions. The
model reproduces most features of these pore occlusions by retuning just
one parameter, thereby indicating what physio-biochemical mechanisms
could sufficiently explain morphogenesis at the submicroscopic scale: it is suf-
ficient to identify a mechanism of lateral negative feedback on the biomineral
reaction kinetics. The model is nonlinear and stochastic; it is an extended ver-
sion of the threshold voter model. Its mean-field equation provides a simple
and, as far as the authors are aware, new way of mapping out the spatial
patterns produced by lateral inhibition and variants thereof.
1. IntroductionCollect any spoonful of mud from a riverbed, any scrape of residue from a tidal
rock or any potful of coastal water. Upon its examination under the light micro-
scope, the careful eye will most likely observe a number of microscopic entities,
each of a curious, well-defined shape. These are diatoms, unicellular algae that
are prolific in the world’s waters. Their shapes are bestowed by tough, biosilica
cell walls called frustules. These frustules display a variety and an intricacy of
hierarchical structures so plentiful that they have delighted and puzzled natural
scientists for some 300 years, since the development of the first light micro-
scopes [1,2]. The structures range from the curious micro-milliscale bounding
cell wall shapes seen in the microscope (figure 1a), to slender spines radiating
out from the cell to reach a length of up to five times the cell’s diameter, to inter-
locking finger-like joints between diatoms that maintain filamentous colonies
[3,4]. The delight and puzzlement are reinforced by the fact that some of
these structures are extremely tiny, yet they are rebuilt faithfully repeatedly
upon each mitotic cell division.
Documenting the range of frustule morphologies has been a bewildering task:
taxonomists use frustule morphology to categorize diatoms, by which measure
there are over 100 000 species. In order to understand how the diatom cell coordi-
nates its components to bring about this morphology, there is much work to be
carried out—this is a more bewildering task, and it is useful to break it into smal-
ler, more digestible pieces. In this study, we focus on the tiniest biosilica structures
of frustules, the nano-mesoscale morphologies called pore occlusions that occlude
larger microscale pores.
Ultrastructural studies evidence a complicated morphogenetic sequence that
is common to all diatoms ([3–5]; figure 1b). In brief, upon mitotic cell division,
each daughter cell inherits one-half of its mother’s frustule, frustules being
always bipartite, usually comprising two large, primarily planar, components
called valves connected by a series of smaller linking bands called girdle bands.During the cell cycle, each daughter cell constructs afresh one-half of a frustule

microscale poreson a valveand theirnano-mesoscaleocclusions
(a)(i)
(ii)
(b)
the daughter cells finallyseparate upon completionof the new valves. New girdle bands are addedlater in the cell cycle
frustules are bipartite,comprising valves(dark outline bands)and linking girdle bands(lighter outline bands)
upon mitotic cell division,each daughter cell inheritsone half of its mother’sfrustule
new valves (dark internalbands) are constructedintracellularly within large, purpose-builtvesicles
20 mm
2 mm
valve
girdle bands
boundingmicro-milliscalefrustule shape
Figure 1. (a) SEM images show the exterior of a frustule of Hydrosera (i), and the interior apex of a valve of Rhaphoneis (ii). (b) Mitotic cell cycle during which newhalf frustules (a valve plus girdle bands) are constructed by each daughter cell. Schematic shows a cross section through the cell, including the cytoplasm (boxedrectangle) containing the nucleus (white disk), the mother frustule (valves are the dark bands outside the cytoplasm, girdle bands are the lighter bands outside thecytoplasm), and newly constructed valves (dark bands that appear within the cytoplasm). (Online version in colour.)
rsif.royalsocietypublishing.orgJR
SocInterface10:20130067
2
on July 7, 2018http://rsif.royalsocietypublishing.org/Downloaded from
(a new valve plus new girdle bands), which mirrors its inher-
ited half frustule, thereby propagating the frustule’s form
over generations.
Construction of the valve proceeds intracellularly over
about 1–2 h following cytokinesis within a large, purpose-
built lipid bilayer vesicle called the silica deposition vesicle.Within this vesicle, firstly, biosilica precipitates to form a
baselayer of microscale pores; then, subsidiary structures,
such as microscale interlocking fingers, form; finally, within
the microscale pores, biosilica precipitates to form the nano-
mesoscale pore occlusions [4]. Each daughter cell becomes
integral when the new valve is completed and putatively
exocytosed through the cell membrane; then new girdle
bands are added throughout the cell cycle. Silica for the frustule
is derived ultimately from monosilicic acid in the diatom’s
aquatic environment; it is sequestered actively by cell mem-
brane transporters called silica uptake transporters, then
processed intracellularly and delivered to the silica deposition
vesicle via unknown pathways. It is likely that the cells’ turgor
pressures bring about the primarily flat shape of the valves by
causing sibling valves to be pressed against one another.
Inspections of bulk parts of pore occlusions, i.e. parts
away from the boundaries of the microscale pores, suggest
a morphological scheme: blocked, porous, hexagonally
netted, convoluted netted, concentrically striped with cross-
bars, minutely nano-pored, or hierarchically occluded, e.g.
stripes occluded by nanopores (figure 2). All pore occlusions
on a valve belong to the same class—they all look the same;
moreover, class is inherited from mother to daughter cell (the
corresponding diatomist’s terminology is listed in figure 2).
In recent years, two whole diatom genomes have been
published [6–8], and a number of elegant studies have ident-
ified various organic molecules that are embedded within the
frustule (for a review, see [9]). Despite this progress, little is
established about how various molecular players interact
to determine this nano-mesoscale morphology, or about
how this morphology is prescribed by genetics. Experiments
are often very difficult to perform on diatoms, precisely
because of their tough exoskeletons.
So motivated, we introduce and analyse a model that
accounts for the following three well-established facts.
(1) Morphogenesis proceeds by biosilica precipitation reac-
tions, and these reactions occur only at the solid
biosilica/fluid solution interface that is being formed:
there is good microscopical evidence that silica precur-
sors nucleate a solid biosilica structure only upon
initiation of valve morphogenesis [3,4].
(2) Each class of pore occlusion features a characteristic
wavelength of 10–100 nm, defined by regions of solid
biosilica alternating with regions that are unoccluded
and presumably fluid. The model must feature at least
one tunable length-scale of order 10–100 nm.
(3) Because pore occlusion substructures are tiny, in some
cases approaching the macromolecular scale, the kinetics
of their formation is likely to be subject to continual fluc-
tuations. It is simplest to use a model that is probabilistic
and discrete, because fluctuations of a rescalable size are
then automatically built into the model.
The complexity of the chemical, electrostatic and mechan-
ical interactions involved in morphogenesis, and our present
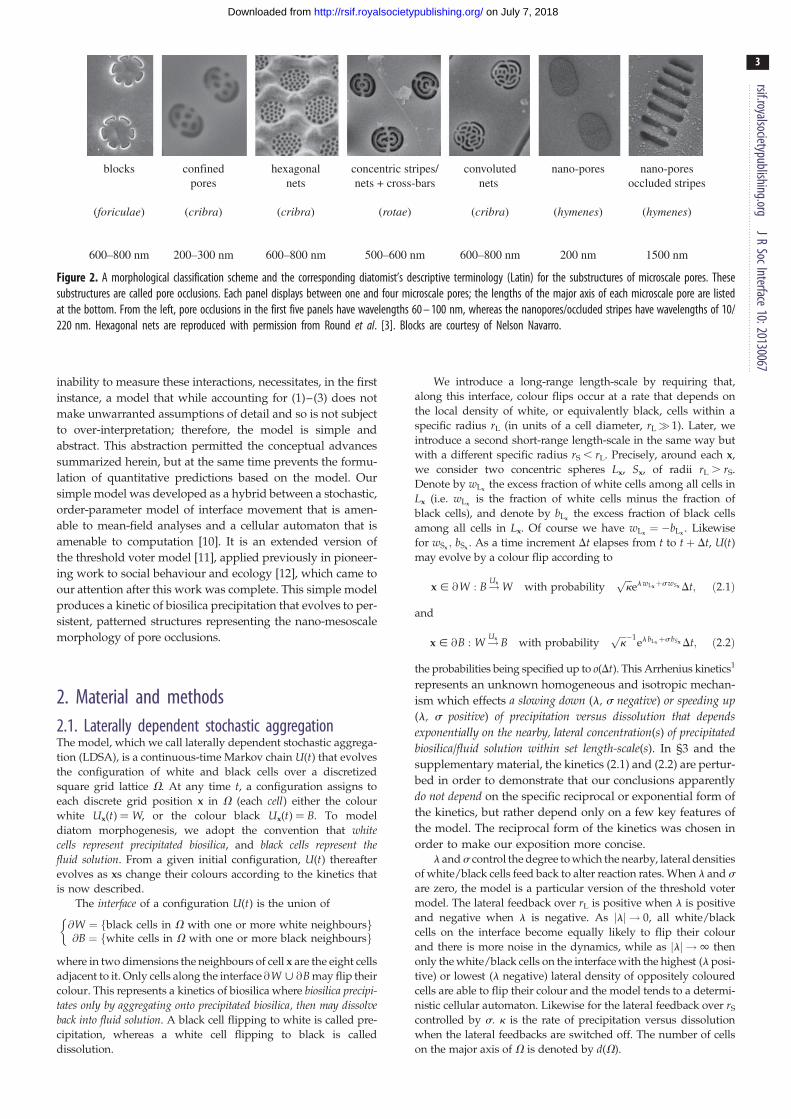
blocks
(foriculae)
600–800 nm
confinedpores
(cribra)
200–300 nm
hexagonalnets
(cribra)
600–800 nm
concentric stripes/nets + cross-bars
(rotae)
500–600 nm
convolutednets
(cribra)
600–800 nm
nano-pores
(hymenes)
200 nm
nano-poresoccluded stripes
(hymenes)
1500 nm
Figure 2. A morphological classification scheme and the corresponding diatomist’s descriptive terminology (Latin) for the substructures of microscale pores. Thesesubstructures are called pore occlusions. Each panel displays between one and four microscale pores; the lengths of the major axis of each microscale pore are listedat the bottom. From the left, pore occlusions in the first five panels have wavelengths 60 – 100 nm, whereas the nanopores/occluded stripes have wavelengths of 10/220 nm. Hexagonal nets are reproduced with permission from Round et al. [3]. Blocks are courtesy of Nelson Navarro.
rsif.royalsocietypublishing.orgJR
SocInterface10:20130067
3
on July 7, 2018http://rsif.royalsocietypublishing.org/Downloaded from
inability to measure these interactions, necessitates, in the first
instance, a model that while accounting for (1)–(3) does not
make unwarranted assumptions of detail and so is not subject
to over-interpretation; therefore, the model is simple and
abstract. This abstraction permitted the conceptual advances
summarized herein, but at the same time prevents the formu-
lation of quantitative predictions based on the model. Our
simple model was developed as a hybrid between a stochastic,
order-parameter model of interface movement that is amen-
able to mean-field analyses and a cellular automaton that is
amenable to computation [10]. It is an extended version of
the threshold voter model [11], applied previously in pioneer-
ing work to social behaviour and ecology [12], which came to
our attention after this work was complete. This simple model
produces a kinetic of biosilica precipitation that evolves to per-
sistent, patterned structures representing the nano-mesoscale
morphology of pore occlusions.
2. Material and methods2.1. Laterally dependent stochastic aggregationThe model, which we call laterally dependent stochastic aggrega-
tion (LDSA), is a continuous-time Markov chain U(t) that evolves
the configuration of white and black cells over a discretized
square grid lattice V. At any time t, a configuration assigns to
each discrete grid position x in V (each cell) either the colour
white Ux(t) ¼W, or the colour black Ux(t) ¼ B. To model
diatom morphogenesis, we adopt the convention that whitecells represent precipitated biosilica, and black cells represent thefluid solution. From a given initial configuration, U(t) thereafter
evolves as xs change their colours according to the kinetics that
is now described.
The interface of a configuration U(t) is the union of
@W ¼ fblack cells in V with one or more white neighboursg@B ¼ fwhite cells in V with one or more black neighboursg
�
where in two dimensions the neighbours of cell x are the eight cells
adjacent to it. Only cells along the interface @W < @B may flip their
colour. This represents a kinetics of biosilica where biosilica precipi-tates only by aggregating onto precipitated biosilica, then may dissolveback into fluid solution. A black cell flipping to white is called pre-
cipitation, whereas a white cell flipping to black is called
dissolution.
We introduce a long-range length-scale by requiring that,
along this interface, colour flips occur at a rate that depends on
the local density of white, or equivalently black, cells within a
specific radius rL (in units of a cell diameter, rL� 1). Later, we
introduce a second short-range length-scale in the same way but
with a different specific radius rS , rL. Precisely, around each x,
we consider two concentric spheres Lx, Sx, of radii rL . rS.
Denote by wLxthe excess fraction of white cells among all cells in
Lx (i.e. wLxis the fraction of white cells minus the fraction of
black cells), and denote by bLxthe excess fraction of black cells
among all cells in Lx. Of course we have wLx¼ �bLx
. Likewise
for wSx; bSx
. As a time increment Dt elapses from t to t þ Dt, U(t)may evolve by a colour flip according to
x [ @W : B!Ux W with probabilityffiffiffikp
elwLxþswSx Dt; ð2:1Þ
and
x [ @B : W!Ux B with probabilityffiffiffikp �1
el bLxþs bSx Dt; ð2:2Þ
the probabilities being specified up to o(Dt). This Arrhenius kinetics1
represents an unknown homogeneous and isotropic mechan-
ism which effects a slowing down (l, s negative) or speeding up(l, s positive) of precipitation versus dissolution that dependsexponentially on the nearby, lateral concentration(s) of precipitatedbiosilica/fluid solution within set length-scale(s). In §3 and the
supplementary material, the kinetics (2.1) and (2.2) are pertur-
bed in order to demonstrate that our conclusions apparently
do not depend on the specific reciprocal or exponential form of
the kinetics, but rather depend only on a few key features of
the model. The reciprocal form of the kinetics was chosen in
order to make our exposition more concise.l ands control the degree to which the nearby, lateral densities
of white/black cells feed back to alter reaction rates. When l and s
are zero, the model is a particular version of the threshold voter
model. The lateral feedback over rL is positive when l is positive
and negative when l is negative. As jlj ! 0, all white/black
cells on the interface become equally likely to flip their colour
and there is more noise in the dynamics, while as jlj !1 then
only the white/black cells on the interface with the highest (l posi-
tive) or lowest (l negative) lateral density of oppositely coloured
cells are able to flip their colour and the model tends to a determi-
nistic cellular automaton. Likewise for the lateral feedback over rS
controlled by s. k is the rate of precipitation versus dissolution
when the lateral feedbacks are switched off. The number of cells
on the major axis of V is denoted by d(V).
rsif.royalsocietypublishing.orgJR
SocInterface10:20130067
4
on July 7, 2018http://rsif.royalsocietypublishing.org/Downloaded from
At time t ¼ 0, the cells inside V have colours that are indepen-
dent and identically distributed, taking value W with probability
pV—the colour of each cell is determined by a coin toss that is
biased when pV= 1=2: This constitutes the initial condition, the
configuration U(0), which ensures that initially the colours of
different cells are uncoupled. For the cells x outside V, their col-
ours are prescribed at time t ¼ 0 and thereafter remain fixed
for all t . 0; these permanently coloured cells constitute the
boundary condition. The colour prescriptions for different x’s out-
side of V are independent and identically distributed, taking
value W with probability pV=.
2.2. SimulationsLDSA was simulated by an algorithm that requires no finite time-
step approximation.2 This algorithm is commonly known as
the Gillespie algorithm (see [13]). Simulations run until time
T when the ergodic mean of the fraction of cells in V that
are white no longer changes beyond the admissible error
e � 1025. In all simulations, the kinetics have approximately
converged to a time-invariant attractor by time T; this hap-
pens in a computationally efficient and reproducible
manner (see the electronic supplementary material). In all
figures, cells outside of V that set the boundary condition
are coloured grey; white cells are coloured light grey and
black cells are coloured dark grey. In an attempt to emphasize
visually the distribution of stochastic activity, white cells
along the interface (@B in the model) are coloured blue
(online version) or grey (printed version).A useful check on the simulation is to set parameters k ¼ 1
and pV ¼ pV=¼ 1=2; which produces kinetics that is statistically
invariant under W$ B inversion ((2.1) and (2.2) appear identical
when white cells are swapped with black cells). Spot-checks
where d(V), rL, and rS � 2 were simultaneously rescaled had no
qualitative effect on the simulations, indicating that the aniso-
tropy of the square lattice does not influence the results as long
as rL and rS are considerably greater than 1.
2.3. Observational dataPore ultrastructure in a range of diatom taxa was studied by scan-
ning electron microscopy (Philips XL30) at the Natural History
Museum, London, after preparation by standard methods [14].
3. ResultsThe kinetics of LDSA invariably converges to macroscopically
time-invariant attractors. These attractors bifurcate as par-
ameters change as described by the phase diagrams below.
First, we examine the effect of the first lateral feedback alone,
then the effect of both lateral feedbacks. We present qualitative
descriptions of our computational findings rather than quanti-
tative statistics. The derivation of the corresponding mean-field
equation is mathematically rigorous (see the electronic
supplementary material).
3.1. Blocks, hexagonal nets and stripes from the firstlateral feedback
Figure 3a is the phase diagram for one sphere of lateral feed-
back (only l is switched on, while s ¼ 0). When k ¼ 1, a
strong positive lateral feedback (l� 1) produces bistable
attractors of a monochromatic block: with probability 1/2
all cells are white, otherwise all cells are black. A weak lateral
feedback (jlj � 1) produces homogeneous attractors that
have all cells fluctuating (at first this is surprising, because
there is an apparent irreversibility about the model owing
to the condition of interface movement, see the electronic
supplementary material). A strong negative lateral feedback
(l��1) produces striped attractors; decreasing l sharpens
the stripes. In figure 3b a worked example using an analogous
model in one-dimension illustrates this convergence to stripes
(see the caption of figure 3b). As k increases from 1, thereby
breaking the inversion symmetry of the reactions (i.e. (2.1)
and (2.2) change when white and black are swapped),
stripes/bistable attractors bifurcate to hexagonal nets/white
blocks.3 Increasing k further, the black regions of hexagonal
nets shrink in volume until eventually they disappear and
so hexagonal nets bifurcate to white blocks. In all simulations,
striped attractors have the wavelength 4rL/3.
The simple model with just one lateral negative feedback
produces kinetics that converge to persistent patterns of
either uniform block colour, or hexagonal nets, or stripes,
depending on the values of the parameters l and k.
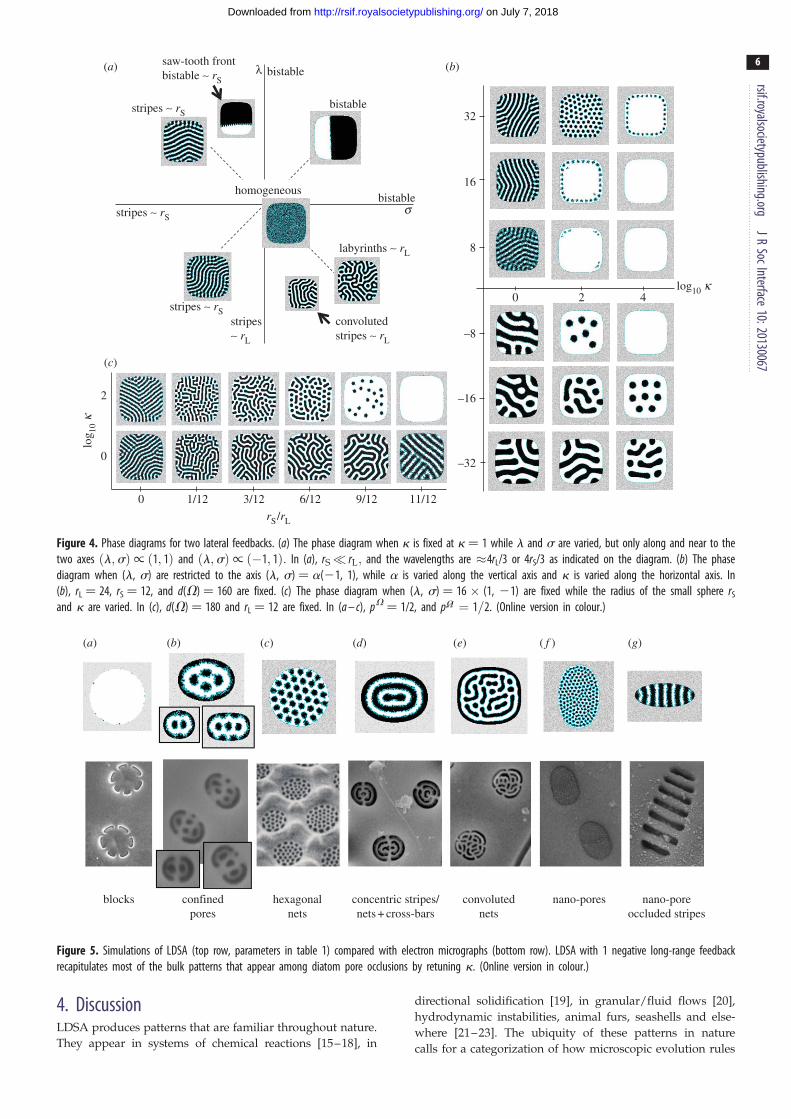
3.2. A second lateral feedback introduces labyrinthsFigure 4 shows the phase diagram for two spheres of lateral feed-
back (both l and s switched on). In figure 4a, k¼ 1. The phase
diagram for one sphere is recovered along either the vertical or
the horizontal axis. Along the axis ðl;sÞ/ ð1; 1Þ; where both
feedbacks are either positive or negative, no qualitatively new
attractor appears. A new attractor appears only when the two
feedbacks are of opposite sign and when the long-range feedback
is negative, ðl;sÞ/ ð�1; 1Þ—labyrinths appear. Figure 4b shows
k increasing from 1 while l and s are constrained to this axis;
labyrinths bifurcate to convoluted nets of pores. Figure 4c fixes
(l, s)¼ 16� (21, 1) to get labyrinths while rS is increased
from 0 up to rL. For rS� rL; the wavelength of the labyrinth is
again 4rL/3; this wavelength increases as rS! rL (figure 4c).
Introducing a second lateral feedback introduces labyr-
inth and convoluted porous net attractors. In domains for
which dðVÞ� 4rL=3; all phase diagrams are reproduced up
to patterns’ orientations, as both the boundary condition
pV= and the initial condition pV vary (see the electronic
supplementary material).
3.3. Recapitulating diatom pore occlusionsThe phase diagrams for one and two spheres of lateral feed-
backs reveal that most pore occlusion morphologies can be
recapitulated by LDSA with one lateral negative feedback
plus, in some cases, a short-range positive feedback.
In figure 5a–e, all pore occlusions (bottom row) have
wavelengths of between 60 and 100 nm. In the corresponding
simulations (top row), the number of cells on the major axis
d(V) was set so that the diameter of one cell corresponds to
a length equal to or exceeding 2.5 nm. The geometry and
d(V) were matched approximately to each pore occlusion in
turn, then, while the lateral negative feedback was fixed at
l ¼ 216 and rL was fixed at 18 (14 in figure 5e) to produce
wavelengths in excess of 2.5 � 4 � 18/3 � 60 nm, the precipi-
tation versus dissolution rate (k) was reduced (table 1).
Figure 5b shows pore occlusions of Achnanthes coarctata. The
diameter and the geometry of these pore occlusions can
vary over the valve; concomitantly the pores alter their con-
figurations (insets of figure 5b, bottom row). Remarkably,
the model approximately mimics these changing configur-
ations as d(V) and the geometry varied in the simulations

l
32
(a) (b)
8
–16
–32
–8
0 4 8
16
0 0 0
initial condition
stable attractor
gL-range of a lateral negative feedback,
0 0 0 0 0 0 0 0 0 0 0 0 0 0
0 0 2 –2 2 –2 0 –2 2 –2 2 0 0 0 0 0 0
–2 2 0 2 0 0 2 0 2 –2 2 0 0 0 0 0 0
–2 2 0 2 0 2 4 2 0 2 0 2 –2 2 0 0 0
–2 2 0 2 0 2 4 2 2 4 2 0 2 0 2 –2 2
4 2 2 4 2 2 4 2 2 4 2 2 4 2 2 4 2
4 2 2 4 4 0 2 0 –2 6 4 0 2 2 2 4 2
l < 0.
log10
k
Figure 3. (a) The phase diagram for one lateral feedback: simulations (small panels) illustrate how macroscopically time-invariant attractors change as l and k are variedas indicated on the axes. In all simulations, the other parameters are fixed at rL ¼ 16, d(V) ¼ 160, pV ¼ 1/2 and pV
=¼ 1=2: (b) A worked example in onedimension to help understand the convergence to striped attractors when there is one lateral negative feedback and when k ¼ 1. The number above each cell isthe number of neighbours of opposite colour minus the number of neighbours of the same colour within the range rL ¼ 4. As long as a cell is on the interface(non-interface cells are marked by ‘X’s and do not change colour), this number determines the average time until the cell changes its colour (see reactions (2.1)and (2.2)); because the lateral feedback is negative, the smaller the number, the quicker the change. From top to bottom, the diagram follows a succession of themost likely colour changes, and it converges from a macroscopically homogeneous attractor to a stable, striped attractor with wavelength 4rL/3. (Online version in colour.)
rsif.royalsocietypublishing.orgJR
SocInterface10:20130067
5
on July 7, 2018http://rsif.royalsocietypublishing.org/Downloaded from
(insets of figure 5b, top row). A positive lateral feedback with
rS� rL was introduced in order to reproduce the convoluted
net morphology (figure 5e). In figure 5f/5g, the pore occlu-
sions have wavelengths of 10/220 nm; in these simulations,
d(V) was set so that the diameter of one cell corresponds
to 1.3/9.4 nm, and the lateral negative feedbacks were
l ¼ 216, rL ¼ 7/l ¼ 216, rL¼ 22 to produce wavelengths of
11 nm/260 nm. (In order to draw out the similarity between
LDSA and electron micrographs, in some simulations, the
boundary condition pV=was also retuned.)
The model cannot reproduce the crossbars characterizing
rotae (figure 5d) or nanopores nested within stripes (figure 5g).
Neither does the model reproducibly recapitulate the strands
of silica at the perimeter of the pore occlusions that connect the
pore occlusions to the main body of the valve: the connectedness
of the valve is not recapitulated.
3.4. Phase diagrams are determined by only a few keyfeatures of LDSA
Time-invariant patterned attractors must have reactions (2.1)
B!W and (2.2) W! B happening at equal rates along
interfaces @W < @B: This gets the mean-field approximation
lwLxþ swSx
� � ln k
2for all x on @W < @B: ð3:1Þ
(A derivation from mean-field evolution equations is sup-
plied in the electronic supplementary material.) When k ¼ 1,
s ¼ 0: wLx� 0; l ¼�s: wLx
� wSx
for all x on @W < @B:
Straight interfaces (stripes) satisfy the approximation for
one sphere (s ¼ 0), whereas interfaces that are curved every-
where (labyrinths) satisfy the approximation for two spheres
and l ¼ 2s. For one lateral negative feedback (l�� 1, s ¼
0), the fraction of white cells wLxincreases as k increases or as
l decreases (figure 3); hexagonal nets bifurcate to white
blocks when, according to (3.1), wLxreaches its upper
bound wLx� 1; equivalently k � e22l (see the electronic
supplementary material).
We see how the correspondence between parameters and
macroscopic time-invariant patterns can be anticipated by
inspecting this simple mean-field approximation. The derivation
of (3.1) uses only the key assumptions of interface movement
and of isotropic lateral feedbacks affecting reaction rates; this
indicates that the reciprocal form of reaction rates (2.1) and
(2.2) is an inessential restriction on the model. Indeed, further
simulations indicate that when the model is perturbed, phase
diagrams remain qualitatively unchanged so long as these two
key assumptions are retained (see the electronic supplementary
material): our results are robust against such perturbations.
32
saw-tooth frontbistable ~ rS
l(a)
(c)
(b)
–16
–32
2
0
0 1/12 3/12 6/12 9/12 11/12
–8
0 2 4
16
8
log10 k
log 10
k
stripes ~ rS
stripes ~ rS
stripes ~ rS
labyrinths ~ rL
bistable
bistable
bistablehomogeneous
s
convolutedstripes ~ rL
stripes ~ rL
rS/rL
Figure 4. Phase diagrams for two lateral feedbacks. (a) The phase diagram when k is fixed at k ¼ 1 while l and s are varied, but only along and near to thetwo axes ðl;sÞ/ ð1; 1Þ and ðl;sÞ/ ð�1; 1Þ: In (a), rS� rL; and the wavelengths are �4rL/3 or 4rS/3 as indicated on the diagram. (b) The phasediagram when (l, s) are restricted to the axis (l, s) ¼ a(21, 1), while a is varied along the vertical axis and k is varied along the horizontal axis. In(b), rL ¼ 24, rS ¼ 12, and d(V) ¼ 160 are fixed. (c) The phase diagram when (l, s) ¼ 16 � (1, 21) are fixed while the radius of the small sphere rS
and k are varied. In (c), d(V) ¼ 180 and rL ¼ 12 are fixed. In (a – c), pV ¼ 1/2, and pV
=¼ 1=2. (Online version in colour.)
blocks
(a) (b) (c) (d) (e) ( f ) (g)
confinedpores
hexagonalnets
convolutednets
nano-pores nano-poreoccluded stripes
concentric stripes/nets + cross-bars
Figure 5. Simulations of LDSA (top row, parameters in table 1) compared with electron micrographs (bottom row). LDSA with 1 negative long-range feedbackrecapitulates most of the bulk patterns that appear among diatom pore occlusions by retuning k. (Online version in colour.)
rsif.royalsocietypublishing.orgJR
SocInterface10:20130067
6
on July 7, 2018http://rsif.royalsocietypublishing.org/Downloaded from
4. DiscussionLDSA produces patterns that are familiar throughout nature.
They appear in systems of chemical reactions [15–18], in
directional solidification [19], in granular/fluid flows [20],
hydrodynamic instabilities, animal furs, seashells and else-
where [21–23]. The ubiquity of these patterns in nature
calls for a categorization of how microscopic evolution rules
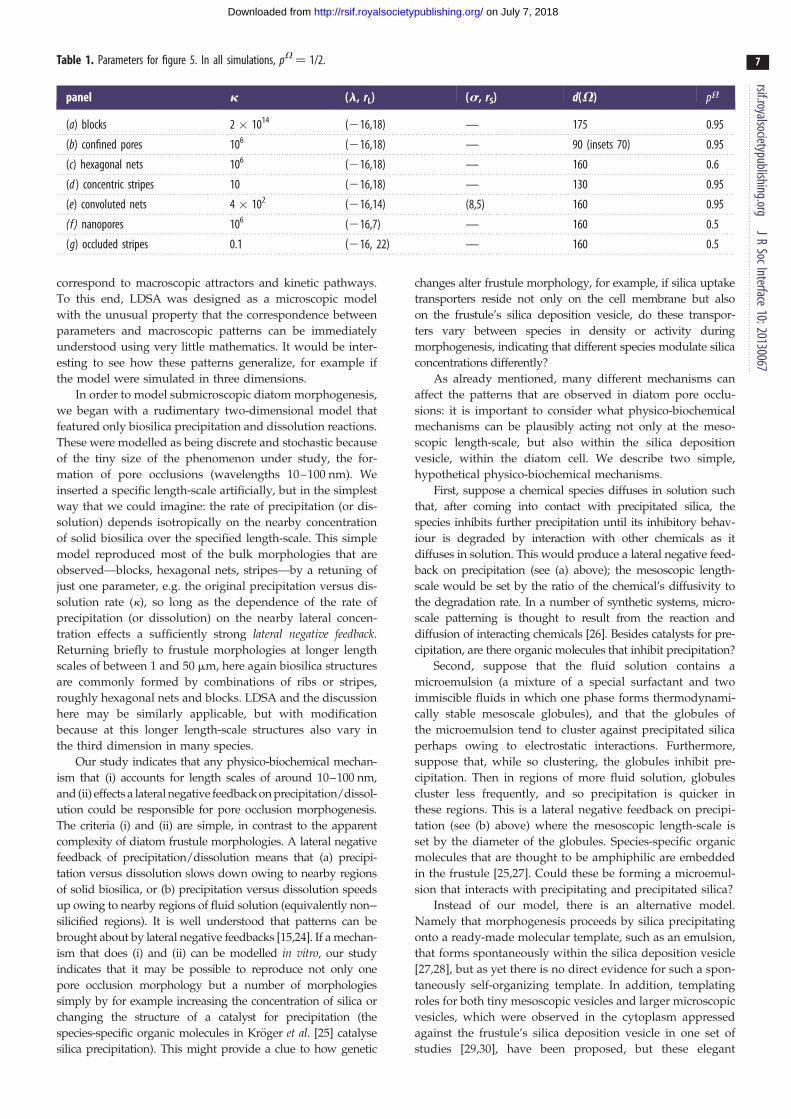
Table 1. Parameters for figure 5. In all simulations, pV ¼ 1/2.
panel k (l, rL) (s, rS) d(V) pV
=
(a) blocks 2 � 1014 (216,18) — 175 0.95
(b) confined pores 106 (216,18) — 90 (insets 70) 0.95
(c) hexagonal nets 106 (216,18) — 160 0.6
(d ) concentric stripes 10 (216,18) — 130 0.95
(e) convoluted nets 4 � 102 (216,14) (8,5) 160 0.95
(f ) nanopores 106 (216,7) — 160 0.5
(g) occluded stripes 0.1 (216, 22) — 160 0.5
rsif.royalsocietypublishing.orgJR
SocInterface10:20130067
7
on July 7, 2018http://rsif.royalsocietypublishing.org/Downloaded from
correspond to macroscopic attractors and kinetic pathways.
To this end, LDSA was designed as a microscopic model
with the unusual property that the correspondence between
parameters and macroscopic patterns can be immediately
understood using very little mathematics. It would be inter-
esting to see how these patterns generalize, for example if
the model were simulated in three dimensions.
In order to model submicroscopic diatom morphogenesis,
we began with a rudimentary two-dimensional model that
featured only biosilica precipitation and dissolution reactions.
These were modelled as being discrete and stochastic because
of the tiny size of the phenomenon under study, the for-
mation of pore occlusions (wavelengths 10–100 nm). We
inserted a specific length-scale artificially, but in the simplest
way that we could imagine: the rate of precipitation (or dis-
solution) depends isotropically on the nearby concentration
of solid biosilica over the specified length-scale. This simple
model reproduced most of the bulk morphologies that are
observed—blocks, hexagonal nets, stripes—by a retuning of
just one parameter, e.g. the original precipitation versus dis-
solution rate (k), so long as the dependence of the rate of
precipitation (or dissolution) on the nearby lateral concen-
tration effects a sufficiently strong lateral negative feedback.
Returning briefly to frustule morphologies at longer length
scales of between 1 and 50 mm, here again biosilica structures
are commonly formed by combinations of ribs or stripes,
roughly hexagonal nets and blocks. LDSA and the discussion
here may be similarly applicable, but with modification
because at this longer length-scale structures also vary in
the third dimension in many species.
Our study indicates that any physico-biochemical mechan-
ism that (i) accounts for length scales of around 10–100 nm,
and (ii) effects a lateral negative feedback on precipitation/dissol-
ution could be responsible for pore occlusion morphogenesis.
The criteria (i) and (ii) are simple, in contrast to the apparent
complexity of diatom frustule morphologies. A lateral negative
feedback of precipitation/dissolution means that (a) precipi-
tation versus dissolution slows down owing to nearby regions
of solid biosilica, or (b) precipitation versus dissolution speeds
up owing to nearby regions of fluid solution (equivalently non--
silicified regions). It is well understood that patterns can be
brought about by lateral negative feedbacks [15,24]. If a mechan-
ism that does (i) and (ii) can be modelled in vitro, our study
indicates that it may be possible to reproduce not only one
pore occlusion morphology but a number of morphologies
simply by for example increasing the concentration of silica or
changing the structure of a catalyst for precipitation (the
species-specific organic molecules in Kroger et al. [25] catalyse
silica precipitation). This might provide a clue to how genetic
changes alter frustule morphology, for example, if silica uptake
transporters reside not only on the cell membrane but also
on the frustule’s silica deposition vesicle, do these transpor-
ters vary between species in density or activity during
morphogenesis, indicating that different species modulate silica
concentrations differently?
As already mentioned, many different mechanisms can
affect the patterns that are observed in diatom pore occlu-
sions: it is important to consider what physico-biochemical
mechanisms can be plausibly acting not only at the meso-
scopic length-scale, but also within the silica deposition
vesicle, within the diatom cell. We describe two simple,
hypothetical physico-biochemical mechanisms.
First, suppose a chemical species diffuses in solution such
that, after coming into contact with precipitated silica, the
species inhibits further precipitation until its inhibitory behav-
iour is degraded by interaction with other chemicals as it
diffuses in solution. This would produce a lateral negative feed-
back on precipitation (see (a) above); the mesoscopic length-
scale would be set by the ratio of the chemical’s diffusivity to
the degradation rate. In a number of synthetic systems, micro-
scale patterning is thought to result from the reaction and
diffusion of interacting chemicals [26]. Besides catalysts for pre-
cipitation, are there organic molecules that inhibit precipitation?
Second, suppose that the fluid solution contains a
microemulsion (a mixture of a special surfactant and two
immiscible fluids in which one phase forms thermodynami-
cally stable mesoscale globules), and that the globules of
the microemulsion tend to cluster against precipitated silica
perhaps owing to electrostatic interactions. Furthermore,
suppose that, while so clustering, the globules inhibit pre-
cipitation. Then in regions of more fluid solution, globules
cluster less frequently, and so precipitation is quicker in
these regions. This is a lateral negative feedback on precipi-
tation (see (b) above) where the mesoscopic length-scale is
set by the diameter of the globules. Species-specific organic
molecules that are thought to be amphiphilic are embedded
in the frustule [25,27]. Could these be forming a microemul-
sion that interacts with precipitating and precipitated silica?
Instead of our model, there is an alternative model.
Namely that morphogenesis proceeds by silica precipitating
onto a ready-made molecular template, such as an emulsion,
that forms spontaneously within the silica deposition vesicle
[27,28], but as yet there is no direct evidence for such a spon-
taneously self-organizing template. In addition, templating
roles for both tiny mesoscopic vesicles and larger microscopic
vesicles, which were observed in the cytoplasm appressed
against the frustule’s silica deposition vesicle in one set of
studies [29,30], have been proposed, but these elegant

rsif.royalsocietypublishing.orgJR
SocInterface10:20130067
8
on July 7, 2018http://rsif.royalsocietypublishing.org/Downloaded from
ultrastructural studies have not yet been repeated, and there
is no theory to account for how these vesicles organize into
a precise pattern. Polymer networks of protein and polysac-
charide are known to be embedded in the frustules at least
of some species [31,32]. Because some pore occlusions look
as if biosilica has precipitated onto networks of polymeric
filaments (not shown), it is possible that networked filaments
are important for morphogenesis in all diatoms; in particular,
they may help to maintain the connectedness of the valve, a
feature that our simple model does not a priori recapitulate.
In conclusion, we propose three challenging questions,
answers to which could constitute major advances in under-
standing this diatom microscopic morphogenesis: (i) Can a
mechanism of lateral negative feedback on precipitation/
dissolution be identified at the length-scale of around
10–100 nm? (ii) At the length-scale of 1 mm? (iii) How does
the cell control the sequence in which these mechanisms are
brought into effect, producing the morphogenetic sequence
of frustule formation that was outlined in §1? Perhaps
another simple model that recapitulates the spatially hier-
archical patterns observed in frustules, rather than only the
submicroscopic patterns, would be instructive to pursue (3.1).
Thomas Duke approved the penultimate version of this manuscript,excluding the discussion, before his death in June 2012. L.W. remainsdeeply indebted to Tom Duke and deeply affected by his intellectualgenerosity. We thank Nelson Navarro for providing SEM micro-graphs, and the EMMA Unit at London’s Natural History Museumfor technical support. We are especially grateful to Michael Cohen,
Chiu Fan Lee and L. Mahadevan’s group for helpful discussions,and to Tadashi Tokieda for valuable feedback on a draft manuscript.This work was supported by an EPSRC fellowship awarded to L.W.
Endnotes1Continuous-time Markov chains are commonly used to model net-works of chemical reactions where, owing to activation energies,chemicals typically interact many times before finally reacting withone another. So LDSA more ideally represents an aggregationphenomenon where precipitation and dissolution reaction rates arealso (i) limited by activation energies, and (ii) affected by a determi-nistic field of finite range that sets up quickly compared with thetimes between reactions. We chose to use a continuous-timeMarkov chain to model diatom morphogenesis because the chemicalreaction networks of precipitation and dissolution are not whollyknown and because it is a simple way to incorporate fluctuationsinto the model. The implicit assumptions (i) and (ii) are, we believe,unimportant for our conclusions.2For each colour configuration, the time until the next colour flip is expo-nentially distributed with mean 1/R, where R is the sum of all reactionrates; this exponential random variable is sampled to determine the timeof the next colour flip. The probability that cell x [ V is the next cell toflip its colour is x’s reaction rate divided by R; a random variable fromthe corresponding distribution is sampled to determine which cell flipsits colour. So, the algorithm evolves the dynamics by simulating tworandom variables for each successive colour flip and updating thecolour configuration and the time accordingly.3In reactions (2.1) and (2.2), reparametrizing k as its reciprocal isequivalent to swapping white with black, so phase diagrams areshown only for k � 1.
References
1. Anonymous. 1703 Two letters from a gentleman inthe country, relating to Mr. Leuwenhoecks letter inTransaction, No. 283. Phil. Trans. 23, 1494. (doi:10.1098/rstl.1702.0065)
2. D’Arcy WT. 1917 On growth and form. Cambridge,UK: Cambridge University Press.
3. Round FE, Crawford RA, Mann DG. 1990 Diatoms:biology and morphology of the genera. Cambridge,UK: Cambridge University Press.
4. Pickett-Heaps J, Schmid AM, Edgar LA. 1990 The cellbiology of diatom valve formation. In Progress inphycological research, vol. 7 (eds FE Round, DJChapman), pp. 1 – 169. Bristol, UK: Biopress Limited.
5. Cox EJ, Willis L, Bentley K. 2012 Integratedsimulation with experimentation is a powerful toolfor understanding diatom valve morphogenesis.Biosystems 109, 450 – 459. (doi:10.1016/j.biosystems.2012.05.012)
6. Bowler C et al. 2008 The Phaeodactylum genomereveals the evolutionary history of diatom genomes.Nature 456, 239 – 244. (doi:10.1038/nature07410)
7. Armbrust EV et al. 2004 The genome of the diatomThalassiosira pseudonana: ecology, evolution, andmetabolism. Science 306, 79 – 86. (doi:10.1126/science.1101156)
8. Mock T et al. 2008 Whole-genome expressionprofiling of the marine diatom Thalassiosirapseudonana identifies genes involved in siliconbioprocesses. Proc. Natl Acad. Sci. USA 105,1579 – 1584. (doi:10.1073/pnas.0707946105)
9. Kroger N, Poulsen N. 2008 Diatoms: from cellwall biogenesis to nanotechnology. Ann. Rev.Genet. 42, 83 – 107. (doi:10.1146/annurev.genet.41.110306.130109)
10. von Neumann J. 1966 Theory of self-reproducingautomata. Urbana, IL: University of Illinois Press.
11. Cox JT, Durrett R. 1991 Nonlinear voter models. InRandom walks, Brownian motion, and interactingparticle systems (ed. R Durrett, H Kesten). Boston,MA: Birkhauser.
12. Ehrlich PR, Levin SA. 2005 The evolution of norms.PLoS Biol. 3, e194. (doi:10.1371/journal.pbio.0030194)
13. Gillespie DT. 1976 General method for numericallysimulating the stochastic time evolution of coupledchemical reactions. J. Comp. Phys. 22, 403 – 434.(doi:10.1016/0021-9991(76)90041-3)
14. Cox EJ. 2006 Achnanthes sensu stricto belongs withgenera of the Mastogloiales rather than with othermonoraphid diatoms. Eur. J. Phycol. 41, 67 – 81.(doi:10.1080/09670260500491543)
15. Turing A. 1953 The chemical basis formorphogenesis. Phil. Trans. R. Soc. Lond. B 237,37 – 42. (doi:10.1098/rstb.1952.0012)
16. Lee KJ, McCormick WD, Ouyang Q, Swinney HL.1993 Pattern formation by interacting chemicalfronts. Science 261, 192 – 194. (doi:10.1126/science.261.5118.192)
17. Vanag VK, Epstein IR. 2001 Pattern formation in atunable medium: the Belousov – Zhabotinsky reaction
in an aerosol OT microemulsion. Phys. Rev. Lett. 87,673 – 681. (doi:10.1103/PhysRevLett.87.228301)
18. Bansagi T, Vanag VK, Epstein IR. 2011 Tomographyof reaction-diffusion microemulsions revealsthree-dimensional Turing patterns.Science 331, 1309 – 1312. (doi:10.1126/science.1200815)
19. Langer JS. 1980 Instabilities and pattern formationin crystal growth. Rev. Mod. Phys. 52, 1 – 27.(doi:10.1103/RevModPhys.52.1)
20. Sandnes B, Knudsen HA, Maløy KJ, Flekkøy EG. 2007Labyrinth patterns in confined granular-fluidsystems. Phys. Rev. Lett. 99, 038001. (doi:10.1103/PhysRevLett.99.038001)
21. Vanag VK, Epstein IR. 2009 Pattern formationmechanisms in reaction – diffusion systems.Int. J. Dev. Biol. 53, 228301. (doi:10.1387/ijdb.072484vv)
22. Ball P. 1999 The self-made tapestry. Oxford, UK:Oxford University Press.
23. Cross M, Greenside H. 2009 Pattern formation anddynamics in nonequilibrium systems. Cambridge, UK:Cambridge University Press.
24. Koch AJ, Meinhardt H. 1994 Biological patternformation: from basic mechanisms to complexstructures. Rev. Mod. Phys. 66, 1481 – 1507. (doi:10.1103/RevModPhys.66.1481)
25. Kroger N, Deutzmann R, Bergsdorf C, Sumper M.2000 Species-specific polyamines from diatomscontrol silica morphology. Proc. Natl Acad.

rsif.royalsocietypublishing.org
9
on July 7, 2018http://rsif.royalsocietypublishing.org/Downloaded from
Sci. USA 97, 14 133 – 14 138. (doi:10.1073/pnas.260496497)
26. Mann S. 2009 Self-assembly and transformationof hybrid nano-objects and nanostructuresunder equilibrium and non-equilibriumconditions. Nat. Mat. 8, 781 – 792. (doi:10.1038/nmat2496)
27. Sumper M. 2002 A phase separation model for thenanopatterning of diatom biosilica. Science 295,2430 – 2433. (doi:10.1126/science.1070026)
28. Lenoci L, Camp PJ. 2008 Diatom structurestemplated by phase-separated fluids. Langmuir 24,217 – 223. (doi:10.1021/la702278f )
29. Schmid AM, Schultz D. 1979 Wall morphogenesis indiatoms: deposition of silica by cytoplasmic vesicles.Protoplasma 100, 267 – 288. (doi:10.1007/BF01279316)
30. Schmid AM. 1994 Aspects of morphogenesis andfunction of diatom cell walls with implications fortaxonomy. Protoplasma 181, 43 – 60. (doi:10.1007/BF01666388)
31. Brunner E, Richthammer P, Ehrlich H, Paasch S,Simon P, Ueberlein S, van Pee KH. 2009 Chitin-based organic networks: an integral part of cell wallbiosilica in the diatom Thalassiosira pseudonana.Angew. Chem. Int. Ed. 48, 9724 – 9727. (doi:10.1002/anie.200905028)
32. Scheffel A, Poulsen N, Shian S, Kroger N. 2011Nanopatterned protein microrings from a diatom thatdirect silica morphogenesis. Proc. Natl Acad. Sci. USA108, 3175 – 3180. (doi:10.1073/pnas.1012842108)
J
RSocInterface10:20130067