Embed Size (px)
Citation preview

Proceedings of the International Conference on Industrial Engineering and Operations Management
Bandung, Indonesia, March 6-8, 2018
© IEOM Society International
A Simulation Approach for Determining Delivery Time
in a Waste Materials Based Make-To-Order
Manufacturing Company
Nur Indrianti Department of Industrial Engineering
Universitas Pembangunan Nasional “Veteran” Yogyakarta
Yogyakarta, Indonesia
Bachtiar Rakagandhi Department of Industrial Engineering
Universitas Pembangunan Nasional “Veteran” Yogyakarta
Yogyakarta, Indonesia
Tri Wibawa Department of Industrial Engineering
Universitas Pembangunan Nasional “Veteran” Yogyakarta
Yogyakarta, Indonesia
Abstract
This study aims to determine delivery time of a set of customer orders in a repetitive make-to-order
(MTO) manufacturing company that utilizes recycled waste products as raw materials. A simulation
approach and flow-shop dispatching rules are applied to find minimum total flow time or makespan
taking materials supply uncertainties into account which is then used to determine the delivery time of
each order. As an industrial case study we consider a small medium repetitive MTO company that
produces multiple products from plastic waste. The result of the study shows that in a flow-shop
manufacturing system with probabilistic arrival time and quantity of materials shortest processing time
rule does not always result in minimum makespan.
Keywords
make-to-order, recycled materials, flow-shop, delivery time, simulation
1. Introduction
Sustainable development is described as “development that meets the needs of the present without compromising the
ability of future generations to meet their own needs” (WECD, 1987). The strategy to achieve the goal of sustainable
development in the industrial sector is sustainable manufacturing. It can be implemented by closing the loop of
product lifecycle by utilizing industrial waste streams as alternative sources of other needed material. In this regard,
industry has a responsibility to provide sustainable goods by using waste materials, which can lead to technically and
economically competitive products.
Closed material cycle can reduce the use of virgin materials as resource inputs and reduce the volume of waste
products requiring disposal. However, in practice the utilization of waste materials is limited by several factors. The
factors include waste collection and transportation, the scale of the business, the industrial sector in which the
company operates, the amount and type of waste produced, environmental regulations, and the level of development
within a particular country (Linton et al., 2007).
1878

Proceedings of the International Conference on Industrial Engineering and Operations Management
Bandung, Indonesia, March 6-8, 2018
© IEOM Society International
Waste collection and transportation can bring about the issues on the uncertainty associated with the recovery
process with regards to quality, quantity, and timing of returned products (Corbett and Klassen, 2006). The
uncertainties will indeed noteworthy in the production planning and control activities. Likewise, uncertainty is very
important concern in make-to-order (MTO) company since it complicate the estimation of production lead time.
In MTO situation, manufacturing activities are based on the order received. There are two situations of MTO system
i.e. repetitive and nonrepetitive. In nonrepetitive MTO systems, orders are treated as new jobs which have not been
done previously so they require manufacturing engineering including design and process planning. While in
repetitive MTO system orders are not treated as new jobs as they are produced repetitively, so there is no
requirement of new design.
Competitive keys of MTO manufacturing system include technical ability, delivery time, and price. Consequently,
aside from price and product design, meeting customer’s demand within shortest time becomes an important issue in
MTO system. When receiving orders from a customer, MTO company offers price and delivery time. The orders
will be executed if the customer agrees with the proposed price and delivery time. Delivery of orders exceeding the
promised delivery time may cause penalty to the company. Therefore, MTO company must able to estimate order
manufacturing lead time accurately.
Manufacturing lead-time (MLT) is defined as time between the arrival time of material used for product
development and product completion time (Chang et al., 1998). It is made up of material handling and non-
production (wait or queue) time as well as real production activities (Turbide, 2016). From a customer perspective,
lead time can be translated into delivery time. It is affected by many factors including capacity, loading, batching
and scheduling, and themselves affect many aspects of costs, and control (Mourtzis et al., 2014). As supply
uncertainties influences production planning and scheduling, it will indeed have an effect on MLT. Moreover, waste
materials may pass through several stages of process including cleaning operation. Variability in the condition of the
materials may increase the accuracy problem of the estimation of production lead time. Therefore, developing
methodologies for feasible, robust, and optimal process scheduling under uncertainty is necessary (Li and
Ierapetritou, 2008).
Various methods have been proposed for the estimation of lead time (Mourtzis et al., 2014) such as simulation
(Chryssolouris et al., 2008) queuing theory (Karmarkar, 1993), logistic operating curves (Nyhuis et al., 2005),
statistics (Cheng and Duran, 2004), stochastic analysis (Wiendhal and Toenshoff, 1988), artificial intelligent
methods (Negnevitsky, 2005) and hybrid methods (Rao and Gu, 1994). While the previous works concerned with
discrete MTS manufacturing lead time with deterministic materials supply, this study is intended to determine
production lead time in a repetitive MTO situation, in particular processing industry, where they use recycled waste
products as raw materials. In contrast to (Indrianti and Toha, 2006) that developed analytical MLT model for
nonrepetitive MTO with single order, this study deals with simulation model for repetitive MTO where recycled
materials are used to produce multi products.
The contents of the paper are organized as follows. Section 2 explains manufacturing with recycled materials. In
Section 3 we explain the methodology of the study. Section 4 explores industrial case study while the results of the
study is discussed in Section 5. Conclusions and directions for further research are summarized in Section 6.
2. Manufacturing with Recycled Materials
Inverse manufacturing and reverse logistics have been developed as strategies to close the loop of product lifecycle.
Inverse manufacturing is developed based on the concept of prolonging the life of a product and its constituent
components. In addition, reverse logistics is developed based on the concept that manufacturers are forever
responsible for their products. The implementation of the strategies involves recycling and remanufacturing
products.
Recycling can be defined as the process of converting waste materials into reusable materials. Meanwhile, a
remanufacturing process rebuilds a unit or machinery to restore its condition to as “good as new” (European
Commission, 1998).
In remanufacturing company, Guide (2000) clearly stated that there are seven characteristics that significantly
complicate production planning and control activities. Those include the uncertain timing and quantity of returns;
1879

Proceedings of the International Conference on Industrial Engineering and Operations Management
Bandung, Indonesia, March 6-8, 2018
© IEOM Society International
the need to balance returns with demands; the disassembly of returned products; the uncertainty in materials
recovered from returned items; the requirement for a reverse logistics network that concerns with how products are
collected from the end user and returned to a facility for repair, remanufacturing or recycling; the complication of
material matching restrictions; and the problems of stochastic routings for materials for remanufacturing operations
and highly variable processing times.
Furthermore, Guide (2000) described that uncertainty in the timing and quality of returns is a reflection of the
uncertain nature of the life of a product and technological change. Whereas the product returns process is highly
uncertain with respect to timing depending on the cores available for remanufacturing both in terms of quantity and
quality. So it is necessary that core availability be forecast for planning purposes, for both quantities available and
the timing of availability.
In remanufacturing systems the uncertainty of the quality level of recycled products will affect the recycling rate, the
buyback, cost, and remanufacturing cost. If the quality level of recycled products is very low, then the recycling rate
will be high and the buyback cost will be low. This situation motivated (Guo and Ya, 2015) to study the optimal
recycling production strategy considering the minimum quality level of the recycled products in the manufacturing
and remanufacturing system. He concluded that the optimal manufacturing and remanufacturing strategy is to take
the reasonable arrangement of remanufacturing and manufacturing batch to reduce the average total cost.
3. Model and Methodology
This study deals with a repetitive MTO flow shop manufacturing system that produces multiple products with
recycle waste products as raw materials. All products are produced in the same serial machines with the same
processing sequence as shown in Figure 1. The problem is to determine production sequence so as to minimize
production lead time. With regards to Ioannou and Dimitriou (2012), lead time in this study represents the amount of
time allowed for orders to flow through the production facility and measured by the amount of completion time of
all jobs or makespan.
Figure 1. Production process diagram
Because the materials are recycled from almost the same type of product waste and there is no need for high
specification of the material, we assume that the quality of waste products is good enough and meets the requirement
of the materials so there is no disposal of the incoming materials. Order quantity of each product is known. Due to
the uncomplicated production process the processing time of each product at each work centre is assumed to be
known and deterministic. Recycling rate of waste materials is probabilistic in regard to the timing and quantity of
returns. The production process is started after materials are arrived and reach the quantity required. We used
simulation approach using Arena software to solve the problem.
The simulation model was built based on the following steps: (1) Description of the current production system, (2)
Description of the material structure of each product; (3) Data acquisition and analysis, including collecting data and
defining the probability distribution of each materials; (4) Development of simulation model, started from individual
production process followed by the entire process model that was built by combining the individual models; (5)
Running the simulation with dispatching or scheduling rules; and (6) Verification and validation.
4. Industrial Case Study
As a case study we consider a small medium MTO company located in Purwokerto, Central Java, Indonesia. The
company uses recycled plastic products as raw materials. We focus on three types of products which are often
Work center 1
Work center N
Material m1
Material m2
Material mK
Product p1
Product p2
Product pI
Work center 2
... ...
Scrap materials
Waste
Waste ...
Waste
1880
Proceedings of the International Conference on Industrial Engineering and Operations Management
Bandung, Indonesia, March 6-8, 2018
© IEOM Society International
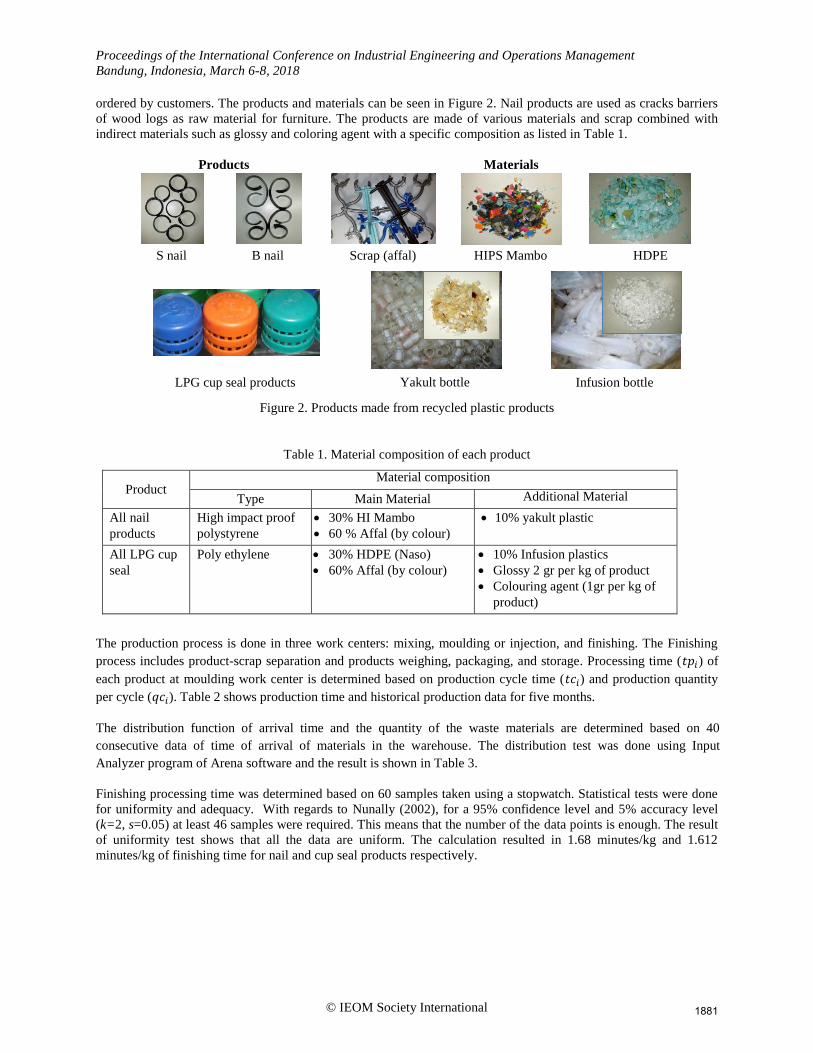
ordered by customers. The products and materials can be seen in Figure 2. Nail products are used as cracks barriers
of wood logs as raw material for furniture. The products are made of various materials and scrap combined with
indirect materials such as glossy and coloring agent with a specific composition as listed in Table 1.
Products Materials
S nail B nail Scrap (affal) HIPS Mambo HDPE
LPG cup seal products Yakult bottle Infusion bottle
Figure 2. Products made from recycled plastic products
Table 1. Material composition of each product
Product Material composition
Type Main Material Additional Material
All nail
products
High impact proof
polystyrene
30% HI Mambo
60 % Affal (by colour)
10% yakult plastic
All LPG cup
seal
Poly ethylene 30% HDPE (Naso)
60% Affal (by colour)
10% Infusion plastics
Glossy 2 gr per kg of product
Colouring agent (1gr per kg of
product)
The production process is done in three work centers: mixing, moulding or injection, and finishing. The Finishing
process includes product-scrap separation and products weighing, packaging, and storage. Processing time ( ) of
each product at moulding work center is determined based on production cycle time ( ) and production quantity
per cycle ( ). Table 2 shows production time and historical production data for five months.
The distribution function of arrival time and the quantity of the waste materials are determined based on 40
consecutive data of time of arrival of materials in the warehouse. The distribution test was done using Input
Analyzer program of Arena software and the result is shown in Table 3.
Finishing processing time was determined based on 60 samples taken using a stopwatch. Statistical tests were done
for uniformity and adequacy. With regards to Nunally (2002), for a 95% confidence level and 5% accuracy level
(k=2, s=0.05) at least 46 samples were required. This means that the number of the data points is enough. The result
of uniformity test shows that all the data are uniform. The calculation resulted in 1.68 minutes/kg and 1.612
minutes/kg of finishing time for nail and cup seal products respectively.
1881

Proceedings of the International Conference on Industrial Engineering and Operations Management
Bandung, Indonesia, March 6-8, 2018
© IEOM Society International
Table 2. Processing time and production quantity
Description
Processing time Monthly production
Mixing Moulding Month (kg)
(min)
(kg)
min/ kg
(min)
(kg)
min/kg 1 2 3 4 5
1 Black B nail 15 50 0.3 0,23 0.06 3.83 5511 294 0 2170 767
2 Black S nail 15 50 0.3 0.23 0.03 7.67 120 1870 275 24 2068
3 Green S nail 15 50 0.3 0.25 0.05 5.00 545 249 292 432 925
4 Green LPG cup seal 15 50 0.3 0.3 0.05 6.00 361 0 225 359 42
5 Red LPG cup seal 15 50 0.3 0.3 0.05 6.00 237 238 392 242 281
6 Silver LPG cup seal 15 50 0.3 0.3 0.05 6.00 464 153 164 492 76
7 Blue LPG cup seal 15 50 0.3 0.3 0.05 6.00 282 0 0 324 338
Table 3. Distribution function of material arrival time
Materials Distribution
Function Expression value
Description
1 HI mambo Beta -0.001 + 555 * BETA(0.324, 4.27)
2 HI white Exponential -0.001 + EXPO(64.5)
3 Black affal Exponential -0.001 + EXPO(31.2)
4 Red affal Weibull -0.001 + WEIB(17.2, 0.384)
5 Green affal Exponential -0.001 + EXPO(155)
6 Silver affal Exponential -0.001 + EXPO(70.9)
7 Blue affal Weibull -0.001 + WEIB(40.1, 0.365)
8 Naso Weibull -0.001 + WEIB(16.6, 0.32)
9 Yakult bottle Exponential -0.001 + EXPO(101)
10 Infusion bottle Exponential -0.001 + EXPO(87.7)
To execute the model, we considered the quantity of each ordered product as follows: 1220 kg of , 550 kg of ,
550 kg of , 900 kg of , 500 kg of , 350 kg of , and 150 kg of . The simulation model was initially
developed for individual products. For example, Figure 3 shows production process model for black B and S nail
products. As described in Table 1 all nail products use the same materials, which are HI mambo, black affal, and
yakult plastics.
As is shown in Fig 3, “Decide” module is based on “2-way by condition”, in which the production of black B or S
nail products depends on the priority. “Assign” module is for replacing and adding attribute value, i.e. “weight” and
“priority”. Production process for other products is composed using the same way as B and S products. After all
individual production process are composed, we then created model for the whole process.
The next step was a validation process which aimed to define if the simulation model behaves just like the actual
system. The validation process was done by comparing the number of products resulted from the simulation model
and real production. In this case we used Paired-t Confidence Interval (ProModel, 1998) with =0.05 and the
following hypothesis:
H0 : 1-2 = 0 (1)
H1 : 1-2 0 (2)
Table 4 shows the simulation result of the production of green S nail product for five months. Using 5% accuracy
level and 95% level of confidence, the number of data (n)=5, standard deviation (S)=125.23, and tn-1, /2 = 2.776
(from t Table), according to (Law and Kelton, 2000), the half width (hw) can be calculated as follows:
1882

Proceedings of the International Conference on Industrial Engineering and Operations Management
Bandung, Indonesia, March 6-8, 2018
© IEOM Society International
= 155.47 (3)
Figure 3. Production process model of B and S black nails
HI Mambo arrival
Assign HI Mambo
Decide 1
Batch mixing B Black Nail
Mixing process
Black Affal Arrival
Yakult arrival
Assign Black Affal
Assign Yakult Batch mixing S Nail
AssignMaterial 1
AssignMaterial 2
Separate 1 Mixing station
Molding process
Devided
Molding process 1
Routing
Finishing station
Finishing process
Separate
Batch 1Batch 2
Product 1Product 2
True
FalseScrap 50%
Original
True
False
FalseTrue
Molding process 2
The value of confident interval is calculated as follows:
(4)
(5)
Because 0 [CIb, CIa], Ho is accepted. It means that at 95% of confidence level the developed model is not different
from the real system. In other word, the simulation model is valid.
The next step was verification process. It was made with the purposes of detecting errors using the embedded
debugging tool of the software. Figure 4 shows the verification result.
Table 4. Validation result of green S nail product
Month Actual production (kg) Simulation result (kg) The difference
1 545 450 95
2 249 225 24
3 292 450 -158
4 432 450 -18
5 925 750 175
Average 23.6
Standard Deviation (S) 125.23
Variance 15682.3
Figure 4. Verification result
1883

Proceedings of the International Conference on Industrial Engineering and Operations Management
Bandung, Indonesia, March 6-8, 2018
© IEOM Society International
In this study we considered six flow shop dispatching rules, i.e. Shortest Processing Time (SPT), Longest Processing
Time (LPT), First Come First Serve (FCFS), and three random sequences. Jobs sequence of each rule are 7-6-3-5-2-
4-1 for SPT, 1-4-2-5-3-6-7 for LPT, 1-2-3-4-5-6 for FCFS, 3-2-1-5-4-6-7 for Random 1, 4-5-6-7-3-2-1 for Random
2, and 1-3-5-7-2-4-6 for Random 3.
To get good result, the simulation must be done in n replications. Initial run was done for green S nail product with 5
replications. The result is shown in Table 5. The minimum number of replications ( ) can be calculated as
follows (Law & Kelton, 2000)
(6)
(7)
We then tried some values for i as shown in Table 6. We can see from the table that the minimum number of
replication is 4. Thus replication used in the simulation is sufficient.
Table 5. Initial replication
i 1 2 3 4 5 Total Avg Conf.
level 95%
Simulation result Xi (kg) 450 225 450 450 750 2325 465 5%
a= (Xi – Avg) -15 -240 -15 -15 285 S2(n) 186.75
a2 225 57600 225 225 81225 139500 ’ 0.0476
Table 6. Calculation of replication
i i = 8 i = 7 i = 6 i = 5 i = 4 i = 3 i = 2 S2(n) 186.75
2.365 2.447 2.57 2.776 3.182 4.303 12.706 Average 465
0.0246 0.0272 0.0308 0.0365 0.0467 0.073 0.264
Simulation results for each dispatching rule can be seen in Table 7. It is shown that the Random 3 dispatching rule
resulted in minimum makespan or total flow time.
Table 7. Simulation results
Flow time (hours)
SPT LPT FCFS Random 1 Random 2 Random 3
1 105.13 87.91 87.87 93.18 105.13 87.91
2 97.06 94.43 93.13 92.55 99.60 97.69
3 60.15 65.85 62.78 58.40 62.31 59.95
4 216.75 213.91 211.12 213.98 214.29 217.39
5 125.25 123.22 125.80 123.22 125.09 119.65
6 197.20 204.85 204.94 204.80 192.51 211.78
7 175.98 193.37 193.05 193.09 179.96 173.38
Total 977.52 983.54 978.69 979.22 978.89 967.75
Average 139.65 140.51 139.81 139.89 139.84 138.25
5. Discussion We have developed a simulation model for determining production lead time in a repetitive single line process MTO
company that uses recycled waste materials to produce multiple products with probabilistic arrival time and quantity
of materials. The objective of the model is to determine jobs sequence so as to minimize makespan. The results
1884

Proceedings of the International Conference on Industrial Engineering and Operations Management
Bandung, Indonesia, March 6-8, 2018
© IEOM Society International
show that Random 3 dispatching rule generated minimum makespan, i.e. 967.75 hours or 40.32 days if the
production runs continuously (24 hours a day). The Random 3 rule executes the production based on the following
sequence: black B nail - green S nail – red cup seal – blue cup seal – black S nail - green cup seal – silver cup seal.
In flow shop serial machines, shortest processing time rule oftentimes results in minimum makespan and average
completion time. However, that situation does not happen in this case study. This is because the starting time of each
production is based on the probabilistic arrival time and quantity of the materials.
Flow time resulted from the simulation can be used to determine order delivery time. Figure 5 shows 24-hours
production schedule based on Random 3 dispatching rule. It can be seen that delivery time of each product offered
to the customer are: 4 days for black B nail, 7 days for green S nail, 12 days for red cup seal, 19 days for blue cup
seal, 23 days for black S nail, 32 days for green cup seal, and 41 days for silver cup seal.
Figure 5. Production schedule based on Random 3 dispatching rule
6. Conclusion The result of the study shows that simulation approach can be used to determine orders’ delivery time in a repetitive
flow-shop MTO manufacturing system that utilizes recycled waste products as raw materials. Unlike flow shop
manufacturing in which SPT rule oftentimes resulted in minimum makespan, in this study SPT rule did not arrive at
the minimum makespan. This is because the production will start just after the incoming materials are sufficient. The
simulation procedure used in this study can be applied in the order management phase when the company must
make offer of price and lead time for the order received.
Further research direction includes the situation with more dispatching rules and multi resources. Inventory costs
can be also taken into account when deciding production sequence.
References Chang, T.C., Wysk, R.A., and Wang, H.P., Computer Aided Manufacturing, Prentice Hall, New Jersey, 1998.
Cheng, L. and Duran, M.A., Logistics for world-wide crude oil transportation using discrete event simulation and
optimal control, Computers & Chemical Engineering, vol. 28, pp.897-911, 2004.
Chryssolouris, G., Mavrikios, D., Papakostas, N., Mourtzis, D., Michalos, G., and Georgoulias, K., Digital
manufacturing: history, perspectives and outlook, Proc. IMechE, Part B: J. Engineering Manufacture, vol. 223,
pp.451-462, 2009.
Corbett, C.J. and Klassen, R.D., Extending the horizons: environmental excellence as key to improving operations,
Manufacturing and Service Operations Management, vol. 8, pp. 5–22, 2006.
European Commission (1998) ‘The competitiveness of recycling industries’, Report prepared for the European
Commission, Directorate General for Industry, Brussels.
Guide Jr., V.D.R. (2000) ‘Production planning and control for remanufacturing: industry practice and research
needs’, Journal of Operations Management, Vol. 18, pp.467–483.
Guo, J. and Ya, G., Optimal strategies for manufacturing/remanufacturing system with the consideration of recycled
products, Computers & Industrial Engineering, vol. 89, pp.226–234, 2015
Indrianti, N. and Toha, I.S., A model of product manufacturing lead-time in a non repetitive make-to-order
manufacturing system, Jurnal Teknik Gelagar, vol. 17, pp.115-124, 2006.
Ioannou, G. and Dimitriou, S., Lead time estimation in MRP/ERP for make-to-order manufacturing systems, Int. J.
Production Economics, vol. 139, pp.551–563, 2012.
3 4 5 6 7 81 2 3029282726252423222120191817161514131211109 31
Black B nail (1)
Black S nail (2)
Green S nail (3)
Green cup seal (4)
Red cup seal (5)
Silver cup seal (6)
Blue cup seal (7) 7.2 days
8.8 days
2.5 days
5 days
4.1 days
9.1 days
3.7 days
Day
Pro
du
ct
41403938373635343332 42
1885

Proceedings of the International Conference on Industrial Engineering and Operations Management
Bandung, Indonesia, March 6-8, 2018
© IEOM Society International
Karmarkar, U.S., Manufacturing lead times, order release and capacity loading. In: Graves, S., Rinnooy Kan, A.,
and Zipkin, P. (eds): Logistics of Production an Inventory, Handbooks in Operations Research and
Management Science, vol. 4, pp. 287-329, North-Holland, Amsterdam, 1993.
Law, A.M. and Kelton, W.D., Simulation Modeling and Analysis, 760, Irwin/McGraw-Hill, New York, 2000.
Li, Z. and Ierapetritou, M., Process scheduling under uncertainty: Review and challenges, Computers & Chemical
Engineering, vol. 32, pp.715-727, 2008.
Linton, J.D., Klassen, R., and Jayaraman, J., Sustainable supply chains: An introduction, Journal of Operations
Management, vol. 25, pp.1075-1082, 2007.
Mourtzis, D., Doukas, M., Fragou, K., Efthymiou, K., and Matzorou, V., Knowledge-based estimation of
manufacturing lead time for complex engineered-to-order products, Procedia CIRP, vol. 17, pp.499–504, 2014.
Negnevitsky M., Artificial Intelligence: A guide to intelligent systems. Essex, 2nd Eds, Pearson Education, Adison
Wesley, England, 2005.
Nunally S.W., Construction Methods and Management, 5th
Eds, 549, Prentice Hall, Upper Saddle River, New
Jersey, 2002
Nyhuis, P., Cieminski, G., Fischer, A., and Feldmann, K., Applying Simulation and analytical models for logistic
performance prediction, CIRP Annals-Manufacturing Technology, vol. 54, pp.417-422, 2005.
ProModel, Stat::Fit User's Guide, Software Arena, 1998.
Rao, H.A. and Gu, P., Expert self-oganizing neural network for the design of cellular manufacturing systems,
Journal of Manufacturing Systems, vol. 13, pp.346-358, 1994.
Turbide, D., Reducing Lead-Time, The Key to Make-to-Order Success, Available: http://www.daveturbide.com/wp-
content/uploads/2009/04/reducing-lead-time2.pdf., April 12, 2016.
Wiendhal, H.P. and Toenshoff, K., The throughput diagram – An universal model for the illustration, control and
supervision of logistic processes, CIRP Annals-Manufacturing Technology, vol. 37, pp.465-468, 1988.
World Commission on Environment and Development (WECD), Our Common Future, Oxford University Press,
Oxford, 1987.
Biographies
Nur Indrianti is currently a fulltime associate professor of the Department of Industrial Engineering, Universitas
Pembangunan Nasional “Veteran” Yogyakarta, Indonesia. She received a bachelor degree in Chemical Engineering
from Universitas Gadjah Mada, Indonesia. She worked for an oil and gas company for six years and was assigned in
Design Engineering Department and Facilities Engineering Department. She earned Masters in Industrial
Engineering and Management from Bandung Institute of Technology, Indonesia and Doctor of Engineering in
Industrial Engineering and Management from Tokyo Institute of Technology, Japan. Her teaching and research
interests include industrial ecology, sustainable manufacturing, and system productivity.
Tri Wibawa is a lecturer at the Department of Industrial Engineering, Universitas Pembangunan Nasional
"Veteran" Yogyakarta. He earned B.S in Mechanical Engineering from Universitas Gadjah Mada, Indonesia.and
Masters in Industrial Engineering and Management, Bandung Institute of Technology, Indonesia. He currently
serves as the head of laboratory of technical drawing. His research interests include ergonomics and work system
design as well as product design and development.
Bachtiar Rakagandhi is currently working as an Assistant Analyst of Customer Service of Perusahaan Listrik
Negara (PLN), a state electrical company located in East Borneo, Indonesia. He is currently working as Assistant
Analyst of Customer Service of state electrical company, Indonesia. He holds a Bachelor of Science degree in
Industrial Engineering, Universitas Pembangunan Nasional “Veteran” Yogyakarta, Indonesia. He joined one-year
internship programs in a textile company and plastic manufacturing company. He has one year experience as a
Production System Planning Staff of PT Yamaha Indonesia Motor Mfg who concerned to manage Just in Time
production of Milkrun System.
1886

![10.2 Attractiveness criteria for remanufacturing in ... · remanufacturing process is assigned to the low automation of the process [18]. Core acquisition . Another challenge to remanufacturing](https://img.pdfslide.net/doc/110x75/5f2b3ad3b4bcda5693165ad5/102-attractiveness-criteria-for-remanufacturing-in-remanufacturing-process.jpg)