Embed Size (px)
Citation preview

Procedia - Social and Behavioral Sciences 96 ( 2013 ) 2767 – 2781
1877-0428 © 2013 The Authors. Published by Elsevier Ltd. Open access under CC BY-NC-ND license.
Selection and peer-review under responsibility of Chinese Overseas Transportation Association (COTA).doi: 10.1016/j.sbspro.2013.08.310
ScienceDirect
13th COTA International Conference of Transportation Professionals (CICTP 2013)
A Simulation Study for Minimizing Operating Speed Variation of Multilane Highways by Controlling Access
Bing Huanga, Yu Zhangb, Jian Luc, Linjun Lud aDepartment of Transportation and Urban Infrastructure Studies, Morgan State University,
1700 East Cold Spring Lane, Baltimore, MD 21251, United States bDepartment of Civil and Environmental Engineering, University of South Florida,
4202 East Fowler Avenue, Tampa, FL 33620, United States cDepartment of Civil and Environmental Engineering, University of South Florida,
4202 East Fowler Avenue, Tampa, FL 33620, United States dSchool of Naval Architecture, Ocean and Civil Engineering, Shanghai Jiao Tong University
800 Dong Chuan Road, Min Hang District, Shanghai 200240, China
Abstract
Traffic speed is generally considered a main issue in roadway safety. Previous studies show that faster travel is not necessarily associated with an increased risk of being involved in a crash. When vehicles travel at the same speed in the same direction (even high speeds, as on interstates), they are not passing one another and cannot collide as long as they maintain the same speed. Conversely, the frequency of crashes increases when vehicles are traveling at different rates of speed. There is no doubt that the greater speed variation is, the greater the number of interactions among vehicles is, resulting in higher crash potential. This research tries to recognize all primary factors that are associated with speed variation (dispersion) on multilane highways, including roadway access density, which is considered to be the most distinct contributing factor. Additionally, other factors are considered for this purpose, for example: configuration of speed limits, characteristics of traffic volume, geometrics of roadways, driver behavior, environmental factors, etc. A microscopic traffic simulation method based on TSIS (Traffic Software Integrated System) is utilized to exploit mathematical models to quantify the influences of all possible factors on speed variation.
© 2013 The Authors. Published by Elsevier B.V. Selection and/or peer-review under responsibility of Chinese Overseas Transportation Association (COTA).
Keywords: Access Weight; Access Density; Speed Standard Deviation; TSIS; CORSIM; Calibration
1. Introduction Roadway safety has gradually played an important role in automobile industry and road traffic. The variation
of traffic speed is related to an increase of number of crashes. The following factors would have impact on variation of traffic speed: roadway geometrics, traffic volume features, speed limits allocations, environmental factors and driver behavior. Besides speed variation, these factors would also influence roadway safety
Available online at www.sciencedirect.com
© 2013 The Authors. Published by Elsevier Ltd. Open access under CC BY-NC-ND license.
Selection and peer-review under responsibility of Chinese Overseas Transportation Association (COTA).

2768 Bing Huang et al. / Procedia - Social and Behavioral Sciences 96 ( 2013 ) 2767 – 2781
performance. Because of the significance of comprehending the influences of effective factors on variation of traffic speed and the correlation between variation of traffic speed and safety performance, the appropriate speed control counterplans is developed for shortening hazard of crash and improving roadway safety performance. A notion is extensively used to compute the number of access points within a given distance and to study crash
safety and traffic operation is influenced by access density.
The meaning of this research is to use micro-traffic flow density to analyze the impact of different access densities on traffic volume and traffic speed variation of arterials. This will fully utilize the characteristics and advantages of the analysis of simulation and calibration, investigate roadway access design factors that could influence speed variation on multilane roadways (arterials and collectors), quantify the impacts of the contributing factors on safety performance, and get a more scientific security check of speed variation between all factors. The traffic simulation software used here is TSIS 6.1.
Three major objectives of this research are described as follows: To identify the factors contributing to speed variation or other speed dispersions on multilane roadways.
These factors mainly include roadway access design factors (such as median openings, driveways, intersections, median types, and other access management techniques). Other factors, such as speed limit strategies, geometric design, traffic composition, land use, roadway function classification, and environmental characteristics, could be evaluated.
To quantify the influence of the contributing access design factors on speed variation (or other speed dispersions).
To develop statistical models to describe the relationship between speed variation (or speed dispersions) and roadway access design contributing factors. The models are compatible with the standard protocols in the Highway Safety Manual (HSM).
The remainder of this paper is organized as follows: Section 2 provides a literature review on speed variation, access density, and crash; Section 3 describes the methodologies; Section 4 describes correlation between crash rate and access density; Section 5 deals with modeling the speed variation of roadway segment using the new definition of access density; and Section 6 presents the conclusions and future work. 2. Literature Review
Many past studies mention two kinds of relationship: speed variation and crash, and access density and crash. 2.1 Speed Variation and Crash
Garber and Gadiraju explored the traffic engineering factors that influence speed variation and determined what extent speed variation affects accident rates [1]. They found accident rates do not necessarily increase with increase in average speed but do increase in speed variation. Garber and Gadiraju [2] also examined 36 roadway segments in Virginia, and used 4 years (1983-1986) accident data to do analysis. They found that accident rates increase with increasing speed variation for all classes of roads, and the accident rate on a highway does not necessarily increase with an increase in average speed. Chen et al. [3] studied the impacts of the difference of average operating speed between large and small vehicles, another criterion to describe speed dispersion, on crash rates based on data collected from an expressway. It was found that a specific traffic composition, which results in a speed difference falling in an interval of 10-15 km/h, is associated with an unusual crash rate. Drummond et al. [4] utilized a simulation-based approach to evaluate safety impacts of increased traffic signal density in suburban corridors. 10 years of crash data from two major arterials in Virginia were used in this study, actual crash rates were compared to operational performance measures simulated by Synchro/SimTraffic model. The results showed that crash rates were positively correlated with stops per vehicle and delay per vehicle and negatively correlated with mainline speed.
2.2 Access Density and Crash
Eisele and Frawley [5] studied the safety and operational impact of raised medians and driveway density by investigating 11 corridors in Texas and Oklahoma. Detailed crash analysis on 11 test corridors demonstrated that
2769 Bing Huang et al. / Procedia - Social and Behavioral Sciences 96 ( 2013 ) 2767 – 2781
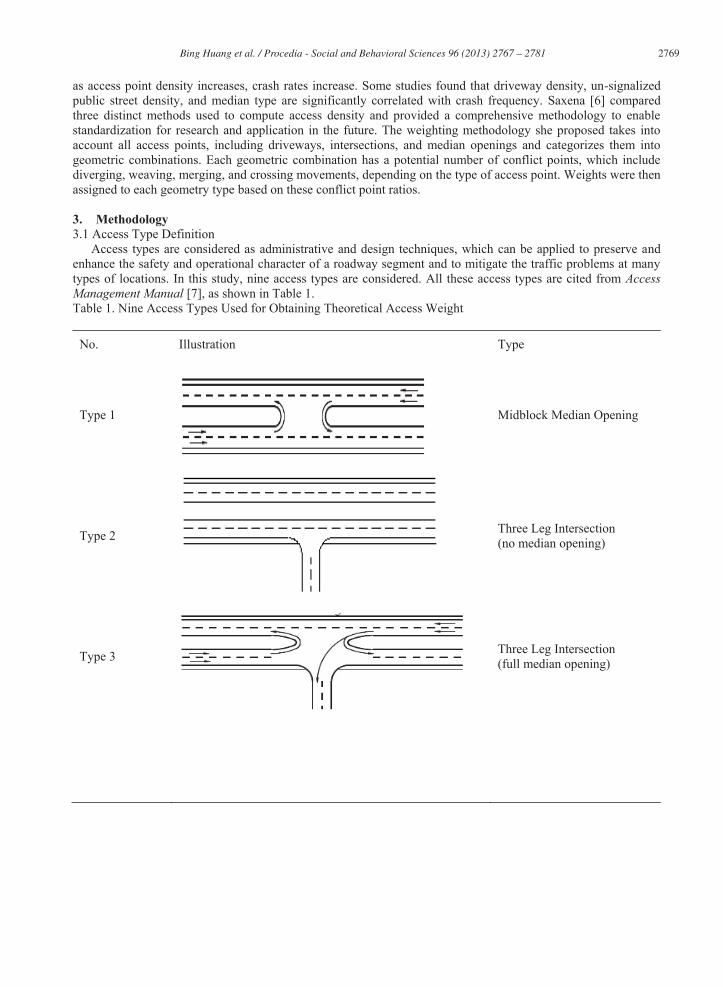
as access point density increases, crash rates increase. Some studies found that driveway density, un-signalized public street density, and median type are significantly correlated with crash frequency. Saxena [6] compared three distinct methods used to compute access density and provided a comprehensive methodology to enable standardization for research and application in the future. The weighting methodology she proposed takes into account all access points, including driveways, intersections, and median openings and categorizes them into geometric combinations. Each geometric combination has a potential number of conflict points, which include diverging, weaving, merging, and crossing movements, depending on the type of access point. Weights were then assigned to each geometry type based on these conflict point ratios. 3. Methodology 3.1 Access Type Definition
Access types are considered as administrative and design techniques, which can be applied to preserve and enhance the safety and operational character of a roadway segment and to mitigate the traffic problems at many types of locations. In this study, nine access types are considered. All these access types are cited from Access Management Manual [7], as shown in Table 1. Table 1. Nine Access Types Used for Obtaining Theoretical Access Weight
No. Illustration Type
Type 1
Midblock Median Opening
Type 2
Three Leg Intersection (no median opening)
Type 3
Three Leg Intersection (full median opening)

2770 Bing Huang et al. / Procedia - Social and Behavioral Sciences 96 ( 2013 ) 2767 – 2781
Type 4
Three Leg Intersection (directional median opening 1)
Type 5
Three Leg Intersection (signalized)
Type 6
Four Leg Intersection (no median opening)
Type 7
Four Leg Intersection (full median opening)
Type 8
Four Leg Intersection (directional median opening)

2771 Bing Huang et al. / Procedia - Social and Behavioral Sciences 96 ( 2013 ) 2767 – 2781
Type 9
Four Leg Intersection (signalized)
3.2 Speed Fluctuation Area
A speed fluctuation area is an area in which traffic speed changes significantly because of an access point. A speed fluctuation area generally has two classifications: without intersection and with intersection. Figure 1 shows the CORSIM simulation results of traffic speed variation for a roadway segment without any access points. The X-axis stands for the distance. The Y-axis stands for the speed in mile per hour (mph), and all lanes in one direction are combined. The dotted lines on the top of both plots in the figure stand for the traffic operating speeds; the dotted lines at the bottom stand for the difference between operating speeds and posted speeds.
Figure 1. Curve of Speed Fluctuation Without Intersection
Figure 2 shows the curve of a speed fluctuation area with intersection. Comparing Figures 1 and 2, it is easy to see that traffic speeds fluctuate significantly because of the intersection.

2772 Bing Huang et al. / Procedia - Social and Behavioral Sciences 96 ( 2013 ) 2767 – 2781
Figure 2. Curve of Speed Fluctuation with Intersection
The speed fluctuation area is different for each access type and could be different for various directions at a same access point. Normally, the traffic speed fluctuates less as the traffic is farther from the access point. The beginning point of a speed fluctuation area is considered as the center of an access point. The end point of a speed fluctuation area is the hithermost spot site where the Speed Standard Deviation (SSD) of that site is less than 0.5 percent of speed limit. For example, considering the speed limit of a major arterial roadway is 55 mph, then the end point of the speed fluctuation area is the hithermost spot site with SSD less than 0.5 percent of the speed limit, e.g., 55×0.5% = 0.275 mph. 3.3 Simulation Scenarios
Multiple-run simulation is conducted for different combinations of access type, number of lanes, speed limit, and level of service. Nine access types are used in multiple-run simulation, as stated earlier. The number of lanes (two-way) involves three classifications: 4, 6, and 8. The speed limit involves four classifications: 45, 50, 55, and 60 mph. Level of Service (LOS) involves three classifications: high, medium, and low. LOS is determined by traffic volume on the roadway. The traffic volume standards used in this study involves three categories: (1) when LOS = Low, the traffic volume of major street is 350 for both eastbound and westbound direction, the traffic volume of minor street is 530; (2) when LOS = Medium, the traffic volume of major street is 600 for both eastbound and westbound direction, the traffic volume of minor street is 280; (3) when LOS = High, the traffic volume is 800 for both eastbound and westbound direction, the traffic volume of minor street is 170. The traffic volumes of both major streets and minor streets comply with the Manual on Uniform Traffic Control Devices for Streets and Highways, 2009 Edition (MUTCD Manual) (AASHTO 2009). [8]
Table 2 shows the simulation settings of this study. It lists under different speed limit and different level of service, the input total traffic volume of both eastbound and westbound directions in simulation models. Considering nine access types listed previously, there are total 468 different simulation scenarios.

2773 Bing Huang et al. / Procedia - Social and Behavioral Sciences 96 ( 2013 ) 2767 – 2781
Table 2. Simulation Settings for Obtaining Access Weight
Free-Flow Speed Criteria
LOS Low Medium High
60 mph
Traffic Volume (Sum of Eastbound and Westbound Direction of Major Street in Simulation Models)
1746, 2246, 3245, 3494, 3993, 4242, 4492, 5740, 6737, 6988, 7487, 7736, 7985, 8485, 8984, 9233, 9483, 9733
55 mph 1248 1746, 2496, 3743, 4492, 4742, 5490, 5740, 5989, 6239, 6488, 6988, 7487, 7985, 8236, 8734, 9483
50 mph 1248, 1497
2495, 2496, 2745, 2994, 3494, 3743, 3993, 4492, 4742, 4991, 5490, 5989, 6239, 6488, 6988, 7736, 8485, 8734, 8984, 9233, 9733
45 mph 1497 1997, 2246, 2495, 2496, 2745, 2994, 3245, 3494, 3993, 4242, 4492, 5240, 5490, 5740, 5989, 6239, 6488, 7237, 8236
3.4 Access Weight
It is proverbial that different access driveways have distinct impacts on speed variation. Access weight is defined in consideration of traffic speed variations around access point. It has been widely accepted that larger the traffic speed variations at spot sites in the speed fluctuation area of the access point, the more likely there will be an accident happening. Furthermore, more significant traffic speed difference between one spot site and the consecutive one, more likely there will be an accident occurring. Considering these assumption, the mathematical expressions below are proposed to compute the access weight.
11
2
Ivv
SSDI
n ini
i (1)
1' 1
21
Ivv
SSDI
nni
ni
i (2)
'ii
ci SSDSSDSSD
(3)
I
i
ci
d
SSDAW1L
1
(4) Where, AW Access Weight; SSDi Speed Standard Deviation at spot site i; SSDi Speed Standard Deviation variance between spot site i and consecutive spot site i+1; SSDi
c Combined speed variation measurement; vi
n Traffic speed at spot site i in the nth running of the simulation

2774 Bing Huang et al. / Procedia - Social and Behavioral Sciences 96 ( 2013 ) 2767 – 2781
iv Average traffic speed at spot site i of all runs of simulationI Total number of simulation runsLd Length of speed fluctuation area (assumed as 100 ft in the simulation)
All 468 access weight values are calculated in this study. The first 100 sample access weight values are listed in Appendix I. Each access weight is equivalents to one scenario with specific access type, number of lanes, speed limit, and level of service.
3.5 Access DensityAccess density is defined as the sum of access weights of different access points on one roadway segment
divided by its length. The formula is shown as follows:
L/AWAD M
m mWW1 (5)
Where,AD Access Density,AWm Access Weight of access point m,M The total number of access points in the roadway segmentL Length of road segment.
Microsimulation software, Traffic Software Integrated System (TSIS), is used for obtaining the measurementsof traffic speed variation. As the access weights sought in this study are for general conditions, called astheoretical access weights, the default parameters in TSIS which reflect normal driver behaviors were kept, asshown in Table 3.Table 3. TSIS Default Parameters
Driver Type 1 2 3 4 5 6 7 8 9 10
Driver Type Percentage (%) 17 12 12 11 10 10 9 7 7 5
Acceptable Deceleration(fpss) 21 18 15 12 9 7 6 5 4 4
Acceptable Gap Cross (s) 5.6 5.0 4.6 4.2 3.9 3.7 3.4 3.0 2.6 2.0
Acceptable Gap Left (s) 7.8 6.6 6.0 5.4 4.8 4.5 4.2 3.9 3.6 2.7
Acceptable Gap Right (s) 10.0 8.8 8.0 7.2 6.4 6.0 5.6 5.2 4.8 3.6
3.6 Developing Estimated ModelSome parameters are considered to influence the speed variation on the basis of former studies. These
parameters include access density, traffic volume (annual average daily traffic or AADT), number of lanes,posted speed limit and etc. All these data could be obtained by field data collection. In the light of all necessarydata being obtained, a mathematical model will be developed to describe the relation between Speed StandardDeviation (SSD) and access weight on roadway segment.
Before calibration, the predicted model is shown as follows:
(6)

2775 Bing Huang et al. / Procedia - Social and Behavioral Sciences 96 ( 2013 ) 2767 – 2781
Where, AADT Annual Average Daily Traffic (Traffic Volume) NOL Number of Lanes SL Posted Speed Limit
Crash rates increase with the increase of access density. More crashes will happen when more traffic operates on highways, so SSD increase. SSD increase with the increase in AADT.
Simply decreasing posted speed limits may not decrease actual traffic speeds substantially. Effective speed reduction generally requires changing roadway design, or significantly increasing enforcement. Thus, increase or decrease post speed may influence SSD. When transportation planners think about building a road, number of lanes is a vital parameter in geometric design. As number of lanes increase, the highway capacity also increase, which may absorb more traffic to pass this road. SSD increases with the increase in traffic volume. Therefore, increase number of lanes may increase SSD. Land use is the steadiest constituent of urban kinetics, as changes are likely to alter the land use structure over a long time. 4. Correlation Between Crash Rate and Access Density 4.1 Site Selection
The selected roadways were 15 field data sites located in the Tampa Bay area in Florida. The length of each selected arterial ranges from 1 to 3 miles. The posted speed limits are 45, 50, and 55 mph. The geometry information of the access points for the selected roadway was obtained from Google Earth. The selection criteria for all the sites should meet the following requirements: (1) the road should be straight; (2) the road should be state road or county road; (3) the road grade should be equal to 0%; (4) the number of lanes should be equal to four or bigger than four; and (5) speed limit should be equal or bigger than forty.
Figure 3 shows all 15 data collection sites, which are marked on the map of Google Earth. The blue lines represent the six sites at which no crashes occurred during a 10-year period, from 2001 to 2010. The six sites are: E Fowler Ave, Bruce B Downs Blvd Southbound (SB), Bruce B Downs Blvd Northbound (NB), CR 582, US 19-1, and US 19-2. The red lines represent the rest of nine sites.
Figure 3. Scatter Grams of 15 Observed Sites in Florida
4.2 Crash Rates

2776 Bing Huang et al. / Procedia - Social and Behavioral Sciences 96 ( 2013 ) 2767 – 2781
The crash information on the selected roadway segments was extracted from the Florida State Crash Database from 2001 to 2010. The definition of crash rate used in this study is crashes per million vehicle miles traveled (MVMT). It is a function of the number of crashes, the traffic volume, and the length of roadway segment, as shown below.
LVTAR
365000,000,1
(7) Where: R Crash rate for the section (in crashes per MVMT) A Number of reported crashes T Time frame of data (years) V AADT (average annual daily traffic) of roadway segment L Length of roadway segment (miles) 4.3 Statistical Analysis
Table 4 shows the crash rate and calculated access density for nine field data sites whose crash rates do not equal 0 and the correlation between the crash rate and the calculated access density. Table 4. Location, Crash Rate, Access Density, and Correlation Coefficients of 9 Field Data Sites
No. Road Name Crash Rate Access Density (New Method)
Access Density (Access Mgt Manual)
1 N Dale Mabry 41.04 0.460 1.039 2 State 54 56.62 0.640 0.595 3 US 41 25.02 0.571 0.609 4 CR 60 24.85 0.438 0.505 5 Temple Terrace Hwy 131.97 1.413 0.909
6 W Hillsborough Ave-1 (begin with Tudor Dr) 150.60 0.788 0.733
7 W Hillsborough Ave-2 (begin with Montague St) 47.79 0.418 0.457
8 W Hillsborough Ave-3 (begin with Strathmore Gate Dr) 66.16 1.008 0.968
9 E Dr MLK Jr Blvd (CR 579) 61.30 0.683 0.569
Average 0.71 0.71 Correlation Coefficient 0.71 0.34
Similar information is presented in Figure 4 with linear trend lines. The X-axis represents the access density, and the Y-axis represents the crash rate. When the access density increases, the crash rate increases as well. Statistical analysis of this study shows that the access density calculated following the new proposed method has a higher correlation with the crash rates than the access density calculated following the existing method. For the existing method, the access density equals to the number of access points along the roadway segments divided by the length of roadway segments.

2777 Bing Huang et al. / Procedia - Social and Behavioral Sciences 96 ( 2013 ) 2767 – 2781
Figure 4. Crash Rate vs. Access Density of Nine Field Data Sites
5. Modeling the Speed Variation Of Roadway Segment Using the New Definition of Access DensityTo do traffic simulation using simulation software, field data collection alone cannot provide enough data.
Several parameters can be changed in simulation models. For instance: access types, traffic volume, speed limit,number of lanes, and etc., which can extend the simulation samples from 15 to 210 sites. Hence, it is an efficient and reliable approach to produce a great deal of data that can develop statistical models. Since all data wereprepared well, statistical models were presented to estimate relationships among SSD and its contributing factors,which include access density, traffic volume (AADT), speed limit and number of lanes. Access density, trafficvolume, speed limit and number of lanes are independent variables. SSD is dependent variable.
5.1 Traffic Simulation and CalibrationIn traffic simulation analysis, traffic simulation and calibration are the two key steps. To collect speed data,
traffic simulation analysis is an effective method. The core objective of simulation analysis is to promote support the analysis findings to be obtained through field speed analysis.
Multiple Parameter Calibration method was used for this study. Calibration parameter is travel time, adjusting parameters include start-up lost time, cross traffic, amber interval response,mean startup delay and mean discharge headway and distribution of multiplier for discharge headway percentage.Eventually, calibration target is to make fitness factor smaller than 15%. The equation below shows thecalculation of fitness factor.
(8)In this study, the study area of first data collection was located on E Flower Avenue (Bruce B Downs
th Street) in Tampa, FL. The intersection of E Fowler Avenue and Bruce B Downs Blvd is a four legsignalized intersection. The intersection of E Fowler Avenue and N 60th Street is a four leg full median openingintersection. Operating speed, traffic volume, travel time, turn bay length and signal timing plan were collected.Once the task of all field data collection was finished, a base model was built and simulated in CORSIM togenerate the simulated data. Simulated travel time data were compared with field travel time. The comparisonresults show that for westbound direction, the fitness factor between simulated travel time and field travel time is9.58%, which is below 15% and meets the calibration target. However, for eastbound direction, the fitness factor is 15.47%, which does not meet the calibration target. So, further calibration is needed for eastbound direction.

2778 Bing Huang et al. / Procedia - Social and Behavioral Sciences 96 ( 2013 ) 2767 – 2781
5.2 Obtaining Extended Data from Simulation Field data collection cannot provide enough data for statistical modeling. But traffic simulation software is a
good substitute. Simulation models changed several parameters causally, for example: access types, traffic volume, speed limit, number of lanes and etc. All these changes extended simulation samples from initial 1 to 210.
th Street). 250 detectors were installed on the link of this model, 125 eastbound and 125 westbound. The entry traffic volume of eastbound and westbound is 2507 and 2484 separately. The configuration of base model is as follows: totally 6 lanes, speed limit is 50 mph, access density is 79.27, and SSD value is 1.288. 5.3 Statistical Modeling
SAS 9.2, a business analytics and business intelligence software, was used for modeling the relationship between SSD of roadway segment and all independent variables, which includes access density, traffic volume, number of lanes and speed limit. Variable of land use is also considered to affect the segment SSD. The reason why it is not listed here is because it is hard to measure and the resources are limited. The mathematical formula of the relationship between SSD of roadway segment and all independent variables is as: SSD = f (Access Density, Traffic Volume, Number of Lanes, Speed Limit). The linear regression is the most practical and rational model format based on a couple of comparisons of different model formats. In addition, to make the values of all variables the same magnitude, the value of access density was divided by 10, the value of volume was divided by 1000, and the value of speed limit was divided by 10.
Modeling results of 210 simulation models is not ideal. 10 simulation models and 14 outliers were found. Outliers are observations that exert a large influence on the overall outcome of a model or a parameter's estimate. Therefore, the 14 outlier sites were removed from the 210 simulation models, and a linear regression model was developed for the 196 simulation models to determine the relationship between the dependent variable SSD and all the independent variables: access density, traffic volume, number of lanes and speed limit. Table 5 shows the modeling results of 196 simulation models. Table 5. Parameter Estimates of 196 Simulation Models Variable
DF
Parameter Estimate Standard Error
t Value Pr > |t|
Intercept 1 -0.56 0.478 -1.17 0.243 Access Density / 10 1 0.094 0.015 6.36 <.0001 Traffic Volume / 1000 1 0.226 0.022 10.27 <.0001 Number of lanes 1 -0.321 0.028 -11.41 <.0001 Speed Limit / 10 1 0.424 0.089 4.74 <.0001
The P values of independent variables in Table 5 are all smaller than 0.05, which indicates that all independent variables were statistically significant at a 95% level of confidence. Consequently, Table 5 could be used as the final results.
It is clearly that SSD of roadway segment increase with the increase of access density, traffic volume and speed limit. Adversely, SSD decrease with the increase in the number of lanes. There is no doubt that access density, traffic volume, and speed limit have positive impacts on SSD. 6. Conclusions and Future Work
Conclusions and results of this study are summarized as follows: It is certified that different access types have different impacts on speed variation on multilane roadways,
even under the same prevailing conditions. And a new definition and calculation of access weight is proposed to show the difference.
New Access Density can represent a number of characteristics of access point, which could directly affect the roadway safety.

2779 Bing Huang et al. / Procedia - Social and Behavioral Sciences 96 ( 2013 ) 2767 – 2781
Some factors are found to have distinct contributions to roadway speed variation, according to field data collection and simulations, such as access density, traffic volume of main road, number of lanes of main road and speed limit.
A statistical model is proposed to show the relationships between SSD of roadway segment and all independent variables. It is clear that access density, traffic volume, and speed limit have positive effects on SSD, while the number of lanes has negative effect.
Future work could include the following: Concentrate on signalized intersections in Florida, get crash frequencies of signalized intersections of 10
years (2001 2010) from Florida State Crash Database, which is also called Crash Analysis Reporting System (CARs).
Build a Negative-Binomial Model for the crash frequency, analyze the significance of the model, and verify the strong correlation between crash frequency and access weights.
References [1] Garber, N. J. and Gadiraju, R. Speed Variance and its Influence on Accidents. Washington DC: AAA
Foundation for Traffic Safety; 1988. [2] Garber, N. J. and Gadiraju, R. Factors Affecting Speed Variance and Its Influence on Accidents.
Transportation Research Record 1989, 1213: 64-71. [3] Y. Chen, X. Sun, L. Zhong, and G. Zhang. Speed Difference and Its Impact on Traffic Safety of One
Freeway in China. Transportation Research Record 2007, 2038: 105-110. [4] Drummond, K.P., L.A. Hoel, L.A. Lacy, and J.S. Miller. A Simulation-Based Approach to Evaluate Safety
Impacts of Increased Traffic Signal Density. Virginia: Virginia Transportation Research Council; 2002. [5] Eisele, W.L., and W.F. Frawley. Estimating the Safety and Operational Impacts of Raised Medians and
Driveway Density: Experiences from Texas and Oklahoma Case Studies. Transportation Research Record 2005, 1931: 108-116.
[6] Meeta, S. Comparison of Various Methods to Compute Access Density and Proposing a Weighted Methodology. http://scholarcommons.usf.edu/cgi/viewcontent.cgi?article=2760&context=etd; 2010.
[7] Transportation Research Board, Access Management Manual. Washington, DC: National Research Council; 2003.
[8] American Association of State Highway and Transportation Officials (AASHTO), Manual on Uniform Traffic Control Devices (MUTCD) for Streets and Highways, 2009 Edition. U.S. Department of Transportation, Federal Highway Administration; 2009.
Appendix A First 100 Sample Access Weights by Access Type, Number of Lanes, Speed Limit, Level of Service, and Direction
No. Access Type Number of Lanes Speed Limit LOS Direction Access Weight
1 1 4 45 H Eastbound 0.047 2 1 4 45 M Eastbound 0.053 3 1 4 45 L Eastbound 0.051 4 1 4 50 H Eastbound 0.048 5 1 4 50 M Eastbound 0.051 6 1 4 50 L Eastbound 0.053 7 1 4 55 H Eastbound 0.050

2780 Bing Huang et al. / Procedia - Social and Behavioral Sciences 96 ( 2013 ) 2767 – 2781
8 1 4 55 M Eastbound 0.050 9 1 4 55 L Eastbound 0.052 10 1 4 60 H Eastbound 0.044 11 1 4 60 M Eastbound 0.045 12 1 4 60 L Eastbound 0.055 13 1 6 45 H Eastbound 0.043 14 1 6 45 M Eastbound 0.047 15 1 6 45 L Eastbound 0.050 16 1 6 50 H Eastbound 0.044 17 1 6 50 M Eastbound 0.050 18 1 6 50 L Eastbound 0.052 19 1 6 55 H Eastbound 0.048 20 1 6 55 M Eastbound 0.050 21 1 6 55 L Eastbound 0.054 22 1 6 60 H Eastbound 0.045 23 1 6 60 M Eastbound 0.049 24 1 6 60 L Eastbound 0.053 25 1 8 45 H Eastbound 0.043 26 1 8 45 M Eastbound 0.047 27 1 8 45 L Eastbound 0.049 28 1 8 50 H Eastbound 0.046 29 1 8 50 M Eastbound 0.052 30 1 8 50 L Eastbound 0.053 31 1 8 55 H Eastbound 0.052 32 1 8 55 M Eastbound 0.053 33 1 8 55 L Eastbound 0.053 34 1 8 60 H Eastbound 0.047 35 1 8 60 M Eastbound 0.054 36 1 8 60 L Eastbound 0.058 37 2 4 45 H Eastbound 0.066 38 2 4 45 M Eastbound 0.085 39 2 4 45 L Eastbound 0.117 40 2 4 50 H Eastbound 0.074 41 2 4 50 M Eastbound 0.094 42 2 4 50 L Eastbound 0.125 43 2 4 55 H Eastbound 0.080 44 2 4 55 M Eastbound 0.100 45 2 4 55 L Eastbound 0.127 46 2 4 60 H Eastbound 0.074 47 2 4 60 M Eastbound 0.105 48 2 4 60 L Eastbound 0.127 49 2 6 45 H Eastbound 0.076 50 2 6 45 M Eastbound 0.089 51 2 6 45 L Eastbound 0.117 52 2 6 50 H Eastbound 0.072 53 2 6 50 M Eastbound 0.095 54 2 6 50 L Eastbound 0.124 55 2 6 55 H Eastbound 0.076 56 2 6 55 M Eastbound 0.104

2781 Bing Huang et al. / Procedia - Social and Behavioral Sciences 96 ( 2013 ) 2767 – 2781
57 2 6 55 L Eastbound 0.123 58 2 6 60 H Eastbound 0.074 59 2 6 60 M Eastbound 0.112 60 2 6 60 L Eastbound 0.132 61 2 8 45 H Eastbound 0.070 62 2 8 45 M Eastbound 0.091 63 2 8 45 L Eastbound 0.117 64 2 8 50 H Eastbound 0.071 65 2 8 50 M Eastbound 0.094 66 2 8 50 L Eastbound 0.126 67 2 8 55 H Eastbound 0.077 68 2 8 55 M Eastbound 0.107 69 2 8 55 L Eastbound 0.128 70 2 8 60 H Eastbound 0.083 71 2 8 60 M Eastbound 0.109 72 2 8 60 L Eastbound 0.130 73 3 4 45 H Eastbound 0.104 74 3 4 45 M Eastbound 0.106 75 3 4 45 L Eastbound 0.213 76 3 4 50 H Eastbound 0.101 77 3 4 50 M Eastbound 0.117 78 3 4 50 L Eastbound 0.149 79 3 4 55 H Eastbound 0.116 80 3 4 55 M Eastbound 0.140 81 3 4 55 L Eastbound 0.152 82 3 4 60 H Eastbound 0.125 83 3 4 60 M Eastbound 0.141 84 3 4 60 L Eastbound 0.168 85 3 6 45 H Eastbound 0.086 86 3 6 45 M Eastbound 0.107 87 3 6 45 L Eastbound 0.126 88 3 6 50 H Eastbound 0.101 89 3 6 50 M Eastbound 0.104 90 3 6 50 L Eastbound 0.157 91 3 6 55 H Eastbound 0.108 92 3 6 55 M Eastbound 0.112 93 3 6 55 L Eastbound 0.148 94 3 6 60 H Eastbound 0.118 95 3 6 60 M Eastbound 0.132 96 3 6 60 L Eastbound 0.165 97 3 8 45 H Eastbound 0.085 98 3 8 45 M Eastbound 0.092 99 3 8 45 L Eastbound 0.125 100 3 8 50 H Eastbound 0.100


![Manuale Utente Offerta · ,1',&( ,qwurgx]lrqh 3$*,1$ ,1752'877,9$ 3$662 /2772](https://img.pdfslide.net/doc/110x75/5f5020d92863115e04052182/manuale-utente-offerta-1-qwurgxlrqh-31-17528779-3662-2772.jpg)