Embed Size (px)
Citation preview

International Journal of Sustainable Built Environment (2016) 5, 370–386
HO ST E D BYGulf Organisation for Research and Development
International Journal of Sustainable Built Environment
ScienceDirectwww.sciencedirect.com
Original Article/Research
A simulation study on performance evaluation of single-stageLiBr–H2O vapor absorption heat pump for chip cooling
Manu S. a,⇑, T.K. Chandrashekar b
aDepartment of Mechanical Engineering, Sri Siddhartha Institute of Technology, Tumkur 572105, Karnataka, IndiabDepartment of Mechanical Engineering, Mangalore Institute of Technology and Engineering, Moodabidri-574225, Mangalore, Karnataka, India
Received 6 March 2016; accepted 21 August 2016
Abstract
The growth of Lithium Bromide–Water (LiBr–H2O) absorption based heat pump is encouraged for the necessity of extracting highheat from the electronic chips. This paper presents a simulation study of single-stage LiBr–H2O vapor absorption heat pump for chipcooling. In this study, a detailed thermodynamic analysis of the single-stage LiBr–H2O vapor absorption heat pump for chip cooling inthe nonexistence of solution heat exchanger was performed and a user-friendly graphical user interface (GUI) package including visualcomponents was developed by using MATlab (2008b). The influence of chip temperature on COP (Coefficient of Performance), flowrates and conductance was examined by using the developed package. The model is validated by using the values available in the liter-ature and indicates that there is a greater reduction in the absorber load. The influence of chip temperature on the performance andthermal loads of individual components was studied and it was concluded that, COP increases from 0.7145 to 0.8421 with an increasein chip temperature.� 2016 The Gulf Organisation for Research and Development. Production and hosting by Elsevier B.V. All rights reserved.
Keywords: LiBr–H2O; Absorption heat pump; Chip cooling; Simulation
1. Introduction
Due to the advancement in semiconductor technologythere is a rapid increase in the level of power density ofthe IC chips. These IC chips are working under harsh con-ditions having a high heat flux of 100 W/cm2 at a junctiontemperature of more than 100 �C. Traditional convectiveair cooling methods are facing complications in extracting
http://dx.doi.org/10.1016/j.ijsbe.2016.08.002
2212-6090/� 2016 The Gulf Organisation for Research and Development. Pro
⇑ Corresponding author.E-mail addresses:[email protected] (S. Manu), chandra_ssit@
yahoo.co.in (T.K. Chandrashekar).
Peer review under responsibility of The Gulf Organisation for Researchand Development.
high heat flux and in maintaining the IC chips at ambienttemperature below the restricted space assigned for thermalmanagement. A number of attempts have been made todevelop new alternate thermal solutions for chip cooling.Thermal solutions for chip cooling can be characterizedas passive and active cooling methods. In passive cooling,working fluid is circulated by means of gravitational forceor capillary method but in active cooling system circulationof the working fluid is by means of a pump or a compressorand improves the performance of the system.
Number of researchers developed passive and activecooling methods for device cooling. Tuckerman andPease (1981) demonstrated the innovative method of cool-
duction and hosting by Elsevier B.V. All rights reserved.
Nomenclature
CR circulation ratioE energy (kJ/s)h Enthalpy (kJ/kg)K thermal conductivity (W/mK)LiBr–H2O Lithium Bromide–WaterLMTD logarithmic mean temperature difference (�C)_m mass flow rate (kg/s)P pressure (bar)_Q rate of Heat transfer (kW)R thermal Resistance (�C/W)S shape factorT temperature (�C)UA conductance (kW/�C)V specific volume (m3/kg)
_W p pump power (kW)X concentration (%)
Subscript
a Absorberc Condensere Evaporatorg generatori inleto outletw wallws wall superheatD Difference
S. Manu, T.K. Chandrashekar / International Journal of Sustainable Built Environment 5 (2016) 370–386 371
ing chips by having a single-row micro-channel etcheddirectly into the back of a silicon wafer. Water is used asthe working fluid and the maximum obtained power den-sity of 790 W/m2K is removed with a rise in water temper-ature of 71 K at a pressure of drop 2 bar. Pal et al. (2002)showed thermosyphon techniques for chip cooling usingwater as a working fluid and the maximum obtained cool-ing capacity of 80 W at average junction-to-ambient ther-mal resistance of 0.95 KW�1.
Bin et al. (2012) developed copper based microchannelheat exchangers which are used in heat absorption seg-ments, heat rejection segments and recirculating-liquidcooling system. The experimentation was performed onliquid-passing heat rejection segment and microchannel-based recirculating-liquid cooling system. The microchan-nel liquid flow through individual fins enhances the heattransfer performance. Copper base microchannel heatexchangers showed there is advantage in removing highheat flux under limited space. Bintoro et al. (2005) investi-gated jet impinging technique using water as working fluidto obtain a maximum cooling capacity of 200 W with amaximum junction temperature of 90 �C. Maydanik et al.(2005) studied the loop heat pipe where water and ammo-nia are the two working fluids, indicating a maximum cool-ing capacity of 130 W at minimum junction-to-ambientthermal resistance of 0.58 kW�1 is achieved. Jiang et al.(2002) showed electro-osmotic pumping using water asworking fluid with a maximum cooling capacity of 38 Wwith a junction temperature below 120 �C and junction-to-ambient thermal resistance of 2.5 KW�1. Fan et al.,2001) developed a thermoelectric micro-cooler with maxi-mum cooling power density of 1 kWcm�2. Tan and Tso(2004) conducted the experimental investigation for cool-ing of mobile electronic equipment using phase changematerials. n-eicosane is used as a phase change materialand is used to absorb heat from the chips and preservethe chip temperature at 50 �C but Hewitt et al. (2010)reviews the Phase Change Materials (PCMs) for latent heat
thermal energy storage systems and showed the problemsin formulating the system.
Mongia et al. (2006) developed vapor compression sys-tem at laboratory level using Isobutane as a refrigerantwith a maximum cooling capacity of 50 W at junction-to-ambient thermal resistance of 0.25 K W�1 and COP of2.25. Trutassanawin et al. (2006) carried out the experimen-tal investigation on miniature-scale vapor compressionrefrigeration systems for cooling electronic devices, havingcapacities of 121–268 W for the pressure ratios of 1.9–3.2and COP of 2.8–4.7. Chiriac and Chiriac (2010) con-structed an analytical model using water-ammonia solutionas working pair for microelectronic cooling and obtainedmaximum COP of 0.73. Kim et al. (2008) and Yoonet al. (2007) performed a theoretical study of an absorptionbased heat pump system for device cooling using LiBr–H2O as working pair having a maximum cooling capacityof 100 W and COP of 0.87.
Ebrahimi et al. (2015) explained technical and economicproblems of absorption cooling machines which are used indata centers. The study includes the development of thesteady state model in order to do energy balance andexergy analysis. The innovative configuration was devel-oped by placing a generator in place of a condenser onthe chip cooling circuit. The simulation was performedfor both absorption cooling systems such as LiBr–H2Oand water–ammonia. The LiBr–H2O absorption schemeshowed best system for data center/server operating condi-tions. The author concludes that, there is a need of sensitiv-ity analysis for these types of systems.
LiBr–H2O absorption pair showed its potential inextracting high latent heat and proved ecofriendly sincewater is used as refrigerant and LiBr–H2O solution asabsorption pair. From the last century, numerous experi-mental investigations were performed on LiBr–H2O heatpump systems by many researchers. These experimentalinvestigations are mainly devoted to enhance the perfor-mance of the system or to identify the critical parameters

372 S. Manu, T.K. Chandrashekar / International Journal of Sustainable Built Environment 5 (2016) 370–386
that affect the performance. Mostafavi and Agnew (1996)studied the effect of ambient temperature on the generatortemperature, concentration of strong solution, flow ratio ofthe solution and on the evaporator temperature for LiBr–H2O absorption unit. Yoon et al. (2003) carried out anexperimental examination on double-effect LiBr–H2Oabsorption cycle.
Asdrubali and Grignaffini (2005) and Aphornratana andSriveerakul (2007) experimentally examined the perfor-mance of an absorption chiller with a cooling capacity of2 kW. The outcomes indicated that the performance ofthe scheme rises with the rise of the generator and evapora-tor inlet temperature. The performance of the chillerdecreases with the rise in the condenser and absorber inlettemperature. Marc et al. (2010) and Pongtornkulpanichet al. (2008) experimentally studied the performance of asolar-absorption A/C system with a cooling capacity of10 kW operating in Italy. Melograno et al. (2009) devel-oped an experimental test opportunity capable of gatheringperformance curves from an absorption chiller with coolingcapacity up to 20 kW. Agyenim et al. (2010) experimentallytested the performance of solar-absorption A/C systems ofcapacity 4.5 kW. The test showed the average COP of 0.48for an average peak solar insolation of 812 W/m2. The per-formance data for specific operating conditions weremapped.
Extensive literature is available related to the develop-ment of simulation models to guess the performance ofLiBr–H2O in diverse operating conditions and for differentapplications. Joudi and Lafta (2001) developed a steadystate computer simulation model in order to predict theinfluence of several operating situations on the functionof each component and to find the performance of anabsorption refrigeration system using LiBr–H2O as a work-ing pair.
Grossman and Zaltash (2001) developed a computercode ABSIM (Absorption Simulation) for the simulationof absorption schemes in a flexible and modular form mak-ing it likely to examine numerous cycle configurations withdifferent working fluids.
Alva and Gonzalez (2002) and Atmaca and Yigit, 2003established the mathematical model for the absorption chil-ler with a capacity of 10.5 kW to determine the perfor-mance characteristics of the system. Florides et al. (2003)developed the mathematical model based on energy bal-ance equations written for the absorber, condenser, evapo-rator and generator for an absorption cooling capacity of1 kW. Mehrabian and Shahbeik (2005) developed the com-puter program for the design and thermodynamic analysisof a single effect absorption chiller using LiBr–H2O solu-tion as working fluid.
In recent decades, there was greater attention in apply-ing the principles of second law of thermodynamics forevaluating and assessing the thermodynamic performanceof LiBr–H2O system. Talbi and Agnew (2000) performedexergy analysis on a single-effect absorption refrigerationcycle using LiBr–H2O as the working fluid pair. Lee and
Sherif (2000) performed a second law analysis of a singleeffect LiBr–H2O absorption refrigeration system. The influ-ence of heat source temperature on COP and exergetic effi-ciency was evaluated. Martinez et al. Martinez and Pinazo,2002 utilized the statistical tool to find the influence of vari-ation of heat exchanger areas on the performance of a sin-gle effect machine.
Sencana et al. (2005) analyzed the exergy losses in eachcomponent of a single stage LiBr–H2O absorption system.He compares exergy losses of generator and absorber withthe evaporator and condenser. The exergetic efficiency ofthe system drops with an increase in heat source tempera-ture for both cooling and heating applications. Sedighiet al. (2007) made the exergy analysis of a single-effectLiBr–H2O absorption refrigeration system. The exergyanalysis was performed by taking the mass and energy con-servation into consideration with respect to the first andsecond laws of thermodynamics. The results showed that,a decrease in cooling water temperature causes an enhance-ment in the COP and Exergetic Coefficient of Performance(ECOP). Rising the evaporator temperature also improvesthe COP; however it caused a decrease in the ECOP of thesystem.
The literature reviews of the authors like Vargas et al.(1988), Yang and Guo (1987), Atilgan and Aygun (2014),Agrawal et al., (2015), Karno and Ajib (2008) andIranmanesh and Mehrabian (2012) have showed in theirstudies on LiBr–H2O absorption heat pump with respectto development, modification of the cycle, alternate work-ing pair and simulation used for different applications cou-pled to different energy sources.
In a review of an extensive literature no attempthas yet been made to study the performance ofLiBr–H2O based absorption heat pump for chip cooling.The present work aims to study the performance ofLiBr–H2O based absorption heat pump especially for chipcooling. The steady state simulation (analytical) modelwas developed to analyze the influence of chip tempera-ture on coefficient of performance, load, mass flow rateand conductance. A user-friendly graphical user interface(GUI) package including visual components for simulat-ing the performances of absorption refrigeration systemsworking for chip cooling is developed by using MATlab(2008b) software. It is expected that the user-friendly soft-ware package developed would help the researchers in cal-culation of performance and determination of suitableoperating conditions. The software package helps indetermining the effect of chip temperature on perfor-mance, loads, flow rates and conductance at a fast ratewith high accuracy.
2. Mathematical model of absorption heat pump for chip
cooling
In this study, the evaporator of single-effect LiBr–H2Oabsorption based heat pump is placed directly on the backof a chip as shown in Figs. 1 and 2 thereby maintaining the

Figure 1. Absorption based heat pump system for chip cooling.
Figure 2. Schematic of chip coupled evaporator.
S. Manu, T.K. Chandrashekar / International Journal of Sustainable Built Environment 5 (2016) 370–386 373
chip temperature at ambient level. In the LiBr–H2Oabsorption based heat pump system, water is used as refrig-erant and LiBr–H2O as an absorption pair. The saturatedliquid refrigerant coming from the expansion valve (State7) is vaporized by absorbing the heat dissipated from thechip (State 8). The refrigerant vapor coming from evapora-tor is exothermically condensed and absorbed into thestrong LiBr–H2O solution (state point 4) i.e. weak in waterpercentage, resulting in weak LiBr–H2O solution i.e. rich inwater percentage at state point 1.The rejected heat isabsorbed by the coolant water as shown in Fig. 1. LiBr–H2O solution is pressurized by the solution pump (State2). In the generator, the high pressure and high tempera-ture superheated refrigerant water vapor is created and des-orbed from the weak LiBr solution and returns to therefrigerant loop. The superheated water vapor condensedin the condenser and the rejected latent heat is absorbedby the coolant water as shown in Fig. 1.
Assumptions
� Pipe pressure drops are negligible.� The heat gain to the evaporator from the surroundingsand the heat losses from the generator to the surround-ings are negligible.
� In the expansion process, the enthalpy is constant.� The water leaving the generator will be superheatedvapor, water leaving the condenser will be saturated liq-uid and water leaving the evaporator is saturated vapor.
� The pressure in the generator is the same as the con-denser (saturation pressure) and pressure in the evapo-rator is the same as the absorber (saturation pressure).
� The temperature difference in the condenser, evapora-tor, absorbent, and generator is negligible.
� The coolant outlet temperature from the absorber is theaverage temperature of inlet and outlet temperature ofthe coolant from the system.
� Temperature of the vapor refrigerant leaving the gener-ator is the average temperature of inlet and outlet tem-perature of the solution entering and leaving thegenerator.
� Thermo physical properties of refrigerant with tempera-ture and pressure remain constant.
2.1. Evaporator analysis
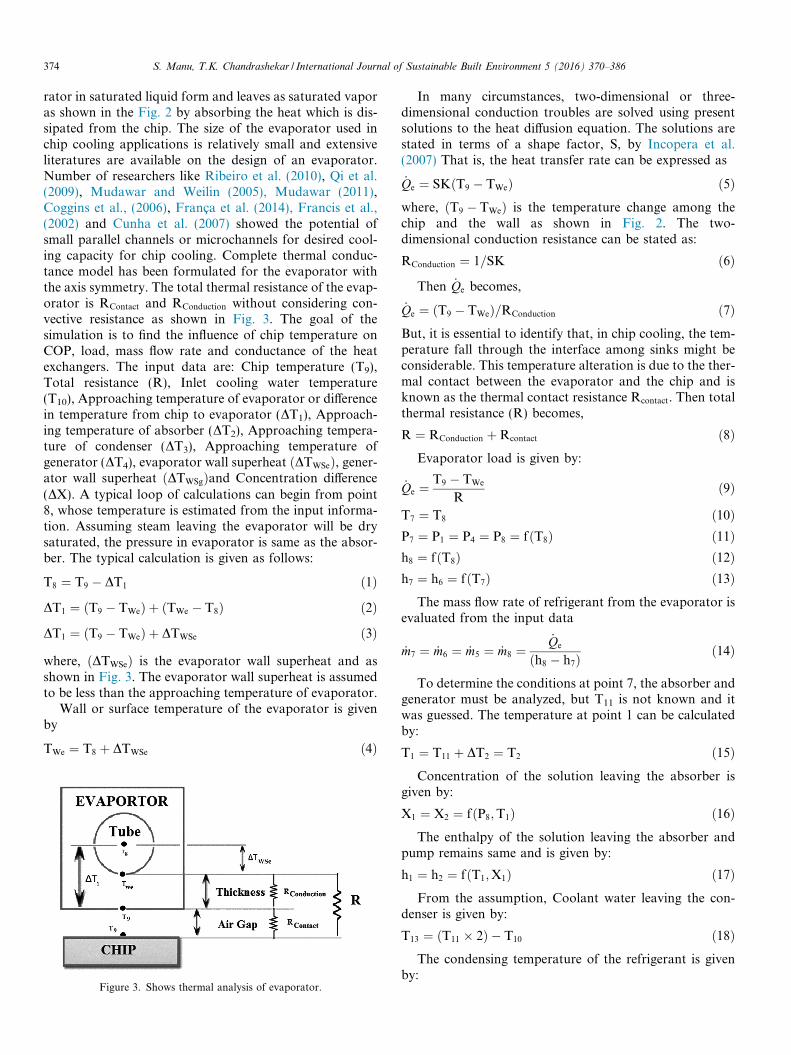
Fig. 2 illustrates the evaporator of single-effect LiBr–H2O absorption based heat pump which is etched directlyinto the back of a chip. The refrigerant reaches the evapo-
374 S. Manu, T.K. Chandrashekar / International Journal of Sustainable Built Environment 5 (2016) 370–386
rator in saturated liquid form and leaves as saturated vaporas shown in the Fig. 2 by absorbing the heat which is dis-sipated from the chip. The size of the evaporator used inchip cooling applications is relatively small and extensiveliteratures are available on the design of an evaporator.Number of researchers like Ribeiro et al. (2010), Qi et al.(2009), Mudawar and Weilin (2005), Mudawar (2011),Coggins et al., (2006), Franca et al. (2014), Francis et al.,(2002) and Cunha et al. (2007) showed the potential ofsmall parallel channels or microchannels for desired cool-ing capacity for chip cooling. Complete thermal conduc-tance model has been formulated for the evaporator withthe axis symmetry. The total thermal resistance of the evap-orator is RContact and RConduction without considering con-vective resistance as shown in Fig. 3. The goal of thesimulation is to find the influence of chip temperature onCOP, load, mass flow rate and conductance of the heatexchangers. The input data are: Chip temperature (T9),Total resistance (R), Inlet cooling water temperature(T10), Approaching temperature of evaporator or differencein temperature from chip to evaporator (DT1), Approach-ing temperature of absorber (DT2), Approaching tempera-ture of condenser (DT3), Approaching temperature ofgenerator (DT4), evaporator wall superheat ðDTWSeÞ, gener-ator wall superheat ðDTWSgÞand Concentration difference(DX). A typical loop of calculations can begin from point8, whose temperature is estimated from the input informa-tion. Assuming steam leaving the evaporator will be drysaturated, the pressure in evaporator is same as the absor-ber. The typical calculation is given as follows:
T8 ¼ T9 � DT1 ð1ÞDT1 ¼ ðT9 � TWeÞ þ ðTWe � T8Þ ð2ÞDT1 ¼ ðT9 � TWeÞ þ DTWSe ð3Þwhere, ðDTWSeÞ is the evaporator wall superheat and asshown in Fig. 3. The evaporator wall superheat is assumedto be less than the approaching temperature of evaporator.
Wall or surface temperature of the evaporator is givenby
TWe ¼ T8 þ DTWSe ð4Þ
Figure 3. Shows thermal analysis of evaporator.
In many circumstances, two-dimensional or three-dimensional conduction troubles are solved using presentsolutions to the heat diffusion equation. The solutions arestated in terms of a shape factor, S, by Incopera et al.(2007) That is, the heat transfer rate can be expressed as
_Qe ¼ SKðT9 � TWeÞ ð5Þwhere, ðT9 � TWeÞ is the temperature change among thechip and the wall as shown in Fig. 2. The two-dimensional conduction resistance can be stated as:
RConduction ¼ 1=SK ð6ÞThen _Qe becomes,
_Qe ¼ ðT9 � TWeÞ=RConduction ð7ÞBut, it is essential to identify that, in chip cooling, the tem-perature fall through the interface among sinks might beconsiderable. This temperature alteration is due to the ther-mal contact between the evaporator and the chip and isknown as the thermal contact resistance Rcontact. Then totalthermal resistance (R) becomes,
R ¼ RConduction þRcontact ð8ÞEvaporator load is given by:
_Qe ¼ T9 � TWe
Rð9Þ
T7 ¼ T8 ð10ÞP7 ¼ P1 ¼ P4 ¼ P8 ¼ fðT8Þ ð11Þh8 ¼ fðT8Þ ð12Þh7 ¼ h6 ¼ fðT7Þ ð13Þ
The mass flow rate of refrigerant from the evaporator isevaluated from the input data
_m7 ¼ _m6 ¼ _m5 ¼ _m8 ¼_Qe
ðh8 � h7Þ ð14Þ
To determine the conditions at point 7, the absorber andgenerator must be analyzed, but T11 is not known and itwas guessed. The temperature at point 1 can be calculatedby:
T1 ¼ T11 þ DT2 ¼ T2 ð15ÞConcentration of the solution leaving the absorber is
given by:
X1 ¼ X2 ¼ fðP8;T1Þ ð16ÞThe enthalpy of the solution leaving the absorber and
pump remains same and is given by:
h1 ¼ h2 ¼ fðT1;X1Þ ð17ÞFrom the assumption, Coolant water leaving the con-
denser is given by:
T13 ¼ ðT11 � 2Þ � T10 ð18ÞThe condensing temperature of the refrigerant is given
by:

S. Manu, T.K. Chandrashekar / International Journal of Sustainable Built Environment 5 (2016) 370–386 375
T6 ¼ T13 þ DT3 ð19ÞThe condensing pressure of the refrigerant is given by:
P6 ¼ P5 ¼ P2 ¼ P3 ¼ fðT6Þ ð20ÞThe enthalpy of the superheated vapor refrigerant leav-
ing the generator is given by:
h5 ¼ fðT6;P6Þ ð21ÞConcentration of the solution leaving the generator is
given by:
X3 ¼ ðX1 þ DXÞ ð22ÞSolution temperature leaving the generator is given by:
T3 ¼ fðX3;P6Þ ð23ÞEnthalpy of the solution leaving the generator is given
by:
h3 ¼ h4 ¼ fðT3;X3Þ ð24ÞThe heater temperature of the generator is given by:
T14 ¼ T3 þ DT4 ð25ÞApproaching temperature in the generator is given by:
DT4 ¼ ðT14 � TWSgÞ þ ðTWSg � T3Þ ð26ÞDT4 ¼ ðT14 � TwsgÞ þ DTWSg ð27Þwhere, DTWSg is the generator wall superheat as shown inFig. 4.
From assumption, temperature of the vapor refrigerantleaving the generator is given by:
T5 ¼ ðT1 þ T3Þ � 0:5 ð28ÞCirculation Ratio (CR) is given by:
CR ¼ X1
ðX3 �X1Þ ð29Þ
Mass flow rate of weak solution leaving the absorber isgiven by:
_m1 ¼ _m2 ¼ X3
ðX3 �X1Þ� �
� _m8 ð30Þ
Figure 4. Shows thermal analysis of generator.
Mass flow rate of strong solution leaving the generatoris given by:
_m3 ¼ _m1 � _m5 ð31ÞTemperature of the strong solution entering the genera-
tor is given by:
T4 ¼ fðX3;P8Þ ð32ÞThe heat balance on the absorber is given by:
_Qa ¼ ð _m8 � h8Þ þ ð _m4 � h4Þ � ð _m1 � h1Þ ð33ÞThe heat balance on the condenser is given by:
_Qc ¼ _m5 � ðh5 � h6Þ ð34ÞTotal heat rejected from the system is given by:
Eo ¼ _Qa þ _Qc ð35ÞCoolant mass flow rate is given by:
_m13 ¼ _m10 ¼ _m11 ¼ _m12 ¼ Eo
ðCp� ðT13 � T10ÞÞ ð36Þ
The temperature of cooling water at absorber outlet isthen,
T11 ¼ T12 ¼_Qa
ðCp�M10Þ þ T10
� �ð37Þ
This temperature is currently related to the value pre-dicted in equation (15). The simulation is repeated till thelast value is near enough to the preliminary value as shownin Fig. 5.The heat balance in the generator is given by,
_Qg ¼ ð _m3 � h3Þ þ ð _m5 � h5Þ � ðm2 �h2Þ ð38ÞWall or surface temperature of the generator is given by:
TWsg ¼ T14 � ð _Qg �RÞ ð39ÞOnce the calculation of thermodynamic properties at all
the state points of the cycle is carried out, easily designspecifications can be obtained. The thermal load, logarith-mic mean temperature variation and conductance for theevaporator, condenser, absorber, and generator are deter-mined according to the subsequent formulation. Every unitis considered as a counter flow heat exchanger; because ofthis logarithmic mean temperature variation is used.
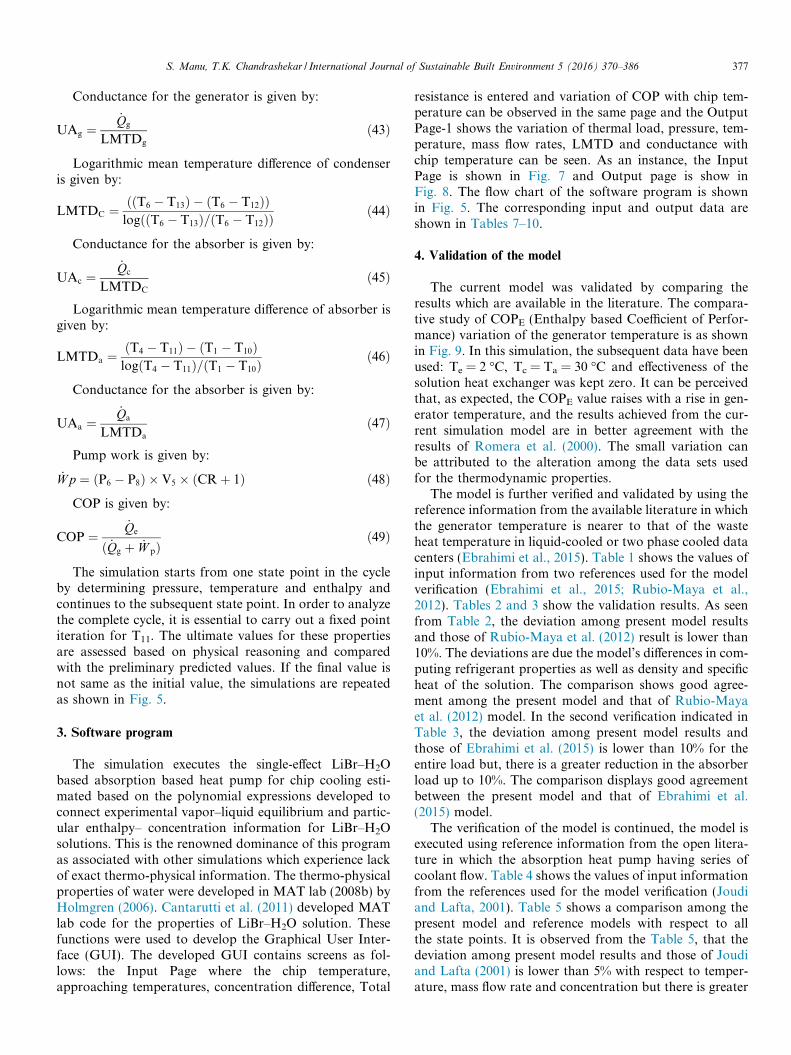
Typical Logarithmic mean temperature difference ofevaporator is as shown in Fig. 6 and is given by:
LMTDe ¼ ððT9 � T8Þ � ðTWe � T8ÞÞlogððT9 � T8Þ=ðTWe � T8ÞÞ ð40Þ
Conductance for the evaporator is given by:
UAe ¼_Qe
LMTDe
ð41Þ
Typical Logarithmic mean temperature difference ofgenerator is as shown in Fig. 6 and is given by:
LMTDg ¼ ððT14 � T3Þ � ðTWsg � T3ÞÞlogððT14 � T3Þ=ðTWsg � T3ÞÞ ð42Þ
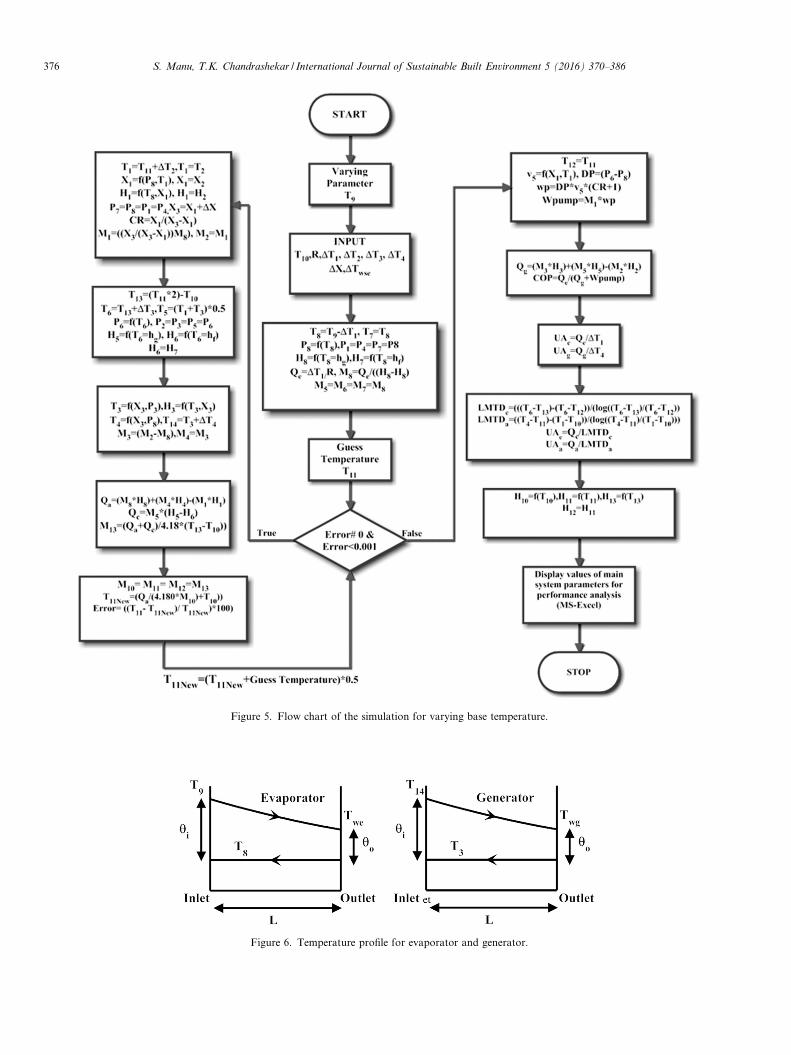
Figure 5. Flow chart of the simulation for varying base temperature.
Figure 6. Temperature profile for evaporator and generator.
376 S. Manu, T.K. Chandrashekar / International Journal of Sustainable Built Environment 5 (2016) 370–386
S. Manu, T.K. Chandrashekar / International Journal of Sustainable Built Environment 5 (2016) 370–386 377
Conductance for the generator is given by:
UAg ¼_Qg
LMTDg
ð43Þ
Logarithmic mean temperature difference of condenseris given by:
LMTDC ¼ ððT6 � T13Þ � ðT6 � T12ÞÞlogððT6 � T13Þ=ðT6 � T12ÞÞ ð44Þ
Conductance for the absorber is given by:
UAc ¼_Qc
LMTDC
ð45Þ
Logarithmic mean temperature difference of absorber isgiven by:
LMTDa ¼ ðT4 � T11Þ � ðT1 � T10ÞlogðT4 � T11Þ=ðT1 � T10Þ ð46Þ
Conductance for the absorber is given by:
UAa ¼_Qa
LMTDa
ð47Þ
Pump work is given by:
_W p ¼ ðP6 � P8Þ � V5 � ðCRþ 1Þ ð48ÞCOP is given by:
COP ¼_Qe
ð _Qg þ _W pÞð49Þ
The simulation starts from one state point in the cycleby determining pressure, temperature and enthalpy andcontinues to the subsequent state point. In order to analyzethe complete cycle, it is essential to carry out a fixed pointiteration for T11. The ultimate values for these propertiesare assessed based on physical reasoning and comparedwith the preliminary predicted values. If the final value isnot same as the initial value, the simulations are repeatedas shown in Fig. 5.
3. Software program
The simulation executes the single-effect LiBr–H2Obased absorption based heat pump for chip cooling esti-mated based on the polynomial expressions developed toconnect experimental vapor–liquid equilibrium and partic-ular enthalpy– concentration information for LiBr–H2Osolutions. This is the renowned dominance of this programas associated with other simulations which experience lackof exact thermo-physical information. The thermo-physicalproperties of water were developed in MAT lab (2008b) byHolmgren (2006). Cantarutti et al. (2011) developed MATlab code for the properties of LiBr–H2O solution. Thesefunctions were used to develop the Graphical User Inter-face (GUI). The developed GUI contains screens as fol-lows: the Input Page where the chip temperature,approaching temperatures, concentration difference, Total
resistance is entered and variation of COP with chip tem-perature can be observed in the same page and the OutputPage-1 shows the variation of thermal load, pressure, tem-perature, mass flow rates, LMTD and conductance withchip temperature can be seen. As an instance, the InputPage is shown in Fig. 7 and Output page is show inFig. 8. The flow chart of the software program is shownin Fig. 5. The corresponding input and output data areshown in Tables 7–10.
4. Validation of the model
The current model was validated by comparing theresults which are available in the literature. The compara-tive study of COPE (Enthalpy based Coefficient of Perfor-mance) variation of the generator temperature is as shownin Fig. 9. In this simulation, the subsequent data have beenused: Te = 2 �C, Tc = Ta = 30 �C and effectiveness of thesolution heat exchanger was kept zero. It can be perceivedthat, as expected, the COPE value raises with a rise in gen-erator temperature, and the results achieved from the cur-rent simulation model are in better agreement with theresults of Romera et al. (2000). The small variation canbe attributed to the alteration among the data sets usedfor the thermodynamic properties.
The model is further verified and validated by using thereference information from the available literature in whichthe generator temperature is nearer to that of the wasteheat temperature in liquid-cooled or two phase cooled datacenters (Ebrahimi et al., 2015). Table 1 shows the values ofinput information from two references used for the modelverification (Ebrahimi et al., 2015; Rubio-Maya et al.,2012). Tables 2 and 3 show the validation results. As seenfrom Table 2, the deviation among present model resultsand those of Rubio-Maya et al. (2012) result is lower than10%. The deviations are due the model’s differences in com-puting refrigerant properties as well as density and specificheat of the solution. The comparison shows good agree-ment among the present model and that of Rubio-Mayaet al. (2012) model. In the second verification indicated inTable 3, the deviation among present model results andthose of Ebrahimi et al. (2015) is lower than 10% for theentire load but, there is a greater reduction in the absorberload up to 10%. The comparison displays good agreementbetween the present model and that of Ebrahimi et al.(2015) model.
The verification of the model is continued, the model isexecuted using reference information from the open litera-ture in which the absorption heat pump having series ofcoolant flow. Table 4 shows the values of input informationfrom the references used for the model verification (Joudiand Lafta, 2001). Table 5 shows a comparison among thepresent model and reference models with respect to allthe state points. It is observed from the Table 5, that thedeviation among present model results and those of Joudiand Lafta (2001) is lower than 5% with respect to temper-ature, mass flow rate and concentration but there is greater

Figure 7. The Input Page of the GUI.
Figure 8. The Output Page of the GUI.
378 S. Manu, T.K. Chandrashekar / International Journal of Sustainable Built Environment 5 (2016) 370–386
reduction of coolant flow rate up to 16%. As seen fromTable 6, the deviation among present model results and
those of Joudi and Lafta (2001) is lower than 3.51% forthe entire load but there is a greater reduction of the absor-

Table 1Input data from the reference models.
Variable Ebrahimi et al.(2015)
Rubio-Maya et al.(2012)
Evaporator cooling load (kW) 201.29 201.29Generator temperature (kW) 84.8 84.8Condenser temperature (�C) 39.8 39.8Evaporator temperature (�C) 8.6 8.6Absorber temperature (�C) 35.5 35.5Solution heat exchanger
effectiveness (%)70.7 70.7
Table 4Input data from the reference models.
Variable Khalid Joudiet al.
Evaporator cooling load (kW) 211.1Approaching temperature of evaporator (DT1) (�C) 2.3Approaching temperature of absorber (DT2) (�C) 0.8000Approaching temperature of condenser (DT3) (�C) 2Approaching temperature of generator (DT4) (�C) 6Concentration difference (�C) 0.0140Mass flow rate of strong solution entering to the
absorber (kg/s)7.94
Concentration of weak solution entering to theabsorber (%)
55.2
Temperature of weak solution entering to the absorber(�C)
36.1
Mass flow rate of weak solution entering to thegenerator
7.94
S. Manu, T.K. Chandrashekar / International Journal of Sustainable Built Environment 5 (2016) 370–386 379
ber load up to 10%. The comparison results show goodagreement between the present model and that of Joudiand Lafta (2001) model.
Circulation ratio 46.2426Coolant water inlet temperature 30
5. Simulation results and discussion
This paper shows the results of the simulation programto examine the performance and design characteristics ofsingle effect LiBr–H2O based absorption refrigerationcycles. A typical (Chip temperature = 30 �C) absorptionheat pump is examined based on the developed model. Aset of input information is listed in Table 1. The corre-sponding output data are shown in Tables 2–4. The follow-ing results are obtained.
5.1. Effect of chip temperature on COP
Fig. 10 shows the system COP increasing from 0.7145 to0.842 as T9 (Chip temperature) is increased. This is due to adecrease in the CR from 5.0762 to 3.5273 as shown inFig. 11 and increase in T8 i.e. evaporator temperature from20 to 40 �C. Kaynakli and Kilic (2007) showed that theCOP increases as CR decreases. Eisa et al. (1986), Eisaand Holland (1986) and Garcıa Cascales et al. (2011)showed that the COP increases as evaporator temperatureincreases, and the best COP is obtained with T1 (Absorbertemperature) and T6 (Condenser temperature). Also, Eisa
Table 2Verification of present model by comparing simulation results of Rubio-Maya
Variable Present study
Generator heat flow rate (kW) 258.4151Condenser heat flow rate (kW) 205.8763Absorber heat flow rate (kW) 253.017Coefficient of Performance 0.7789
Table 3Verification of present model by comparing simulation results of Ebrahimi et
Variable Present study
Absorber heat flow rate (kW) 253.017Generator heat flow rate (kW) 258.415Condenser heat flow rate (kW) 205.8763Coefficient of Performance 0.7789
et al. (1986) and Eisa and Holland (1986) verified experi-mentally that, with an increase in evaporator temperaturethere is an improvement of COP. The results of Fig. 10the current model are in better agreement with results ofreferences (Kaynakli and Kilic, 2007; Eisa et al., 1986;Eisa and Holland, 1986; Garcıa Cascales et al., 2011).
5.2. Effect of chip temperature on thermal load
Fig. 12 demonstrates the variations of the thermal loadas a function of T9 at a constant approaching temperaturesand constant inlet cooling water temperature of 28 �C. Itcan be observed from this figure that when T9 increases,there is a decrease in generator load ( _qg) from 0.6996 to0.5936 kW, absorber load ( _qa) from 0.6830 to 0.5842 kW,condenser load ( _qc) from 0.5166 to 0.5095 kW and pump
work ð _W pÞ from 0.015 to 0.0081 W which can be observedfrom Fig. 11 this is due to decrease in Kaynakli and Kilic
(2007) showed that, ( _qg), ( _qa), ( _qc) and ð _W pÞ loads decreasesas CR decreases. Aphornratana and Sriveerakul (2007) ver-
et al. (2012).
Rubio-Maya et al. (2012) Deviation (%)
259.55 0.43213.37 3.51247.47 2.240.7755 0.43
al. (2015).
Ebrahimi et al. (2015) Deviation (%)
241.345 4.83246.207 4.95206.155 0.1350.8175 4.72

Table 5Verification of model by comparing results with those of Joudi and Lafta (2001).
Sl.No
Parameters Temperature (�C) Mass flow rate (kg/s) Concentration (%)
Joudi andLafta (2001)
PresentStudy
Deviation(%)
Joudi andLafta (2001)
PresentStudy
Deviation(%)
Joudi andLafta (2001)
PresentStudy
Deviation(%)
1 Chilled water inlet toevaporator
12.00 12.00 0.00 10.08 10.08 0.00
2 Chilled water outlet fromevaporator
8.00 8.00 0.00 10.08 10.08 0.00
3 Vapor evaporator toabsorber
5.70 5.70 0.00 0.089 0.0849 4.60
4 Weak solution outlet fromabsorber
33.10 33.1 0.00 8.03 7.756 3.41 54.60 54.23 0.67
5 Weak Solution outlet fromsolution pump
33.10 33.1 0.00 8.03 7.756 3.41 54.60 54.23 0.67
6 Weak Solution inlet tosolution heat exchanger
33.10 33.1 0.00 4.015 4.015 0.00 54.60 54.23 0.67
7 Weak solution inlet togenerator
66.53 66.53 0.00 4.015 4.015 0.00 54.60 54.23 0.67
8 Strong solution outlet fromthe generator
74.00 73.32 0.91 3.92 3.92 0.00 56.00 55.63 0.67
9 Inlet hot water to generator 85.00 85.00 0.00 14.10 14.10 0.0010 Outlet hot water from
generator80.00 80.00 0.00 14.10 14.10 0.00
11 Strong solution outlet fromHeat exchanger
39.17 39.17 0.00 3.93 3.93 0.00 56.00 55.63 0.67
12 Weak Solution outlet fromsolution sump
33.10 33.10 0.00 4.02 4.02 0.00 54.60 54.23 0.67
13 Intermediate Solution Inletto absorber
36.10 36.10 0.00 7.94 7.94 0.00 55.20 55.20 0.00
14 Vapor from generator tocondenser
38.00 69.92 84.0 0.089 0.0849 4.60
15 Condensate from condenserto expansion device
38.00 38.78 2.05 0.089 0.0849 4.60
16 Inlet cooling Water toabsorber
30.00 30.00 0.00 20.10 17.05 15.17
17 Outlet cooling water fromabsorber
33.39 33.67 0.83 20.10 17.05 15.17
18 Outlet cooling water fromcondenser
36.00 36.78 2.10 20.10 17.05 15.17
380 S. Manu, T.K. Chandrashekar / International Journal of Sustainable Built Environment 5 (2016) 370–386
ified experimentally that,( _qg), ( _qa), ( _qc) and ð _W pÞ loadsdecrease as CR decreases but evaporator load ( _qe) remainsconstant as 0.5000 kW this is due to constant in DT1 as 2 �C. Chaudhari et al. (1985) validated experimentally that(qe) nearly remains constant with a rise in evaporator tem-perature. The results of Figs. 11 and 12 are valid with thetheoretical and experimental of references (Kaynakli andKilic, 2007; Aphornratana and Sriveerakul, 2007;Chaudhari et al., 1985).
5.3. Effect of chip temperature on concentration
Fig. 13 demonstrates the variations of the concentrationas a function of T9 at a constant approaching temperaturesand constant in inlet cooling water temperature of 28 �C.There is a significant effect of T9 on the concentrationsand the weak solution coming from the absorber(Xw = X1) decreases from 50.76 to 35.27%, this is becauseof an increase in evaporator pressure (P8). Kaynakli andKilic (2007) and Chaudhari et al. (1985) experimentally
showed that, an increase in solution pressure (evaporatorpressure) decreases the concentration of the weak solutioncoming from the absorber. Similarly, there is a reduction inconcentration of strong solution entering from the genera-tor (Xs = X3) from 60.76% to45.27%, this is due to a con-stant concentration difference (DX = X3 � X1 = 0.1). Theresults of Fig. 13 are in good agreement with the theoreticaland experimental of references (Kaynakli and Kilic, 2007;Chaudhari et al., 1985).
5.4. Effect of chip temperature on system temperature and
pressure
Fig. 14 demonstrates variations of the pressure as afunction of T9 at constant approaching temperatures andconstant inlet cooling water temperature at 28 �C. As T9
increases, there is an increase in P8 from 0.0378 to0.1117 bar this is due to an increase in T8 from 20 to 48 �C. Joudi and Lafta (2001) showed that, as the evaporatortemperature increases there is an increase in evaporator

Table 6Verification of model by comparing simulation results of Joudi and Lafta (2001).
Variable Present study Joudi and Lafta (2001) Deviation (%)
Evaporator heat flow rate (kW) 211.1 211.1 0Absorber heat flow rate (kW) 261.92 285 8.09Generator heat flow rate (kW) 293.26 296.3 1.02Condenser heat flow rate (kW) 221.61 221.7 0.040Coefficient of Performance 0.7168 0.71 0.95
Table 7List of Input parameters for varying chip temperature.
Sl.No Parameter Symbol Value Unit
1 Base temperature T9 30 �C2 Total resistance R 0.002 �C/W3 Inlet cooling water Temperature T10 28 �C4 Approaching Temperature of Evaporator DT1 2 �C5 Approaching Temperature of Absorber DT2 2 �C6 Approaching Temperature of Condenser DT3 2 �C7 Approaching Temperature of Generator DT4 2 �C8 Concentration difference DX 0.1 %9 Guess Temperature (outlet of water from absorber) T11 50 �C10 Wall superheat in evaporator DTwse 1 �C
Table 8Thermodynamic properties (SI units) of state points corresponding to input data in Table 1.
State Points Temperature Pressure Enthalpy Mass flow rate Concentration(�C) (bar) (kJ/kg) (g/s) (%)
1 52.0 0.038 109.197 1.24 50.76172 52.0 0.370 109.197 1.24 50.76173 125.5 0.370 283.133 1.04 60.76004 71.7 0.038 283.133 1.04 60.76005 88.8 0.370 2632.91 0.206 74.0 0.370 117.384 0.207 28.0 0.038 117.384 0.208 28.0 0.038 2551.97 0.209 30.0 117.38410 28.0 221.878 6.5211 51.5 215.606 6.5212 51.5 215.606 6.5213 72.0 301.39814 127.515* 29.016* 126.1
* State point 15 and 16 corresponds to wall of evaporator and generator.
Table 9Design specifications (SI units) corresponding to input data in Table 1.
Evaporator Absorber Generator Condenser
LMTD (�C) 3.4761 22.2964 1.2886 8.4698UA (kW/�C) 0.1438 0.0311 0.5520 0.0611
Table 10Heat pump performance (SI units) corresponding to input data in Table 1.
Qe COP CR Wp Tmax Tmin Pmax Pmin Xmax Xmin Ta = T10 R UA(kW) (W) (�C) (�C) (bar) (bar) (%) (%) (�C) (kW/�C)
0.5 0.7145 5.0762 0.156 127.54 28 0.370 0.037 60.76 50.76 28 1.0440
S. Manu, T.K. Chandrashekar / International Journal of Sustainable Built Environment 5 (2016) 370–386 381

Figure 9. Comparison of COPE values.
Figure 11. Comparison of Wp and CR with the Chip temperature.
Figure 12. Variation of thermal load with the Chip temperature.
382 S. Manu, T.K. Chandrashekar / International Journal of Sustainable Built Environment 5 (2016) 370–386
pressure, but there is no effect on condenser pressure (P3)and remains constant as 0.3700 bar due to constant con-denser temperature (T6) as 74 �C. The results of Fig. 14are in good agreement with the reference (Joudi andLafta, 2001). Fig. 15 demonstrates the variation of temper-ature as a function of T9 at constant approaching temper-atures and constant inlet cooling water temperature of 28 �C, as T9 increases there is an decrease in heater temperature(T14) from 127.541 to 95.5493 �C this is due to a decrease inconcentration of the solution leaving the generator result-ing in a decrease in solution temperature of the strong solu-tion coming from the generator (generator temperature(T3)) from 125.541 to 93.54 �C. Romera et al. (2000)showed that, generator temperature is a function of solu-tion concentration. Similarly, there is a constant coolantoutlet temperature from the absorber (T11) as 51 �C, thisis due to a decrease in concentration of the solution leavingthe absorber at constant absorber temperature (T1) as 52 �C and constant DT2, but coolant outlet temperature fromthe condenser (T13) remains constant as 72 �C this is dueto constant condenser temperature (T6) and DT3. Theresults of Figs. 14 and 15 are in line with the reference(Romera et al., 2000).
Figure 10. Variation of COP with the Chip temperature.
5.5. Effect of chip temperature on mass flow rate
Fig. 16 demonstrates the variation of mass flow rate as afunction of T9 at a constant approaching temperatures andconstant inlet cooling water temperature of 28 �C. As T9
increases, there is an decrease in the mass flow rates ofweak solution coming from the absorber (m1) from1.2479 to 0.9484 g/s and a decrease in the mass flow ratesof strong solution coming from the generator (m3) from1.0425 to 0.7389 g/s this is due to decrease in CR.Florides et al. (2003) showed a decrease in the concentra-tion of weak solution decreases the circulation of (m1)and this resulted in a decrease in CR but there is anincrease in mass flow rate of refrigerant (m8) from 0.2054to 0.2095 g/s this because of an increase in the evaporatortemperature and an increase in latent heat (DH = H8 -� H7), increase in mass flow rate of coolant (water) (m10)from 6.5226 to 5.9466 g/s, this is due to a decrease in ( _qa)at constant ( _qc). The results of Fig. 16 are in good agree-ment with the references (Romera et al., 2000; Florideset al., 2003).
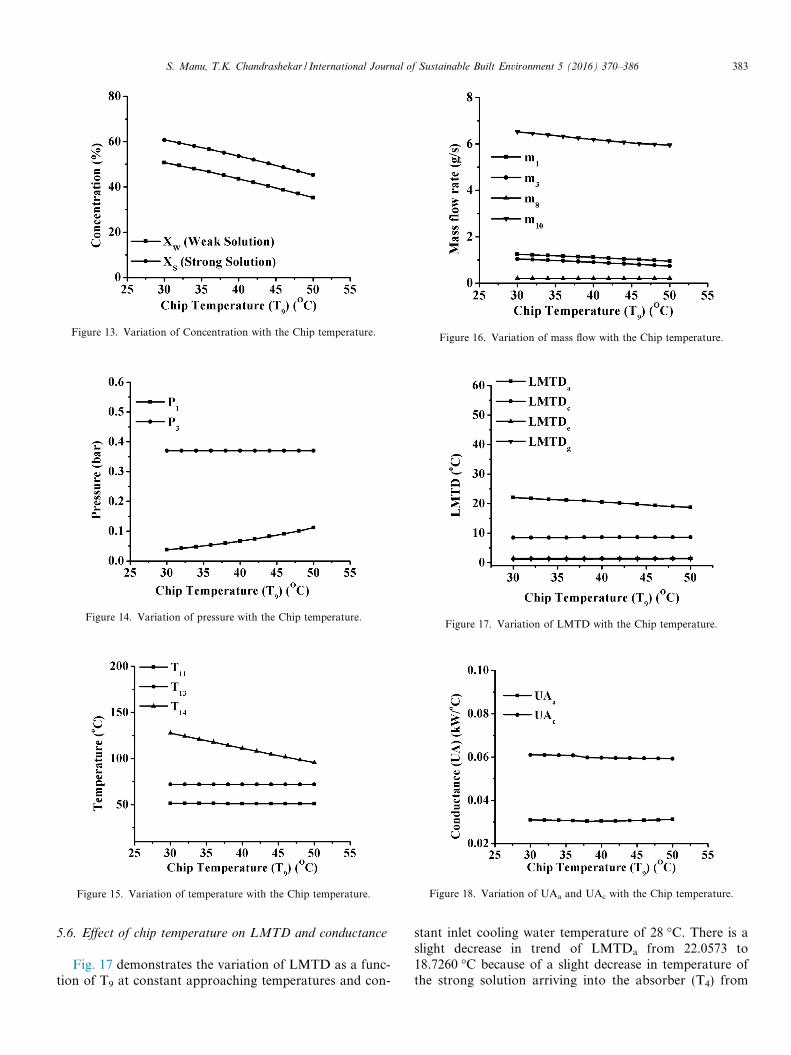
Figure 13. Variation of Concentration with the Chip temperature.
Figure 14. Variation of pressure with the Chip temperature.
Figure 15. Variation of temperature with the Chip temperature.
Figure 16. Variation of mass flow with the Chip temperature.
Figure 17. Variation of LMTD with the Chip temperature.
Figure 18. Variation of UAa and UAc with the Chip temperature.
S. Manu, T.K. Chandrashekar / International Journal of Sustainable Built Environment 5 (2016) 370–386 383
5.6. Effect of chip temperature on LMTD and conductance
Fig. 17 demonstrates the variation of LMTD as a func-tion of T9 at constant approaching temperatures and con-
stant inlet cooling water temperature of 28 �C. There is aslight decrease in trend of LMTDa from 22.0573 to18.7260 �C because of a slight decrease in temperature ofthe strong solution arriving into the absorber (T4) from

Figure 19. Variation of UAe and UAg with the Chip temperature.
384 S. Manu, T.K. Chandrashekar / International Journal of Sustainable Built Environment 5 (2016) 370–386
71.7224 to 65.2877 �C due to a decrease in strong solutionconcentration coming from the generator but a minorincrease in LMTDc from 8.469 to 8.598 �C this is due toconstant coolant outlet temperature from the absorber(T11) at constant T6 and T13 and LMTDg varies from1.1634 to 1.3184 �C but LMTDe remains constant as1.4 �C. Fig. 18 shows the variation in conductance of theabsorber (UAa) and conductance of the condenser (UAc)as a function of T9 at constant approaching temperaturesand constant inlet cooling water temperature of 28 �C. AsT9 increases, there is an increase in UAa from 0.0310 to0.0312 kW/�C and a decrease in UAc from 0.0610 to0.0593 kW/�C, this is due to a decrease in qa and qc,decrease in UAg from 0.6014 to 0.4503 kW/�C which canbe observed from Fig. 18, this is due to an increase in the( _qg) but conductance of the evaporator (UAe) remainsunchanged as 0.3466 kW/�C which can be observed fromFig. 19 because of constant ( _qe).
6. Conclusions
In this study, thermodynamic analysis of the single-stageLiBr–H2O vapor absorption heat pump for chip cooling inthe non existence of solution heat exchanger was per-formed and additionally, a user-friendly visual softwarepackage was developed in scope of this study. The modelis validated by using the values available in the literatureand indicates greater reduction in the absorber load. Thesimulation results exhibited that the COP values rise from0.7145 to 0.8421 with increasing chip temperature from30 �C to 50 �C and a decrease in generator, absorber andcondenser loads at constant evaporator load. Further, theCR value of the system showed its significance in decidingthe performance and design of the system. It is anticipatedthat operations on LiBr–H2O vapor absorption heat pumpfor chip cooling with respect to operating conditions, theaccurate and fast computation of performance and it ispossible to find suitable operating conditions and deter-mining the effect of chip temperature on performance,
loads, flow rates and conductance at fast rate with highaccuracy by the developed user-friendly GUI.
References
Agrawal, Tanmay, Anoop Kumar, Varun, 2015. Solar absorptionrefrigeration system for air-conditioning of a classroom building inNorthern India. J. Inst. Eng. (India): Series C. http://dx.doi.org/10.1007/s40032-015-0180-2.
Agyenim, F., Knight, I., Rhodes, M., 2010. Design and experimentaltesting of the performance of an outdoor LiBr/H20 solar thermalabsorption cooling system with a cold store. Sol. Energy 84, 735–744.
Alva, L., Gonzalez, J., 2002. Simulation of an air-cooled solar-assistedabsorption air conditioning system. J. Sol. Energy Eng. 124 (3), 276–282. http://dx.doi.org/10.1115/1.1487885.
Aphornratana, S., Sriveerakul, T., 2007. Experimental studies of a single-effect absorption refrigerator using aqueous lithium-bromide: effect ofoperating condition to system performance. Exp. Therm. Fluid Sci. 32,658–669. http://dx.doi.org/10.1016/j.expthermflusci.2007.08.003.
Aphornratana, S., Sriveerakul, T., 2007. Experimental studies of a single-effect absorption refrigerator using aqueous lithium–bromide: effect ofoperating condition to system performance. Exp. Therm. Fluid Sci. 32,658–669. http://dx.doi.org/10.1016/j.expthermflusci.2007.08.003.
Asdrubali, F., Grignaffini, S., 2005. Experimental evaluation of theperformances of a H2O-LiBr absorption refrigerator under differentservice conditions. Int. J. Refrig. 28, 489–497. http://dx.doi.org/10.1016/j.ijrefrig.2004.11.006.
Atilgan, Ibrahim, Aygun, Cevdet, 2014. Simulation of double effectabsorption refrigeration system. Prog. Sustainable Energy Technol. 2,685–703. http://dx.doi.org/10.1007/978-3-319-07977-6_45.
Atmaca, A., Yigit, A., 2003. Simulation of solar-powered absorptioncooling system. Renewable Energy 28, 1277–1293. http://dx.doi.org/10.1016/S0960-1481(02)00252-5.
Bin, Lu, Meng, W.J., Mei, Fanghua, 2012. Microelectronic chip cooling:an experimental assessment of a liquid-passing heat sink, a microchan-nel heat rejection module, and a microchannel-based recirculating-liquid cooling system. Microsyst. Technol. 18 (2), 341–352. http://dx.doi.org/10.1007/s00542-011-1397-5.
Bintoro, J.S., Akbarzadeh, A., Mochizuki, M., 2005. A closed-loopelectronics cooling by implementing single phase impinging jet andmini channels heat exchanger. Appl. Therm. Eng. 25, 2740–2753.http://dx.doi.org/10.1016/j.applthermaleng.2005.01.018.
Cantarutti, Bruno Ribeiro, 2011. Theoretical-experimental analysis of acooling system for absorption effect using simple Libr–H2O (MasterThesis). Federal university of Itajuba Institute of Mechanical Engi-neering Graduate program in Mechanical Engineering, http://saturno.unifei.edu.br/bim/0038210.pdf.
Chaudhari, S.K., Paranjape, D.V., Eisa, M.A.R., Holland, F.A., 1985. Astudy of the operating characteristics of a Water–Lithium Bromideabsorption heat pump. Heat Recovery Syst. 5 (4), 285–297. http://dx.doi.org/10.1016/0198-7593(85)90003-7.
Chiriac, Victor, Chiriac, Florea, 2010. Absorption refrigeration methodwith alternative water-ammonia solution circulation system formicroelectronics cooling. Proceedings of ITHERM 2010, 2nd–5thJune 2010, Las Vegas, NY. http://dx.doi.org/10.1109/ITHERM.2010.5501391.
Coggins, C., Gerlach, D., Joshi, Y., Fedorov, A., 2006 Compact, lowtemperature refrigeration of microprocessors. In: International Refrig-eration and Air Conditioning Conference at Purdue, Paper No. R064,West Lafayette, IN, July 15-20. http://docs.lib.purdue.edu/iracc/814/.
Cunha, Francisco Ricardo, Couto, H.L.G., Marcelino, N.B., 2007. Astudy on magnetic convection in a narrow rectangular cavity.Magnetohydrodynamics 43 (8), 421–428, http://adsabs.harvard.edu/abs/2007MHD....43..421C.
Ebrahimi, Khosrow, Jones, Gerard F., Fleischer, Amy S., 2015. Thermo-economic analysis of steady state waste heat recovery in data centers

S. Manu, T.K. Chandrashekar / International Journal of Sustainable Built Environment 5 (2016) 370–386 385
using absorption refrigeration. Appl. Energy 139 (1), 384–397. http://dx.doi.org/10.1016/j.apenergy.2014.10.067.
Eisa, M.A.R., Holland, F.A., 1986. A study of the operating parameters ina water-lithium bromide absorption cooler. Int. J. Energy Res. 10 (2),137–144. http://dx.doi.org/10.1002/er.4440100204.
Eisa, M.A.R., Devotta, S., Holland, F.A., 1986. Thermodynamic designdata for absorption heat pump systems operating on water-Lithiumbromide: Part I-cooling. Appl. Energy 24, 287–301. http://dx.doi.org/10.1016/0306-2619(86)90068-1.
Fan, X., Zeng, G., LaBounty, C., Bowers, J.E., Croke, E., Ahn, C.C.,Huxtable, S., Majumdar, A., Shakouri, A., 2001. SiGeC/Si superlatticemicrocoolers. Appl. Phys. Lett. 78 (11), 1580–1582. http://dx.doi.org/10.1063/1.1356455.
Florides, G.A., Kalogirou, S.A., Tassou, S.A., Wrobel, L.C., 2003. Designand construction of a LiBr–water absorption machine. EnergyConvers. Manage. 44, 2483–2508. http://dx.doi.org/10.1016/S0196-8904(03)00006-2.
Franca, Francis Henrique Ramos, dos Santos, Elizaldo D., Isoldi, LiercioA., Petry, Adriane P., 2014. A numerical study of combined convectiveand radiative heat transfer in non-reactive turbulent channel flows withseveral optical thicknesses: a comparison between LES and RANS. J.Braz. Soc. Mech. Sci. Eng. 36 (1), 207–219. http://dx.doi.org/10.1007/s40430-013-0075-1.
Franca, Francis Henrique Ramos, Zhao, Y., Molki, M., Ohadi, M.M.,Radermacher, R., 2002. Flow Boiling of CO2 with Miscible Oil inMicrochannels. ASHRAE Trans. 108 (1), 135–144, http://www.tech-street.com/products/1719532.
Garcıa Cascales, J.R., Vera Garcıa, F., Cano Izquierdo, J.M., DelgadoMarın, J.P., Martınez Sanchez, R., 2011. Modelling an absorptionsystem assisted by solar energy. Appl. Therm. Eng. 31, 112–118. http://dx.doi.org/10.1002/er.4440100204.
Grossman, Gershon, Zaltash, Abdi, 2001. ABSIM-modular simulation ofadvanced absorption systems. Int. J. Refrig. 24 (6), 531–543. http://dx.doi.org/10.1016/S0140-7007(00)00051-7.
Hewitt, Neil, Agyenim, Francis, Eames, Philip, Smyth, Mervyn, 2010. Areview of materials, heat transfer and phase change problem formu-lation for latent heat thermal energy storage systems (LHTESS).Renew. Sustain. Energy Rev. 14 (2), 615–628. http://dx.doi.org/10.1016/j.rser.2009.10.015.
Magnus Holmgren, 2006. http://in.mathworks.com/matlabcentral/fileex-change/9817-x-steam–thermodynamic-properties-of-water-and-steam.
Incopera, Dewitt, Bergman, Lavine, 2007. Fundamental of Heat and MassTransfer, 6th ed. John Wiley and Sons.
Iranmanesh, A., Mehrabian, M.A., 2012. Thermodynamic modelling of adouble-effect LiBr–H2O absorption refrigeration cycle. Heat MassTransfer 48 (12), 2113–2123. http://dx.doi.org/10.1007/s00231-012-1045-3.
Jiang, L., Mikkelsen, J., Koo, J.M., Huber, D., Yao, S., Zhang, L., Zhou,P., Maveety, J.G., Prasher, R., Santiago, J.G., Kenny, T.W., Goodson,K.E., 2002. Closed-loop electroosmotic microchannel cooling systemfor VLSI circuits. IEEE Trans. Comp. Packag. Technol. 25 (3), 347–355. http://dx.doi.org/10.1109/TCAPT.2002.800599.
Joudi, Khalid A., Lafta, Ali H., 2001. Simulation of a simple absorptionrefrigeration system. Energy Convers. Manage. 42, 1575–1605. http://dx.doi.org/10.1016/j.solener.2010.01.013.
Karno, Ali, Ajib, Salman, 2008. Thermodynamic analysis of an absorp-tion refrigeration machine with new working fluid for solar applica-tions. Heat Mass Transfer 45 (1), 71–78. http://dx.doi.org/10.1007/s00231-008-0408-2.
Kaynakli, Omer, Kilic, Muhsin, 2007. Theoretical study on the effect ofoperating conditions on performance of absorption refrigerationsystem. Energy Convers. Manage. 48, 599–607. http://dx.doi.org/10.1016/j.enconman.2006.06.005.
Kim, Yoon Jo, Joshi, YogendraK., Fedrov, Andrei G., 2008. An absorptionbased miniature heat pump system for electronics cooling. Int. J. Refrig.31, 23–33. http://dx.doi.org/10.1016/j.ijrefrig.2007.07.003.
Lee, S.F., Sherif, S.A., 2000. Thermodynamic analysis of a lithiumbromide/water absorption system for cooling and heating applications.Int. J. Energy Res. 25, 1019–1031. http://dx.doi.org/10.1002/er.738.
Marc, O., Lucas, F., Sinama, F., Monceyron, E., 2010. Experimentalinvestigation of a solar cooling absorption system operating withoutany backup system under tropical climate. Energy Build. 2, 774–782.http://dx.doi.org/10.1016/j.expthermflusci.2007.08.003.
Martinez, P., Pinazo, J., 2002. A method for design analysis of absorptionmachines. Int. J. Refrig. 25 (5), 634–639. http://dx.doi.org/10.1016/S0140-7007(01)00052-4.
Maydanik, Y.F., Vershinin, S.V., Korukov, M.A., Ochterbeck, J.M.,2005. Miniature loop heat pipes – a promising means for electronicscooling. IEEE Trans. Comp. Packag. Technol. 28 (2), 290–296. http://dx.doi.org/10.1109/TCAPT.2005.848487.
Mehrabian, M.A., Shahbeik, A.E., 2005. Thermodynamic modelling of asingle-effect LiBr–H2O absorption refrigeration cycle. Proc. Inst.Mech. Eng., Part E: J. Process Mech. Eng. 219 (3), 261–273. http://dx.doi.org/10.1243/095440805X8656.
Melograno, P., Santiago, J., Franchini, G., Sparber, W., 2009. Experi-mental analysis of a discontinuous sorption chiller operated in steadyconditions. 3rd International Conference Solar Air ConditioningProceedings, Palermo, Italy, http://www.researchgate.net/publica-tion/228607232_Experimental_Analysis_of_a_Discontinuous_Sorp-tion_Chiller_Operated_in_Steady_Conditions.
Mongia, R., Masahiro, K., DiStefano, E., Barry, J., Chen, W., Izenson,M., Possamai, F., Zimmermann, A., Mochizuki, M., 2006. Small scalerefrigeration system for electronics cooling within a notebookcomputer. ITHERM’06, Proceedings of the Tenth Intersociety Con-ference on Thermal and Thermo mechanical Phenomena in ElectronicsSystems, San Diego, USA, pp. 751–758. http://dx.doi.org/10.1109/ITHERM.2006.1645421.
Mostafavi, M., Agnew, B., 1996. The impact of ambient temperature onlithiumbromide/water absorption machine performance. Appl. Therm.Eng. 16 (6), 515–522. http://dx.doi.org/10.1016/1359-4311(95)00004-6.
Mudawar, Issam, 2011. Two-phase microchannel heat sinks: theory,applications, and limitations. J. Electron. Packag. 133, 1–31. http://dx.doi.org/10.1115/1.4005300.
Mudawar, Issam, Weilin, Qu, 2005. A systematic methodology foroptimal design of two-phase micro-channel heat sinks. J. Electron.Packag. 127, 381–390. http://dx.doi.org/10.1115/1.2056571.
Pal, A., Joshi, Y.K., Beitelmal, M.H., Patel, C.D., Wenger, T.M., 2002.Design and performance evaluation of a compact thermosyphon.IEEE Trans. Comp. Packag. Technol. 25 (4), 601–607. http://dx.doi.org/10.1109/TCAPT.2002.807997.
Pongtornkulpanich, A., Thepa, S., Amornkitbamrun, M., Butcher, C.,2008. Experience with fully operational solar-driven 10-ton LiBr/H2Osingle-effect absorption cooling system in Thailand. Renewable Energy33, 943–949. http://dx.doi.org/10.1016/j.renene.2007.09.022.
Qi, Zhaogang, Chen, Jiangping, Radermacher, Reinhard, 2009. Investi-gating performance of new mini-channel evaporators. Appl. Therm.Eng. 29 (17–18), 3561–3567. http://dx.doi.org/10.1016/j.applthermaleng.2009.06.011.
Ribeiro, Guilherme B., Barbosa Jr., Jader R., Prata, Alvaro T., 2010.Mini-channel evaporator/heat pipe assembly for a chip cooling vaporcompression refrigeration system. Int. J. Refrig. 33 (7), 1402–1412.http://dx.doi.org/10.1016/j.ijrefrig.2010.05.010.
Romera, R.J., Rivera, W., Best, R., 2000. Comparison of the theoreticalperformance of a solar air conditioning system operating with water/lithium bromide and an aqueous ternary hydroxide. Solar EnergyMater. Solar Cells 63 (3), 87–99. http://dx.doi.org/10.1016/S0927-0248(00)00058-1.
Rubio-Maya, Carlos, Pacheco-Ibarra, J.Jesus., Belman-Flores, Juan M.,Galvan-Gonzalez, Sergio R., Mendoza-Covarrubias, Crisanto., 2012.NLP model of a LiBreH2O absorption refrigeration system for theminimization of the annual operating cost.Appl. Therm.Eng. 37, 10–18.
Sedighi, K., Farhadi, M., Liaghi, M., 2007. Exergy analysis: parametricstudy on lithium bromide—water absorption refrigeration systems.

386 S. Manu, T.K. Chandrashekar / International Journal of Sustainable Built Environment 5 (2016) 370–386
Proc. Inst. Mech. Eng., Part C: J. Mech. Eng. Sci. 221 (11), 1345–1351.http://dx.doi.org/10.1243/09544062JMES604.
Sencana, Arzu, Yakut, Kemal A., Kalogirou, Soteris A., 2005. Exergyanalysis of lithium bromide/water absorption systems. RenewableEnergy 30, 645–657. http://dx.doi.org/10.1016/j.renene.2004.07.006.
Talbi, M.M., Agnew, B., 2000. Exergy analysis: an absorption refrigeratorusing lithium bromide and water as the working fluids. Appl. Therm.Eng. 20, 619–630. http://dx.doi.org/10.1016/S1359-4311(99)00052-6.
Tan, F.L., Tso, C.P., 2004. Cooling of mobile electronic devices usingphase change materials. Appl. Therm. Eng. 24, 159–169. http://dx.doi.org/10.1016/j.applthermaleng.2003.09.005.
Trutassanawin, Suwat, Groll, Eckhard A., Garimella, Suresh V., Cre-maschi, Lorenzo, 2006. Experimental investigation of a miniature-scalerefrigeration system for electronics cooling. IEEE Trans. Compon.Packag. Technol. 29, 678–687. http://dx.doi.org/10.1109/TCAPT.2006.881762.
Tuckerman, D.B., Pease, R.F.W., 1981. High-performance heat sinkingfor VLSI. IEEE Electron Devices Lett. 5, 126–129. http://dx.doi.org/10.1109/EDL.1981.25367.
Vargas, J.V.C., Horuz, I., Callander, T.M.S., Fleming, J.S., Parise, J.A.R.,1988. Simulation of the transient response of heat driven refrigeratorswith continuous temperature control: simulation de la reponsetransitoire des refrigerateurs utilisant une source de chaleur avecmaıÃtrise de la temperature en continu. Int. J. Refrig. 21 (8), 648–660.http://dx.doi.org/10.1016/S0140-7007(98)00009-7.
Yang, W.-J., Guo, K.H., 1987. Solar-assisted lithium-bromide absorptioncooling systems. Solar Energy Utilization NATO ASI Series 129, 409–423. http://dx.doi.org/10.1007/978-94-009-3631-7_19.
Yoon, Jung-In, Choi, Kwang-Hwan, Moon, Choon-Geun, Kim, YoungJin, Kwon, Oh-Kyung, 2003. A study on the advanced performance ofan absorption heater/chiller with a solution preheater using waste gas.Appl. Therm. Eng. 23, 757–767. http://dx.doi.org/10.1016/S1359-4311(03)00003-6.
Yoon Jo Kim, Yogendra K. Joshi, Andrei G. Fedorov, 2007. Design of anAbsorption Based Miniature Heat Pump System for Cooling of HighPower Microprocessors, IPACK2007-33245:69–77. DOI:10.1115/IPACK2007-3324.