Embed Size (px)
Citation preview

1
A SITUATIONAL ANALYSIS OF ELDERLY IN PUNE CITY
PROJECT LOCATION: RAMTEKDI (PUNE)
PROF. S. SIVA RAJU
With Assistance From
Ms. Chaitra Khole
Mr. Gandharva Pednekar
TATA INSTITUTE OF SOCIAL SCIENCES, MUMBAI
MARCH 2016

2
PREFACE
The emerging changes in the age and sex structure of India’s population will have a profound
impact on the demographic landscape and are expected to pose multifaceted developmental
challenges, especially for older persons. A rapid increase in the number of older persons as
well as their proportion in our population has led us to being more conscious of the many
social, economic, psychological and health problems of the older population. Several
researchers have attempted to focus on issues of the elderly from various surveys
commissioned for different purposes. However, data base focusing exclusively on the elderly
is very limited. Hence, Tata Institute of Social Sciences (TISS) in collaboration with Sanctus
Rehabilitation Care Foundation (SRCF), Pune and Tata Trusts, undertook a research project on
Situational Analysis of Elderly to initiate activities at local level, especially in urban context
by strengthening health care services. In this regard, generating scientific and systematic
information on the living conditions of the older persons in Ramtekdi was done by conducting
a situational analysis. Further, such a study is expected to help in providing information on
gaps in the existing services and also provide valuable clues for designing suitable
interventions to promote community and health care for elderly.
The review of the studies conducted so far on Situation of Elderly show that a lot of focus has
been centered on these issues in the West, while in India, negligible attempts have been made.
Given the complexities involved in understanding the issues and concerns affecting the well-
being of elderly, it is very important to initiate the process of understanding their needs and
evolve a plan of action to minimize their problems and enhance their quality of life. In this
regard, it is increasingly seen that organizations like Sanctus are focusing on various social
activities to improve the condition of the elderly within community, along with the
establishment of intervention projects in the areas of their operations.
Both quantitative and qualitative approaches were used in the study as it provides a
comprehensive and in-depth understanding of the socio-economic, demographic, housing and
health conditions of the elderly in the community. The data collection was carried out during
the period November 2015 to December 2015 and altogether 473 elderly residing in Ramtekdi
were covered in the survey.
The successful completion of the survey and this report under the title ‘Home Care for
Elderly’ would not have been possible were it not for the engagement of various individuals
and institutions that contributed at different stages of the project. We sincerely thank and
convey our deepest gratitude to all of them.
Prof. S. Parasuraman, Director, Tata Institute of Social Sciences (TISS) for granting necessary
permission to associate with this major project and for his constant encouragement.

3
Ms.Sugandhi Baliga, Tata Trusts for conceptualizing the study, entrusting it to us and also for
her valuable suggestions at various stages of the study. We are thankful to Mr. Nilesh Yadav,
Programme Associate Health, Tata Trusts for his constructive and active involvement in the
implementation of this study.
We are thankful to Mr. Devashish Bharat, Director (SRCF) and Dr (Mrs) Majushree Kumar,
Senior Advisor for his co-ordination, co-operation and administrative support throughout the
study. Thanks are due to all the Sanctus officials and all the other members who are associated
with the field activities.
Our sincere thanks to Dr.Nidhi Gupta, Assistant Professor, TISS for her academic support
during the study.
We appreciate all the TISS survey team for their sense of responsibility and commitment in
successfully carrying out the various research activities in the assigned field areas. We thank
the project staff: Mr. Gandharva Pednekar, Ms. Chaitra Khole, Ms. Shweta Singh and
Ms. Rashmee Sharma for their continual involvement in the execution of the project.
Our sincere thanks to the community workers in the respective study areas, various personnel
of government and non-governmental agencies and volunteers who assisted indifferent stages
of the field work.
Last but not the least, to all the community members of the study areas, who provided us with
the requisite information.
Mumbai
Dr. S. Siva Raju
March 2016
Tata Institute of Social Sciences

4
RESEARCH STAFF ASSOCIATED WITH THE SURVEY
Ms. Chaitra Khole, Project Officer
Mr. Gandharva Pednekar, Research Associate
Ms. Rashmee Sharma, Administrative Assistant
Ms. Shweta Singh, Research Assistant
Ms. Sakina Shaikh, Research Investigator
Field Investigators
Yogesh Sonawane
Amol Chavan
Mahendra Kharade
Ganesh Patil
Avijit Das

5
CONTENTS CHAPTER 1. INTRODUCTION .................................................................................................................... 9
CHAPTER 2: METHODOLOGY ................................................................................................................. 12
CHAPTER 3: DEMOGRAPHIC PROFILE .................................................................................................... 15
CHAPTER 4:HOUSING CONDITIONS AND LIVING ARRANGEMENTS....................................................... 19
CHAPTER 5. ECONOMIC CONDITIONS .................................................................................................... 26
CHAPTER 6: SOCIAL PROFILE .................................................................................................................. 35
CHAPTER 7: ACITIVITES OF DAILY LIVING (ADL) AND INSTRUEMENTAL ACTIVITIES OF DAILY LIVING ... 47
CHAPTER 8: PRIMARY CAREGIVER ......................................................................................................... 52
CHAPTER 9:HEALTH AND NUTRITION .................................................................................................... 56
Conclusions ............................................................................................................................................ 67
Action points for intervention: ............................................................................................................... 68
Social Mapping of Utility Agencies in Study Areas ................................................................................. 69
REFERNECES ........................................................................................................................................... 73
ANNEXURE ............................................................................................................................................. 78

6
List of Tables
Table 3.1 Distribution of Elderly by age group and gender……………………………………………………15
Table 3.2 Marital status of elderly age wise and gender wise……………………………………………….16
Table 4.1: Percentage distribution of living arrangement among the elderly household age
and gender-wise………………………………………………………………………………………………………………….19
Table 4.2: Percentage distribution of Type of dwelling…………………………………………………………20
Table 4.3: Percentage distribution of type of dwelling age wise and gender wise………………..21
Table 4.4 Percentage distribution of ownership and owner of house……………………………………21
Table 4.5: Percentage distribution of ownership of house among the elderly age wise and
gender wise…………………………………………………………………………………………………………………………22
Table 4.6: Percentage distribution of owner of the house among the elderly household age
wise and genderwise……………………………………………………………………………………………………………22
Table 4.8: Percentage distribution of elderly having a separate room age and gender wise…24
Table 4.9: Percentage distribution of elderly using toilet facilities age and gender wise……….24
Table 4.10: Percentage distribution of elderly using bathroom facilities age and gender
wise……………………………………………………………………………………………………………………………………..25
Table 5.1: Percentage distribution of chief earner of the house among the elderly
household……………………………………………………………………………………………………………………………27
Table 5.2: Percentage distribution of chief earner of the house among the elderly household
age wise and gender wise…………………………………………………………………………………………………….27
Table 5.3: Percentage distribution of elderly who have planned to meet their old age
expenses………………………………………………………………………………………………………………………………29
Table 5.4: Percentage distribution of source of income of the elderly age wise and gender
wise……………………………………………………………………………………………………………………………………..30
Table 5.5: Percentage distribution of income source of the elderly age and gender
wise……………………………………………………………………………………………………………………………….…...31
Table 5.6: Percentage distribution of income situation of the elderly age and gender wise….32

7
Table 5.7: Percentage distribution of Elderlys expectation to meet their expenses age and
gender wise…………………………………………………………………………………………………………………………33
Table 5.8 Percentage distribution of reasons to find work
opportunities………….………………………………………………………………….………………………………………..37
Table 5.9: Percentage distribution of future living of the elderly age and gender wise………...35
Table 6.1: Percentage distribution of activities elderly are engaged in………………………………….35
Table 6.2: Percentage distribution of activities elderly are engaged in age and gender wise.36
Table 6.3: Percentage distribution of activities elderly spend most of the time in age and
gender wise…………………………………………………………………………………………………………………………37
Table 6.4: Percentage distribution of social activities elderly are engaged in age and gender
wise……………………………………………………………………………………………………………………………………..38
Table 6.5: Percentage distribution of elderlys involvement in decision making…………………….39
Table 6.6: Percentage distribution of Issues faced by the elderly age and gender wise…………41
Table 6.7: Percentage distribution of awareness and utilization by the elderly age and gender
wise……………………………………………………………………………………………………………………………………..44
Table 6.8: Percentage distribution of awareness and registration of schemes by the elderly..45
Table 7.1: Percentage distribution of ADL of the elderly age and gender wise……………………..48
Table 7.2: Scoring of the ADL scores………………………………………………………………………..........48
Table 7.3: Percentage distribution of IADL of the elderly age and gender wise…………………….50
Table 8.1: Percentage distribution of time spent by the caregiver age and gender wise………53
Table 9.1: Percentage distribution of type of disability of the elderly…………………………………..56
Table 9.2: Percentage distribution of self-rate health of the elderly age and gender wise…….57
Table 9.3: Percentage distribution of acute morbidities faced by the elderly age and gender
wise……………………………………………………………………………………………………………………………………..59
Table 9.4: Percentage distribution of chronic morbidities faced by the elderly age and gender
wise……………………………………………………………………………………………………………………………………..60

8
Table 9.5: Percentage distribution of nutrition screening checklist among the elderly…………62
Table 9.7: Percentage distribution of total score of nutrition screening checklist among the
elderly age and gender wise…………………………………………………………………………………………………64
Table 9.8: Percentage distribution of BMI of elderly age and gender wise……………………………65
List of Figures
Figure 2.1: Map of Pune……………………………………………………………………………..13
Figure 3.1: Percentage distribution of elderly by gender………………………………………..15
Figure 4.1: Percentage according to type of dwelling……………………………………………19
Figure 5.1: Percentage distribution of chief earner of the house among the elderly household
age and genderwise…………………………………………………………………………………….29
Figure 6.1:Percentage distribution of issues faced by the elderly…………………….………...38
Figure 7.1: Distribution of ADL scores……………………………………………………………..45
Figure 9.1: Type of disability………………………………………………………………………….53
Figure 9.2: Percentage distribution of self-rated health of elderly- age and genderwise……54

9
CHAPTER 1. INTRODUCTION
India, the world’s second most populous country, has experienced a dramatic demographic
transition in the past 50 years, entailing almost a tripling of the population over the age of 60
years (Government of India, 2011). This pattern is poised to continue. It is projected that the
proportion of Indians aged 60 and older will rise from 7.5 percent in 2010 to 11.1 percent in
2025 (United Nations Department of Economic and Social Affairs [UNDESA], 2008). This is
a small percentage point increase, but a remarkable figure in absolute terms. According to
UNDESA data on projected age structure of the population (2008), India had more than 91.6
million elderly in 2010 with an annual addition of 2.5 million elderly between 2005 and 2010.
The number of elderly in India is expected, by 2050, to surpass the population of children
below 14 years (Raju, 2006).
Population ageing is an important emerging demographic phenomenon in India, warranting a
strong multi-sectoral policy and programme response to deal with many significant
implications for the elderly in particular and society at large. Longevity by itself is to be
celebrated but for the increasing vulnerabilities of the elderly arising out of poverty, income
insecurity, illiteracy, age related morbidity, feminisation, dependency and decreasing support
base. In most of the western countries, advanced stages of development preceded population
ageing but the same is not true for many developing and middle-income countries, including
India. In India with majority of its population aged less than 30, the problems and issues of its
grey population has not been given serious consideration. To reap the advantage of
demographic dividend, the attention is mainly on the children and the youth and fulfillment of
their basic needs for proper development. Also the traditional Indian society and the age-old
joint family system have been instrumental in safeguarding the social and economic security
of the elderly in the country. However, with the rapid changes in the social scenario and the
emerging prevalence of nuclear family set-ups in India in recent years the elderly people are
likely to be exposed to emotional, physical and financial insecurities in the years to come.
This has drawn the attention of the policy makers and administrators at central and state
governments, voluntary organizations and civil society. Further, India is presently going
through a phase of demographic paradox wherein it has to capitalise on the demographic
window of opportunity by investing in youth and at the same time focus on an increasing
elderly population.
Ageing diminishes the capacity to work and earn. “A reduced capacity for income generation
and a growing risk of serious illness are likely to increase the vulnerability of elders to fall
into poverty, regardless of their original economic status…” (Lloyd-Sherlock.2000) The
presence of elderly make its implication on the production function within the household and

10
thus on overall work effort that reflects in income and production (Schwarz, 2003). In other
words, in most of the cases, the presence of the elderly creates distortions in the production
function as they are physically unfit to work. This can have direct effect on the wellbeing of
the households that reflects in the poverty among elderly. The inability in the initial
endowment of an individual that deteriorates as they go up in the life cycle make them more
vulnerable and puts them a position in which they fail in risk management and maintenance of
a cope-up strategy in maintaining the level of living conditions (Zwi, 1993). This makes the
elderly more dependent on others for their needs resulting in higher levels of economic
insecurity and deprivation. In the West most of the elderly are under the social safety net, the
incidence and magnitude of the economic insecurity are high in the case of developing
countries (Helpage International, 2003; World Bank, 2001).
Physical and health risks are very high among the elderly. The precise implications of
population aging for future levels of health and health care utilisation depend on whether the
increases in life expectancy experienced in general are accompanied by an increase or
decrease in health problems in later life (Gruenberg, 1977; Kramer, 1980; Manton, 1982). The
increased health care expenditure in household with elderly in the developing world has lead
to deprived access to health treatment to the elderly (Helpage International, 2005). The studies
highlight high rates of deprivation of good health and lack of care in the developing and
transitional economies (Balkov, 2005; Ferrer, 2002; WHO, 2004).
A few important characteristics of the elderly population in India are noteworthy. Of the 7.5
percent of the population who are elderly, two-thirds live in villages and nearly half are of
poor socioeconomic status (SES) (Lena et al., 2009). Half of the Indian elderly are
dependents, often due to widowhood, divorce, or separation, and a majority of the elderly are
women (70 %) (Rajan, 2001). Of the minority (2.4 %) of the elderly living alone, more are
women (3.49 %) than men (1.42 %) (Rajan and Kumar, 2003). The majority of the Indian
elderly work in the informal sector with low levels of wages and deficient working conditions
and this has also put them in a state of deprivation, vulnerability and distress in old age in
terms of both health and economic security (Helpage International, 2002). Studies have shown
a gradual decline in the standard of life of the aged with high rates of dependency and lack of
basic needs (Rajan Mishra and Sarma, 1999; Rajan, 2004; Alam, 2007). The occurrence of
economic, health and social insecurities are becoming common (Dey, 2000; World Bank,
2001; Priya, 2003; Alam, 2007).
The belief that children will take care of the parents in the old age is eroding in India where
the family size has been cut down as a result of the demographic process (Dandelkar, 1996).

11
The situation in the urban areas shows a rejection of older people by the next generation and
this is spreading to rural areas (Desai, 1985). In the nuclear family setting, the positions of the
aged become more vulnerable and are treated as a burden to the family (Nayar, 1992). The
social negligence of the aged occurs due to cultural, social and economic relations within the
society and its coexistence with demographic development (Achenbaum, 1978). This
changing dynamic that starts within the family and society can make the elderly insecure
(Alter G et al 1996) through intergenerational imbalance (Hareven and Adams, 1996). These
changing dynamics can affect the living arrangements and social protection system and make
the elderly more insecure.
This report is an outcome of the survey carried out in Pune from November to December 2015
by TISS for SRCF, Pune. It consists of various sections. The first section comprises of
introduction, the second explains the methods used in the study, third starts with social profile,
this is followed by analysis and concluding with conclusion and recommendations. The last
section of the report explains about Social Mapping in which various utility agencies in
Ramtekdi area are plotted in specially prepared maps with help of geographical information
system (GIS).
Objectives of the study:
A rapid increase in the number of older persons as well as their proportion in our population
has led to us to being more conscious of the many social, economic, psychological and health
problems of the older population. One such initiative is to work at locality level especially in
urban context by strengthening community care services. In this regard, generating scientific
and systematic information on the living conditions of the older persons in selected localities
by conducting a situational analysis is vital. Further, such a study helps in providing
information on gaps in the existing services and also valuable clues for designing suitable
interventions to promote care for the elderly.
The specific objectives of the study are as follows:
- Understand the living conditions of the older population in the selected locality in
Pune, in terms of social, economic, demographical, cultural and health aspects with a
view to know their expectations from various stakeholders towards their care
- Know the programmes and services for the care of the older population in the selected
locality in terms of old age homes, day care centres, senior citizen’s clubs, old age
pension schemes and other such programmes
- Develop locality level action plan to build enriching care for elderly in order to
strengthen the need based services care for them,

12
- Develop strategy to enhance inclusion of senior citizens in the community in order to
increase their participation
CHAPTER 2: METHODOLOGY
About SRCF
SRCF Rehabilitation Care Foundation (SRCF) was born out of founding team’s personal
experience. The lack of proper service to patients with long term medical needs set us on a
passionate course to make a difference. SRCF works to provide quality, trained and supervised
care to patients and reduce total costs of care. SRCF is registered not for profit under Section
8 (formerly Section 25) of the Companies Act 2013.The services provided include Nursing
Care, Physiotherapy, Occupational Therapy, Speech Therapy, Diet Planning etc. They have
evolved and follow medical protocols for patient management with appropriate documentation
to monitor progress of our patients. The main are focus is on reducing the total costs of care
while focusing on prevention, infection control, identification of early warning signs, reduce
the costs repeat hospitalization and emergency care costs. Through various partners they
provide medicines, surgical and other products for use by such long term patients at
discounted pricing for both buying and renting, also developing cross subsidization in the
pricing of our services to further increase the accessibility of services. Additionally identify,
train and employ people from socially and economically weaker sections as Senior Citizen
Support Assistants, Home Care Medical Assistants and Nurses who under supervision of our
medical team provide nursing and rehab support to patients and work with foundations/
government vocational colleges to develop and deliver training to create a skilled work force.
In the current study a descriptive approach was used with both qualitative and quantitative
methods in Ramtekdi area in Pune city. All elderly members aged 60 years and above were
interviewed. The field work was carried out during the period November 2015 till December
2015 and a total of 473 elderly interviews were conducted.
The state Maharashtra is selected for this study as it ranks fifth in terms of highest numbers of
elderly in the country according to the Census 2011 Pune city was selected as the study area
which is one of the most famous and fast growing cities of India. It is the second largest city
in Maharashtra. Pune city is governed by Municipal Corporation which comes under Pune
Metropolitan Region. As per Census India, population of Pune in 2011 is 3.1 million; the rise

13
in the population is due to various factors like job, work space, education, healthcare
treatment, real estate investment, suitable weather, better quality of life etc.
Figure 2.1 Map of Pune showing study area
(Source: http://maps.newkerala.com/Pune-city-map.php#.VNes9_mSwqI)
Study area: Ramtekdi
Ward No. 90

14
Location:
Slum in S.No. 109 Hadapsar, Blind School, Ramtekadi Mandir, Slum in Hadapsar S.No. 110,
SRP Group l(part), Ramtekadi Industrial Estate, Nanawati nagar
North:
From the intersection of road on Eastern side of AIPT and Pune Solapur road towards East by
Pune Solapur road to meet Pune Miraj railway line
East:
From the intersection of Pune Miraj railway line and Pune-Solapur road towards South East
by Pune Miraj railway line to meet old PMC limit near Hadapsar S.No.76
South:
From the intersection of old PMC limit and Pune Miraj railway line near Hadapsar S.No.76
towards West by old PMC limit to meet nalla and then to the South by the nalla to meet
boundary between Hadapsar Mohammadwadi and then to the West by boundary between
Hadapsar Mohammadwadi to meet boundary of Wanwadi and then to the North by boundary
between Mohammadwadi Wanwadi to meet boundary between SRP group no. 1 and 2 and
then to the West by the boundary between SRP group no. 1 and 2 to meet the road on Western
side of Nanawati nagar
West:
From the intersection of road on the Western side of Nanawatinagar and boundary between
SRP group 1 and 2 towards North by the road on the Western side of Nanawatinagar and
further by the road going towards commandant residence of SRP group no. 1 to meet road on
the South side of AIPT and then to the East by the road on the Southern and further Eastern
side of AIPT to meet Pune - Solapur road.
A census approach was applied for data collection wherein all the households of the area were
covered and data was collected where the respondents were ready o participate in the study.
The tool used for conducting the survey was a close-ended interview schedule. The interviews
were administered on Tablets by a set of trained investigators using the application ‘Collect’.
‘Collect’ is a smart phone based data collection tool to capture data from the field in realtime,
monitor progress of projects and make quick decisions based on real time, accurate
data.(socialcops.com/collect)
The Schedule collected basic information on the Demographic profile, Housing conditions
and Living Arrangements of elderly, Economic Conditions, Socio-Cultural Engagement and
Subjective Health and Nutrition Assessment. An interviewer’s Manual was designed that

15
contained techniques and procedures for conducting and completing the interviews. It
explained the questions and procedures for soliciting the responses and quality checks for
ensuring consistency of responses. Field investigators involved in data collection were trained
to use and administer the questionnaire on tablets. Cross-sectional analysis of data was
conducted using Software Package used for Statistical Analysis (SPSS). The collected data
was analyzed age wise and gender wise.
CHAPTER 3: DEMOGRAPHIC PROFILE
Age-gender distribution
The elderly population cannot be considered a homogenous group with similar needs and
expectations. Age specific requirements and services are just as important as the varied needs
of the males and females. Therefore, the age of the respondents were categorized into three
age groups, namely, 60-64 years, 65-69 years and those who were 70 years or above.
Table 3.1 Distribution of Elderly by age group and gender
Male Female Total
Percent Number Percent Number Percent Number
42.5 201 57.5 272 100 473
Age (in years)
60-64
12.6
60
22.1
105
34.7
165
65-69 16.4 78 15.0 71 31.4 149
70 13.3 63 20.0 96 33.3 159
Figure 3.1: Percentage distribution of elderly by gender

16
Out of the total sample of 473 about 42.5 percent of them are males and 57.5 percent females.
The age distribution indicates that young old comprises of 34.7 percent followed by middle
old/ old-old of another one third (31.4 %). Those who are very old (70+ years) constituted
almost one third (33.3 %) in the sample.
Marital status
Marital status is considered important in determining psychological and emotional health of
the people in later years. Presence of spouse might be a significant source of support in later
years of life. A marriage relationship can provide affection and a sense of belonging. This
valuable support is lost upon widowhood. Table 3.2 shows percent distribution of respondents
by gender, age and marital status.
Table 3.2 Marital status of elderly age wise and gender wise
Marital
Status
60-64 age group
(n=165)
65-69 age group
(n= 149)
70+ age group
(n= 158)
Total
M
(n=60)
F
(n=
105)
T
(n=
165)
M
(n=
78)
F
(n=
71)
T
(n=
149)
M
(n=
63)
F
(n=
95)
T
(n=
158)
M F T
Married 86.7
(52)
50.5
(53)
63.6
(105)
79.5
(62)
31.0
(22)
56.4
(84)
73.0
(46)
16.7
(16)
39.0
(62)
79.6
(160)
33.4
(91)
53.0
(251)

17
Widowed 11.7
(7)
44.8
(47)
32.7
(54)
16.7
(13)
66.2
(47)
40.3
(60)
27.0
(17)
81.2
(78)
59.7
(95)
18.4
(37)
63.2
(172)
44.1
(209)
Others 1.7
(1)
4.8
(5)
3.6
(6)
3.9
(3)
2.8
(2)
3.4
(5)
0.0
(0)
2.1
(2)
1.3
(2)
2.0
(4)
3.3
(9)
2.7
(13)
Table 3.2 represents the marital status of elderly by age and gender. Out of the total sample,
over a half (53 %) of the elderly are married, followed by 44.1 percent widowed. A few (2.7
%) are separated, deserted or never married.
The marital status of 60-64 year indicates 63.6 percent of them were married followed by 32.7
percent who were widowed. When gender was taken into consideration, majority (79.5 %) of
the males are married as compared to 50.5 percent females. Opposite trend was noticed with
respect to widowhood, wherein 44.8 percent elderly women are widowed compared to males
(11.7 %). About 5 percent females were separated, deserted or single.
In the second (65-69 years) and third age group (70+ years) respectively; about 56.4 percent
and 39 percent elderly were married, 40.3 percent and 59.7 percent were widowed and 3.4
percent were separated, deserted or single. Considering only the 65-69 years age group about
79.5 percent males and 31 percent females were married, 16.7 percent males and 66.2 percent
females were widowed. In the last age group it was seen that 73 percent elderly males and 17
percent females were married. This was followed by 27 percent males and 81 percent females
were widowed.

18

19
CHAPTER 4:HOUSING CONDITIONS AND LIVING
ARRANGEMENTS
The family life of the elderly plays a pivotal role in the quality of later life. To assess their
housing conditions and living arrangements is pertinent in order to gauge at the comfort and
support that the elderly experience. Variable such as living arrangements, type of dwelling and
owner of house, comfort using toilet and bathroom facilities, are discussed in this chapter.
Living arrangements:
Marital status has a direct bearing on the living arrangements of the elderly. This trend has
important implications for housing needs and the demand for institutional care. With the
decline in the proportion of the elderly living with relatives likely to continue, there will
probably be a greater need for the provision of social support and health services by the
community or other public sources.
Table 4.1: Percentage distribution of living arrangement among the elderly household age
and gender-wise
Living
arrangements
60-64 years 65-69 years 70+ years Total
M F T M F T M F T M F T
With spouse 26.7
(16)
13.3
(14)
18.2
(30)
20.5
(16)
8.5
(6)
14.8
(22)
22.2
(14)
5.2
(5)
11.9
(19)
22.8
(46)
9.1
(25)
15.0
(71)
Alone
3.3
(2)
13.3
(14)
9.7
(16)
6.4
(5)
15.5
(11)
10.7
(16)
4.8
(3)
15.6
(15)
11.3
(18)
4.9
(10)
14.7
(40)
10.5
(50)
With spouse
and children
53.3
(32)
35.2
(37)
41.8
(69)
22.5
(16)
51.3
(40)
37.6
(56)
42.9
(27)
11.5
(11)
23.9
(38)
37.3
(75)
32.3
(88)
34.4
(163)
With children 10.0
(6)
28.6
(30)
21.2
(35)
11.5
(9)
33.8
(24)
22.1
(33)
25.4
(16)
39.6
(38)
34.0
(54)
15.4
(31)
33.4
(91)
25.7
(122)
Others 8.3
(5)
8.4
(10)
8.3
(15)
10.2
(8)
19.7
(14)
14.9
(22)
4.8
(3)
21.5
(27)
13.1
(30)
7.9
(16)
18.7
(51)
14.1
(67)

20
It is observed that with rise in age, the number of elderly living with their spouse decreases
gradually. Some of the elderly lived alone; this category included more females as compared
to that of males in all the three age group. Overall, about 34.4 percent elderly lived with their
spouse and children, 25.7 percent with their children, 15 percent with their spouse, 10.5
percent alone, 7 percent with their married daughter, 3 percent relatives and 4 percent with
others which all constituted to 10.9 percent which was later clubbed into Others.
In the 60-64 age group, 41.8 percent of the elderly lived with their spouse and children. This
was then followed by 21.2 percent who lived with their children, 18.2 percent with spouse and
9.7 percent alone. Gender-wise comparison showed that more males (26.7 %) lived with their
spouse alone than females (13.3 %), the reason for this can be due to higher number of
widowed women than men which also results in more number of females (13 %) staying alone
than males(3 %). About 53.3 percent and 35.2 percent elderly males and females lived with
their spouse and children and 10 percent males and 29 percent females lived with their
children respectively. A similar trend is observed in the other two age groups.
Type of Dwelling
Table 4.2: Percentage distribution of Type of dwelling
Percent Number
Independent bungalow
Flat in the building
Tenement with a common toilet
Hut in the slum
Others
2.3
23
51.6
22.4
0.6
11
109
244
106
3
Figure: 4.1Percentage distribution According to Type of Dwelling

21
More than 50 percent of the elderly lived in tenements with a common toilet. About 23 percent
lived in flats in a building and 22 percent in a hut in the slum respectively. The others
comprised of the elderly who lived on streets.
Table 4.3: Percentage distribution of type of dwelling age wise and gender wise
Type of
dwelling
60-64 years 65-69 years 70+ years Total
M F T M F T M F T M F T
Flat in the
building
26.7
(16)
21.9
(23)
23.6
(39)
32.1
(25)
14.1
(10)
23.5
(35)
22.2
(14)
21.9
(21)
22.0
(35)
27.0
(55)
19.3
(54)
23.1
(109)
Tenement
with a
common
toilet
51.7
(31)
54.3
(57)
52.3
(88)
48.7
(38)
57.7
(41)
53
(79)
41.3
(26)
53.1
(51)
48.4
(77)
47.2
(95)
55.0
(149)
51.1
(244)
Hut in slum
locality
18.3
(11)
21.9
(23)
20.6
(34)
17.9
(14)
25.4
(18)
21.5
(32)
33.3
(21)
19.8
(19)
25.2
(40)
19.2
(46)
22.3
(60)
20.7
(106)
The locality that was selected for the situational analysis comprised of people of the middle
and low middle income group. Majority of the elderly in all the 3 age groups resided in
tenement with a common toilet (‘chawls’) i.e. 52.3 percent, 53 percent and 48.4 percent
respectively.
Ownership of household
Table 4.4 Percentage distribution of ownership and owner of house

22
Ownership of the house Percent Number
Rented
Owned
5.9
94.1
28
445
Owner of the house
Parents
Self
Son
Daughter
Grandchildren
Relatives
Others
6.1
62.8
12.5
3.2
0.6
2.7
12.1
29
297
59
15
3
13
57
The survey collected information on ownership of the household in order to gauge at the
dependency ratio of elderly for a place to live. Overall, 94.1 percent of elderly live in houses
that are owned and the remaining 5.7 percent in rented households. Most of the houses were
owned by the elderly themselves (63 %) followed by their son (12.5 %)
Table 4.5: Percentage distribution of ownership of house among the elderly age wise and
gender wise
Ownership
of the
house
60-64 years 65-69 years 70+ years Total
M F T M F T M F T M F T
Rented 3.3
(2)
7.6
(8)
6.1
(10)
2.6
(2)
5.6
(4)
4.0
(6)
9.5
(6)
6.2
(6)
7.5
(12)
5.1
(10)
6.4
(18)
5.7
(28)
Owned 96.7
(58)
92.4
(97)
93.9
(155)
97.4
(76)
94.4
(67)
96
(143)
90.5
(57)
93.8
(90)
92.5
(147)
94.8
(191)
93.5
(254)
94.1
(445)
Table 4.6: Percentage distribution of owner of the house among the elderly household age
wise and genderwise
Owner of 60-64 years 65-69 years 70+ years TOTAL

23
the house
M F T M F T M F T M F T
Self 90.0
(54)
48.6
(51)
63.6
(105)
78.2
(61)
50.7
(36)
65.1
(97)
66.7
(42)
55.2
(53)
59.7
(95)
78.3
(157)
51.5
(140)
64.9
(297)
Son 1.7
(1)
12.4
(13)
8.5
(14)
11.5
(9)
14.1
(10)
12.8
(19)
11.1
(7)
19.8
(19)
16.4
(26)
8.1
(17)
15.4
(42)
11.7
(59)
Others 8.3
(5)
11.4
(12)
9.8
(17)
7.7
(8)
29.5
(21)
18.6
(29)
12.8
(8)
18.7
(18)
15.7
(26)
9.6
(21)
19.8
(51)
14.7
(72)
The age group classification for ownership by elderly was 63.6 percent, 65.1 percent and 59.7
percent respectively. In the first age group; 90 percent elderly males and 48.6 percent elderly
females owned the house which is a significant observation. In the second age group 78.2
percent males and 50.7 percent females owned the house whereas in the last age group 66.7
percent males and 55.2 percent females owned the house. The others category about 14.7
percent included houses owned by daughter, grandchildren or relatives.
Subjective Comfort in existing housing condition
Table 4.7: Percentage distribution of elderly according to their comfort in existing housing condition
age and gender wise
60-64 years 65-69 years 70+ years Total
M F T M F T M F T M F T
Comfortable
using the
house
58.3
(35)
67.6
(71)
64.2
(106)
67.9
(53)
69.0
(49)
68.5
(102)
52.4
(33)
56.2
(54)
54.7
(87)
59.5
(121)
64.2
(174)
61.8
(295)
Considering the comfort using the current housing set-up it was seen that about 62 percent
elderly felt that the current housing condition was comfortable and 34 percent felt it wasn’t.
Sex-wise differences are observed to be marginal. The level of comfort, as expected, is
observed to decrease with increasing age.
Provision of separate room
Majority of the elderly (70 %) did not have a separate room exclusively for themselves. NA
(Not Applicable) is meant for elderly who are either homeless or living in a small hut with
larger number of people.
24
Table 4.8: Percentage distribution of elderly having a separate room age and gender wise
60-64 years 65-69 years 70+ years Total
M F T M F T M F T M F T
Having a
separate
room
28.3
(17)
27.6
(29)
27.9
(46)
25.6
(20)
25.4
(18)
25.5
(38)
20.6
(13)
27.1
(26)
24.5
(39)
24.8
(50)
26.7
(73)
25.7
(123)
About 27.9 percent, 25.5 percent and 24.5 percent of the elderly from the age groups 60-64,
65-69 and 70+ respectively, had a separate room for themselves.
Toilet facilities
Table 4.9: Percentage distribution of elderly using toilet facilities age and gender wise
60-64 years 65-69 years 70+ years Total
M F T M F T M F T M F T
Toilet access 56.7
(34)
61.9
(65)
60.0
(99)
69.2
(54)
57.7
(41)
63.8
(95)
57.1
(36)
56.2
(54)
56.6
(90)
57.1
(111)
58.6
(160)
57.9
(271)
Comfortable
using the
toilet
58.3
(35)
65.7
(69)
63.0
(104)
67.9
(53)
57.7
(41)
63.1
(94)
52.4
(33)
58.3
(56)
56.0
(89)
59.5
(121)
60.5
(166)
60.0
(287)
Fear of fall
in the toilet
13.3
(8)
14.3
(15)
13.9
(23)
12.8
(10)
16.9
(12)
14.8
(22)
22.2
(14)
29.2
(28)
26.4
(42)
16.1
(32)
20.1
(55)
18.0
(87)
Taking into account the toilet facilities, it was observed that 60 percent elderly have easy
access to toilet. The elderly had toilets either in their house, or a common toilet which was
located in the nearby area at a distance of upto 0.5 km.
About 40 percent of the elderly did not have toilet in their home so they had use common
toilets provided by the PMC or open spaces. About 95 percent of the elderly had an Indian
type of toilet and 61 percent were comfortable using it. About 18 percent of the elderly
witnessed fall in the toilet. The elderly who were not comfortable using the current toilet
facilities complained of unhygienic conditions, water shortage in the toilets. From the above
table it can be observed that with rise in age, fear of falling experienced by the elderly is

25
increasing. On a gender basis, it was noticed that women experienced more fall incidents
compared to that of men. Falls were experienced due to slippery floors, weakness, health
complication etc.
Bathroom facilities
Table 4.10: Percentage distribution of elderly using bathroom facilities age and gender
wise
60-64 years 65-69 years 70+ years Total
M F T M F T M F T M F T
Bathroom
access
68.3
(41)
71.4
(75)
70.3
(116)
79.5
(62)
53.5
(38)
67.1
(100)
65.1
(41)
64.6
(62)
64.8
(103)
70.9
(144)
63.1
(175)
67.0
(319)
Assistance
required
in bathing
20.0
(12)
19.0
(20)
19.49
(32)
10.3
(8)
15.5
(11)
12.8
(19)
19.0
(12)
30.2
(29)
25.8
(41)
16.4
(32)
21.5
(60)
18.9
(92)
Fear of
fall in
bathroom
10.0
(6)
12.4
(13)
11.5
(19)
9.0
(7)
12.7
(9)
10.7
(16)
19.0
(12)
24.0
(23)
22.0
(35)
12.6
(25)
16.3
(45)
14.4
(70)
Bathrooms were situated within flats or were common for those residing in chawls, wherein
some of the elderly had a small section within the tenement to be used as bathroom. Those
with bathrooms situated outside the house, complained of no/improper drainage system.
Looking at the above table it can be seen that a lot of elderly required assistance in bathing.
About 67 percent elderly had easy access to bathroom; the others have constructed a small
bathing space outside the house wherein they take shower. It was observed that 19 percent
required assistance during bathing, changing clothes etc. About 14.4 percent elderly
experienced fear of fall in the bathroom owing to various issues such as slippery floor, losing
balance and vertigo.

26
CHAPTER 5. ECONOMIC CONDITIONS
Among the several problems of the elderly in our society, economic problems occupy most
important position. With advancing age and inadequate finances, the elderly start depending
on their children economically, especially on their son/s. The economic condition of their
offspring has considerable effect on the living conditions of the elderly. The following
variables such as current and most recent occupation, planning of old age expenses, source of
income, perceived income situation and work participation, aim to throw light on the
economic conditions of the elderly in the sample so as to develop suitable schemes and
services for improving the quality of later life.
Occupation
The occupation structure clearly indicates that 47 percent of elderly are unemployed. This was
followed by 32 percent elderly involved in elementary occupations which comprise of labor
work, construction and mining work, etc.

27
Chief earner of household:
Table 5.1: Percentage distribution of chief earner of the house among the elderly
household
Chief earner Percent Number
Self 31.9 151
Spouse (Elderly’s) 11.4 54
Son 41.4 196
Daughter 8.0 38
Grandchildren 2.1 10
Relatives 3.0 14
Others 2.1 10
The elderly were asked about the chief earner of the house who is defined as the major
financial contributor towards the household expenses as perceived by the elderly. Overall,
sons are the chief earners of 41.4 percent households, followed by 31.9 percent elderly
themselves being the chief earner, 11.4 percent spouse of the elderly, 8 percent daughters, 3
percent relatives about 4.2 percent grandchildren and others.
Table 5.2: Percentage distribution of chief earner of the house among the elderly
household age wise and gender wise
Chief earner
of the house
60-64 years 65-69 years 70+ years Total
M F T M F T M F T M F T
Self
56.7
(34)
22.9
(24)
35.2
(58)
53.8
(28)
23.9
(17)
39.6
(59)
30.2
(19)
15.6
(15)
21.4
(34)
40.2
(81)
20.5
(56)
31.9
(151)
Spouse
(Elderly’s)
11.7
(7)
24.8
(26)
20.0
(33)
2.6
(2)
12.7
(9)
7.4
(11)
9.5
(6)
4.2
(4)
6.3
(10)
7.4
(15)
14.3
(39)
11.4
(54)
Son
28.3
(17)
41.0
(43)
36.4
(60)
35.9
(28)
42.3
(30)
38.9
(58)
50.8
(32)
47.9
(46)
49.1
(78)
38.3
(77)
43.7
(119)
41.4
(196)

28
Daughter
0.0
(0)
6.7
(7)
4.2
(7)
2.6
(2)
9.9
(7)
6.0
(9)
4.8
(3)
19.8
(19)
13.8
(22)
2.4
(5)
12.1
(33)
8.0
(38)
Grandchildren
1.7
(1)
1.0
(1)
1.2
(2)
0
4.2
(3)
2.0
(3)
1.6
(1)
4.2
(4)
3.1
(5)
0.9
(2)
2.9
(8)
2.1
(10)

29
Figure 5.1: Percentage distribution of chief earner of the house among the elderly household
age and genderwise
Source of Income
The surveyed elderly were also asked if they had planned to meet their old age expenses
before turning 60. Only 23.1 percent out of the total elderly agreed to have made plans to meet
their old age expenses.
Table 5.3: Percentage distribution of elderly who have planned to meet their old age
expenses
Plan to meet old age expenses Percent Number
Yes
No
No response
21.4
78.4
0.2
101
371
1
A overwhelming amount of elderly (78 %) did not make any plan to meet their old age
expenses though 23 percent of them decided on their plan for their expenses.

30
The elderly when asked about their current plan for their old age expenses reported the
following:
The plan included various options like depending on their sons, daughter, grandchildren,
relatives, wages/ salary, pension, fixed deposits, investment, business, rent and
interest/dividend. Out of these categories about 67.8 percent of the elderly depended on their
sons for their expenses, followed by 30.9 percent depending on their wages/ salary and 13.1
percent depending on their daughters. The detailed table below gives more insights on the
same age and gender wise
Table 5.4: Percentage distribution of source of income of the elderly age wise and gender
wise
60-64 years 65-69 years 70+ years Total
M F T M F T M F T M F T
Planned for
future
expenses
15.0
(9)
18.1
(19)
17.0
(28)
16.7
(13)
23.9
(17)
20.1
(30)
33.3
(21)
22.9
(22)
27.0
(43)
21.6
(43)
21.6
(58)
21.6
(101)
Plan to depend
on sons
71.7
(43)
67.7
(71)
69.1
(114)
64.1
(50)
69.0
(49)
66.4
(99)
73.0
(46)
61.5
(59)
66.0
(105)
69.6
(139)
66.0
(179)
67.8
(318)
Plan to depend
on daughters
3.3
(2)
11.4
(12)
8.5
(14)
7.7
(6)
15.5
(11)
11.4
(17)
12.7
(8)
28.1
(27)
22.0
(35)
7.9
(16)
18.3
(50)
13.1
(66)
Plan to depend
on wages/
salary
46.7
(28)
29.5
(31)
35.8
(59)
41
(32)
32.4
(23)
36.9
(55)
23.8
(15)
12.5
(12)
17.0
(27)
37.1
(75)
24.8
(66)
30.9
(141)
Plan to depend
on pension/
superannuation
6.7
(4)
5.7
(6)
6.1
(10)
11.5
(9)
4.2
(3)
8.1
(12)
7.9
(5)
6.2
(6)
6.9
(11)
8.7
(18)
5.3
(15)
7.0
(33)
Plan to depend
on old age
pension
5.0
(3)
6.7
(7)
6.1
(10)
0 2.8
(2)
1.3
(2)
0 4.2
(4)
2.5
(4)
1.6
(3)
4.0
(13)
2.8
(16)
31
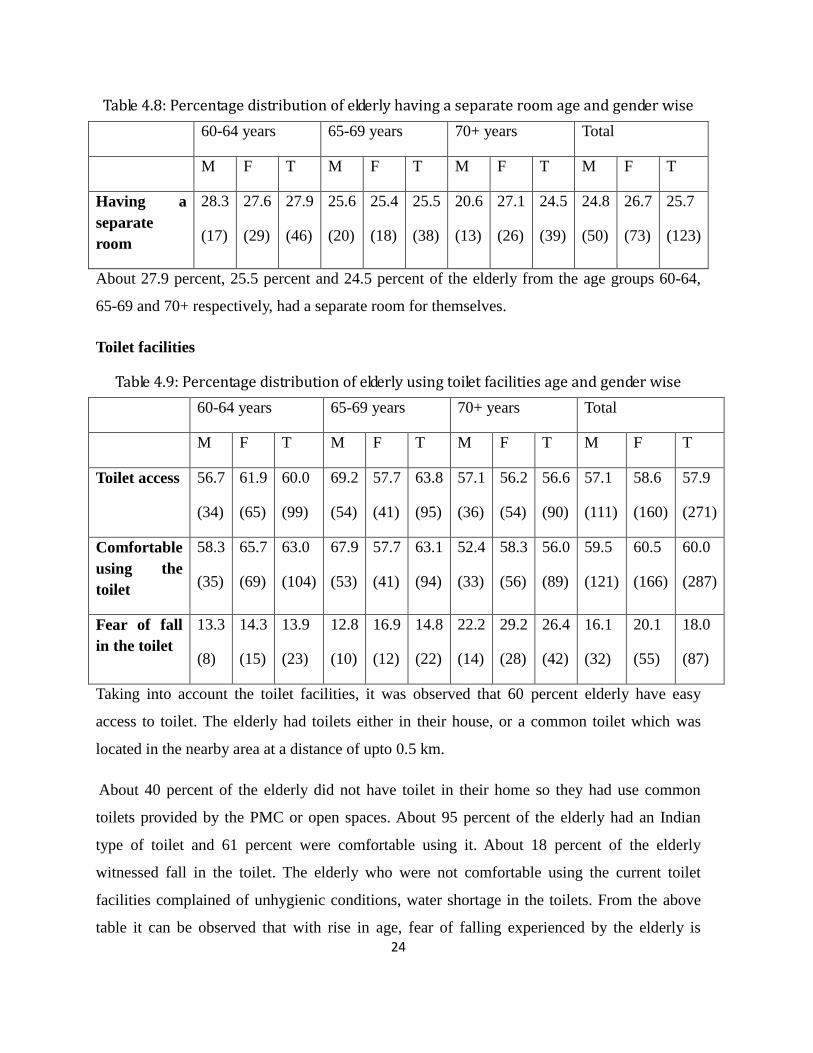
In the young old age (YO) group majority (69 %) of the elderly depended on their sons for
their expenses. This was followed by their dependence on their daily wage/ salary in which 47
percent males and 29 percent females depended on their salary. Similar trend was followed by
the OO group or 65-69 years age group. In the oldest old category about 24 percent males and
12 percent females depended on salary. With increase in the age the daily wage/ salary earning
elderly declined. Another noteworthy observation was that with an increase in age the elderly
depended more on their daughters. This was seen very well in the oldest old age group where
22 percent elderly depended on their daughters. Merely 3 percent (n=16) elderly depended on
pension for their expenses.
Current Income Source
Plan to depend and current income sources had similar findings.
Table 5.5: Percentage distribution of income source of the elderly age and gender wise
Income Source 60-64 years 65-69 years 70+ years Total
M F T M F T M F T M F T
Income source
depending on
son
51.7
(31)
50.5
(53)
50.9
(84)
44.9
(35)
52.1
(37)
48.3
(72)
55.6
(35)
46.9
(45)
50.3
(80)
50.7
(101)
49.8
(135)
50.2
(236)
Income source
depending on
daughters
3.3
(2)
8.6
(9)
6.7
(11)
9.0
(7)
15.5
(11)
12.1
(18)
7.9
(5)
25.0
(24)
18.2
(29)
6.7
(14)
16.3
(44)
11.5
(58)
Income source
depending on
relatives
6.7
(4)
5.7
(6)
6.1
(10)
3.8
(3)
8.5
(6)
6.0
(9)
4.8
(3)
7.3
(7)
6.3
(10)
5.1
(10)
7.1
(19)
6.1
(29)
Income source
depending on
wages/ salary
40.0
(24)
40.0
(42)
40.0
(66)
41.0
(32)
32.4
(23)
36.9
(55)
22.2
(14)
12.5
(12)
16.4
(26)
34.4
(70)
28.3
(77)
31.3
(147)
Income source
depending in
superannuation/
pension
6.7
(4)
4.8
(5)
5.5
(9)
10.3
(8)
8.5
(6)
9.4
(14)
9.5
(6)
9.4
(9)
9.4
(15)
8.8
(18)
7.5
(20)
8.1
(38)
32
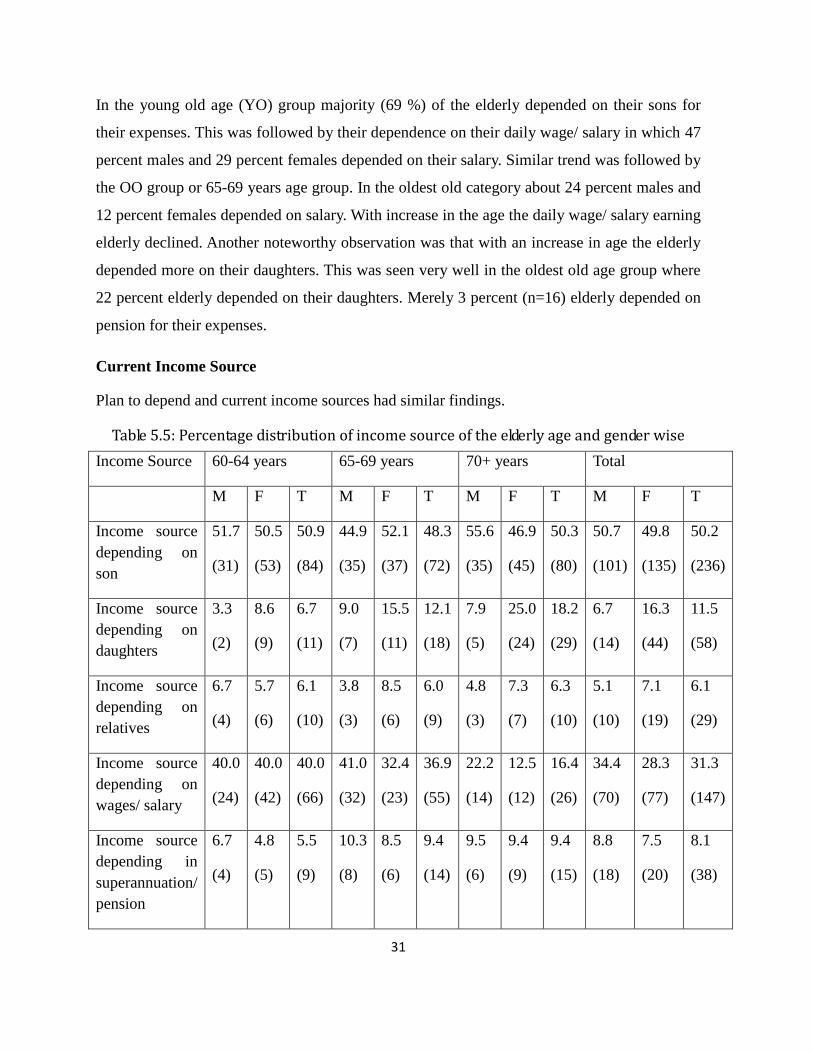
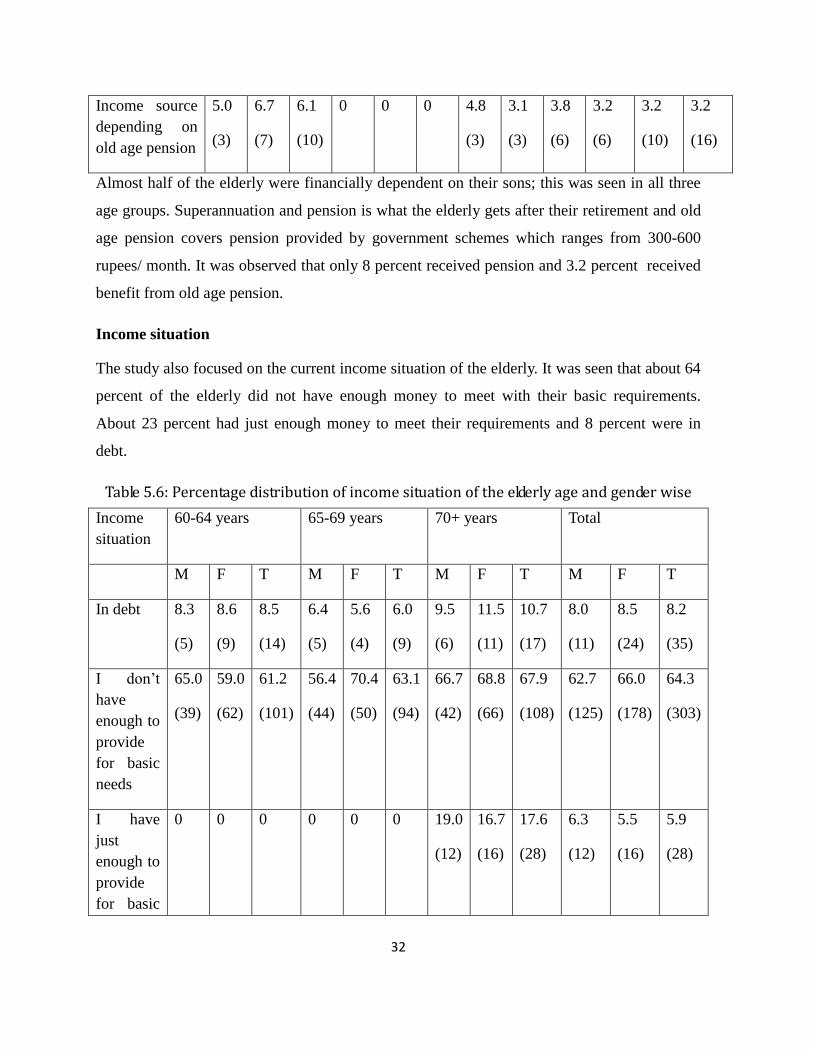
Income source
depending on
old age pension
5.0
(3)
6.7
(7)
6.1
(10)
0 0 0 4.8
(3)
3.1
(3)
3.8
(6)
3.2
(6)
3.2
(10)
3.2
(16)
Almost half of the elderly were financially dependent on their sons; this was seen in all three
age groups. Superannuation and pension is what the elderly gets after their retirement and old
age pension covers pension provided by government schemes which ranges from 300-600
rupees/ month. It was observed that only 8 percent received pension and 3.2 percent received
benefit from old age pension.
Income situation
The study also focused on the current income situation of the elderly. It was seen that about 64
percent of the elderly did not have enough money to meet with their basic requirements.
About 23 percent had just enough money to meet their requirements and 8 percent were in
debt.
Table 5.6: Percentage distribution of income situation of the elderly age and gender wise
Income
situation
60-64 years 65-69 years 70+ years Total
M F T M F T M F T M F T
In debt 8.3
(5)
8.6
(9)
8.5
(14)
6.4
(5)
5.6
(4)
6.0
(9)
9.5
(6)
11.5
(11)
10.7
(17)
8.0
(11)
8.5
(24)
8.2
(35)
I don’t
have
enough to
provide
for basic
needs
65.0
(39)
59.0
(62)
61.2
(101)
56.4
(44)
70.4
(50)
63.1
(94)
66.7
(42)
68.8
(66)
67.9
(108)
62.7
(125)
66.0
(178)
64.3
(303)
I have
just
enough to
provide
for basic
0 0 0 0 0
0 19.0
(12)
16.7
(16)
17.6
(28)
6.3
(12)
5.5
(16)
5.9
(28)

33
needs
I have
enough to
get with
little
extra
25.0
(15)
27.6
(29)
26.7
(44)
29.5
(23)
22.5
(16)
26.2
(39)
0 0 0 18.1
(38)
16.7
(45)
17.4
(83)
It is noted that a large proportion of the elderly did not have enough money to provide for
their basic needs (64.3 %) which was seen across all the age groups. This was followed by
elderly who had a little extra money (17.4 %) after utilizing the rest for their daily expenses.
Expectation of Elderly to meet their expenses
Data on expectations of elderly in terms of living expenses shows that, more than 50 percent
of the elderly were of the opinion that the government should take initiatives to help the
elderly meet with their expenses and about 40 percent felt that the family members should
take the responsibility of the same. 4.4 percent percent felt that they should themselves plan
and not rely on others for their expenses.
Table 5.7: Percentage distribution of Elderlys expectation to meet their expenses age and
gender wise
Elderly
expectation
to meet
their
expenses
60-64 years 65-69 years 70+ years Total
M F T M F T M F T M F T
Self
3.3
(2)
2.9
(3)
3.0
(5)
12.8
(10)
5.6
(4)
9.4
(14)
0 3.1
(3)
1.9
(3)
5.3
(12)
3.6
(10)
4.4
(22)

34
Family 46.7
(28)
42.9
(45)
44.2
(73)
38.5
(30)
33.8
(24)
36.2
(54)
47.6
(30)
34.3
(33)
39.6
(63)
43.7
(88)
37.5
(102)
40.1
(190)
Community 1.7
(1)
1.9
(2)
1.8
(3)
0
1.4
(1)
0.7
(1)
4.8
(3)
2.1
(2)
3.1
(5)
2.1
(4)
1.8
(5)
1.9
(9)
Government 46.7
(28)
50.5
(53)
49.1
(81)
48.7
(38)
59.2
(42)
53.7
(80)
47.6
(30)
60.4
(58)
55.3
(88)
47.6
(96)
56.7
(153)
52.1
(249)
Work participation and reasons to work:
The work participation at older ages is often viewed differently in different contexts. For
example, many western countries argue that there exists significant unused labor force
capacity at older ages. Retirement decisions in European countries are linked with the pension
reforms and the work participation ends with retirement (Kalwij and Vermeulen, 2005; Mete
and Schultz, 2002). In developing countries like India, however, the scenario is different.
Labor force participation of the elderly, and particularly of women, is often driven by poverty
(Bhalotra and Umana-Aponte, 2010; Bhalla and Kaur, 2011). India’s occupational structure is
dominated by informal sector employment where there is neither a retirement age nor a
pension (Unni and Revenndran, 2007). According to the NSSO, nearly 84 percent of workers
are employed in the informal sector and this is true even for the senior citizens (Rajan 2004;
Selvaraj et al., 2011).
Table 5.8 Percentage distribution of reasons to find work opportunities
Work Participation 52.4 (n=248)
Reasons for exploring such job
opportunities No.
Percen
t
Need money for current expenses 220 46.5
Need money for future financial
security 91 19.2
Do not want to be dependent on
others for money 39 8.2
No one to depend on for money 23 4.9

35
Want to lead an active life 21 4.4
Need something to occupy
time/keep me busy 21 4.4
Overall, about 52.4 percent of the elderly were interested in exploring work opportunities. The
reasons for exploring such opportunities included need of money for their current expenses
(46.5 %) and need money for future financial security (19.2 %)
Future living of the elderly
The elderly were asked about where they would reside in the future. Majority (94.3 %) had
plans to continue staying in the same household and 3 percent were not sure about their
whereabouts in the future. Very few were interested in relocating to their native.
Table 5.9: Percentage distribution of future living of the elderly age and gender wise
Plan for
future
living
60-64 years 65-69 years 70+ years Total
M F T M F T M F T M F T
Continue
in the
same
household
95.0
(57)
97.1
(102)
96.4
(159)
96.2
(75)
94.4
(67)
95.3
(142)
88.9
(56)
94.8
(91)
92.5
(147)
93.3
(188)
95.4
(225)
94.3
(413)
CHAPTER 6: SOCIAL PROFILE
Like the family support, the social factors concerning the elderly are also important in
determining the quality of later life. The social support system of the elderly enables them to
remain integrated within the community and also encourages them to be active members of
the society. Therefore variables such as the activities elderly normally engage in, participation
in social activities, involvement in decision making, volunteering, issues faced by them,
awareness of day care and hobby centers and old age homes and willingness to join them, and
awareness and utilization of old age social security schemes were included to gather
information about the social interaction of the elderly.
Activities Elderly normally engage in
Table 6.1: Percentage distribution of activities elderly are engaged in
Activities Regularly Sometimes No

36
Looking after my sick spouse 42.0 8.2 49.2
(199) (39) (233)
Looking after my grandchildren 27.6 22.4 49.2
(131) (106) (233)
Assisting my children in daily chores 25.9 33.8 39.5
(123) (160) (187)
Reading 9.5 7 82.1
(45) (33) (389)
Listen to radio 8.2 24.7 66
(39) (117) (313)
Watching TV 35.7 32.3 31.4
(169) (153) (149)
Physical activity 18.4 19.4 61.4
(87) (92) (291)
Religious activities 27.8 42.2 29.1
(132) (200) (138)
Music/drama/hobby 2.7 5.9 90.3
(13) (28) (428)
Shopping 55.9 35.7 55.9
(265) (169) (265)
The above table shows various activities the elderly engage in on a daily basis. The table gives
information on the frequency with which they engage in those activities i.e., regularly,
sometimes or not at all.
Table 6.2: Percentage distribution of activities elderly are engaged in age and gender wise
Activities engaged
in
60-64 years 65-69 years 70+ years Total
M F T M F T M F T M F T
Looking after my
sick spouse
68.3
(41)
43.8
(46)
52.7
(87)
65.4
(51)
28.2
(20)
47.7
(71)
44.4
(28)
13.5
(13)
25.8
(41)
59.7
(120)
29.0
(79)
42.0
(199)
Looking after my
grandchildren
31.7
(19)
33.3
(35)
32.7
(54)
29.5
(23)
29.6
(21)
29.5
(44)
22.2
(14)
19.8
(19)
20.8
(33)
27.8
(56)
27.5
(75)
27.6
(131)

37
Assisting my
children in daily
chores
28.3
(17)
30.5
(32)
29.7
(49)
30.8
(24)
26.8
(19)
28.9
(43)
20.6
(13)
18.8
(18)
19.5
(31)
26.8
(54)
25.3
(69)
26.0
(123)
Reading
21.7
(13)
3.8
(4)
10.3
(17)
24.4
(19)
2.8
(2)
14.1
(21)
9.5
(6)
1.0
(1)
4.4
(7)
18.9
(38)
1.4
(7)
9.5
(45)
Listen to radio
10.0
(6)
5.7
(6)
7.3
(12)
16.7
(13)
5.6
(4)
11.4
(17)
7.9
(5)
5.2
(5)
6.3
(10)
11.9
(24)
5.5
(15)
8.2
(39)
Watching TV
38.3
(23)
43.8
(46)
41.8
(69)
35.9
(28)
45.1
(32)
40.3
(60)
17.5
(11)
30.2
(29)
25.2
(40)
30.8
(62)
39.3
(107)
35.7
(169)
Physical activity
23.3
(14)
21.0
(22)
21.8
(36)
26.9
(21)
11.3
(8)
19.5
(29)
20.6
(13)
9.4
(9)
13.8
(22)
23.8
(48)
14.3
(39)
18.3
(87)
Religious activities
33.3
(20)
40.0
(42)
37.6
(62)
35.9
(28)
23.9
(17)
30.2
(45)
12.7
(8)
17.7
(17)
15.7
(25)
27.8
(56)
27.9
(76)
27.9
(132)
Music/drama/hobby
6.7
(4)
2.9
(3)
4.2
(7)
2.6
(2)
1.4
(1)
2.0
(3)
3.2
(2)
1.0
(1)
1.9
(3)
3.9
(8)
2.2
(6)
2.9
(14)
Shopping
5.0
(3)
16.2
(17)
12.1
(20)
7.7
(6)
5.6
(4)
6.7
(10)
3.2
(2)
4.2
(4)
3.8
(6)
5.4
(11)
9.1
(25)
7.6
(36)
From table 6.2 it is observed that the elderly spend maximum time in looking after their sick
spouse (42.0 %) and watching television (35.7 %). The number of elderly engaged in various
activities decrease with age.
Table 6.3: Percentage distribution of activities elderly spend most of the time in age and
gender wise
60-64 years 65-69 years 70+ years Total
Spend most
of the time
M F T M F T M F T M F T

38
Spouse 33.3
(20)
16.2
(17)
22.4
(37)
32.1
(25)
11.3
(8)
22.1
(33)
38.1
(24)
5.2
(5)
18.2
(29)
34.3
(69)
11.0
(30)
20.9
(99)
Children 0
19.0
(20)
12.1
(20)
10.3
(8)
11.3
(8)
10.7
(16)
3.2
(2)
27.1
(26)
17.6
(28)
4.9
(10)
19.8
(54)
13.5
(64)
Grandchildren
16.7
(10)
24.8
(26)
21.8
(36)
11.5
(9)
29.6
(21)
20.1
(30)
23.8
(15)
19.8
(19)
21.4
(34)
16.9
(34)
24.2
(66)
21.1
(100)
Neighbors 25.0
(15)
23.8
(25)
24.2
(40)
17.9
(14)
32.4
(23)
24.8
(37)
4.8
(3)
7.3
(7)
6.3
(10)
15.9
(32)
20.2
(55)
18.3
(87)
Friends 20.0
(12)
7.6
(8)
12.1
(20)
23.1
(18)
4.2
(3)
14.1
(21)
7.9
(5)
1.0
(1)
3.8
(6)
17.4
(35)
4.4
(12)
9.9
(47)
Other 5.0
(3)
6.7
(7)
5.8
(10)
3.9
(3)
11.2
(8)
7.5
(11)
8.0
(5)
10.4
(10)
10.0
(15)
5.4
(11)
9.1
(25)
7.6
(36)
About 21.1 percent of the elderly spent most of their time with children, this was followed by
20.9 percent spending time with their spouse and 18.3 percent with the neighbors.
Social activities elderly engage in
The survey shows that involvement of the elderly in social life, whether in attending family
ceremonies like marriages, public meetings, organisational meetings or religious programmes
is very limited. The survey also found that men are more active in collaborating with other
people compared to women though the frequency varied. The attendance of elderly in
religious programmes or services and weddings and funerals, is highest among all social
activities the respondents were asked about.
Table 6.4: Percentage distribution of social activities elderly are engaged in age and gender
wise
60-64 years 65-69 years 70+ years Total
M F T M F T M F T M F T

39
Attending
ceremonies
40.0
(24)
14.3
(15)
23.6
(39)
21.8
(17)
15.5
(11)
18.8
(28)
15.9
(10)
11.5
(11)
13.2
(21)
25.3
(51)
13.6
(37)
18.6
(88)
Visiting
religious
places
18.3
(11)
10.5
(11)
13.3
(22)
14.1
(11)
7.0
(5)
10.7
(16)
7.9
(5)
6.2
(6)
6.9
(11)
13.4
(27)
8.0
(22)
9.6
(49)
Visiting parks 6.7
(4)
1.9
(2)
3.6
(6)
9.0
(7)
1.4
(1)
5.4
(8)
3.2
(2)
3.1
(3)
3.1
(5)
6.4
(13)
2.2
(6)
4.0
(19)
Visiting
clubs/
association/
societies
5.0
(3)
1.9
(2)
3.0
(5)
0
0
0
0
0
0
1.4
(3)
0.7
(2)
1.0
(5)
Journey to
hometown
3.3
(2)
1.9
(2)
2.4
(4)
3.8
(3)
1.4
(1)
2.7
(4)
0 1
(1)
0.6
(1)
2.4
(5)
1.4
(4)
1.9
(9)
Table 6.4 highlights that most of the elderly engaged in social activities like attending
ceremonies and going to religious places. In case of attending ceremonies considering all the
age groups it was seen that men participated more (total 25.3 percent, 60-64 years 40.0
percent, 65-69 years 21.8 percent and 70+ years 15.9 %) as compared to that of women (total
13.6 percent, 60-64 years 14.3 percent, 65-69 years 15.5 percent and 70+ years 11.5 %). A
similar trend was seen in case of visiting religious places.
Involvement in Decision making
Table 6.5: Percentage distribution of elderlys involvement in decision making
60-64 years 65-69 years 70+ years Total
M F T M F T M F T M F T
40
Marrying of
children
73.3
(44)
61.0
(64)
65.5
(108)
80.8
(63)
60.6
(43)
71.1
(106)
73.0
(46)
52.1
(50)
60.4
(96)
76.1
(153)
57.7
(157)
65.5
(310)
Buying and
selling
property
56.7
(34)
41.9
(44)
47.3
(78)
56.4
(44)
42.3
(30)
49.7
(74)
41.3
(26)
32.3
(31)
35.8
(57)
51.7
(104)
38.6
(105)
44.1
(209)
Buying
household
items
48.3
(29)
48.6
(51)
48.5
(80)
41.0
(32)
46.5
(33)
43.6
(65)
33.3
(21)
30.2
(29)
31.4
(50)
40.7
(82)
41.5
(113)
41.2
(195)
Gifts to
relatives
36.7
(22)
36.2
(38)
36.4
(60)
32.1
(25)
33.8
(24)
32.9
(49)
27.0
(17)
21.9
(21)
23.9
(38)
31.8
(64)
30.5
(83)
31.0
(147)
Education of
children and
grandchildren
50.0
(30)
34.3
(36)
40.0
(66)
48.7
(38)
31.0
(22)
40.3
(60)
30.2
(19)
21.9
(21)
25.2
(40)
43.2
(87)
29.0
(79)
35.0
(166)
Arrangement
of social/
religious
events
33.3
(20)
21.9
(23)
26.1
(43)
28.2
(22)
22.5
(16)
25.5
(38)
20.6
(13)
16.7
(16)
18.2
(29)
27.3
(55)
20.1
(55)
23.2
(110)
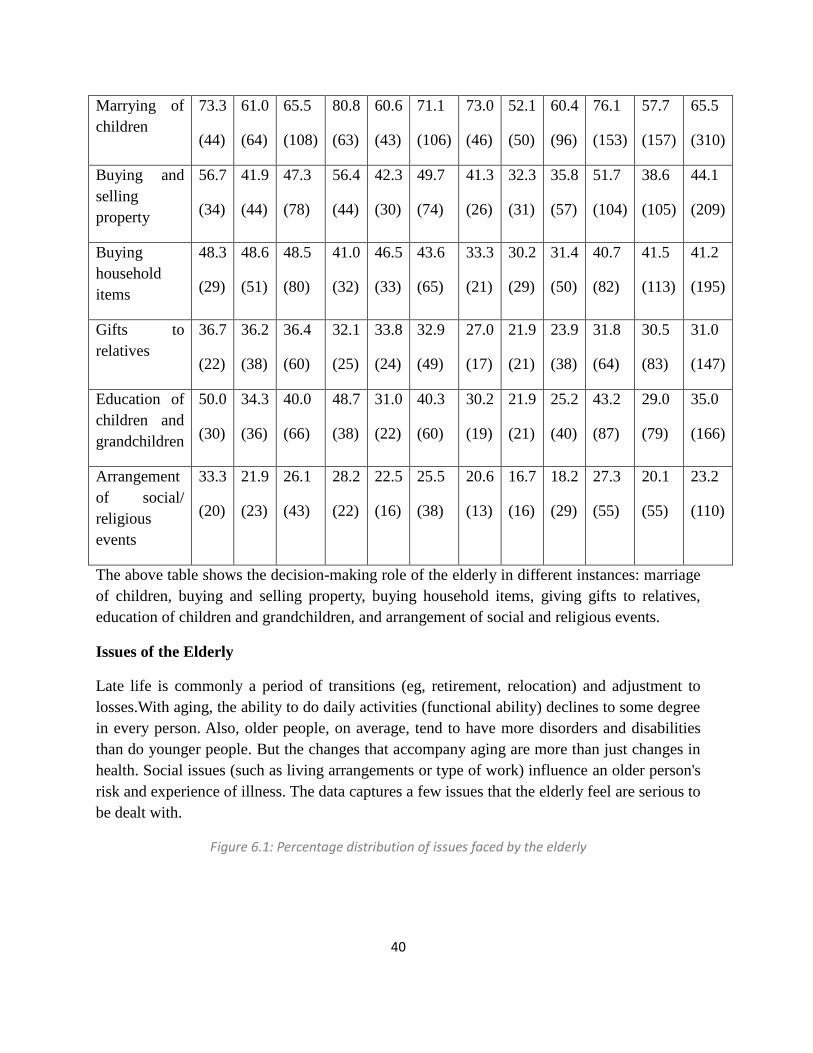
The above table shows the decision-making role of the elderly in different instances: marriage
of children, buying and selling property, buying household items, giving gifts to relatives,
education of children and grandchildren, and arrangement of social and religious events.
Issues of the Elderly
Late life is commonly a period of transitions (eg, retirement, relocation) and adjustment to
losses.With aging, the ability to do daily activities (functional ability) declines to some degree
in every person. Also, older people, on average, tend to have more disorders and disabilities
than do younger people. But the changes that accompany aging are more than just changes in
health. Social issues (such as living arrangements or type of work) influence an older person's
risk and experience of illness. The data captures a few issues that the elderly feel are serious to
be dealt with.
Figure 6.1: Percentage distribution of issues faced by the elderly

41
Table 6.6: Percentage distribution of Issues faced by the elderly age and gender wise
Issues which
are seriously
faced by the
elderly
60-64 years 65-69 years 70+ years Total
M F T M F T M F T M F T
Insufficient
money/
finance
48.3
(29)
40
(42)
43
(71)
38.5
(30)
54.9
(39)
46.3
(69)
42.9
(27)
55.2
(53)
50.3
(80)
42.7
(86)
49.2
(134)
46.5
(220)
Poor housing 38.3
(23)
29.5
(31)
32.7
(54)
25.6
(20)
38
(27)
31.5
(47)
50.8
(32)
37.5
(36)
42.8
(68)
37.3
(75)
34.5
(94)
35.7
(169)
Poor health 30 21.9 24.8 16.7 25.4 20.8 36.5 37.5 37.1 26.8 28.3 27.6

42
(18) (23) (41) (13) (18) (31) (23) (36) (59) (54) (77) (131)
Insufficient
medical care
31.7
(19)
23.8
(25)
26.7
(44)
21.8
(17)
28.2
(20)
24.8
(37)
34.9
(22)
37.5
(36)
36.5
(58)
28.8
(58)
29.7
(81)
29.3
(139)
Loss of
faculties
16.7
(10)
15.2
(16)
15.8
(26)
11.5
(9)
12.7
(9)
12.1
(18)
34.9
(22)
31.2
(30)
32.7
(52)
20.3
(41)
20.2
(55)
20.2
(96)
Education of
children
8.3
(5)
4.8
(5)
6.1
(10)
1.3
(1)
1.4
(1)
1.3
(2)
3.2
(2)
3.1
(3)
3.1
(5)
3.9
(8)
3.3
(9)
3.5
(17)
Not enough
job
opportunities
13.3
(8)
6.7
(7)
9.1
(15)
11.5
(9)
4.2
(3)
8.1
(12)
6.3
(4)
9.4
(9)
8.2
(13)
10.4
(21)
6.9
(19)
8.4
(40)
Loneliness 20
(12)
25.7
(27)
23.6
(39)
20.5
(16)
35.2
(25)
27.5
(41)
27
(17)
43.8
(42)
37.1
(59)
22.3
(45)
34.5
(94)
29.3
(139)
Lack of
companionship
11.7
(7)
21
(22)
17.6
(29)
14.1
(11)
14.1
(10)
14.1
(21)
19
(12)
31.2
(30)
26.4
(42)
14.9
(30)
22.7
(62)
19.4
(92)
Departure of
children
11.7
(7)
12.4
(13)
12.1
(20)
7.7
(6)
18.3
(13)
12.8
(19)
15.9
(10)
17.7
(17)
17
(27)
11.4
(23)
15.8
(43)
13.9
(66)
Nothing to
keep busy
15
(9)
11.4
(12)
12.7
(21)
5.1
(4)
8.5
(6)
6.7
(10)
14.3
(9)
18.8
(18)
17
(27)
10.9
(22)
13.2
(36)
12.2
(58)
Being
independent
16.7
(10)
7.6
(8)
10.9
(18)
12.8
(10)
9.9
(7)
11.4
(17)
19
(12)
22.9
(22)
21.4
(34)
15.9
(32)
13.6
(37)
14.5
(69)
Feeling
neglected
10
(6)
6.7
(7)
7.9
(13)
7.7
(6)
14.1
(10)
10.7
(16)
15.9
(10)
8.3
(8)
11.3
(18)
10.9
(22)
9.1
(25)
9.9
(47)
Loss of status 10 3.8 6.1 6.4 5.6 6 14.3 9.4 11.3 9.9 4.7 7.8

43
(6) (4) (10) (5) (4) (9) (9) (9) (18) (20) (13) (37)
Loss of
confidence
11.7
(7)
3.8
(4)
6.7
(11)
6.4
(5)
8.5
(6)
7.4
(11)
12.7
(8)
18.8
(18)
16.4
(26)
9.9
(20)
10.2
(28)
10.1
(48)
Fear of crime
15
(9)
2.9
(3)
7.3
(12)
3.8
(3)
11.3
(8)
7.4
(11)
22.2
(14)
8.3
(8)
13.8
(22)
12.9
(26)
6.9
(19)
9.5
(45)
Financial
exploitation
13.3
(8)
11.4
(12)
12.1
(20)
12.8
(10)
8.5
(6)
10.7
(16)
9.5
(6)
9.4
(9)
9.4
(15)
11.9
(24)
9.9
(27)
10.7
(51)
Physical abuse 5
(3)
2.9
(3)
3.6
(6)
2.6
(2)
1.4
(1)
2
(3)
4.8
(3)
5.2
(5)
5
(8)
3.9
(8)
3.3
(9)
3.5
(17)
Verbal abuse
5
(3)
1.9
(2)
3
(5)
6.4
(5)
2.8
(2)
4.7
(7)
7.9
(5)
5.2
(5)
6.3
(10)
6.4
(13)
3.3
(9)
4.6
(22)
The most common issues that elderly complain of are insufficient money (46.4 %), loneliness
(29.3 %), insufficient medical care (29.3 percent, )poor housing (35.7 %) and poor health
(27.6 %). A noteworthy 19.4 percent of elderly feel alone due to lack of companionship, 9.9
percent of elderly feel that being neglected is a serious problem, where a higher percentage of
women complain of neglect than men. The above table also provides the extent of abuse that
the respondents have faced after they have turned 60 years of age. Overall a staggering 10.8
percent of elderly have reported of being financially exploited, and the percentage of elderly
reported having faced physical and verbal abuse is 8.2 percent. Where abuse is reported, it is
marginally higher for men in comparison to their female counterparts.
Awareness and utilization of day care and hobby centers, old age homes
Day care centers are facilities for the supervised care of older adults, providing activities such
as meals and socialization one or more days a week during specified daytime hours. The
participants, primarily persons with physical and/or mental limitations who need socialization,
physical assistance, and/or psychological assistance, return to their homes each evening. The
program is often used by family members caring for an older person who cannot be left alone
safely in the home.

44
Old age homes are meant for senior citizens who are unable to stay with their families or are
destitute. These old age homes have special medical facilities for senior citizens such as
mobile health care systems, ambulances, nurses and provision of well-balanced meals they
work on a payment basis depending on the type and quality of services offered. Some old age
homes have day care centres. These centres only take care of senior citizens during the day.
Table 6.7: Percentage distribution of awareness and utilization by the elderly age and
gender wise
60-64 years 65-69 years 70+ years Total
M F T M F T M F T M F T
Awareness 18.3
(11)
10.5
(11)
13.3
(22)
12.8
(10)
1.4
(1)
7.4
(11)
6.3
(4)
6.2
(6)
6.3
(10)
12.4
(25)
6.6
(18)
9.0
(43)
Hobby centre 30.0
(18)
33.3
(35)
32.1
(53)
35.9
(28)
22.5
(16)
29.5
(44)
33.3
(21)
27.1
(26)
29.6
(47)
33.3
(67)
28.3
(77)
30.4
(144)
Daycare 26.7
(16)
24.8
(26)
25.5
(42)
23.1
(18)
21.1
(15)
22.1
(33)
19.0
(12)
25.0
(24)
22.6
(36)
22.8
(46)
23.8
(65)
23.4
(111)
Old age
home
6.7
(4)
48
(5)
5.5
(9)
6.4
(5)
12.7
(9)
9.4
(14)
6.3
(4)
13.5
(13)
10.7
(17)
6.4
(13)
9.9
(27)
8.4
(40)
The survey data shows that the level of awareness regarding hobby centers, day care centers
and old age homes is low. Only about 9 percent of elderly are aware of one or more of these
facilities for elderly. When asked about their interest to join these facilities, majority of the
overall elderly are not interested in joining. Among those who expressed interest to join any of
the above facilities, it was seen that the percentage of males is more to that of female elderly,
with varying frequencies
Schemes: Awareness and Registration
The term social security refers to programmes established by state that insure individuals
against interruption or loss of earning power (International Social Security Association, 2003).
The main function of social security is to provide income security, access to health care and
basic social services and thus reducing poverty among the elderly. International Labour

45
Organisation (2006) defines social security as the “set of institutions, measures, right and
obligations whose primary goal is to provide income security and medical care to individual
members of the society”. Unlike developed countries India does not have a universal pension
system. There is no comprehensive social security system in India as a whole. Pension policy
adopted by the country is restricted to the workers in organised sectors leaving 90 percent of
the workers in the unorganized sector.
Some of the existing social assistance programmes for the poor in India are state and national
pension schemes, Integrated Programme for Older Persons (IPOP), National Policy for the
Health Care of the Elderly (NPHCE), Indira Gandhi National Old Age Pension Scheme
(IGNOAPS), Annapurna Scheme and Maintenance and Welfare of Parents and Senior Citizens
Act (MWPSC Act), 2007. It is but important to assess whether these social security schemes
were actually reaching the intended beneficiaries, namely, the targeted elderly.
Very few elderly (9 percent, n=45) had an idea about various social security schemes. Out of
these only 9 elderly had registered in at least one scheme. Majority of the elderly did not have
the documents which were essential and also, many were unaware of the procedure for
applying for the schemes.
Table 6.8: Percentage distribution of awareness and registration of schemes by the elderly
Schemes 60-64 years 65-69 years 70+ years Total
M F T M F T M F T M F T
Elderly who are
aware of the
schemes
18.3
(11)
11.4
(12)
13.9
(23)
9.0
(7)
5.6
(4)
7.4
(11)
4.8
(3)
8.3
(8)
6.9
(11)
10.7
(21)
8.4
(24)
9.5
(45)
Elderly who have
registered for the
schemes
1.7
(1)
0.0
(0)
0.6
(1)
3.8
(3)
1.4
(1)
2.7
(4)
0 4.2
(4)
2.5
(4)
1.8
(4)
1.8
(5)
1.8
(9)
It can be seen that very few elderly were aware of the schemes which were meant for the
elderly out of which more number of males were aware of the schemes than the females. The
number decrease with the rise in the age. The purpose of such schemes is defeated as they are
not reaching the targeted beneficiaries. Therefore, it is necessary to understand the
bottlenecks, ranging from documentary proof and application procedures, problems with BPL

46
listing or database and local politics and favouritism. It has been observed that accessing the
bank is difficult; disbursement is also irregular. Another major concern is that the amount of
pension is not adequate. At times, funds are not released or get delayed because of
administrative procedures. Applications remain pending in offices. A proper strategy is
required to target the beneficiaries. The application procedure needs to be simplified.

47
CHAPTER 7: ACITIVITES OF DAILY LIVING (ADL) AND
INSTRUEMENTAL ACTIVITIES OF DAILY LIVING
The ‘activities of daily living’ or ADLs are the basic tasks of everyday life, such as feeding,
bathing, dressing, toileting, mobility (i.e., getting in and out of bed or chair) and continence
(controlling bladder and bowel movement). When people are unable to perform these
activities, they need assistance either from others or from mechanical devices or both. Apart
from providing objective assessments of the ability of the elderly to execute basic daily
activities and the level of difficulty in executing such tasks, ADLs have been found as an
important predictor of home or institutional care, living arrangements, health expenses and
mortality (Palmer and Harley, 2012). Functional disabilities in terms of ADLs, when assessed
also provide understanding of socio-economic and demographic disparities in such functional
limitations; the extent of familial support to those unable to execute the ADL functions gives
an idea about how such informal arrangements can be expected to address the care needs.
The survey asked the respondents to assess their level of independence to carry out six
different types of ADL activities covering physical domains of functionality viz., feeding,
toileting, maintaining continence, dressing, bathing and mobility, under the categories of
‘without help’ and ‘with help’. Also, there were different categories provided for those who
require help, to gain information on who provides help viz., family members, friends,
neighbors, community care givers or others.
Normal aging changes and health problems frequently show themselves as declines in the
functional status of older adults. One of the best ways to evaluate the health status of older
adults is through functional assessment which provides objective data that may indicate future
decline or improvement in health status, allowing the care-takers to intervene appropriately
The Katz Index of Independence in Activities of Daily Living, commonly referred to as the
Katz ADL, is the most appropriate instrument to assess functional status as a measurement of
the client’s ability to perform activities of daily living independently. Clinicians typically use
the tool to detect problems in performing activities of daily living and to plan care
accordingly. The Index ranks adequacy of performance in the six functions of bathing,
dressing, toileting, transferring, continence, and feeding. Elderly are scored yes/no for
independence in each of the six functions. A score of 6 indicates full function, 4 indicates
moderate impairment, and 2 or less indicates severe functional impairment.

48
Table 7.1: Percentage distribution of ADL of the elderly age and gender wise
ADL 60-64 years 65-69 years 70+ years Total
M F T M F T M F T M F T
Feeding
95.0
(57)
95.2
(100)
95.2
(157)
96.2
(75)
91.5
(65)
94.0
(140)
87.3
(55)
87.5
(84)
87.4
(139)
92.8
(187)
91.4
(249)
92.1
(436)
Toileting 93.3
(56)
95.2
(100)
94.5
(156)
96.2
(75)
88.7
(63)
92.6
(138)
88.9
(56)
81.2
(78)
84.3
(134)
92.8
(187)
88.3
(241)
90.5
(428)
Continence
85.0
(51)
91.4
(96)
89.1
(147)
92.3
(72)
90.1
(64)
91.3
(136)
85.7
(54)
82.3
(79)
83.6
(133)
87.6
(177)
87.9
(239)
87.7
(416)
Dressing 95.0
(57)
96.2
(101)
95.8
(158)
96.2
(75)
90.1
(64)
93.3
(139)
90.5
(57)
83.3
(80)
86.2
(137)
93.9
(189)
89.8
(245)
91.8
(434)
Bathing 88.3
(53)
96.2
(101)
93.3
(154)
96.2
(75)
90.1
(64)
93.3
(139)
93.7
(59)
85.4
(82)
88.7
(141)
92.7
(187)
90.5
(247)
91.6
(434)
Walking
and
transferring
85.0
(51)
84.8
(89)
84.8
(140)
92.3
(72)
78.9
(56)
85.9
(128)
81.0
(51)
66.7
(64)
72.3
(115)
81.6
(174)
76.8
(209)
79.2
(384)
The above table gives an idea of the activities which carried out by the elderly independently
(without help). Majority of the respondents are able to perform ADLs without any help. There
were some of the elderly who were unable to carry out the activities due to functional
impairment.
Table 7.2: Scoring of the ADL scores
60-64 years 65-69 years 70+ years Total
M F T M F T M F T M F T
0-2 (Severe
Functional
6.7 4.8 5.5 3.8 9.9 6.7 11.1 16.7 14.5 6.9 10.2 8.8

49
Impairment) (4) (5) (9) (3) (7) (10) (7) (16) (23) (14) (28) (42)
3-4
(Moderate
Functional
Impairment)
5.0
(3)
2.9
(3)
3.6
(6)
10.3
(8)
11.3
(8)
10.7
(16)
12.7
(8)
19.8
(19)
17.0
(27)
9.4
(19)
11.0
(30)
10.3
(49)
5-6
(Independent)
88.3
(53)
92.4
(97)
90.9
(150)
85.9
(67)
78.9
(56)
82.6
(123)
76.2
(48)
63.5
(61)
68.6
(109)
83.5
(168)
78.6
(214)
80.7
(382)
Figure7.1: Percentage Distrubution of ADL score
Majority of the elderly (80.7 %) were independent and could carry out the ADL by
themselves. About 10.3 percent had moderate functional impairment and 8.8 percent had
severe functional impairment.

50
INSTRUMENTAL ACTIVITIES OF DAILY LIVING
Apart from ADLs, the ‘instrumental activities of daily living’ (IADLs) constitute an
important dimension of functional limitations or disability among the elderly. IADLs are
designed to involve a more complex set of functioning than the ADL-based functional
disability measures; they require more skill, judgment and independence than the ADLs
(Kovar and Lawton, 1994). The eight domains, all of which were covered in the survey,
included the ability to telephone, go shopping, food preparation, housekeeping, doing laundry,
travelling, responsibility for own medication and ability to handle finances. The table presents
the percentage of elderly with difficulties in executing different IADL tasks under the
categories of ‘without help’, ‘with help’ and ‘unable to do’.
Table 7.3: Percentage distribution of IADL of the elderly age and gender wise
IADL 60-64 years 65-69 years 70+ years Total
M F T M F T M F T M F T
Maintaining finances
Without
help
65.0
(39)
53.3
(56)
57.6
(95)
74.4
(58)
54.9
(39)
65.1
(97)
54.0
(34)
42.7
(41)
47.2
(75)
65.1
(131)
50.0
(136)
56.4
(267)
With
help
33.3
(39)
36.2
(38)
35.2
(58)
25.6
(20)
40.8
(29)
32.9
(49)
41.3
(26)
35.4
(34)
37.7
(60)
42.2
(85)
30.1
(82)
35.3
(167)
Unable
to do
1
(1)
9.6
(10)
5.3
(11)
0 4.2
(3)
2.1
(3)
3.2
(2)
19.8
(19)
13.2
(21)
1.4
(3)
11.7
(32)
7.3
(35)
Transportation
Without
help
75.0
(45)
73.3
(77)
73.9
(122)
87.2
(68)
64.8
(46)
76.5
(114)
57.1
(36)
46.9
(45)
50.9
(81)
74.1
(149)
61.7
(168)
67.0
(317)
With
help
23.3
(14)
21.9
(23)
22.4
(37)
12.8
(10)
32.4
(23)
22.1
(33)
36.5
(23)
40.6
(39)
39
(62)
23.3
(47)
31.2
(85)
27.9
(132)
Unable
to do
1.7
(1)
4.9
(5)
3.3
(6)
0 2.8
(2)
1.4
(2)
4.8
(3)
11.4
(11)
8.1
(14)
1.9
(4)
6.6
(18)
4.6
(22)
Shopping

51
Without
help
78.3
(47)
75.2
(79)
76.4
(126)
82.1
(64)
67.6
(48)
75.2
(112)
63.5
(40)
55.2
(53)
58.5
(93)
75.1
(151)
66.1
(180)
69.9
(331)
With
help
15.0
(9)
21.0
(22)
18.8
(31)
17.9
(14)
25.4
(18)
21.5
(32)
31.7
(20)
27.1
(26)
28.9
(46)
21.3
(43)
24.2
(66)
23.0
(109)
Unable
to do
6.7
(4)
3.9
(4)
5.3
(8)
0 7.0
(5)
3.5
(5)
4.8
(3)
16.6
(16)
10.7
(19)
3.4
(7)
9.1
(25)
6.7
(32)
Preparing meals
Without
help
25.0
(15)
79.0
(83)
59.4
(98)
38.5
(30)
71.8
(51)
54.4
(81)
17.5
(11)
54.2
(52)
39.6
(63)
27.8
(56)
68.3
(186)
51.1
(242)
With
help
63.3
(38)
19
(20)
35.2
(58)
57.7
(45)
26.8
(19)
43.0
(64)
69.8
(44)
32.3
(31)
47.2
(75)
63.1
(127)
25.7
(70)
41.6
(197)
Unable
to do
11.6
(7)
1.9
(2)
6.7
(9)
2.6
(2)
1.4
(1)
2.0
(3)
9.5
(6)
12.5
(12)
11.0
(18)
7.4
(15)
5.5
(15)
6.4
(30)
Using telephone
Without
help
38.3
(23)
16.2
(17)
24.2
(40)
30.8
(24)
11.3
(8)
21.5
(32)
11.1
(7)
7.3
(7)
8.8
(14)
26.8
(54)
11.7
(32)
18.1
(86)
With
help
23.3
(14)
34.4
(36)
30.3
(50)
29.5
(23)
29.6
(21)
29.5
(44)
23.8
(15)
13.5
(13)
17.6
(28)
25.8
(52)
25.7
(70)
25.7
(122)
Unable
to do
38.3
(23)
49.6
(52)
45.7
(75)
39.8
(31)
59.2
(42)
44.5
(73)
65.1
(41)
78.1
(75)
71.6
(116)
47.2
(95)
62.1
(169)
55.8
(264)
Managing medications
Without
help
76.7
(46)
77.1
(81)
77.0
(127)
84.6
(66)
71.8
(51)
78.5
(117)
58.7
(37)
52.1
(50)
54.7
(87)
74.1
(149)
66.9
(182)
69.9
(331)
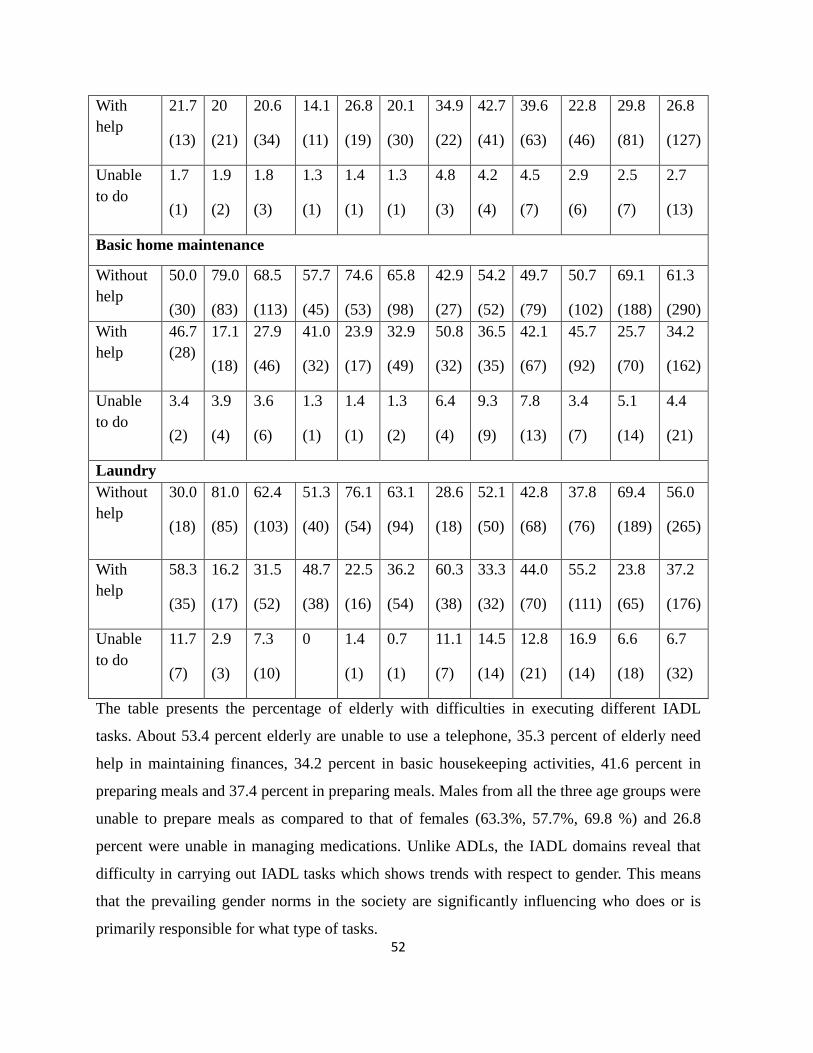
52
With
help
21.7
(13)
20
(21)
20.6
(34)
14.1
(11)
26.8
(19)
20.1
(30)
34.9
(22)
42.7
(41)
39.6
(63)
22.8
(46)
29.8
(81)
26.8
(127)
Unable
to do
1.7
(1)
1.9
(2)
1.8
(3)
1.3
(1)
1.4
(1)
1.3
(1)
4.8
(3)
4.2
(4)
4.5
(7)
2.9
(6)
2.5
(7)
2.7
(13)
Basic home maintenance
Without
help
50.0
(30)
79.0
(83)
68.5
(113)
57.7
(45)
74.6
(53)
65.8
(98)
42.9
(27)
54.2
(52)
49.7
(79)
50.7
(102)
69.1
(188)
61.3
(290)
With
help
46.7
(28)
17.1
(18)
27.9
(46)
41.0
(32)
23.9
(17)
32.9
(49)
50.8
(32)
36.5
(35)
42.1
(67)
45.7
(92)
25.7
(70)
34.2
(162)
Unable
to do
3.4
(2)
3.9
(4)
3.6
(6)
1.3
(1)
1.4
(1)
1.3
(2)
6.4
(4)
9.3
(9)
7.8
(13)
3.4
(7)
5.1
(14)
4.4
(21)
Laundry
Without
help
30.0
(18)
81.0
(85)
62.4
(103)
51.3
(40)
76.1
(54)
63.1
(94)
28.6
(18)
52.1
(50)
42.8
(68)
37.8
(76)
69.4
(189)
56.0
(265)
With
help
58.3
(35)
16.2
(17)
31.5
(52)
48.7
(38)
22.5
(16)
36.2
(54)
60.3
(38)
33.3
(32)
44.0
(70)
55.2
(111)
23.8
(65)
37.2
(176)
Unable
to do
11.7
(7)
2.9
(3)
7.3
(10)
0 1.4
(1)
0.7
(1)
11.1
(7)
14.5
(14)
12.8
(21)
16.9
(14)
6.6
(18)
6.7
(32)
The table presents the percentage of elderly with difficulties in executing different IADL
tasks. About 53.4 percent elderly are unable to use a telephone, 35.3 percent of elderly need
help in maintaining finances, 34.2 percent in basic housekeeping activities, 41.6 percent in
preparing meals and 37.4 percent in preparing meals. Males from all the three age groups were
unable to prepare meals as compared to that of females (63.3%, 57.7%, 69.8 %) and 26.8
percent were unable in managing medications. Unlike ADLs, the IADL domains reveal that
difficulty in carrying out IADL tasks which shows trends with respect to gender. This means
that the prevailing gender norms in the society are significantly influencing who does or is
primarily responsible for what type of tasks.

53
CHAPTER 8: PRIMARY CAREGIVER
Primary caregiver
Caregiving, simply, is the regular provision of care to someone. The nature of care depends on
the specific needs of the recipient. An older person, for example, may need help with
household tasks such as cleaning, preparing meals, and arranging medical services or
transportation. Those who are more disabled may need assistance with daily living activities
such as dressing, bathing or toileting. Older people may require help with thought-related
tasks: making decisions, managing money, and getting from place to place. An elderly may
also need care due to loss of health, loss of memory, the onset of illness, an incident (or risk)
of falling, anxiety or depression, grief, or a disabling condition.
Relationship with the Primary caregiver
The care giver may be a family member, a trained professional or another individual.
Depending on culture there may be various members of the family engaged in care. Family
caregivers are a varied group. Many are spouses of the older person and are, themselves, often
limited in the activities they can perform. Another large group of caregivers are the children of
older people, particularly daughters and daughters-in-law, and, on occasion, sons. Caregivers
also include other relatives — sisters and brothers, nieces, nephews, cousins and
grandchildren — as well as friends and acquaintances.
Table 8.1: Percentage distribution of time spent by the caregiver age and gender wise
60-64 years 65-69 years 70+ years Total
M F T M F T M F T M F T
Caregiver
Spouse
68.3
(41)
24.8
(26)
40.6
(67)
51.3
(40)
16.9
(12)
34.9
(52)
47.6
(30)
7.3
(7)
23.3
(37)
55.2
(111)
16.4
(45)
32.9
(156)
Children
16.7
(10)
55.2
(58)
41.2
(68)
32.1
(25)
49.3
(35)
40.3
(60)
39.7
(25)
67.7
(65)
56.6
(90)
29.8
(60)
57.8
(158)
46.0
(218)
Others 15.0
(9)
18.1
(19)
16.5
(28)
16.6
(13)
33.2
(24)
24.9
(37)
12.7
(8)
24.9
(24)
18.8
(32)
14.9
(30)
24.5
(67)
20.5
(97)

54
Availability of the caregiver
Full time 55.0
(33)
40.0
(42)
45.5
(75)
56.4
(44)
32.4
(23)
45.0
(67)
57.1
(36)
37.5
(36)
45.3
(72)
56.2
(113)
36.9
(101)
45.2
(214)
Only
during
the night
35.0
(21)
42.9
(45)
40.0
(66)
25.6
(20)
45.1
(32)
34.9
(52)
31.7
(20)
43.8
(42)
39.0
(62)
30.3
(61)
43.5
(119)
38.0
(180)
Only
when
called
1.7
(1)
9.5
(10)
6.7
(11)
7.7
(6)
12.7
(9)
10.1
(15)
7.9
(5)
13.5
(13)
11.3
(18)
5.9
(12)
11.7
(32)
9.3
(44)
Unavailability of the caregiver
Able to
manage
by
myself
73.3
(44)
68.6
(72)
70.3
(116)
61.5
(48)
62.0
(44)
61.7
(92)
57.1
(36)
59.4
(57)
58.5
(93)
63.6
(128)
63.3
(173)
63.6
(301)
Someone
else
comes in
20.0
(12)
24.8
(26)
23.0
(38)
24.4
(19)
23.9
(17)
24.2
(36)
30.2
(19)
31.2
(30)
30.8
(49)
24.8
(50)
26.7
(73)
26.0
(123)
Time provided by caregiver- sufficient
Yes
90
(54)
86.7
(91)
87.9
(145)
83.3
(65)
80.3
(65)
81.9
(122)
85.7
(54)
78.1
(75)
81.1
(129)
86.0
(173)
81.6
(223)
83.7
(396)
The study shows that, majority of the male elderly have their spouse as their primary
caregivers, however this doesn’t hold true in case of females as with increase in the age their
caregiver has changed. As there more number of widowed females their caregivers have been
either their children or relatives. The others in the caregiving category included relatives,
neighbors. There was no institutional caregiver for any of the elderly in the sample.
About 55 percent males and 40 percent females in the 60-64 years group had caregiver present
for the entire day. 35 percent of the male elderly and 42.9 percent female elderly had
caregivers available only at night. Similar trend for the other age groups was observed.

55
In cases where there was no caregiver the elderly managed by themselves. Though with the
increases in age the number of elderly who managed by themselves decreased. In cases of
unavailability of the caregiver they called upon either any family member, relative or
neighbours for assistance. Majority of the elderly reported that the time provided by the
caregiver was sufficient.

56
CHAPTER 9:HEALTH AND NUTRITION
It is usually believed that chronological age largely determines individuals’ social
participation. But the major life events such as loss of spouse, retirement, affliction with
chronic condition(s) significantly influence life quality of older persons. These life transitions
are largely intertwined with socio-economic statuses and gender of older people. Given the
deterioration that comes with ageing, health problems among the elderly have not yet received
widespread attention; and, health care resources are insufficient for meeting their health care
requirements. Problems related to health are more serious among the many problems faced by
the elderly, in view of the fact that their entire functioning is closely linked with their health
condition. Due to deteriorating physiological conditions with age, the body becomes more
prone to illnesses which are multiple and chronic in nature. The association of old age with
ailments and infirmities is deep-rooted and many of the sufferings, even when curable, are
accepted as natural and inevitable by the elderly and society.
Disability
Table 9.1: Percentage distribution of type of disability of the elderly
Type of disability Percent Number
Visual
Multiple
Hearing
Loco-motor
Speech
8.2
0.6
1.6
1.8
0.2
36
3
8
9
1
The above table depicts the number of elderly which suffer from disability. Elderly with
visual disability was high (8.2 %).

57
Figure 9.1: Type of disability
Self-rated health
The self-rated health is considered as a strong predictor to understand the health status of
people in general and the elderly in particular. The self-rated health was assessed in the survey
using a 5-point scale (1) excellent, (2) good (3) average (4) poor (5) worse.
The survey found that 6 percent of the elderly reported to have excellent health condition
whereas 41 percent of the elderly reported to have an average state of health, followed by 37
percent who reported to have a good health, 13 percent reported to have a poor condition of
health. Only 2 percent of elderly perceived their health to be worse.
Table 9.2: Percentage distribution of self-rate health of the elderly age and gender wise
Rate Health
(Self
Reported)
60-64 years 65-69 years 70+ years Total
M F T M F T M F T M F T
Excellent 6.7
(4)
5.7
(6)
6.1
(10)
12.8
(10)
4.2
(3)
8.7
(13)
3.2
(2)
4.2
(4)
3.8
(6)
7.9
(16)
4.7
(13)
6.3
(29)
Good
46.7
(28)
40
(42)
42.4
(70)
51.3
(40)
29.6
(21)
40.9
(61)
34.9
(22)
21.9
(21)
27.0
(43)
44.7
(90)
30.8
(84)
36.7
(174)
Average 36.7 42.9 40.6 33.3 50.7 41.6 36.5 42.7 40.3 35.3 44.8 40.8

58
(22) (45) (67) (26) (36) (62) (23) (41) (64) (71) (122) (193)
Poor
8.3
(5)
7.6
(8)
7.9
(13)
2.6
(2)
12.7
(9)
7.4
(11)
23.8
(15)
24
(23)
23.9
(38)
10.9
(22)
16.1
(44)
13.9
(66)
Figure 9.2: Percentage distribution of self-rate health of the elderly age and gender wise
The study observed that about 41 percent of the sample reported to rate their health as
average. In the first age group a total about 42 percent, wherein males (47 %) and females 40
percent rated their health as good, in second age group 41 percent, with 51 percent males and
30 percent females and in third 27 percent with 35 percent males and 22 percent females.
14 percent elderly rated their health as poor and this trend increased with increase in age. The
YO had 8 percent elderly, with 8 percent males and females each the category, in MO there
were 7 percent elderly with 3 percent males and 13 percent females and the Oldest Old Age
group had 24 percent elderly rating the same.
Acute Morbidities

59
Morbidity is a state of ill health caused by any disease. Acute morbidity is defined as any
elderly person reporting any event of sickness or ill health during the 15 days prior to the
survey. The reporting is based on the responses of the elderly persons and has therefore been
termed as self-reported morbidity. Depending upon the duration of any illness during this
reference period, there could be four possibilities: (i) morbidity or illness episodes that started
more than fifteen days ago and are continuing during the reference period, (ii) illness or
morbidity episodes that started more than fifteen days ago and ended during the reference
period, (iii) illness or morbidity episodes that occurred during the reference period and were
continuing on the date of survey, and (iv) illness or morbidity episodes that both started and
ended during the reference period.
Table 9.3: Percentage distribution of acute morbidities faced by the elderly age and gender
wise
Diseases 60-64 years 65-69 years 70+ years Total
M F T M F T M F T M F T
Fever 48.3
(29)
46.7
(49)
47.3
(78)
37.2
(29)
54.9
(39)
45.6
(68)
44.4
(28)
47.9
(46)
46.5
(74)
57.2
(115)
49.2
(134)
52.6
(249)
High BP 25
(15)
29.5
(31)
27.9
(46)
17.9
(14)
31
(22)
24.2
(36)
19
(12)
34.4
(33)
28.3
(45)
20.3
(41)
31.6
(86)
26.8
(127)
Cough and
cold
33.3
(20)
33.3
(35)
33.3
(55)
32.1
(25)
33.8
(24)
32.9
(49)
36.5
(23)
37.5
(36)
37.1
(59)
33.8
(68)
34.9
(95)
34.4
(163)
Diarrhea 1.7
(1)
2.9
(3)
2.4
(4)
1.3
(1)
1.4
(1)
1.3
(2)
1.6
(1)
5.2
(5)
3.8
(6)
1.1
(3)
3.6
(10)
2.7
(13)
Asthma 3.3
(2)
1.9
(2)
2.4
(4)
5.1
(4)
5.6
(4)
5.4
(8)
12.7
(8)
5.2
(5)
8.2
(13)
6.9
(14)
4.0
(11)
5.2
(25)
Gastric 6.7
(4)
14.3
(15)
11.5
(19)
6.4
(5)
4.2
(3)
5.4
(8)
15.9
(10)
12.5
(12)
13.8
(22)
9.4
(19)
14.7
(40)
12.4
(59)
Headache 11.7
(7)
18.1
(19)
15.8
(26)
12.8
(10)
23.9
(17)
18.1
(27)
22.2
(14)
13.5
(13)
17
(27)
15.4
(31)
17.9
(49)
16.9
(80)

60
Leg ache 43.3
(26)
41
(43)
41.8
(69)
38.5
(30)
33.8
(24)
36.3
(54)
36.5
(23)
38.5
(37)
37.7
(60)
39.2
(79)
38.2
(104)
38.6
(183)
Body pain 43.3
(26)
50.5
(53)
47.9
(79)
51.3
(40)
45.1
(32)
48.3
(72)
55.6
(35)
61.5
(59)
59.1
(94)
50.2
(101)
52.9
(144)
51.7
(245)
Cataract 5
(3)
7.6
(8)
6.7
(11)
6.4
(5)
8.5
(6)
7.4
(11)
12.7
(8)
12.5
(12)
12.6
(20)
7.9
(16)
9.5
(26)
8.8
(42)
Data on acute morbidities shows that, the most common of them are fever (53 %), body pain
(52 %), cough and cold (34 %), leg ache (39 %) and high blood pressure (27 %).
Chronic Morbidities:
Non-communicable diseases (NCDs), including mental health, are being acknowledged as
major contributors to the disease burden in India. The burden of chronic diseases has been
rising, keeping pace with the demographic transition and the increasing numbers of senior
citizens. Accordingly, it is important to examine the prevalence of chronic ailments.
Table 9.4: Percentage distribution of chronic morbidities faced by the elderly age and
gender wise
Diseases 60-64 years 65-69 years 70+ years Total
M F T M F T M F T M F T
Arthritis 8.3
(5)
17.1
(18)
13.9
(23)
11.5
(9)
14.1
(10)
12.8
(19)
9.5
(6)
14.6
(14)
12.6
(20)
9.4
(20)
15.4
(42)
13.1
(62)
Hypertension
23.3
(14)
23.8
(25)
23.6
(39)
19.2
(15)
26.8
(19)
22.8
(34)
14.3
(9)
20.8
(20)
18.2
(29)
13.9
(28)
23.4
(64)
19.4
(92)
Cataract
11.7
(7)
11.4
(12)
11.5
(19)
7.7
(6)
22.5
(16)
14.8
(22)
22.2
(14)
12.5
(12)
16.4
(26)
13.4
(27)
14.7
(40)
14.1
(67)
Diabetes 11.7
(7)
20.0
(21)
17.0
(28)
14.1
(11)
19.7
(14)
16.8
(25)
4.8
(3)
17.7
(17)
12.6
(20)
10.4
(21)
19.1
(52)
15.4
(73)
Asthma 8.3 6.7 7.3 7.7 4.2 6 14.3 8.3 10.7 9.9 6.6 8.0

61
(5) (7) (12) (6) (3) (9) (9) (8) (17) (20) (18) (38)
Heart
diseases
6.7
(4)
3.8
(4)
4.8
(8)
10.3
(8)
2.8
(2)
6.7
(10)
3.2
(2)
4.2
(4)
3.8
(6)
6.9
(14)
3.6
(10)
5.0
(24)
Osteoporosis 6.7
(4)
5.7
(6)
6.1
(10)
7.7
(6)
8.5
(6)
8.1
(12)
7.9
(5)
13.5
(13)
11.3
(18)
7.4
(15)
9.1
(25)
8.4
(40)
Skin diseases 8.3
(5)
3.8
(4)
5.5
(9)
5.1
(4)
2.8
(2)
4
(6)
4.8
(3)
3.1
(3)
3.8
(6)
5.9
(12)
3.2
(9)
4.4
(21)
Renal
diseases
8.3
(5)
3.8
(4)
5.5
(9)
6.4
(5)
0 3.4
(5)
7.9
(5)
0 3.1
(5)
7.4
(15)
1.4
(4)
4.0
(19)
Paralysis 1.7
(1)
0 0.6
(1)
2.6
(2)
4.2
(3)
3.4
(5)
1.6
(1)
6.2
(6)
4.4
(7)
1.9
(4)
3.3
(9)
2.7
(13)
Liver
diseases
16.7
(10)
3.8
(4)
8.5
(14)
12.8
(10)
2.8
(2)
8.1
(12)
15.9
(10)
6.2
(6)
10.1
(16)
14.9
(30)
4.4
(12)
8.8
(42)
Chronic lung
diseases
6.7
(4)
5.7
(6)
6.1
(10)
7.7
(6)
12.7
(9)
10.1
(15)
6.3
(4)
4.2
(9)
5.0
(13)
6.9
(14)
8.8
(24)
8.0
(38)
Depression 8.3
(5)
9.5
(10)
9.1
(15)
5.1
(4)
9.9
(7)
7.4
(11)
7.9
(5)
14.6
(14)
11.9
(19)
6.9
(14)
11.3
(31)
9.5
(45)
Cerebral
stroke
5
(3)
2.9
(3)
3.6
(6)
0 0 0 1.6
(1)
2.1
(2)
1.9
(3)
2.9
(6)
1.8
(5)
2.3
(11)
Fall 21.7
(13)
20
(21)
20.6
(34)
20.5
(16)
12.7
(9)
16.8
(25)
22.2
(14)
22.9
(22)
22.6
(36)
21.3
(43)
19.1
(52)
20.0
(95)
Vertigo 41.7
(25)
40
(42)
40.6
(67)
25.6
(20)
42.3
(30)
33.6
(50)
36.5
(23)
39.6
(38)
38.4
(61)
33.8
(68)
40.4
(110)
37.6
(178)

62
The most common chronic morbidities reported by the elderly were arthritis (51 %), vertigo
(37 %), fall (20 %), hypertension (19 %) and diabetes (15 %).
Nutrition Screening Checklist
Older people are vulnerable to malnutrition for many reasons including physiological and
functional changes that occur with age, lack of financial support and inadequate access to
food. The functional status of the elderly is their ability to carry out their day to day activities
including preparation of food and intake, thereby affecting nutritional status. In India, the
problem of the health of the elderly is compounded by poor nutrition together with medical
issues, including both communicable and noncommunicable diseases. Malnutrition and
morbidity create a vicious cycle.
The nutrition and health of the elderly is often neglected. Most nutritional intervention
programs are directed toward infants, young children, adolescents, and pregnant and lactating
mothers. However, nutritional interventions could play a part in the prevention of degenerative
conditions of the elderly and an improvement of their quality of life. A timely intervention can
stop weight loss in those at risk of malnutrition. Unfortunately, not much explanation has been
given for the precise estimate of under-nutrition in this age group in the field of research.
Given adequacy in the research in the nutritional aspect of elderly an evaluation of nutritional
status is important for the creation of a database to assist with the initiation of important
programs and formulation of policies.
In the present study a remarkable proportion(58%) of elderly consumed tobacco, smoke or
alcohol. Almost half of the elderly (47 %) did not have money to purchase food for their daily
requirement. A more elaborate description of the above information is given in the Table 9.5
Table 9.5: Percentage distribution of nutrition screening checklist among the elderly
60-64 years 65-69 years 70+ years Total
M F T M F T M F T M F T
Illness or
condition
due to
33.3
(20)
21.0
(22)
25.5
(42)
12.8
(10)
25.4
(18)
18.8
(28)
28.6
(18)
35.4
(34)
32.7
(52)
23.8
(48)
27.2
(74)
25.7
(122)

63
which there
is a change
the kind
and/ or
amount of
food I eat
Consume
fewer than
two meals
per day
35.0
(21)
21.9
(23)
26.7
(44)
30.8
(24)
35.2
(25)
32.9
(49)
47.6
(30)
35.4
(34)
32.7
(52)
37.3
(75)
25.7
(70)
30.6
(145)
Consume
few fruits,
vegetables
or milk
products
53.3
(32)
39.0
(41)
44.2
(73)
34.6
(27)
35.2
(25)
34.9
(52)
44.4
(28)
41.7
(40)
42.8
(68)
43.2
(87)
38.9
(106)
40.8
(193)
Consume
tobacco,
smoke or
drink
alcoholic
beverages
almost
every day
73.3
(44)
51.4
(54)
59.4
(98)
67.9
(53)
45.1
(32)
57.0
(85)
66.7
(42)
53.1
(51)
58.5
(93)
69.1
(139)
50.3
(137)
58.3
(276)
Tooth or
mouth
problems
25.0
(15)
24.8
(26)
24.8
(41)
35.9
(28)
39.4
(28)
37.6
(56)
52.4
(33)
45.8
(44)
48.4
(77)
37.8
(76)
36.0
(98)
36.7
(174)
No enough
money to
buy food
40.0
(24)
44.8
(47)
43.0
(71)
34.6
(27)
57.7
(41)
45.6
(68)
52.4
(33)
53.1
(51)
52.8
(84)
41.7
(84)
51.1
(139)
47.1
(223)
Eat alone 13.3
(8)
21.0
(22)
18.2
(30)
16.7
(13)
18.3
(13)
17.4
(26)
19.0
(12)
30.2
(29)
25.8
(41)
16.4
(33)
23.5
(64)
20.5
(97)
Take more
than 3
medicines
per day
33.3
(20)
33.3
(31)
33.3
(55)
21.8
(17)
42.3
(30)
31.5
(47)
27.0
(17)
41.7
(40)
35.8
(57)
26.8
(54)
38.6
(105)
33.6
(159)
Lost/
gained 5
25.0 29.5 27.9 34.6 36.6 35.6 42.9 44.8 44.0 34.3 36.7 35.7

64
kgs in the
last month
(15) (31) (46) (27) (26) (53) (27) (43) (70) (69) (100) (169
Unable to
shop, cook
or feed self
50.0
(30)
41.9
(44)
44.8
(74)
44.9
(35)
49.3
(35)
47.0
(70)
49.2
(31)
62.5
(60)
57.2
(91)
47.7
(96)
51.1
(139)
49.6
(235)
About 31 percent of the sample consumed less than 2 meals in a day. This was seen more
common in women as compared to men.
As mentioned before a large proportion of the elderly consumed tobacco, smoke or alcohol on
a regular basis. In case of women they consumed tobacco and miseri. Addiction of these
substances decreases appetite leading to reduce the dietary intake. Dental issues like loss of
teeth, caries and cavities were prevalent in 37 percent of the elderly. About 47 percent of the
elderly did not have enough economic sources to buy food. 21 percent of the elderly had their
food alone.34 percent had more than 3 medications in a day. It is said that due to consumption
of various drugs the drug nutrient reaction hampers the absorption of various nutrients
affecting the nutrition status. 36 percent elderly had fluctuations in the weight.
About half of the surveyed elderly were unable to shop, cook or feed themselves.
Age-wise and gender wise analysis of the nutrition screening checklist score of the
elderly
Table 9.7: Percentage distribution of total score of nutrition screening checklist among the
elderly age and gender wise
Scores
range
60-64 years 65-69 years 70 years and
above
Total
M F T M F T M F T M F T
0-2
(Good)
13.8
(8)
15.2
(16)
14.5
(24)
19.2
(15)
18.3
(13)
18.8
(28)
4.8
(3)
7.3
(7)
6.3
(10)
12.9
(26)
13.2
(36)
13.1
(62)
3-5
(Moderate
Nutritional
Risk)
23.3
(14)
26.7
(28)
25.5
(42)
18.3
(13)
23.1
(18)
20.8
(31)
12.7
(8)
13.5
(13)
13.2
(21)
17.4
(35)
21.6
(59)
19.8
(94)

65
6 and
above
(High
Nutritional
Risk)
63.3
(38)
58.1
(61)
60.0
(99)
57.7
(45)
63.4
(45)
60.4
(90)
82.5
(52)
79.2
(76)
80.5
(128)
67.1
(135)
66.9
(182)
67.0
(317)
The Nutritional Checklist was used to assess the risk of elderly to malnutrition. The checklist
has a scoring system wherein pre-determined points are allotted to each question. The
respondent is supposed to select the statement that applies to them. The nutritional scores
finally obtained are categorized into three sections; Score0-2: Good, Score 3-5: Moderate
Nutritional Risk, Score 6 or more; High nutritional risk. Each case can be individually
analyzed to assess their nutritional scores.
Only 13 percent elderly were observed to have a good nutritional score, wherein there was
marginal difference on gender basis. About 19.8 percent elderly were at moderate nutritional
risk which was seen more in women (21.6 %) as compared to that of men (17.4 %). This trend
was followed in all the three age groups.
About 67 percent of the elderly were at high nutritional risk. The score increases with respect
to the increase in age
Anthropometry
Body Mass Index (BMI) is an important indicator of nutrition status. It is usually measured
using anthropometric measurements which include height and weight.
Table 9.8: Percentage distribution of BMI of elderly age and gender wise
BMI Range 60-64 years 65-69 years 70+ years Total
M F T M F T M F T M F T
Underweight
10.0
(6)
3.8
(4)
6.1
(10)
19.2
(15)
9.9
(7)
14.8
(22)
30.2
(19)
26.0
(25)
27.7
(44)
19.9
(40)
9.5
(26)
16.0
(76)
Normal
58.3
(35)
52.4
(55)
54.5
(90)
57.7
(45)
57.7
(41)
57.7
(86)
50.8
(32)
53.1
(51)
52.2
(83)
55.7
(112)
54.0
(147)
54.7
(259)
Overweight 25 31.4 29.1 12.8 23.9 18.1 14.3 13.5 13.8 16.9 23.1 20.5

66
(15) (33) (48) (10) (17) (27) (9) (13) (22) (34) (63) (97)
Obese
5
(3)
9.5
(10)
7.9
(13)
9
(7)
8.5
(6)
8.7
(13)
4.8
(3)
7.3
(7)
6.3
(10)
6.4
(13)
8.4
(23)
7.6
(36)
Data on BMI revealed that almost 55 percent of the elderly belonged to the normal range.
There were 21 percent elderly who were overweight, 16 percent underweight and 8 percent
obese. Malnutrition includes both underweight, overweight and obese, thus it can be
summarized that about the remaining 45 percent belonged to this category.
In the underweight sample it was seen that a higher proportion of males (20 %) were
underweight as compared to that of females (10 %). This trend was seen across all the age
groups; males 10 percent (60-64yrs), 19 percent (65-69 yr) and 30 percent (70+yr) compared
to females 4 percent (60-64yrs), 10 percent (65-69 yr) and 26 percent (70+yr). In the obese
and overweight category females were more in number then males.

67
Conclusions
This study gives an idea about status of elderly living in Ramtekdi area with respect to various
aspects like economic, social and health. This survey helps us to draw conclusions and
suggestions for making actionable measures for further intervention. An adequate dietary
intake is an essential component of successful ageing, maintaining health and well being of
the elderly. Nutrition depends on a viscous cycle of multi dimension variables and factors like
physical health, social environment, and economic factors like affordability to receive the
requirement of every individual.
With increasing age there is physical deterioration and changes in terms of physiology which
makes the elderly susceptible to a number of communicable and non-communicable diseases.
Certainly the prevalence of NCDs is way more and requires serious attention. One such non
communicable disease or a condition is malnutiriton. Malnutrition was initially considered
with regard to not meeting the protein energy requirement of the body; but now it is more than
protein energy but now concentrates on undernutrition and overnutrition.
Changes in nutrition or Nutrition transition was persistent accompanied by change in the
preference of dietary habits. A trend to prefer high calorific diet which is also available at
cheaper costs has led to obesity. In case of elderly there is an increase in incidence of obesity.
Sedentary lifestyle with less physical activity is another contributing factor to various
mortalities among the elderly.
The key determinants which determine the nutritional status among the elderly include social
factors with change in trends of caregiving and weaker social support. Another factor which
hampers their health and nutrition status is social isolation, staying away from the family,
infrequent visits by family members, singlehood, destitution all has a negative effect on their
health. Stress and worries along with loneliness sometimes cause the elderly to face
psychological complications which affects their daily chores. They do not take any interest in
their life and neglect taking care of themselves. Change in food habits also make them less
likely to adapt to the food thus affecting the dietary intake drastically. With this social
environment they develop friendship and bond with neighbors.
Economic factors like poverty, destitution causes inability to access optimum dietary intake.
Affordability and accessibility determines the choice and preference of the intake dietary food.
In case of better socio economic status there are two possibilities which are consumption of
excess and high calories food and other wherein there is knowledge and acceptance of healthy
eating habits and enhancing the dietary intake to enhance the nutritional content of the food.
Psychological factors like loneliness, develop into psychological complications along with
other co-morbidities contributes to poor health condition. With ageing there is visual deficit,

68
decreased taste and smell due to less activity of receptors, dental problems reducing the
dietary consumption.
Thus it can be summed up that living arrangement, economic status, gender issues, food
security, urbanization, poverty, physical activity, drug nutrient interaction, food preference and
choice and caregiver are factors which affect the nutrition status in the elderly
The major findings of the study include higher number of females as compared to males
which could be due feminisation of ageing, women have higher life expectancy, higher
number of widows, comparatively fewer addictions improving their health status. Majority of
the elderly did not receive any pension. Social factors which affected their dietary intake
included weak familial support system, social isolation and disruption, loss of primary
caregiver which in turn affected them by leading to psychological complications along with
other health complication further hampering the dietary intake.
Action points for intervention:
Majority of the elderly are not beneficiaries of any social security scheme. There is a
need for enrolling these elderly and increase penetration of scheme awareness within
the community.
Elderly economic situation is observed to be unsatisfactory. Income generation
programmes should be designed and executed effectively.
Considering the health status, elderly with disabilities need to be provided special
provisions to cater to their functional needs.
Screening of elderly suffering from diabetes or any other major chronic morbidity
should be conducted and their health status should be monitored at regular intervals.
Elderly who fall in BMI category other than normal should be assessed clinically for
symptoms and lifestyle behavior that cause risk to malnutrition.
A high number of elderly have been noted to be addicted to smoking/drinking/chewing
tobacco. These elderly should be identified and interventions need to be designed to
avoid further deterioration of health.

69
Social Mapping of Utility Agencies in Study Areas
Background
Social Mapping of utility agencies in an area is important as it helps not only the elderly who
are in need of various services from such agencies, but also for the agencies to interact with
other agencies around them. The present effort in social mapping will also be useful for Non-
Governmental organizations, researchers and academicians who are involved in the field of
ageing. An innovativeness of the present effort is that agencies present in each of the study
areas are plotted in specially prepared maps with help of geographical information system
(GIS). Such a effort will greatly help in understanding the spread of agencies and their
accessibility in the particular study area.
All the agencies which are required by the elderly for their day to day activities are considered
for social mapping. A list of organizations covered under social mapping is attached herewith.
Methodology
The methodology adopted was to identify various utility organizations in the study areas and
physically verify these organizations on a census basis. Given the physical verification of the
agencies by the trained field workers, we may assume that the social mapping covered all the
listed agencies in the study areas. The agencies are plotted on a road network map and
detailed list is given subsequently. The location of an agency in each study area can be
observed by an identification number given to that particular agency in the map.
Social mapping technique which is adopted while creating the maps is very informative. It
acts as a important tool to assess location aspects and focus on relevant needs. As mobility is a
major issue for the elderly; utilization of services, provided by the agencies, depends on ease
of accessibility. Prior to the physical identification of agencies, a list of probable agencies for
their inclusion in the social mapping was shared with the nodal agencies in both the study
areas.
A total of 507 agencies were identified across study areas (Ramtekdi, Pune:104; Dharavi
&Matunga Labour Camp:144; Lower Parel:259). This was a time consuming exercise as
many of the organizations were located on internal roads or between housing structures. Field
checking helped in reducing the error in plotting, yet there is a possibility of margin of error of
5-10 meters in plotting of agencies. Due to limited geographical extent of the study area, use
of global positioning satellite(GPS) to pinpoint exact location of an agency proved unsuitable.
The social mapping in Ramtekdi area near Hadapsar, Pune helped in identifing 104 utility
agencies. Majority of these are provision stores (26), followed by common toilets (15) and
community centre/mandal (12). Other than these there are three public distribution system

70
shops in the area. In case of health related agencies, it was observed that seven
hospitals/clinics along with 3 medical shops are present in the study area. The concentration
on the agencies is higher in the eastern part of the study area due to high density of houses in
the area.
Number
Autorickshaw Stand 1
Common Toilets 15
Community Centre/Mandal 12
Grocery Shop 5
Health centre 1
Hospitals 2
Hospitals & Clinics 5
Library 3
Medical Shop 3
MLA Office 1
Mobile Recharge / Repair Shop 6
Mobile Shop 2
NGO Centre 3
Others 7
Parks & Grounds 1
Political Party Office 4
Provision Store 26
Public Distribution System 3
Religious Places 3
Telephone Booth 2
Total 105
Establishing Linkages between Nodal Agency &Utility Agencies
The study clearly revealed that there is ample scope to establish linkages between nodal
agency and utility agencies through various programmes over a period of time, which will
have a positive impact on the elderly community in the study area. Besides stressing about the
importance of linking programmes with other stakeholders, the following points are listed for
the consideration of the agency.
- The agency can involve other NGOs and Senior Citizen Associations to increase
awareness about social security schemes for the elderly.

71
- It can organize counseling sessions by doctors from hospitals/clinics in the vicinity to
create awareness about ill-effects of tobacco chewing/smoking/drinking.
- Religious places in the area can be used as the venue in case of limited options and to
attract elderly to attend such sessions.
- Similarly it can also tie up with the doctors for routine health check-ups, health camps,
as many of the elderly have health issues like diabetes, arthritis and hypertension.
- Tie-ups can also be made with few medical shops in the study areas, from where the
agency volunteers can get discounted medicines for the elderly and distribute it at the
agency/ arrange for home delivery.
- There are several community centre/mandals in the study area which can engage
elderly in their social activities. The agency can act as a bridge between the elderly and
the community centre/mandals in this regard.
- Agency can tie up with specific mobile shop / service provider to enable elderly to get
special tariff plans and cost-effective simple handsets.
- Food security of the elderly is a major concern in study areas. Grocery shops/provision
stores can be made partner to purchase items of day to day diet at wholesale rates and
make it available to elderly at a retail rate.
- It was observed that the study areas are close to business districts which can facilitate
the agency to explore opportunities of involving corporate partnership/funding in its
programmes as part of their CSR initiatives.

72

73
REFERNECES
Alam, M. (2004) Ageing, Old Age Income Security and Reforms: An Exploration of
Indian Situation. Economic and Political Weekly, pp. 3731-3740 August 14.
(2007) Ageing in India: Socio - Economic and Health Dimensions (AF Press).
Arjan, H. (2001) Social Exclusion: Enriching the Understanding of Deprivation
(University of Sussex).
Dak, T.M. and Sharma, M.L. (1987) Changing Status of the Aged in North Indian Villages.
pp. 43-55 in M.L. Sharma and T.M. Dak (ed) Aging in India (Ajanta Publications, New
Delhi).
Dandekar, K. (1993) The Aged, their Problems and Social Interventions in Maharashtra.
Economic and Political Weekly, Vol.XXVII No. 23 June 5, pp. 1188-94.
Darshan, S. et al. (1987) Health Needs of Senior Citizens. In M.L Sharma and T.M.Dak
(ed) Aging in India (Ajanta Publications, New Delhi).
Desai, K. G. (1985) Situation of the Aged in India. Journal of Indian Anthropological
Society, 20(3).
Dey, A. B. (ed. 2003) Ageing in India (World Health Organization and Ministry for Health
and Family Affairs, Government of India).
Uraisamy, P. (2001). Health status and curative health care in rural India. Working Paper
Series No. 78, National Council of Applied Economic Research (NCAER)
Gangrade, K.D. (1989) Ageing in India. The Eastern Anthropologist, Vol. 42, No 2.
Goswami, I. (2005) Ageing India, Sociological Issues. Presented in Indian Sociological
Congress.
Government of India (1999). Report of Expert Committee of Projects, OASIS, New Delhi.
Gupta, I. and Sankar, D. (2003) Health of the Elderly in India: A Multivariate Analysis.
Journal of Health & Population in Developing Countries, June.
Helpage Age International. Various Country Reports from 1990.
Helpage. (1998) Age India, Directory of Old age Homes in India. Research and
Development Division. Helpage India. New Delhi.
Joseph, J. (1987) Aged in India: Problems and Personality (Chugh Publications,
Allahabad).

74
Kane, R.L. et al (1990) Improving the Health of Older People. WHO, OUP.
Keith, J. et.al (1994) The Aging Experience (Sage Publications, London).
Keyfitz, N. and Flieger, W. (1990) World Population Growth and Aging: Demographic
Trends in the Late Twentieth Century (University of Chicago Press, Chicago).
Kinsella, K. and Velkoff, V.A. (2001) An Ageing World Population -Paris- 2002, Vol. 57;
Part 6, pp. 928-929.
------------------------------------- (2001) An Ageing World (National Institute on Aging and
US Census Bureau; Washington, DC; Nov).
Klasen, S. (1996) Nutrition, Health, and Mortality in Sub-Saharan Africa: Is there a
Gender Bias? Journal of Development Studies 32, pp. 913-932.
Knodel, J. and Auh, T. (2002) Vietnam’s Older Population: The View from the Census.
Asia Pacific
Population Journal, Vol.17, No.3, pp. 5-22.
Nandal, D.S. et al. (1987) Ageing Problems in the Structural Context. pp. 106-16 in M.L.
Sharma and T.M. Dak (ed) Aging in India (Ajanta Publications, New Delhi).
National Labour Institute, Report on Living Condition of Indian Workers, New Delhi,
2006.
National Sample Survey Organisation (NSSO) The Aged in India: A Socio-economic
Profile 1995-96. Government of India, New Delhi, 1997.
National Sample Survey Organisation (NSSO), Morbidity, Health Care and the Condition
of Aged. Government of India, New Delhi, 2006.
Nayar, P.K.B. (1992) Needs and Problems of the Aged: A Case Study of Kerala, ICSSR.
Omran, A. R. (1971) The Epidemiologic Transition. Milbank Memorial Fund Quarterly.
Vol XLIX, Part I. pp. 509-538.
Sarmistha Pal, 2004. "Do Children Act As Old Age Security In Rural India? Evidence
From An Analysis Of Elderly Living Arrangements," Royal Economic Society Annual
Conference 2004 107, Royal Economic Society.
Perera, M. (2004) Summary of IDPAD Study on Sri Lanka, Website of IDPAD, June.
Prakash, I.Jai (1999) Ageing in India prepared for WHO Geneva.
75
Prasad, S. (2007) Does Hospitalization makes Elderly Households Poor: An Examination
of the case of Kerala. India in Social Policy and Administration, Blackwell Synergy,
London, August.
Rajan, S. I. (2001) Social Assistance for Poor Elderly: How Effective? Economic and
Political Weekly, Volume XXXVI, No 8, February 24, pp. 613-617.
------------- (2002) Social Security for the Unorganized Sector in South Asia. International
Social Security Review, Volume 55, No 4, pp. 143-156.
------------ (2004) Chronic Poverty among the Elderly. Working Paper 17, Chronic Poverty
Research Centre, IIPA.
------------ (2006) Report on Kerala Ageing Survey. Unpublished.
------------ (2007) Unpublished IDPAD Study Report.
Rajan, S. I. and Prasad, S. (2008) Social Security for the Aged in the Informal Sector. In
Institutional Provisions and care for Aged, perceptive from Asia and Europe, (Anthem
Press, London).
Rajan, S. I. et al. (1995) Living Arrangements among the Indian Elderly. Hong Kong
Journal of Gerontology, Vol. 9, No. 2, pp. 20-28.
Rajan, S. I. et al. (1999) India National Ageing trends, life long preparation for old age.
Asia and the pacific Journal United Nations.
Rajan, S. I. et al. (1999) India’s Elderly Burden or Challenge (SAGE publication New
Delhi/Thousand Oaks/London).
Registrar General of India, SRS Reports 2003 and 2008.
Schwarz, A. (2003) Old Age Security and Social Pensions. World Bank: Human
Development (Social Protection) Hub: Processed, Washington DC.
Sen AK(1992) Inequality Re-Examined (Clarendon Press, Oxford).
Sen K(1994) Ageing; Debates on Demographic Transition and Social Policy (Zed Books,
London).
Sengupta, M. and E.M. Agree, (2003): Gender, Health, Marriage and Mobility Difficulty
among Older
Adults in India, Asia-Pacific Population Journal, December 2003, 53:65.

76
Serow, W. (2001) Economic and Social Implications of Demographic Patterns. In Robert
K Bienstock and Linda K. George (ed) book Handbook of ageing and the social sciences
(Academic Press, New York).
Shaw, L. B. and Sunhwa, Lee. (2004) Growing Old in the USA: Gender and Income
Adequacy. Institute for Women’s Policy Research, Washington DC, July.
Smeeding, Timothy M., and James Williamson. (2001). Income maintenance in old age:
What can be learned from cross-national comparisons. Working Paper No. 2001–11.
Boston, MA: Boston College Center for Retirement Research.
Smith and Bares. (1991) Epidemiological Transition in South Africa. SRPA Working
Paper.
Steyn, D.L. (2000) Understanding old Age Provisions in South Africa. SAPA series 32.
Umberson, D. et al. (1992) Widowhood and Depression: Explaining Long-term Gender
Differences in Vulnerability. Journal of Health and Social Behavior, (33), pp. 10-24.
UNDP (2003) Annual Report 2003.
UNDP (2000). Poverty Report 2000.
UNFPA. (2005). State of World population, UNFPA
United Nations, The Population Year Book 2001 and 2003.
United Nations, World Population Data Sheet, 2008.
Verbrugge, L.M. (1979) Marital Status and Health. Journal of Marriage and the Family,
Wiggins, R.P. et.al (2004) Life Course and Contextual Factors that Influence Quality of
Life in early old Age. Ageing and Society, 24, pp.693-708.
Williams, A. (2003) Ageing and Poverty in Africa: Ugandan Livelihoods in a time of
HIV/AIDS (Ashgate Publishers, UK).
Wilson and Adamchak. (2007) Diminished Mental- and Physical function and lack of
Social support are associated with shorter survival in Community dwelling older Persons
of Africa http://www.biomedcentral.com/1471-2458/7/144, Durban.
World Bank. (1994) Averting the Old Age Crisis: Policies to Protect the old and Promote
Growth (Washington D.C, Oxford).

77
World Bank. (2001) India: The Challenge of Old Age Income Security. Finance and
Private Sector Development: South Asia Region. Report No. 22034, Washington DC.
World Bank. (2008), Poverty Target Programs for The Elderly In India With Special
Reference to National Old Age Pension Scheme, Washington DC.
World Health Organization (WHO) Bulletin, Geneva, 2003, 2004 and 2007
Wyke, S. and Ford, G. (1992) Competing Explanations for Associations between Marital
Status and
Health. Social Science and Medicine, 34, pp.523-532.
Yadav, J.P. (2006) Securing old Age in Indian Family System. Indian Journal of
Gerontology.

78
ANNEXURE
INTERVIEW SCHEDULE
SITUATIONAL ASSESSMENT OF THE ELDERLY
I. IDENTIFICATION
Name Tenement
Number
Name and number of
building
Locality Contact No.
(optional)
II. DEMOGRAPHIC INFORMATION
Sr
No
Question Response Code
1. Gender Male
Female
Male = 01
Female =0 2
2. Age (completed years)/
Date of birth
3. Marital Status (present) Married =01
Widowed=02
Separated =03
Deserted =04
Divorced=05
Never married=06
4. How old were you when you got
married (age in completed years)
Age: Age
NA= 00

79
5. Duration of widowhood/ divorce/
separation OR
Age when widowed/ divorced/
separated
Age
NA= 00
6. Chief owner of the house Self = 01
Spouse =0 2
Son = 03
Daughter =04
Grandchildren = 05
Relatives= 06
Others = 07
(Specify)___________
III. HOUSING CONDITION
Sr
no
Question Response Code
1. Type of dwelling Flat in the building= 01
Tenement with a common toilet=
02
Others= 03
(Specify)___________
2. Ownership of house Rented= 01
Owned= 02

80
If, owned by whom Parents= 01
Self= 02
Son= 03
Daughter =04
Grandchildren= 05
Relatives= 06
Others= 07
(Specify)___________
3. Living arrangements Alone =01
With spouse only =02
With spouse and children =03
With married daughter= 04
With relatives= 05
Others =06
(Specify)___________
4. Any room exclusively for your (and
your spouse’s) use
Yes =01
No=02
5. Are you comfortable using the
existing housing condition?
Yes=01
No=02

81
6. Comfort and utilization of Toilet and
Bathroom Facility
- Do you have easy access to
toilet?
- Type of toilet
- Are you comfortable using the
present type of toilet facility
- Are you scared of falling while
using the toilet?
- Do you have easy access to
bathroom?
- Do you need assistance in
bathing?
- Are you scared of falling while
using the bathroom?
Yes=01
No=02
Indian=01
Western =02
Yes=01
No=02
Yes=01
No=02
Yes=01
No=02
Yes=01
No=02
Yes=01
No=02

82
IV. ECONOMIC CONDITIONS
Sr
no
Question Response
Code
1.
Occupation
Most
recent
Current
Managers= 01
Professionals = 02
Technicians and associate professionals
=03
Clerical support workers =04
Services and sales workers =05
Skilled agricultural, forestry and fishery
workers =06
Craft and related trade workers =07
Plant and machine operators and
assemblers= 08
Elementary occupations= 09
Defense and armed forces= 10
Unemployed=11
Retired=12
2. Individual monthly income
(from all sources)
NA= 00
3. Family monthly income (from
all sources)
NA=00
4. Did you plan to meet your old
age expenses
Yes= 01
No= 02

83
5. What plans did you make
previously to meet your old age
expenses and at present what is
your (and your spouse’s) source
of income?
(Multiple answers possible)
Previous
Present
Depending on sons=01
Depending on daughters =02
Depending on grandchildren= 03
Depending on relatives=04
Wages/ salary= 05
Superannuation/ pension=06
Old age pension= 07
Fixed deposits=08
Investment= 09
Business= 10
Rent= 11
Interest or dividend= 12
Agriculture= 13
Relief payment= 14
Others= 15
(Specify)___________

84
6. Present income situation In debt= 01
I don’t have enough to provide for basic
needs= 02
I have just enough to provide for basic
needs=03
I have enough to get on with a little
extra= 04
I always have money left over= 05
Don’t know/ uncertain= 06
No response=07
7. Are you aware of any schemes
for the elderly?
Yes=01
No=02
8. Have you registered for any
schemes for senior citizens?
Yes=01
No=02
8. Which are the schemes that
you’re benefiting from? (refer
annexure)
9. Some elderly do not have the
resources to meet all their
expenses. Who according to you
should take this responsibility
Self=01
Family=02
Community=03
Government= 04
Non-governmental organizations =05
Others= 06
(Specify)___________

85
V. HOUSEHOLD CHARACTERISTICS
1. Household Composition:
No. Name Relationship
with head of
household
(HH)
Sex
(M/F)
Age Marital
Status
Educational
Status
Occupation Disability
1 SELF
(Relationship with HH: 01= self,02= spouse, 03=son, 04= daughter, 05= father, 06= mother,
07= grandchild, 08= son-in-law, 09= daughter- in-law, 10= others)
(Sex: 01=male, 02= female)
(Marital status: 01= married, 02= widowed, 03= separated, 04= deserted, 05= divorced, 06=
never married)
(Educational status: 01= illiterate, 02= primary, 03= secondary, 04= higher secondary, 05=
graduate/ diploma, 06= post graduate, 07= M.Phil/PhD)
(Occupation: 01= managers, 02= professionals,03= technicians and associate professionals,
04= clerical support workers, 05= services and sales workers, 06= skilled agricultural and
fishery workers, 07= craft and related trade workers, 08= plant and machine operators and
assemblers, 09= elementary occupation, 10= armed forces/defense, 11=Unemployed,
12=retired)

86
(Disability: 01= visual, 02= hearing, 03= speech, 04= loco-motor, 05= mental, 06=multiple
disability)
2. Information on adult children.
Total
No.
No. of
children
alive
No. of
children
living in the
household
No. living in
Mumbai/Pune
No. living outside
Mumbai/Pune
Son
Daughter
Sr. no Question Response Codes
3. What are your plans for the future? Continue in the same HH=01
Plan to shift to another HH=02
Plan to go back to place of origin
(village/native place)=03
Not yet decided/uncertain=04
VI. ACTIVITIES OF DAILY LIVING
Sr.
no
Question Response Codes

87
1. Which are the following day to day
activities that you carry out on your own
or with others help?
ADL:
- Feeding
- Toileting
- Maintaining continence
- Dressing
- Bathing
- Walking and transferring
IADL
- Maintaining finances
- Transportation
- Shopping
- Preparing meals
- Using telephone
IADL:
- Maintaining finances
Without help=01
With help=02
Without help=01
With help=02
Unable to do=03
Without help=01
With help=02
Who provides help
(familial=03,
neighbors=04
friends=05
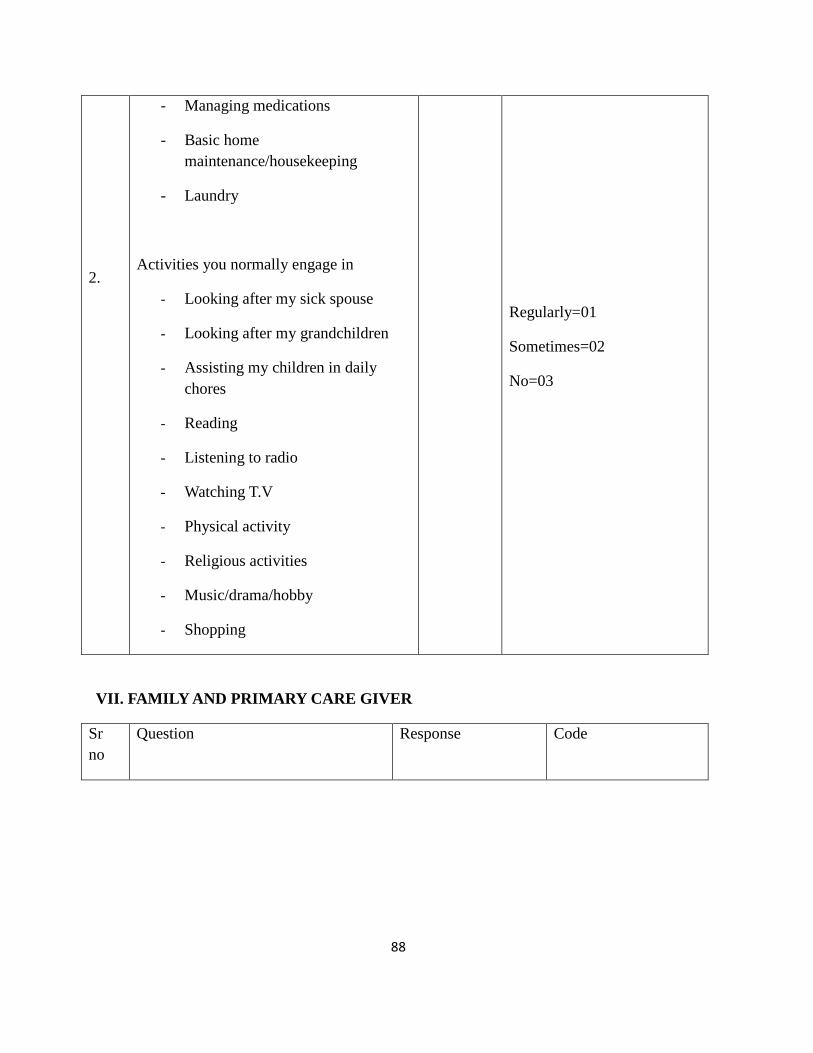
88
2.
- Managing medications
- Basic home
maintenance/housekeeping
- Laundry
Activities you normally engage in
- Looking after my sick spouse
- Looking after my grandchildren
- Assisting my children in daily
chores
- Reading
- Listening to radio
- Watching T.V
- Physical activity
- Religious activities
- Music/drama/hobby
- Shopping
Regularly=01
Sometimes=02
No=03
VII. FAMILY AND PRIMARY CARE GIVER
Sr
no
Question Response Code

89
1. Who is your primary care-giver
Spouse=01
Children=02
Grandchildren=03
Relatives=04
Others=05
(Specify)___________
NA=00
2. Availability of the primary caregiver Full time(day and
night)= 01
Only during the
day=02
Only during the
night=03
Only when called=04
3. If primary caregiver is away for
sometime (4-8 hrs a day) how do you
manage
Able to manage by
myself=01
Someone else comes
in=02
No special
arrangements
made=03
Helper seldom goes
out=04
4. Is the caregiver time provided
sufficient to meet your daily needs
Yes=01
No= 02
Uncertain=03

90
5. With whom do you spend most of
your time
Spouse=01
Children=02
Grandchildren=03
Relatives=04
Neighbors=05
Friends=06
others= 07
(Specify)___________
6. Involvement in decision making
- Marriage of children
- Buying and selling of property
- Buying household items
- Gifts to relatives
- Education of children and
grandchildren
- Arrangement of social/
religious events
Yes=01
No=02
To a certain extent=03
VIII.SOCIAL ACTIVITES
Sr
No
Question Response Code

91
1. How frequently you engage in
following activities
- Attending family ceremonies/
wedding/ festivals
- Visiting religious places/
spiritual gatherings
- Visiting gardens/ parks/
playgrounds
- Visiting the theatre/ movies/
concerts/ exhibition
- Visiting clubs/ associations/
societies
- Using the library
- Journey to hometown
Regularly=01
Often=02
Rarely=03
Never=04
2. Volunteer for social work activities Yes, at present=01
Yes previously, but
not at present=02
Ready to volunteer,
but not aware=03
No=04
3. If no, would you like to voluntarily
participate in such activities
Yes=01
No=02

92
4. What kind of volunteer work would
you like to do or are already involved
in or have done previously?
(Multiple choice possible)
With children (5-15 years)
With adolescent (15-20 years)
With adults (21-59 years)
With older persons (60+ )
In the area of health
In the area of education
Work with marginalized groups
(destitute women, disabled, poor, etc.)
Work related to your own occupation
Organizing events/programmes
Any other
(Specify_________)
Yes=01
No=02
Can’t say=03
If yes, describe the
kind of activity=04
5. Awareness of day care centers, hobby
centers and old age homes for elderly
Yes=01
No=02
6. Interest in joining such centres/ facility
- Hobby center
- Day care center
- Old age homes
Yes=01
No=02
Uncertain=03
(applies to all three
facilities)

93
7. If yes, specify the type of facility you
expect in it. (To be asked to only those
respondents who have said ‘yes’ for
old age homes in the previous
question)
- Independent room with
medical support
- Dormitory with medical
support
- Others, specify
Yes=01
No=02
(applicable to all
three options)
IX. ISSUES FACED BY THE ELDERLY
1. Issues faced by elderly
Sr
No
Question Response Code
1. Insufficient money/ finance Serious=01
Hardly a problem= 02
No response= 04
2. Poor housing
3. Poor health
4. Insufficient medical care
5. Loss of faculties
6. Education of the children
7. Not enough job opportunities
8. Loneliness
9. Lack of companionship
10. Departure of children

94
11. Nothing to keep me busy
12. Being dependent
13. Feeling neglected
14. Loss of status/ respect
15. Loss of confidence
16. Fear of crime/ violence
17. Financial exploitation
18. Physical abuse
19. Verbal abuse
20. Others
Sr.
no
Question Response Code
2. (For those who feel they do not have
enough job opportunities) Are you
aware of income generation
programmes for elderly?
Yes=01
No=02
3. If given an opportunity, would you
like to work?
Yes=01
No=02
Uncertain=03

95
4. If yes, what are the reasons for
exploring such job opportunities?
Need money for current
expenses=01
Need money for future
financial security=02
Do not want to be dependent
on others for money=03
No one to depend on for
money=04
Want to lead an active life=05
Need something to occupy
time/keep me busy=06
Own/family business=07
Others=08
Specify ________________
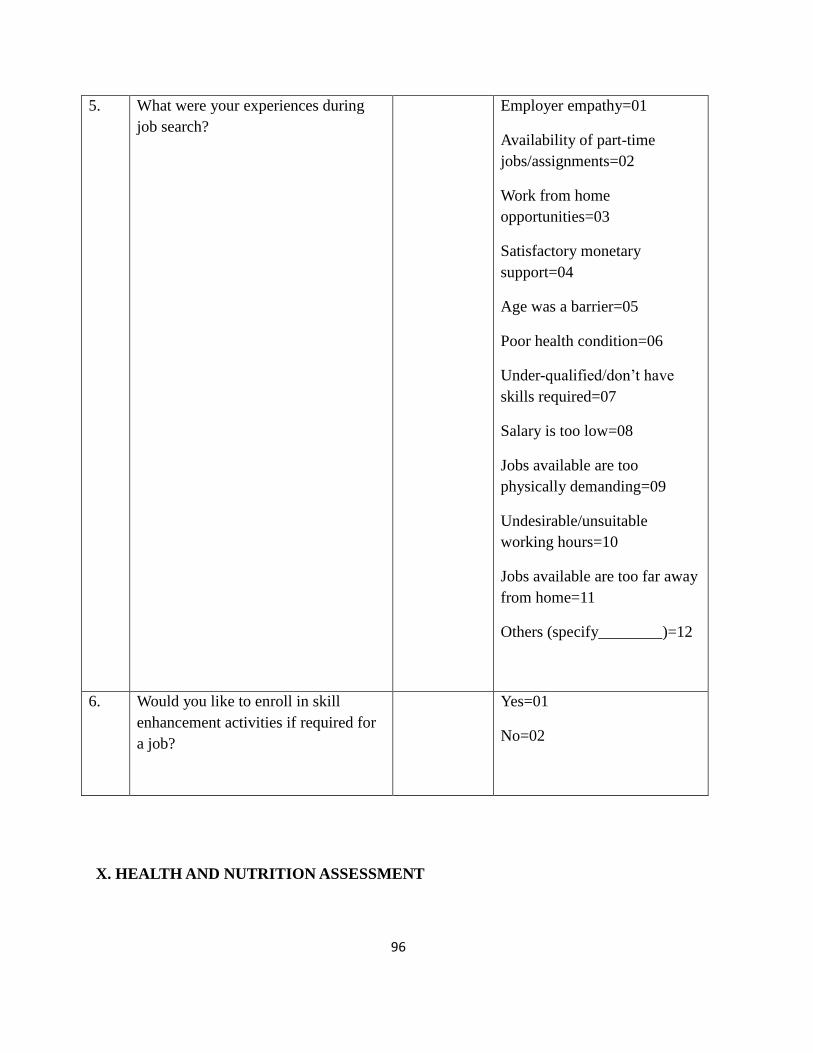
96
5. What were your experiences during
job search?
Employer empathy=01
Availability of part-time
jobs/assignments=02
Work from home
opportunities=03
Satisfactory monetary
support=04
Age was a barrier=05
Poor health condition=06
Under-qualified/don’t have
skills required=07
Salary is too low=08
Jobs available are too
physically demanding=09
Undesirable/unsuitable
working hours=10
Jobs available are too far away
from home=11
Others (specify________)=12
6. Would you like to enroll in skill
enhancement activities if required for
a job?
Yes=01
No=02
X. HEALTH AND NUTRITION ASSESSMENT

97
Sr
No
Question Response Code
1. Rate your present health Excellent= 01
Good= 02
Average=03
Poor=04
Worse=05
2. In past 15 days, did you suffer from any health
issue? If yes, specify (No probing)
- Fever
- High Blood pressure
- Cough and cold
- Diarrhea
- Asthma
- Gastric
- Malaria
- Headache
- Leg problem
- Body pain
- Cataract
- Typhoid
- Ulcer
Yes=01
No=02
Others=03
(Specify)_________

98
3. Chronic ailments (in the last 1 year)
- Arthritis
- Hypertension
- Cataract
- Diabetes
- Asthma
- Heart diseases
- Osteoporosis
- Skin diseases
- Renal diseases
- Paralysis
- Liver diseases
- Chronic lung diseases
- Depression
- Alzhiemers
- Cerebral stroke
- Dementia
- Cancer
- Fall
- Vertigo
- Others (specify) _______
Yes=01
No=02
Hospitalized=03

99
NUTRITION ASSESSMENT
Sr.
no
Nutrition Screening Checklist Yes
i. I have an illness or condition that made me change
the kind and/or amount of food I eat
2
ii. I eat fewer than two meals per day 3
iii. I eat few fruits, vegetables or milk products 2
iv. I chew tobacco, smoke or drink alcoholic beverages
almost every day.
2
v. I have tooth or mouth problems that make it hard
for me to eat.
2
vi. I don't always have enough money to buy the food I
need.
4
vii. I eat alone most of the time. 1
viii. I take three or more different prescribed or over-the-
counter drugs per day.
1
ix. Without wanting to, I have lost or gained 10 lbs. in
the last six months.
2
x. I am not always physically able to shop, cook,
and/or feed myself
2
ANTHROPOMETRY
Sr
No.
Measurements Value Code

100
1.
BMI
OR
Calf circumference (CC)
Height:
____ (m)
Weight:
______
(cm)
CC :
_____
(cm)
BMI Classification
>18.5 (underweight)=1
18.5-24.99 (normal)=2
<25-29 (overweight)=3
<30 (obese)=4
CC less than 31cm=1
CC 31 cm or greater=2
2. Mid arm circumference
(MUAC)
MUAC :
______
(cm)
MUAC less than 23 cm=1
MUAC 23cm or greater=2
Annexure
Schemes
1. Annapurna scheme
2. Indira Gandhi National Old age Pension Scheme (IGNOAPS)
3. Indira Gandhi National Widow Pension Scheme (IGNWPS)
4. Indira Gandhi National Disability Pension Scheme (IGNDPS)
5. National family benefit scheme
6. Sanjay Gandhi Niradhar Anudan Yojana
7. Shravan Bal Seva Rajya Nivrutti Vetan Yoajana
8. Others (Specify)_________

101
Percentage Distribution of elderly according to age
Age -wise Frequency Percent
60 69 14.6
61 25 5.3
62 37 7.8
63 23 4.9
64 11 2.3
65 95 20.1
66 21 4.4
67 10 2.1
68 17 3.6
69 6 1.3
70 55 11.6
71 7 1.5
72 11 2.3
73 10 2.1
74 3 .6
75 23 4.9
76 5 1.1
78 6 1.3
79 2 .4
80 13 2.7
81 1 .2
82 4 .8
85 9 1.9
87 1 .2
89 1 .2
90 6 1.3
98 1 .2
108 1 .2
Total 473 100.0