Embed Size (px)
Citation preview

University of South FloridaScholar Commons
Graduate Theses and Dissertations Graduate School
6-30-2016
A Smartphone-based System for Clinical GaitAssessmentAndres Alfredo Perez LeonUniversity of South Florida, [email protected]
Follow this and additional works at: http://scholarcommons.usf.edu/etd
Part of the Computer Sciences Commons
This Thesis is brought to you for free and open access by the Graduate School at Scholar Commons. It has been accepted for inclusion in GraduateTheses and Dissertations by an authorized administrator of Scholar Commons. For more information, please contact [email protected].
Scholar Commons CitationPerez Leon, Andres Alfredo, "A Smartphone-based System for Clinical Gait Assessment" (2016). Graduate Theses and Dissertations.http://scholarcommons.usf.edu/etd/6350

A Smartphone-based System for Clinical Gait Assessment
by
Andres A. Perez Leon
A thesis submitted in partial fulfillmentof the requirements for the degree of
Master of Science in Computer ScienceDepartment of Computer Science and Engineering
College of EngineeringUniversity of South Florida
Major Professor: Miguel A. Labrador, Ph.D.Sean J. Barbeau, Ph.D.
Yu Sun, Ph.D.
Date of Approval:April 6, 2016
Keywords: Physical Therapy, Gait Index, Android
Copyright c⃝ 2016, Andres A. Perez Leon

DEDICATION
To my parents for being the strongest pillars of my life, and to my girlfriend, for withstanding
all this time far way from each other and constantly reminding me of keep pushing forward. None
of this would be possible without all of you. Thank you.

ACKNOWLEDGMENTS
First and foremost, I wish to thank my major profressor Dr. Miguel A. Labrador for all his
exceptional support, and guidance these last few years.
I would like to thank Yueng de la Hoz, Edwin Peguero and Carlos Vazquez, whom contributed
with their time and knowledge to improve the quality of this work.
I would also like to acknowledge the members of my committee, Dr. Sean Barbeau and Dr. Yu
Sun, for their crucial feedback and input to revise this thesis.
Finally, I wish to thank my family and friends for their constant support and love to make this
possible.

TABLE OF CONTENTS
LIST OF TABLES iii
LIST OF FIGURES iv
ABSTRACT vi
CHAPTER 1 INTRODUCTION 11.1 Motivation 11.2 Aims and Challenges 31.3 Contributions 41.4 Structure of the Thesis 6
CHAPTER 2 LITERATURE REVIEW 72.1 Gait Analysis and Assessment 7
2.1.1 Overview 72.1.2 Gait Cycle 82.1.3 Gait Analysis Methods 102.1.4 Functional Gait Assessment 122.1.5 Quantifying Walking Patterns 13
2.1.5.1 Autocorrelation 142.1.5.2 Dynamic Time Warping 15
2.2 Mobile Platform 172.2.1 Android Operating System and Sensors 17
CHAPTER 3 SYSTEM DESIGN AND IMPLEMENTATION 203.1 System Design 203.2 System Architecture 21
3.2.1 Step Detection and Deviation Module 223.2.1.1 Data Collection 223.2.1.2 Step Detection 223.2.1.3 Deviation Detection 26
3.2.2 FGA Evaluation Module 273.2.2.1 Test 1: Gait Level Surface 273.2.2.2 Test 2: Change in Gait Speed 283.2.2.3 Test 3 and 4: Horizontal and Vertical Head Turns 293.2.2.4 Test 5: Gait and Pivot Turn 293.2.2.5 Test 7: Gait with Narrow Base of Support 30
i

3.2.3 Metrics Calculation Module 303.2.3.1 Autocorrelation 303.2.3.2 Step Segmentation 313.2.3.3 Step Differentiation 333.2.3.4 DTW 34
3.3 System Implementation 343.3.1 Client Side: Mobile Data Collection and FGA Evalua-
tion Application 353.3.2 Server Side: Data Storage, Analysis and Visualization Application 363.3.3 Development and Deployment Tools 37
CHAPTER 4 EVALUATION 394.1 Methodology 394.2 Device: Motorola Nexus 6 404.3 Step Detection Tests 404.4 Step Deviation Tests 424.5 Autocorrelation Tests 444.6 Segmentation, Differentiation and DTW 45
4.6.1 Step Segmentation 464.6.2 Step Differentiation 474.6.3 DTW Tests 48
4.7 Discussion 49
CHAPTER 5 SUMMARY 515.1 Conclusion 515.2 Future Works 52
REFERENCES 53
APPENDIX A: FUNCTIONAL GAIT ASSESSMENT TESTS 57
APPENDIX B: COPYRIGHT PERMISSION FOR FIGURE 2.7 64
ii

LIST OF TABLES
Table 3.1 DTW comparison matrix, with an average DTW = 0.058. 34
Table 4.1 Motorola Nexus 6 specifications. 41
Table 4.2 Number of steps counted by Algorithm 1 for each of the test cases. 42
Table 4.3 Deviation levels test results. 44
Table 4.4 Auto correlation tests results. 45
Table 4.5 Unpaired t tests for a 95% confidence interval for the autocor-relation metrics. 45
Table 4.6 DTW difference between all the steps, right steps, and left stepstests results. 48
iii

LIST OF FIGURES
Figure 2.1 Gait cycle main phases. 8
Figure 2.2 Step and Stride length. 9
Figure 2.3 Example of a configuration of cameras for a Machine VisionBased analysis [1]. 10
Figure 2.4 Example of a wearable set-up configuration using 4 gyroscopes [2]. 11
Figure 2.5 FGA tests paths. 13
Figure 2.6 First dominant period Ad1 and second dominant period Ad2 ofthe vertical axis of an accelerometer during normal walking,showing the frequency of steps and gait cycles, respectively [3]. 14
Figure 2.7 Android platform stack. 17
Figure 3.1 Modules of the system architecture. 21
Figure 3.2 Energy of the accelerometer signal, before and after filtering,and after the thresholds (B1 and B2) are detected. 23
Figure 3.3 Imaginary floor triangles to get the deviation from the straight path. 26
Figure 3.4 Sequence of steps, from top to bottom, showing the deviationof the patient in centimeters. 27
Figure 3.5 Autocorrelation function on the Y-Axis of the accelerometersignal, with Ad1 = 0.8297 and Ad2 = 0.8236, at times 0.6s and1.2s, respectively. 31
Figure 3.6 Steps segmentation and transformed to a percentage scale. 32
Figure 3.7 Right steps extracted from segmentation. 32
Figure 3.8 Left steps extracted from segmentation. 32
Figure 3.9 Left steps trunk rotation trends after segmentation. 33
Figure 3.10 Right steps trunk rotation trends after segmentation. 33
iv

Figure 3.11 System overview. 35
Figure 3.12 Android application screenshots. 36
Figure 3.13 Partial view of the web application showing results. 37
Figure 3.14 Server deployment diagram. 38
Figure 4.1 FGA tests levels labeled by color, where green is 3 points, yel-low is 2 points, orange is 1 point, and red is 0 points for theFGA tests results. 42
Figure 4.2 Test walking patterns. 43
Figure 4.3a No impediment walking segmentation. 46
Figure 4.3b Right impediment walking segmentation. 46
Figure 4.3c Left impediment walking segmentation. 46
Figure 4.4a No impediment walking differentiation. 47
Figure 4.4b Right impediment walking differentiation. 47
Figure 4.4c Left impediment walking differentiation. 47
v

ABSTRACT
Patients with lower limbs problems are an increasing population in the US and many of them
require surgery and its subsequent post-op Physical Therapy (PT). For all these patients, tracking
their progress and evolution towards full recovery is very important. To assess the patients and
track their progress, patients are usually required to perform very specific tests administered by
a physical therapist. These tests either require very expensive equipment or rather require the
subjective experience of the physical therapist who administer them. One of these tests is the
Functional Gait Assessment (FGA) test, perhaps the most widely adopted one for gait assessment.
This thesis presents a system for Clinical Gait Assessment using exclusively the sensors em-
bedded in today’s smartphones. The system processes the raw sensor data to perform the FGA test
and calculate additional metrics, capable of identifying problems in the human gait. The system
is therefore objective, as it is based on measurements; cheap, as it only requires a smartphone;
mobile, as it can be used pretty much anywhere; and self-care, as it does not need the presence of
a physical therapist.
The system was designed and tested on the Android OS with the phone attached to the back
of the user using a belt or elastic band. It includes a new step detection algorithm with a mean
absolute error of ±1 and algorithms to detect the deviation from a straight path with an accuracy of
90%, 80%, 35%, and 30% for each of the required deviation levels of the FGA test. Additionally,
the system includes autocorrelation and DTW metrics, which provide additional information to
detect different impediments of the user gait.
vi

CHAPTER 1
INTRODUCTION
1.1 Motivation
According to the centers for disease control prevention (CDC), 16% of the adult population in
the US suffers from joints related problems. In 2010, there were more than forty million visits to the
doctor’s office with lower joints complaints, including more than one million surgeries involving
total or partial hip, knee, and ankle replacement in the US [4, 5]. Generally, these procedures
require some level of post-op physical therapy (PT), to recover most of the walking capabilities [6].
Therefore, it is important to have a method to assess the walking capabilities of a patient in
order to track their improvement over time.
Gait analysis has proven to be a useful technique to evaluate the condition of patients that have
gone through these procedures. Different methods have been used to analyze the gait of a person
after surgery including kinematic analysis using motion cameras [7], strength and endurance using
specialized treadmills [8, 9], or walkways with different types of sensors [10, 11]. The aforemen-
tioned approaches for gait analysis require of highly specialized and costly equipment in a specific
location, usually the office of a physical therapist.
A common test performed by physical therapists that do not require highly specialized equip-
ment, is the Dynamic Gait Index (DGI) [12] and its less ambiguous version, the Functional Gait
Assessment (FGA) [13], which score the gait of a patient based on their balance and fall risk. These
tests, which still require the presence of a specialist to perform them, are done in a visual manner,
so they may be subject to some errors compared to tests that collect data and provide results based
on that data.
1

Nowadays, with user accessible wireless technologies, telemedicine has seen an increase in
Mobile Health Care Systems (MHCS). MHCS have proven to be a useful tool in health promotion
and monitoring, and self care [14]. Therefore, a mobile system capable of performing the previous
mentioned tests, working with a centralized server for persistence and remotely accessible records
would be useful for:
• Self-assessment: without the need of a physician to perform the test, this would be a useful
tool not only for patients suffering from a condition, but to any individual who wants to
evaluate his current gait.
• Progress tracking: given that the system stores previous results, patients and physicians
could track the progress of such patient over time.
• Population analysis: due to the multi-user nature of the system, if it stores data such as
sex, age and/or medical procedure, it might provide useful data for deeper analysis on the
behavior on certain type or category of individuals, such as expected recovery time.
• Cost-effectiveness: removing the need of patient and physician transportation, and the need
of specialized equipment, it would reduce the cost of these tests. substantially.
• Unambiguity: DGI and FGA include some level of ambiguity, because two physicians could
give a different score for the same patient.
Although gait analysis has been used before with mobile devices, the focus has not been in
evaluating the gait of an individual. Instead, past research has used gait analysis as a biometric
feature for user authentication [15, 16]. These approaches usually generate different set of tem-
plates for each individual, and use some type of distance measurement to compare the templates
and authenticate the user. Consequentially, these measurements can be used as a regularity feature
of the gait of an individual. Furthermore, these analyses normally target a complete gait cycle, and
avoid step-by-step analysis, which could be used to provide a better and deeper information about
the gait of an individual.
2

1.2 Aims and Challenges
This thesis presents a smartphone-based system for individual gait assessment. The system
implementation is based on three modules: an FGA test, for balance and fall risk assessment, a
set of algorithms to calculate regularity measures, and a visualization and storage component, for
remote access and further evaluation. Altogether the system is able to accurately keep track of the
progress and evolution of the gait of an individual over time.
The system utilizes an off-the-shelf smartphone and its embedded sensors to determine the
completion of the different FGA tests and categorize the results in one of the four possible results
for each test. Additionally, it uses the same raw data to calculate the regularity measures and
further assess the gait of an individual. It also stores the results in a remote server for patients and
physicians to see historical data and evaluate progress over time.
A mobile health care system, like the one being proposed here, introduces several challenges,
such as:
• Privacy: being a health care oriented system, means that it will handle patient data. Thus, the
transmission of data between the mobile device and central server must be done in a secure
manner.
• Unreliable sensors data: the surrounding environment might introduce random noise due to
difference on space, walls or objects of different materials, machines, etc.
• Sensors location: the location of the sensor in the human body affects the magnitude of the
signals that it produces, affecting the input for the different algorithms.
• Different data sources: the difference in nature of the multiple sensors of the proposed system
introduces the challenge on how to fuse the data to get reliable measures.
• High-level accuracy: most of the FGA tests have a deviation metric, with really small differ-
ence between each of the levels.
3

• Energy efficiency: the additional use of sensor and processing increases the energy con-
sumption of the device, that in a smartphone case, is a constrain due to the limited amount
of battery life.
• Limited resources: although smartphones have seen a significant improvement in the last
years, they still poses limited resources. The procedures and algorithms implemented in
theses devices should avoid the high consumption of these resources.
• Evaluation methods: the evaluation of the proposed system is a tedious job consisting of
multiple repetitions to compare the results of the FGA given by the system with the results
that a physician would give.
1.3 Contributions
The smartphone-based system for individual gait assessment proposed in this thesis makes
several contributions meant to address most of the challenges described before. Among the most
important contributions are the following:
• The entire system was implemented using a complete web framework for data communica-
tion, where the HTTPS protocol can be used for secure data transmission, and a user authen-
tication system can be implemented with little modifications to the architecture proposed in
this work.
• Signal processing and filtering algorithms are used to obtain significant information from the
raw data of the sensors. The approach does not use any machine learning techniques, which
means that the system does not require any sort of training prior to use, nor high intensive
computation. Using filtering techniques and a newly proposed real-time step counting algo-
rithm, the system is able to determine distance traveled and the time that it took, which are
important factors in the FGA.
4

• The smartphone used in this system is fixed to the lower back of the patient, eliminating
noise caused by the respiration and hip movement, and still centered in the trunk, where
almost equal signal strength is gathered for right and left steps.
• Two of the modules present in the system use data from the accelerometer and rotation vector
to detect steps and determine their direction, and also the same sensors are used to segment
the signal and differentiate between right and left steps.
• The system is capable to detect small changes in deviation from an straight path, other im-
portant parameter for the FGA.
• The mobile application uses some of the sensor that are all the time active in the device,
meaning that the data collecting task would not inquire in additional energy consumed.
• The architecture of the system places the most computational intensive algorithms of it, the
autocorrelation and DTW, on the server side, which results in less resources needed for the
client side.
• The proposed approach eliminates subjective errors in the FGA test using sensor-based data
only. The system promotes self-care, as it does not require the presence of a physician to do
the assessment.
• The system is very low cost, as it only relies on the factory-default sensors that come with
nowadays smartphones. No additional or external hardware is required.
• The FGA is extended with additional regularity measures such as Dynamic Time Warping
distance (DTW) and Autocorrelation and other statistical values which help to determine
where the problem is.
5

1.4 Structure of the Thesis
The remainder of the thesis is organized as follows. Chapter 2 contains the related works,
presenting the background for the algorithms and evaluation methods used in previous research in
this area. Chapter 3 describes the groundwork of this thesis where the key concepts of the system
design and its implementation are explained, including the modules and algorithms that are part
of the system. Chapter 4 includes the evaluation methodology and discusses the performance of
the system and the individual algorithms. Finally, Chapter 5 concludes the thesis and sets forth
directions for future research.
6

CHAPTER 2
LITERATURE REVIEW
This chapter provides the background information about gait analysis and assessment, and the
most important procedures available in the literature. In addition to the details of gait analysis,
this chapter describes the Android platform and its sensors, and this sensors’ uses in current gait
analysis.
2.1 Gait Analysis and Assessment
2.1.1 Overview
Clinical Gait Analysis refers to the process of determining what is causing patients to walk
the way the do. It is an assessment process which can be used as additional input for clinical
decision-making. Hereafter the term clinical is dropped, given that is the main focus of this thesis.
From gait analysis we can group assessments in two types of processes: observational and
instrumented processes [17]. An observational process is highly subjective because it is based
on previous experience of the specialist doing the analysis. An instrumented process, although
objective, often require complex measurement systems.
Additionally, different aspects of gait analysis can be defined, such as: impairment-focused
gait analysis, which specific aim is to define the impairments that are most likely to be affecting
the patients’ walking pattern; function-based gait analysis, that tries to understand how patients are
achieving function despite the impairments that are affecting them; and monitoring-focused gait
analysis, which main goal is to provide physician data to reflect on how individual patients are
progressing [17].
7

Figure 2.1: Gait cycle main phases.
2.1.2 Gait Cycle
Gait cycle is the main concept used for Gait Analysis. It contains information of how a person
walks, and comparing multiple gait cycles can tell the analyst how variable this pattern is. It is
normally defined as when a foot makes contact with the ground, usually with the heel in normal
walking patterns [17], followed by an step of the other foot, and the next time that the same foot
makes contact with the ground [15].
The gait cycle process can be divided in two main phases for a given limb: the stance phase,
when the foot is contact with the floor, and the swing phase, when it is not (Figure 2.1). The stance
phase is approximately 60% of the gait cycle [18], while the swing phase covers the remaining
40%.
This proportion disparity between the two phases for each limb results in other two phases:
single limb support (SLS), when just one foot is in contact with the floor, and double limb support
(DLS), when both of them are. During normal walking, SLS occurs when one of the foot is in the
swing phase, while DLS occurs on the overlap between the stance phases of each step. When DLS
does not occur, it is considered as running. For such, the time spent in DLS is a good indicator of
how regular is the walking speed of the individual.
8

Figure 2.2: Step and Stride length.
Some of the most important factors measured in gait analysis are the spatiotemporal parameters
[19]. Examples of these parameters are: Step length, which represents the distance between the
same part of both feet after taking an step. Although it is expected that both feet cover similar
distances, this is not always the case, this is way both feet are measured separately, as pictured in
Figure 2.2. When both feet cover the same distance is what is known as a symmetric gait pattern,
and asymmetric when they not. On the other hand, stride length is the distance between the same
part of one foot after two consecutive steps, i.e., the distance covered in one gait cycle. Other
example is the stride time representing the duration of one gait cycle. This parameter with the
SLS and DLS can help determine the duration of each of the phases of the gait cycle. Also, there
is the cadence which represents the steps per minute of the patient and can be used to calculate
the walking speed (shown in Equation 2.1). Stride length is preferred in this equation due to the
difference that can be found between right and left step length.
Walking speed =cadence× stride length
120(2.1)
Additionally, there is a category of parameters known as gait general characteristics, such as
gait symmetry, which measures the disparity between the left and right foot, and gait regularity,
which is useful to compare sequence of steps or gait cycles [20].
9

Figure 2.3: Example of a configuration of cameras for a Machine Vision Based analysis [1].
2.1.3 Gait Analysis Methods
Fundamental to gait analysis is the approach taken to collect and detect all the parameters
mentioned in the previous section. There are three main approaches to do so: Machine Vision
Based (MV), Environment Sensors Based (ES), and Wearable Sensors Based (WS) gait analysis
[16, 21]. The advantages and disadvantages of each of these approaches is explained next.
In MV analysis, one or several cameras are deployed in a room where the patient is asked to
walk through. Usually, the MV approach brings high accuracy when extracting the different gait
spatiotemporal parameters, but this comes at the cost of using highly specialized equipment [1,22].
The approach used in [1] and [22] was developed as solution for in-home gait analysis and fall risk
detection using inexpensive equipment. A combination of Microsoft Kinects and web cameras is
used to track the patient during the day (shown in Figure 2.3). Although this implementation targets
the equipment cost, the use of inexpensive cameras for this case brings its own flaws, such as the
increase in error on distance detection as the subject is further away from the camera, and the type
of clothing that subject wears can affect the IR sensors of the Kinects cameras, and the algorithms
required for image processing can be computationally expensive [21]. Also, this approach limits
the data collection to a specific location, and increasing the range of detection means implementing
more cameras, which increases the cost.
10

The ES based approach does not require the highly computational algorithms that the MV
approach does giving the lack of need for image processing, but it still requires a fixed location
where the treadmill or force plates can be placed to assess the subject. Furthermore, it has been
proven that walking on treadmills alters the natural gait pattern of the subject as it would normally
do overground [3,23]. There is also the option of using Electromyography (EMG), but this usually
brings discomfort or pain to the patient [24].
Figure 2.4: Example of a wearable set-up configuration using 4 gyroscopes [2].
The third approach, using wearable sensors, removes the constraint of a specific location, giv-
ing the ability to create ambulatory and wearable systems [24]. Between the most used sensors are
the accelerometers, gyroscopes and magnetometers [20, 24]. These sensors tend to be inexpensive
compared to the equipment required for the previous two approaches, which comes at the cost of
less reliable signal, but with the current advancement in wearable sensors hardware and technol-
ogy, and applying filtering techniques, this type of sensors have proven to be effective for this type
of analysis [2, 20, 24, 25].
The problem with wearable sensors is that they can be obtrusive to the patient. Most of the
current approaches utilize more than one sensor attached to the body of the patient to detect the
11

different gait parameters. For example, to identify the asymmetry, Gouwanda and Senanayake [2]
attach four wireless gyroscopes to the subject, and requires a specialized environment to collect
and process the data. Additionally, as it is shown in Figure 2.4, the sensor configuration neither
look comfortable nor easy to set up.
2.1.4 Functional Gait Assessment
The Functional Gait Assessment (FGA) [13], is based on the Dynamic Gait Index (DGI) [12],
which consists of 8 tests to measure the fall risk in older population or people with vestibular
disorders [12]. The main problem with the DGI is that the tests are performed in a total subjective
manner, where the result of each of the tests depends on the opinion of the specialist performing
them [13].
The FGA tries to target the subjectivity by setting quantifiable parameters for each of the tests.
Among these parameters are the completion time, deviation from a straight path and changes in
walking pattern. Other parameters might be included/removed depending on which test is being
performed. Additionally, the FGA removes one of the original test of the DGI and adds 3 additional
ones, thus a total of 10 tests. Similarly to the DGI, each of the tests is graded in a 4-level scale,
from 0 to 3, being 3 the best possible outcome, giving a total of 30 points, where 24 points or less
could indicate increased fall risk on the patient [13].
To be able to perform the FGA, a 20ft (6m) walkaway is required. This walkaway should
be marked with a path with a width of 12in (30.48cm). Additionally, it also requires a shoe box,
or an item of similar size, that will work as an obstacle on one of the tests, and a set of stairs is
required for another one. Most of the tests require the patient to stay within the path, and will take
out points on each of the tests based on how much the patient deviated from the center of it. This
can be easily done by the specialist placing marks on the floor where each of the limits are: 6in,
10in, and 15in away from the walking path (see Figure 2.5).
Consequentially, and although the FGA tries to target the ambiguity produced by the DGI tests,
the observational nature of it still adds some level of ambiguity in the results of the test, given that
12

Figure 2.5: FGA tests paths.
two separate specialists may take out points based in part on their own criteria or experience. An
example of this is presented in [13], where physicians would consider additional factors in the test
involving the stairs. There is no current evidence at the moment that tries to remove this ambiguity
of performing the FGA using the methods presented in Section 2.1.3.
2.1.5 Quantifying Walking Patterns
Quantifying or scoring the walking pattern of a patient provides a simple and easy way for
specialists and the patient itself to evaluate his current status. As observed in the previous section,
the DGI and FGA try to accomplish this by doing a series of tests on the patient, obtaining at the
end a final score that tells if the patient has an increasing risk of falling during normal walking.
The problem with those tests, as it was stated before, is the human factor of the evaluator that still
introduces some level of ambiguity. An optimal test would be such that it does not matter where
the test is performed, the result should always be the same, based solely on the gait parameters
of the patient. On the other hand, the diagnosis of a patient should not be only based on the
result of the test, given that additional factors, such as sex and age, can produce different expected
outcomes. In other words, the score of the test should be universal, while the interpretation of
13

Figure 2.6: First dominant period Ad1 and second dominant period Ad2 of the vertical axis of anaccelerometer during normal walking, showing the frequency of steps and gait cycles, respectively[3].
the score should rely in the hands of the specialist taking in consideration additional factors. In
this thesis, the main focus is creating that universal score, or set of scores, that provide additional
information to the specialist to make a better and more informed decision. Quantification of gait
using inertial measurement units (IMU) sensors has been used before in previous studies to answer
clinical needs [20,24,26–28]. In the next two sections, two of the most used techniques to identify
and quantify gait parameters, Autocorrelation and Dynamic Time Warping, are described.
2.1.5.1 Autocorrelation
In signal processing, the autocorrelation function has been widely used to find repeating pat-
terns in a signal. In gait analysis this is useful in combination with wearable sensors signals, such
as accelerometers and gyroscopes, to detect steps and gait cycles and the frequency of occurrence
for each of them by detecting the first and second dominant period of the signal respectively [2,3].
Additionally, Moe-Nielsen and Helbostad [3] demonstrated that when the coefficient of the
first dominant period Ad1 and the coefficient of the second dominant period Ad2 (shown in Figure
2.6) have low values, it suggests a low regularity between steps and cycles, respectively. Further,
the ratio Ad1/Ad2 represents the symmetry between left and right steps [3]. To be able to get
these values, they used a normalized unbiased autocorrelation function [3], where every value is
14

generated by using Equation 2.2 and then normalized using Equation 2.3, where Xi is the i-th
value of the raw signal from the accelerometer, N the number of samples, m the lag variable, Sm
is the correlation coefficient at lag m, and Am is the normalized coefficient.
Sm =1
N − |m|
N−|m|∑
i=1
XiXi+m (2.2)
Am =Sm
S0(2.3)
As consequence of the unbiased and normalized nature of the values Ad1 and Ad2, they are
perfect candidates as a measure to quantify the walking pattern of an individual, due to the values
being independent of the accelerometer being used.
2.1.5.2 Dynamic Time Warping
Dynamic Time Warping (DTW) is used to find the similarity between two signals. One of its
features is that the signals do not need to be of the same length or duration.
The similarity is based on a distance measure that varies depending on the implementation of
DTW used. The most used distance function tends to be the Euclidean distance, but other imple-
mentations have been proposed such as using derivative estimates to generate a better matching
function [29]. This distance is calculated creating the minimum warping path between the signals,
the higher this value is the more dissimilar the signals are.
The classic DTW uses two time series S = s1, s2, ..., sn and T = t1, t2, ..., tm as input, where
n and m are the length of the signals S and T , respectively. Then, the n-by-m distance matrix is
constructed, where the (i, j)-th element of the matrix is calculated with Equation 2.4.
d(si, tj) = (si − tj)2 (2.4)
15

The next step is to calculate the warping path W = w1, w2, ..., wK , where max(n,m) ≤ K <
m + n − 1, and the K-th element is represented by wK = (i, j)K . The warping path needs to
comply with certain conditions:
• Boundary condition: w1 = (1, 1) and wK = (n,m)
• Continuity: Given wk = (i, j) and wk+1 = (i′, j′), then i′ − i ≤ 1 and j′ − j ≤ 1
• Monotonicity: Given wk = (i, j) and wk+1 = (i′, j′), then i′ − i ≥ 0 and j′ − j ≥ 0, and
(i′ − i) + (j′ − j) > 0
It is also noted, that the continuity and monotonicity conditions can be further relaxed or con-
strained to force the warping path to stay closer to the diagonal of the matrix [29]. As a conse-
quence, there are several warping paths that can comply with the previous conditions, DTW is only
interested in the warping path with the minimum distance, expressed by Equation 2.5
DTW (S, T ) = min
⎛
⎝
√∑Kk=1 wk
K
⎞
⎠ (2.5)
To do this in an efficient manner, we can calculate the distance using dynamic programming
using the following recurrent function:
ρ(i, j) = d(si, tj) +min[ρ(i− 1, j − 1), ρ(i− 1, j), ρ(i, j − 1)] (2.6)
Hence, the DTW distance for S and T can be expressed as:
DTW (S, T ) =√
ρ(n,m) (2.7)
DTW has been used in conjunction with gait analysis, where typically one of the signals being
compared comes from a pre-generated template. The sources of these templates can differ depend-
ing on the implementation. For example, Derawi et al. [30], used DTW for user authentication,
16

where each template for each subject is generated by making the subjects do trial runs from where
an average gait cycle is extracted and used as a template to identify each of them, by matching the
gait of each of the subjects with the template with the minimum DTW distance. Opposite to that,
Barth et al. [31] provide a solution for stride segmentation, where they generated the main template
from more than 600 gait cycles classified manually and averaged to create a standard stride, that
then they use to identify each of the cycles on a signal during free walking.
2.2 Mobile Platform
2.2.1 Android Operating System and Sensors
For this thesis, the Android platform, which is a Linux-based operating system for mobile de-
vices developed by Google Inc., has been selected as the preferred development environment over
other popular mobile platforms, such as iOS from Apple Inc. and Windows 10 Mobile from Mi-
crosoft Inc.; Android is low cost, open source, community built, and currently the leading mobile
platform in the US [32].
Figure 2.7: Android platform stack.1
1Portions of this page are reproduced from work created and shared by the Android Open Source Project and usedaccording to terms described in the Creative Commons 2.5 Attribution License [33].
17
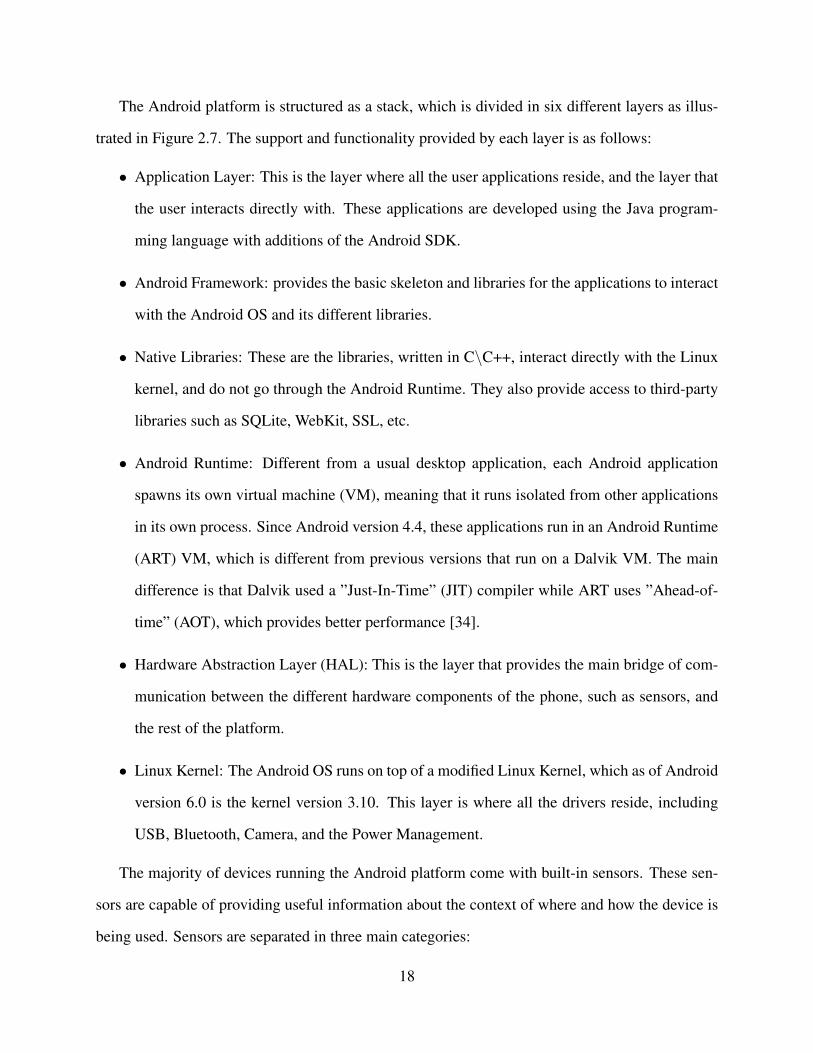
The Android platform is structured as a stack, which is divided in six different layers as illus-
trated in Figure 2.7. The support and functionality provided by each layer is as follows:
• Application Layer: This is the layer where all the user applications reside, and the layer that
the user interacts directly with. These applications are developed using the Java program-
ming language with additions of the Android SDK.
• Android Framework: provides the basic skeleton and libraries for the applications to interact
with the Android OS and its different libraries.
• Native Libraries: These are the libraries, written in C\C++, interact directly with the Linux
kernel, and do not go through the Android Runtime. They also provide access to third-party
libraries such as SQLite, WebKit, SSL, etc.
• Android Runtime: Different from a usual desktop application, each Android application
spawns its own virtual machine (VM), meaning that it runs isolated from other applications
in its own process. Since Android version 4.4, these applications run in an Android Runtime
(ART) VM, which is different from previous versions that run on a Dalvik VM. The main
difference is that Dalvik used a ”Just-In-Time” (JIT) compiler while ART uses ”Ahead-of-
time” (AOT), which provides better performance [34].
• Hardware Abstraction Layer (HAL): This is the layer that provides the main bridge of com-
munication between the different hardware components of the phone, such as sensors, and
the rest of the platform.
• Linux Kernel: The Android OS runs on top of a modified Linux Kernel, which as of Android
version 6.0 is the kernel version 3.10. This layer is where all the drivers reside, including
USB, Bluetooth, Camera, and the Power Management.
The majority of devices running the Android platform come with built-in sensors. These sen-
sors are capable of providing useful information about the context of where and how the device is
being used. Sensors are separated in three main categories:
18

• Motion Sensors: measure acceleration and rotational forces. This category mainly consist of
accelerometers and gyroscopes.
• Environmental Sensors: measure parameters such as illumination, pressure, temperature,
and humidity. One of the sensors of this category, when available, is the barometer.
• Position Sensors: measure the current position of the device. This category includes the
magnetometer, which can be used to build a compass.
It is to note that although not all devices include all of the previously mentioned sensors, most
smartphones come equipped with accelerometer, gyroscopes and magnetometer. These sensors
can be used for simple tasks such as detecting the screen orientation, to more much complex ones
such as human activity recognition [35].
19

CHAPTER 3
SYSTEM DESIGN AND IMPLEMENTATION
This chapter presents the description of the proposed system, its architecture and the imple-
mentation of its multiple modules.
3.1 System Design
This thesis proposes a system to assess patients’ gait by automatically detecting gait parameters
and important metrics without the intervention of a physician to perform the assessment. The
system fuses data from multiple sensors to obtain these parameters. It uses the accelerometer
readings to detect the steps of the patients and determine the completion of the assessment, with
a new proposed algorithm designed to work in real time. By utilizing the rotation vector meta-
sensor, the system can detect the rotation on the trunk and differentiate between right and left
steps. Additionally, the orientation of the patients is used to detects deviation from an straight
path. The completion time and deviation from the straight path are used as the main components
for the FGA tests and its results. Finally, the Autocorrelation of the accelerometer signal and
its dominant periods are extracted and segmented in individual steps [15] and the DTW distance
between steps is calculated to promote measures of regularity and symmetry.
The FGA test, as detailed in Appendix A, consists of 10 tests, out of which only 6 are suitable
for the proposed system, for a maximum sum of 18 points. So, it is concluded that a patient that
scores less than 14 points is considered to have a high risk of falling. Tests 6, 8, 9 and 10 are
excluded from the proposed system as they present additional risk of injuries.
20

Step and Deviation Detection
FGA Evaluation
Metric Calculation
Visualization and Review
Figure 3.1: Modules of the system architecture.
The start and end of each test is indicated to the patient through sound cues produced from the
device. Additional instructions for each test are also cued through sound, such as in tests 2, 3, 4,
and 5, where the patient is required to perform extra actions.
Finally, during the live step detection phase, signal processing methods are used to reduce the
noise in the signal and extract information such as the number of steps taken, and the time between
them, and the variation of heading of the patient while walking. This functionality helps to provide
information quickly and consistently. The results and data gathered during the tests are later stored
in a remote server where they can be reviewed by interested parties. This system is useful as a
support tool for physicians, and a tool of self-assessment for patients, and progress tracking over
time to evaluate the evolution of a present condition or efficacy of a proposed treatment.
3.2 System Architecture
The proposed system is divided in 4 modules: step and deviation detection module, FGA
evaluation module, metric calculation module, and the review and visualization module as is shown
in Figure 3.1.
This sequence of modules allows the system to:
1. Collect data and detect steps in real time, and detect the heading of each step while doing so.
21

2. Evaluate each of the possible FGA test, and scores them after the completion of each of
them.
3. Provide additional metrics not related to the balance, such as regularity and symmetry using
the Autocorrelation and DTW function.
4. Review the information in the future for progress tracking and further analysis.
3.2.1 Step Detection and Deviation Module
The first module is responsible for the data gathering of the different sensors and the detection
of steps and heading of the user, which helps determine the deviation from the straight path. This
process is done locally in the device in real time, which also helps to determine the end of each of
the tests.
3.2.1.1 Data Collection
The data collected comes from the accelerometer and rotation vector sensors. These sensors
are present on most smartphones nowdays, and have a low energy footprint and are active all the
time to help determine the rotation and position of the phone. The smartphone is attached to the
back of the patient with an elastic band or belt. The sensors were set to collect data every 20ms
(50Hz). The rotation vector samples are smoothed with a low pass filter to eliminate additional
noise from the signal, given that this sensor tends to change values really fast.
3.2.1.2 Step Detection
The proposed system uses the patient step length as input and the automatic step detection
algorithm to detect when the user has covered the 20 ft walking path required by the FGA test. For
the step detection algorithm, we modified the implementation presented in [35], as follows:
22
• Post Analysis: The original implementation collects all the data and performs the step and
activity recognition after the experiment or test is done. For our system, the steps need to be
detected as soon as they happen, in real time.
• Long segments for analysis: The algorithm in [35] uses changes in direction and human
activity to segment the data and remove the drift and bias that the sensors produce over time.
These segments end being large, lasting several seconds, which translate to a slow reporting
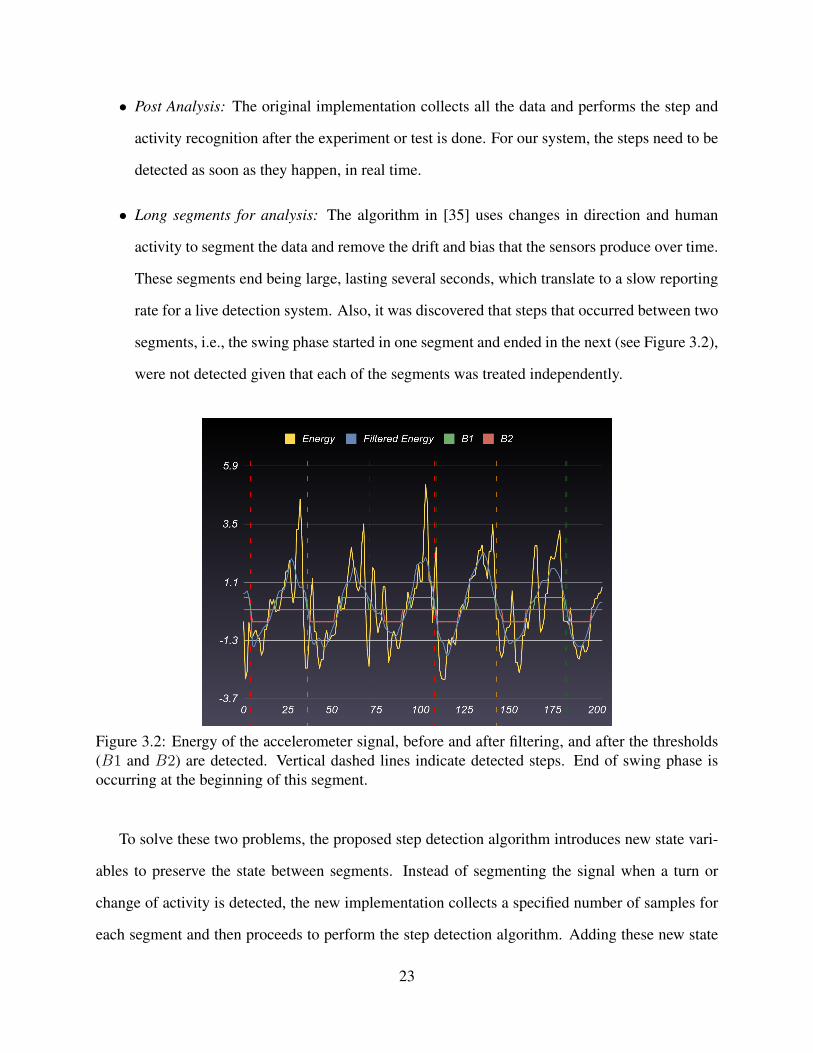
rate for a live detection system. Also, it was discovered that steps that occurred between two
segments, i.e., the swing phase started in one segment and ended in the next (see Figure 3.2),
were not detected given that each of the segments was treated independently.
Figure 3.2: Energy of the accelerometer signal, before and after filtering, and after the thresholds(B1 and B2) are detected. Vertical dashed lines indicate detected steps. End of swing phase isoccurring at the beginning of this segment.
To solve these two problems, the proposed step detection algorithm introduces new state vari-
ables to preserve the state between segments. Instead of segmenting the signal when a turn or
change of activity is detected, the new implementation collects a specified number of samples for
each segment and then proceeds to perform the step detection algorithm. Adding these new state
23

variables brings two improvements. First, the conservation of the state between segments permits
to count all the steps. And secondly, some of the operations of the original algorithm are omitted
and not calculated, making the algorithm more efficient. For example, the calculation of B1 and
B2, which represent the swing and stand phase in Figure 3.2, that are calculated by digitalizing
the signal when it goes above the threshold T or below −T , respectively, are not calculated any-
more. Further, some other operations, such as the calculation of the energy of all the samples in
the segment and the bias of such segment are performed together.
The proposed algorithm introduces the following three state new variables: prev high that
indicates when the previously lookup sample was in a high peak (an energy value above a threshold
T ); look fw that indicates when the algorithm is in the search window for a low peak (an energy
value below −T ); and a counter, which counts the remaining samples of the search window to
find a low peak. These three variable values are maintained between the analysis of segments.
As with the original algorithm there are some functions and concepts that are preserved. Given
a segment of N samples of the acceleration signal A = {a1, a2, . . . , aN}, where each elements
is a three-dimensional measurement ai = {axi, ayi, azi}, the energy of the signal is given by the
Euclidean norm shown in Equation 3.1, its bias by Equation 3.2, and the average moving window
(AMW) filter expressed in Equation 3.3, where w is the window size. The entire new algorithm is
presented in Algorithm 1.
E[ai] =√a2xi + a2yi + a2zi (3.1)
Abias = E[A] where A =
∑Ni=1 aiN
(3.2)
AMW [ai] =1
2w + 1
i+w∑
j=i−w
E[aj]− Abias (3.3)
First, the algorithm declares its initial state by setting look fw and prev high to false and
counter to 2w; this is where the previously mentioned new state variables are also initialized.
Then, the energy for all the samples and bias for the segment are calculated inside the same loop
24

Algorithm 1: Step Detection Algorithm (Using acceleration samples A).1: Calculate Energy(Eq. 3.1) and Bias(Eq. 3.2) for A2: for i = 1, N do3: s← AMW [ai]4: if look fw = false and s ≥ T then5: prev high← true6: next iteration7: else if look fw = true then8: counter ← counter − 19: end if
10: if prev high = true and s < T then11: prev high← false12: look fw ← true13: end if14: if look fw = true and s ≥ T then15: look fw ← false16: prevhigh← true17: counter ← 2w18: next iteration19: end if20: if look fw and s ≤ −T then21: Step detected22: counter = 2w23: look fw ← false24: next iteration25: end if26: if counter = 0 then27: prev high← false28: look fw ← false29: counter ← 2w30: end if31: end for
in line 1; this saves one pass through the segment. Next, with the previously calculated energy and
bias, the AMW of each sample is calculated in line 3. Finally, each resulting sample is analyzed
depending on the current state of the algorithm. Just as in the original algorithm [35], a step is
detected when a high peak is followed by a low peak within certain distance (the search window).
As a consequence, B1 and B2 are not needed in this algorithm, which saves further passes through
25

the segment. It is also noted that the search window can be further expanded or shortened, for low
or high cadence.
3.2.1.3 Deviation Detection
Whenever a step is detected, the timestamp of it is matched with the rotation vector sample that
shares the same timestamp, and the AMW filter (Equation 3.3) is applied to smooth any possible
error in that specific sample. This allows the system to detect the change of heading of the patient
and calculate how much has the patient deviated from the path on each individual step. We can
obtain the deviation Di for Stepi, using the step length Slength and the angle Θi by applying Equa-
tion 3.4. The representation of this can be observed in Figure 3.3. Also, the cumulative deviation
is calculated using Equation 3.5, to get how much the user has deviated sideways from the start
point, or center of the path. The comparison between both is shown in Figure 3.4.
Step1 Step2 Step3
Slength
Θ1
Θ2
Θ3
D1
D2
D3
Figure 3.3: Imaginary floor triangles to get the deviation from the straight path.
Di = Slength sinΘi (3.4)
D(i)sum = Di +D(i−1)
sum where D(0)sum = 0 (3.5)
26

Figure 3.4: Sequence of steps, from top to bottom, showing the deviation of the patient in centime-ters. Blue bars indicate the deviation contributed by a particular step, while the red bars show thetotal deviation from the center of the path, i.e., the horizontal displacement of the patient.
3.2.2 FGA Evaluation Module
The FGA module includes different set of tests, each with a particular set of variables to eval-
uate. As was stated before in Section 3.1, only test 1 through 5, and 7 of the 10 tests of the FGA
have been included in the system. All these tests have different termination parameters, so for each
of the test a different module has been built to determine the termination of a test under certain
conditions. Only tests 3 and 4, have been grouped together given that they have the exact same
conditions. It is also worth noting, that tests 5 and 7 do not use the deviation as part of their
evaluation metric, although test 7 will use it as a condition for premature termination.
3.2.2.1 Test 1: Gait Level Surface
In this test, the patient is asked to walk straight at their normal speed for 6m.
This test uses the detected steps from Section 3.2.1.2 to determine the end of the test by simply
multiplying the number of steps collected at the moment #Steps by Slength. It will end the test
when #Steps×Slength ≥ 6m (20ft). Then, it will use the timing between the first and last step to
determine the duration of the test. Also, the amount of deviation is calculated using Equation 3.6.
27

Points are taken off each time the patient exceeds one of the levels shown in Figure 2.5.
Dmax = max (Dsum) (3.6)
The test duration and amount of deviation during the test are evaluated separately. These two
metrics, are scored based on the parameters detailed for Test 1 in Appendix A, that results in a
score between 0 and 3, and then compared to each other, to see which of the two have the lowest
result, which is taken as the final result of this test.
3.2.2.2 Test 2: Change in Gait Speed
This test is divided in 3 phases: normal, fast, and slow phase. Each phase represent a 1.5m
(≈ 60in) stage, that are calculated in the same manner as the completion of Test 1. When the test
starts, the patient is instructed to walk normally. As soon as 1.5m are traveled, the user is instructed
to walk fast, and later to walk slow by the system. The timing on each phase is determined by
looking at the time of the first and last step on each of the stages. Then, to quantify the difference of
speed, the average of difference between the normal vs. fast, and the normal vs. slow is calculated
using Equation 3.7. This difference is classified in 4 categories: normal (speeddiff > 30%), mild
(30% ≥ speeddiff > 20%), moderate (20% ≥ speeddiff > 10%), severe (speeddiff < 10%).
speeddiff =timeslow − timefast
2× timenormal× 100 (3.7)
In the case of the deviation, this is calculated in the same way as it was in Test 1 with Equa-
tion 3.6, using all the steps in the entire test. As with Test 1, the deviation from the center of the
path is also taken into account. The lowest of the two results, the deviation score and the difference
of speed score, is the one marked as the final result of the test.
28

3.2.2.3 Test 3 and 4: Horizontal and Vertical Head Turns
Tests 3 and 4 are grouped together given that both tests evaluate the exact same parameters,
have the same termination conditions, and number of phases. The only thing different are the
instructions given on each of the phases. For Test 3 are look ahead, look right, look left, look right
and look left; while for Test 4 are look ahead, look up, look down, look up, and look down. Each
of these phases is separated by 3 steps, as such, whenever the system detects that the patient has
taken 3 steps, it will indicate the patient what to do next.
Next, to evaluate how much the gait was affected by the head turns, the standard deviation of the
time σtime of the phases is calculated. Then, it is classified in 4 categories: normal (σtime < 0.75),
mild (0.75 < σtime ≤ 1.5), moderate (1.5 < σtime ≤ 2.25), and severe (σtime > 2.25). The
deviation from the straight path is calculated again with Equation 3.6. Both results are compared,
and the lowest one is picked as the result of these tests.
3.2.2.4 Test 5: Gait and Pivot Turn
This test presents a significant difference from the other tests in that the patient ends facing the
opposite direction from which he started. To detect this, the patient will be instructed to turn back
between 5 and 10 steps, after the start of the test. The quantity is generated randomly before the
test begins. After the patient is instructed to turn back, the test will end when the system detects
an step in the complete opposite direction from which the patient started. For example, if the test
started with the user facing the north direction, it will end when the user steps facing the south.
Then, the time between the steps when the instruction was given and the step when the patients
faces the opposite direction is calculated and classified in two categories: normal (time < 3s), or
slow (time > 3s). Also, the individual deviation of the last step (Equation 3.4) is calculated and
evaluated in the same way as it was with previous tests, but instead of cumulative, only the last
step will be used for comparison.
29

3.2.2.5 Test 7: Gait with Narrow Base of Support
This test presents two termination conditions: First, when the user is able to complete the 10
steps, and second, when the user staggers sideways, meaning a loss of balance. The first condition
can be easily achieved by using the step detection algorithm described before. The second condi-
tion can be achieved when a step is detected that deviated beyond the safe path, that is, 6 inches to
the left or 6 inches to the right. The only parameter to evaluate in this test is the number of steps
that the patient was able to complete before losing balance.
3.2.3 Metrics Calculation Module
The FGA evaluation by itself helps to determine if the patient suffers balance problems, but
given that to perform this test there is additional data being collected, such from the accelerome-
ters and rotation vector sensors, the system can use this data to find additional problems related to
the regularity and symmetry of the gait. To achieve this goal, the autocorrelation function presented
in Section 2.1.5.1, the DTW presented in Section 2.1.5.2, and a new method for step differentia-
tion, explained in Section 3.2.3.3, can be used to discover further additional causes to the patient
condition.
3.2.3.1 Autocorrelation
The autocorrelation function as it was presented by Moe-Nielsen and Helbostad [3], helps to
find the regularity and symmetry measures by using the collected accelerometer samples from
the tests. The autocorrelation of the acceleration signal Y-axis, given that the phone is in a fixed
position, is calculated using Equations 2.2 and 2.3, after applying a linear interpolation to the
signal to equalize the timing between each sample. Then, the dominant periods A1 and A2 are
found using the peak finding algorithm described in [15], but to find high peaks instead of the low
ones (valleys) on the signal, returning the exact position of the occurrence of each dominant period
30

Figure 3.5: Autocorrelation function on the Y-Axis of the accelerometer signal, with Ad1 = 0.8297and Ad2 = 0.8236, at times 0.6s and 1.2s, respectively.
on the signal. This is represented in Figure 3.5. From the time at which Ad2 occurs, the cadence of
the patient can be calculated using Equation 3.8.
Cadence =60
tAd2
(3.8)
3.2.3.2 Step Segmentation
Using the interpolated Y-axis accelerometer signal, the steps are extracted using [15] again,
but this time passing the negative of the signal, which was the original intention of the algorithm,
and segmenting and extracting the steps from these signals. The resulting timestamps in which the
signal was segmented are also used to segment the rotation vector X-axis signal, which measures
the rotation of the trunk (azimuth). After the steps are segmented, they are converted to units of
percentage of completion of the step from the absolute time. This makes all the steps match the
same scale when plotted [17], as shown in Figure 3.6, and then separated as shown in Figure 3.7
and Figure 3.8, using the method presented in Section 3.2.3.3.
31

Figure 3.6: Steps segmentation and transformed to a percentage scale.
Figure 3.7: Right steps extracted from segmentation.
Figure 3.8: Left steps extracted from segmentation.
32

3.2.3.3 Step Differentiation
Figure 3.9: Left steps trunk rotation trends after segmentation.
Figure 3.10: Right steps trunk rotation trends after segmentation.
Step differentiation is the ability to automatically distinguish between left and right steps. This
is achieved using the segmented rotation vector signal from Section 3.2.3.2, and looking at the trend
(slope) of each segment, where a positive slope indicates left steps (See Figure 3.9), and a negative
slope indicates a right step (See Figure 3.10). This can be easily done by looking at the first and last
sample of each rotation segment. Furthermore, the most significant step to differentiate is the first
one, given that each next consecutive step is the opposite to the previous one. Step differentiation
33

is very important in our analysis and assessment, as it helps the specialist to determine which limb
is presenting problems.
3.2.3.4 DTW
After the differentiation, each step is compared against one another using the DTW formula
shown in Equation 2.7, creating a comparison matrix between all the steps. Also, all the values are
averaged out to obtain an average DTW distance between the steps. An example of this is presented
in Table 3.1, where only half of the table is filled given that the DTW (S, T ) = DTW (T, S) and
the DTW (S, S) = 0. Contrary to the autocorrelation, the closer the value to 0, the better because
it means that there is less of a difference between the two steps compared. Also, the steps could be
separated in left and right steps and averaged independently to find any isolated irregularities on
each limb separately.
Table 3.1: DTW comparison matrix, with an average DTW = 0.058. Odd steps represent onelimb, while even steps represent the other one. DTW (1, 3) has a low difference, but DTW (3, 5),presents the highest one on the table, which again goes down in DTW (5, 7). Which means thatthe patient changed the way that it was stepping with the odd limb. Also, its worth noting thatDTW (1, 5) is high given the similarity between steps 1 and 3, and the same happens with step 7.
Step 2 3 4 5 6 7 81 0.09 0.03 0.03 0.1 0.03 0.08 0.082 0.08 0.05 0.08 0.06 0.06 0.053 0.05 0.1 0.05 0.07 0.084 0.05 0.04 0.06 0.065 0.09 0.03 0.096 0.08 0.037 0.08
3.3 System Implementation
The system proposed on this thesis runs on a client-server architecture to support its different
modules. The client application contains the Data Collection and FGA module, while the Server
application contains the Metrics and Visualization modules. The client is an Android application,
34

Figure 3.11: System overview.
while the server is a Ruby on Rails web service running on a Linux machine. These two applica-
tions communicate with each other using the HTTP protocol and the JSON format to transmit the
data.
3.3.1 Client Side: Mobile Data Collection and FGA Evaluation Application
The client application was developed for devices running Android 5.0+ (SDK Version 21),
using the Android Sensor API to comunicate with the device sensors.
As it shown it Figure 3.12, the application only includes two relevant screens, given that during
the execution of the test the screen is out of sight. The screen on the left is the Test Selection
activity. This activity only needs the user step length as input, and the selection of which of
the available tests of the FGA to perform. Additionally, when a particular test is selected, the
description of the test is displayed in the bottom, so the instructions do not take the patient by
surprise, and a reminder of putting the phone in the patient’s back before starting the test. After the
patient presses the start button, voices command using the Test to Speech engine of the Android
API are issued indicating the patient when to start walking, the end of the test, and any other special
instruction during the test. After the test is completed, the patient is directed to the second screen,
where the score of the FGA is shown and the reasons of such score.
35

Figure 3.12: Android application screenshots.
3.3.2 Server Side: Data Storage, Analysis and Visualization Application
The server of this system functions as the main backbone of the entire system. It is designed
to provide a better visualization and analysis environment of the data provided by the client appli-
cation. It automates the creation and identification of the different tests and automatically applies
the routines and algorithms described in previous sections. The server obligations are:
• Collecting data: The server works as an endpoint where the client application can send the
data to be analyzed at the end of each test.
• Data analysis: Although the FGA evaluation is done in the phone, the DTW and Autocorre-
lation algorithms are performed in the sever together with other signal processing algorithm
to extract more information from the data received.
• Test Observations: Each test taken can be manually commented, such as adding a note or
description, to indicate of any special conditions present during the test.
36

• Results Visualization: It offers a web interface where the results are presented in a human-
readable way for better understanding of the results.
• Persistence: The results are stored for future evaluation and later review.
Figure 3.13 shows two of the interactive graphs presented to the user or physician accessing the
web application.
Figure 3.13: Partial view of the web application showing results.
3.3.3 Development and Deployment Tools
This section presents the tools and software used for the development of this system. All of
them are totally free, and most of them are open source as well.
• Android Studio: The Integrated Development Environment (IDE) recommended by Google
as the successor of Android Development Tools (ADT) plug-in for Eclipse.
• Ruby on Rails: Web framework for Ruby, using the Model-View-Controller (MVC) scheme,
it has great extensibility thanks to all the libraries available, known as Gems.
37
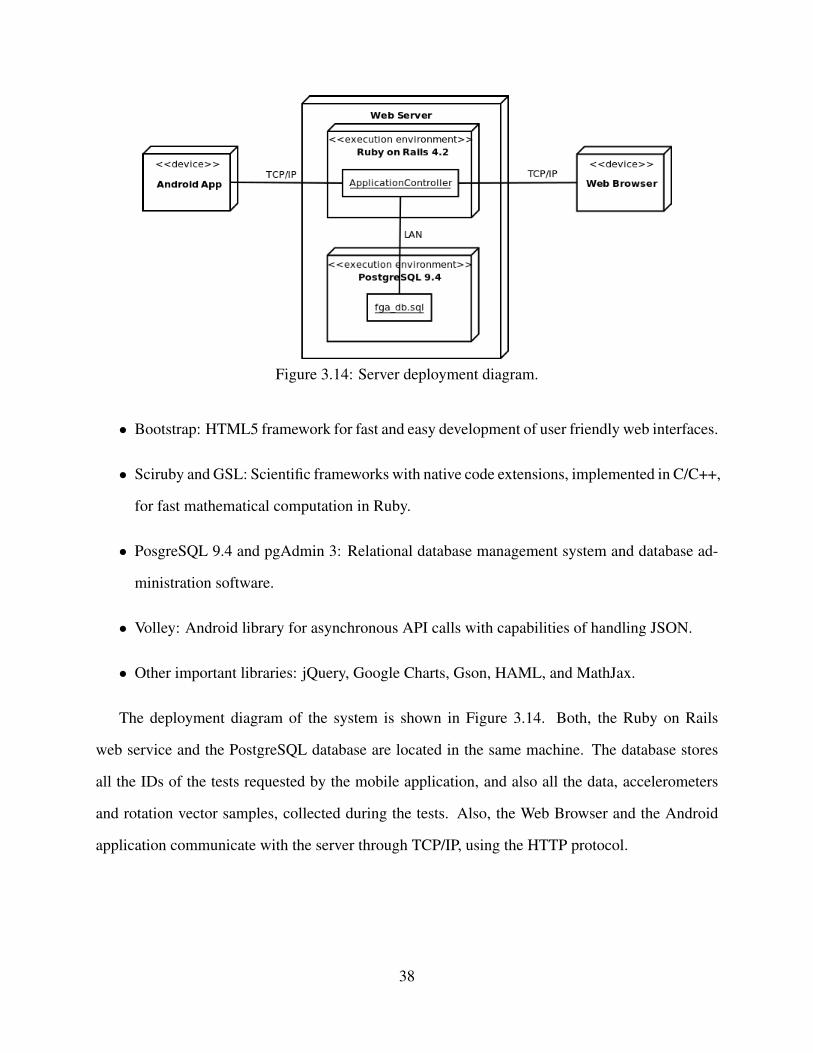
Figure 3.14: Server deployment diagram.
• Bootstrap: HTML5 framework for fast and easy development of user friendly web interfaces.
• Sciruby and GSL: Scientific frameworks with native code extensions, implemented in C/C++,
for fast mathematical computation in Ruby.
• PosgreSQL 9.4 and pgAdmin 3: Relational database management system and database ad-
ministration software.
• Volley: Android library for asynchronous API calls with capabilities of handling JSON.
• Other important libraries: jQuery, Google Charts, Gson, HAML, and MathJax.
The deployment diagram of the system is shown in Figure 3.14. Both, the Ruby on Rails
web service and the PostgreSQL database are located in the same machine. The database stores
all the IDs of the tests requested by the mobile application, and also all the data, accelerometers
and rotation vector samples, collected during the tests. Also, the Web Browser and the Android
application communicate with the server through TCP/IP, using the HTTP protocol.
38

CHAPTER 4
EVALUATION
In this chapter, the performance of the proposed system is evaluated with several tests to assess
each of its different components. The first section presents the methodology used to perform such
tests, and a description of the device used to perform the tests. Next, each of the modules and the
algorithms involved in the system are evaluated and presented. Finally, the chapter concludes with
the discussion of the evaluation results.
4.1 Methodology
The client Android application was installed in a Motorola Nexus 6 smartphone, which comes
with the required sensors needed for the system. The set of experiments were performed in differ-
ent corridors in the University of South Florida Campus, and in home environments with enough
space to perform the tests. The system only requires a couple of steps to perform an evaluation:
1. Perform the test on the client application, selecting the FGA test to be performed and the
step length.
2. Review the results in the device and the web server.
The objective of this system is to perform the FGA in an automated and not assisted manner, and
not to evaluate the validity of the FGA test, because that has been proved already in [13]. Because
of that, the individual components and algorithms are evaluated and not the validity of the FGA
tests results. Initially, the new step detection algorithm performance is evaluated. This algorithm
is essential given that it is the main component that determines the termination conditions for most
39

of the FGA tests. Then, the precision of the deviation detection algorithm is evaluated, testing
the different levels required for the FGA. The deviation has a high influence in the results of the
FGA tests. The evaluation continues testing the autocorrelation module, by imitating different
impediments while walking. This is important given that in [3] the tests were performed with
high quality sensors and not those embedded in a smartphone. Finally, the step segmentation, step
differentiation and DTW are evaluated together. These modules are able to detect the origin of the
problem in the patient’s gait.
4.2 Device: Motorola Nexus 6
The Motorola Nexus 6, also known as the Motorola Nexus X, is the 6th generation of Google
flagships phones. It was manufactured by Motorola in partnership with Google. This phone be-
came available in October 2014. It has a 6” AMOLED display and a Qualcomm Snapdragon 805
chipset with a Quad-Core 2.7 GHz processor.
This phone brings two cameras: a 13MP back camera and a 2MP front camera. It comes with
an NFC chip and wireless charging technology (Qi-enabled). Also, it runs Google’s latest stock
Android release 6.0.1 (Marshmallow). Table 4.1 shows in more detail the specifications of the
phone.
The main reason of choosing this device is the large screen size, which allows an easier in-
teraction when starting the test from the back of the patient, but without being too big to make it
uncomfortable. Also, it includes all the necessary sensors needed for the system. Finally, thanks
to some new features included in Android Marshmallow, it has a prolonged battery life.
4.3 Step Detection Tests
This section evaluates the performance of Algorithm 1. Two factors were looked at when
evaluating the algorithm: the responsiveness and the precision of the algorithm. First, the reporting
of the steps must be in a fast and consistent manner. Second, the number of steps reported should
40

Table 4.1: Motorola Nexus 6 specifications.
Motorola Nexus 6Dimensions 159.3 x 83 x 10.1 mm (6.27 x 3.27 x 0.40 in)
Weight 184 g (6.49 oz)
ProcessorQualcomm Snapdragon 805Quad-core 2.7 GHz Krait 450Adreno 420
Operating System Android 6.0.1Memory 32/64 GB, 3 GB RAM
Display
AMOLED capacitive touchscreen16M colors5.96 inches1440 x 2560 pixels
Connectivity
HSPA 42.2/5.76 MbpsLTE Cat4 150/50 Mbps or Cat6 300/50 MbpsWi-Fi 802.11 a/b/g/n/ac, dual-bandBluetoothv 4.1, A2DP, LE
Battery Li-Po 3220 mAhSensors Accelerometer, gyro, proximity, compass, barometer
be the actual steps taken by the user. This is really important, being the main source of termination
for most of the FGA tests.
The experiment setting was set using the Test 1 of the FGA from the application, given that is
the most basic test, with a step length of 60cm. That way the test should stop exactly at 10 steps,
for the 6m of distance traveled.
Table 4.2 shows 30 tests with 3 different conditions: bare foot, right leg impediment, and left
leg impediment. The last two are simulated by using a shoe with a 1” thick sole in the correspond-
ing foot.
As shown, different impediments do not introduce a significant amount of error in the results
of the tests.
41

Table 4.2: Number of steps counted by Algorithm 1 for each of the test cases.
Test Bare Foot Right Impediment Left Impediment1 10 10 92 10 9 93 10 11 124 11 9 115 10 10 96 9 9 107 10 12 88 8 10 109 10 8 10
10 13 10 8Average 10.1 9.8 9.6
MAE 0.7 0.8 1
Figure 4.1: FGA tests levels labeled by color, where green is 3 points, yellow is 2 points, orange is1 point, and red is 0 points for the FGA tests results.
4.4 Step Deviation Tests
This section tests the precision of the deviations from a straight path. The four levels of de-
viation of the FGA were evaluated, those being: Deviation stayed within 15.24cm (6”) outside
of the secure path; Deviation stayed within 25.4cm(10”), but exceeded 15.24cm (6”) outside of
the secure path; Deviation stayed within 38.1cm (15”), but exceeded 24.4cm (10”) outside of the
secure path.; and deviation that exceeded 38.1cm (15”). Each of the previous levels scores are
42

from 3 to 0 respectively, and labeled Level 0 through 3 from best to worst (shown in Figure 4.1).
Each level, except the first one, were tested with two different walking patterns:
Figure 4.2: Test walking patterns.
1. Deviate until reaching the level and then walking straight until the end.
2. Deviate until reaching the level and then correct the course walking towards the center of the
path (safe path).
Examples of these patterns are shown in Figure 4.2.
Ten tests were performed for each deviation level and pattern, alternating between deviating
to the left or to the right of the path. Table 4.3 shows the results of such tests, were 0 means that
the system captured the right level, +1 that the system calculated 1 more level farther away from
the center, and −1 that the system calculated 1 level closer to the center of the path, For example,
take the results of the column Level 1 Keep Straight: Test 2, gives a result of −1, meaning that the
result given by the system was that of no deviation, i.e., it detected less deviation that the real one;
while Test 8 results in +1, meaning that the system responded with a result of Level 2, meaning
that it detected more deviation than the real result.
43

Table 4.3: Deviation levels test results.
Test L0 L1 KS L1 WC L2 KS L2 WC L3 KS L3 WC1 0 0 0 0 -1 -1 -12 0 -1 -1 -1 -1 -1 03 0 0 0 -1 0 -1 -14 0 0 0 0 +1 0 -15 0 0 0 +1 0 0 -16 +1 0 0 0 -1 -1 07 0 0 -1 -1 -1 -1 08 0 +1 0 0 -1 0 -19 0 0 0 +1 0 -1 -1
10 0 0 0 -1 -1 -1 -1Errors 1 2 2 6 7 7 7
It is shown that for No deviation and Level 1 tests there are satisfactory results, while Level
2 and 3 are not. Also, it is to note that most errors are towards the path center, meaning that the
system reported a lesser level than it supposed to. Finally, there is no significant difference between
deviating and keep walking straight, and trying to correct the deviation walking towards the center.
4.5 Autocorrelation Tests
The Autocorrelation was tested with the same experiments that were used for the step detection
algorithm. The autocorrelation helps to determine if there is a systematic problem or not with the
regularity and symmetry of the steps and gait cycles. Table 4.4 shows the results of each of the
tests.
Using the results from Table 4.4, a series of unpaired t-test for a 95% confidence interval were
performed between the different variables and experiments, using the No Impediment experiment
as the base case. The results of such comparison are shown in Table 4.5.
From these results we can infer that values above 0.74 ± 0.03 for Ad1 are considered to be
values representative of normal gait. Also, the system was able to catch the irregularity present
in one foot by returning lower values for Ad1 when there was an impediment present. Further, in
the case of right impediment, the value of Ad2 remained high, meaning a systematic asymmetry
44

Table 4.4: Auto correlation tests results.
No impediment Right impediment Left impedimentTest Ad1 Ad2 Ad1/Ad2 Ad1 Ad2 Ad1/Ad2 Ad1 Ad2 Ad1/Ad2
1 0.73 0.83 0.88 0.71 0.64 1.11 0.66 0.72 0.922 0.72 0.80 0.90 0.69 0.67 1.03 0.66 0.68 0.973 0.75 0.73 1.03 0.65 0.76 0.86 0.68 0.75 0.914 0.84 0.80 1.06 0.73 0.81 0.90 0.72 0.66 1.095 0.70 0.81 0.86 0.71 0.66 1.08 0.66 0.51 1.296 0.72 0.78 0.92 0.69 0.81 0.85 0.66 0.58 1.147 0.71 0.61 1.17 0.69 0.83 0.82 0.72 0.76 0.958 0.73 0.66 1.11 0.72 0.81 0.89 0.68 0.68 1.009 0.73 0.71 1.03 0.71 0.75 0.95 0.61 0.61 1.01
10 0.79 0.84 0.94 0.67 0.75 0.89 0.63 0.57 1.12Average 0.74 0.76 0.99 0.70 0.75 0.94 0.67 0.65 1.04
Std. Deviation 0.04 0.08 0.11 0.02 0.07 0.10 0.03 0.08 0.12
Table 4.5: Unpaired t tests for a 95% confidence interval for the autocorrelation metrics. The Ad1
variable was the only one to be statistically significantly different on both cases with impedimentwhen compared to no impediment. the variable Ad2 was found to be statistically significantlydifferent for the case of No impediment vs. Left Impediment.
No impediment vs. Right impediment No impediment vs. Left impedimentVariable Ad1 Ad2 Ad1/Ad2 Ad1 Ad2 Ad1/Ad2
t Stat 2.849 0.221 1.099 4.380 3.024 -1.015P one-tail 0.005 0.414 0.143 0.000 0.004 0.162P two-tail 0.011 0.827 0.286 0.000 0.007 0.324
problem, while for the left impediment Ad2 remained closer to Ad1, meaning a irregularity not only
between steps but also between strides.
4.6 Segmentation, Differentiation and DTW
This sections describes the results segmenting the steps, differentiating between right and left
steps, and the comparison between them using the DTW. These three were tested using the same
data from the real time step detection and autocorrelation modules.
45

4.6.1 Step Segmentation
Figure 4.3 shows the results of the step segmentation when the user performs the walking
exercise with and without impediments.
Figure 4.3a: No impediment walking segmentation.
Figure 4.3b: Right impediment walking segmentation.
Figure 4.3c: Left impediment walking segmentation.
Looking at the three figures, it seems that the steps when there is no impediment, shown in
Figure 4.3a, present the most regular patterns, specially towards the middle and last section of the
46

waves, when compared to the other two cases where impediments are present (Figures 4.3b and
4.3c).
4.6.2 Step Differentiation
Figure 4.3 shows the results of the step differentiation with Normal Walking, Right Impedi-
ment, and Left Impediment.
Figure 4.4a: No impediment walking differentiation.
Figure 4.4b: Right impediment walking differentiation.
Figure 4.4c: Left impediment walking differentiation.
47

Although in Figure 4.4b, step 2 looks somewhat different from the other steps, such thing that
could be caused because the smartphone moved or tilted when performing that step, there seems to
not be no major effect of the impediments in the process of detecting the trend of each of the steps
to determine which are right and which are left steps.
4.6.3 DTW Tests
The objective of the DTW is to be used as a progress tracking metric, where values should be
lower overtime, if there is any improvement in the patient gait, or be higher if the symptoms are
getting worse. Table 4.6 presents the results.
Table 4.6: DTW difference between all the steps, right steps, and left steps tests results.
No Impediment Right Impediment Left ImpedimentTest DTW DTWR DTWL DTW DTWR DTWL DTW DTWR DTWL
1 0.16 0.02 0.09 0.15 0.09 0.23 0.21 0.18 0.232 0.16 0.03 0.13 0.21 0.24 0.21 0.27 0.25 0.313 0.13 0.09 0.18 0.15 0.07 0.11 0.24 0.23 0.294 0.08 0.06 0.10 0.13 0.04 0.16 0.24 0.28 0.245 0.19 0.09 0.12 0.18 0.20 0.08 0.34 0.34 0.336 0.24 0.14 0.18 0.21 0.12 0.24 0.31 0.38 0.257 0.23 0.11 0.19 0.17 0.17 0.18 0.21 0.19 0.308 0.24 0.35 0.14 0.25 0.11 0.28 0.27 0.35 0.139 0.16 0.07 0.07 0.29 0.31 0.20 0.32 0.23 0.29
10 0.18 0.13 0.12 0.11 0.13 0.10 0.33 0.40 0.20Average 0.18 0.11 0.13 0.18 0.15 0.18 0.27 0.29 0.26STDEV 0.05 0.09 0.04 0.06 0.08 0.07 0.05 0.08 0.06
From Section 4.5, it was discovered that when a left impediment was present, not only there
was a step-to-step irregularity but also a stride-to-stride irregularity, while the right impediment
experiment was presenting only a step irregularity. Because of this, for this evaluation the left
impediment was marked as a worst scenario, followed by the right impediment, and finally the no
impediment experiment was marked as the normal gait case. Now, from Table 4.6 it is observed
how the average values for each of the metrics tend to go up as the symptoms gets worse, simulating
the progress of a patient condition.
48

4.7 Discussion
All the experiments and result table presented in the previous section, evaluate the performance
of the system proposed in this thesis. First, the real time step detection algorithm was evaluated
measuring the number of steps when the system was supposed to stop, at 10 steps, versus the
actual steps counted manually. The Mean Absolute Error (MAE) was ±1 for the 10 tests that were
performed. The source of this error was separated in two classes: first, when steps were missing,
hence the user walking more than 10 steps before the system stopped; and second, when the system
counted extra steps, making the system stop before the total completion of the test. The former
has been tracked to a problem that occurs with the first step of the human gait, which is actually
half step, given that the limb only travels half the distance of a normal step. This can incur in
the system not detecting the first, and sometimes even the second steps at the start of a test. This
problem is a constant, meaning that this error only happens at the beginning and does not propagate
during the test. The second cause, counting extra steps, can be caused because the device was not
firmly attached to the back of the patient, making the device bounce a little which can introduce
noise in the signal by introducing not existing peaks, that are counted as steps, hence finishing the
test earlier. The simple solution for this is making sure that the device is firmly attached before
performing a test by adjusting the belt or band that is holding the device.
Then, the deviation detection system was tested with the different levels of deviation required
by the FGA. The first two Levels: No deviaton (Level 0) and more than 6” but less than 10”
(Level 1), returned good results with 90% and 80% accuracy respectively. On the other hand, the
results from Levels 2 and Level 3, were not satisfactory with an average of 35% and 30% accuracy,
respectively. In particular, out of the 17 errors between Level 1 and Level 2, 13 (76.4%) of the
errors were pointing towards the center of the path, meaning that this particular sensor, the rotation
vector sensor, has a bias towards fixing its orientation. Furthermore, the action of trying to correct
course does not affect the results of the test, and its able to detect these deviations, even after the
user has tried to go back to the center of the path. Despite these unsatisfactory results, the proposed
49

solution points towards a good direction in creating a tool that helps to detect really small deviation
changes using low quality sensors, as those present in the used device.
Next, the autocorrelation module was tested to see if it could catch any general problems in
the regularity or symmetry of the gait of the patient using the low quality sensors embedded in the
device. The autocorrelation worked as expected with available sensors, giving the best result when
there is no impediment with an almost perfect symmetry of 0.99. This is found remarkable given
that the difference between no impediment and the other two scenarios was only a 1” thick sole
shoe, and this impacted the results when the impediment was present.
Finally, the last section presented the segmentation, differentiation and DTW module, which
tries to identify the source of the problem or condition of the patient. The segmentation component
shows a more regular acceleration signal wave when there is no impediment present on the patient,
than those waves when there is one. Contrary, the differentiation component did not seem affected
by this, which is good, meaning that the system can keep identifying the correct limb, even under
special conditions. Lastly, the DTW captures the problem when there is an impediment present,
reporting higher values on all the three metrics, but what is more interesting is that on average the
limb not affected by the impediment, showed the higher value of the two. This could be because
the good limb is trying to compensate for the extra work that it has to do.
While different and more rigorous experiments are required (simulation of more conditions,
test the system in real patients, different metrics to be evaluated), these are promising results for
an unattended clinical gait assessment system.
50

CHAPTER 5
SUMMARY
5.1 Conclusion
This thesis presents a Clinical Gait Assessment system to perform the FGA tests without the
need of doctor visits or additional costs from transportation or expensive equipment. The presented
work uses the available sensors present in today’s smartphones to gather the data that it needs to
perform the FGA tests and calculate additional gait metrics to help identify the source of a problem
in a patient’s gait.
A new step detection algorithm is introduced, which permits to calculate the number of steps
walked by a patient in real time (using the accelerometer). Also, using the rotation vector sensor, a
meta-sensor which is a combination of the accelerometer and gyroscope, a new deviation detection
method is introduced. Additional metrics are calculated such as the autocorrelation dominant
periods, and a segmentation, differentiation, and DTW component are also present. Finally, all
these components are put together in a automatic system which requires minimum intervention
from the user.
The evaluation of the system shows a high accuracy when calculating steps, with a mean abso-
lute error of ±1. The deviation module presented mixed results with the first two levels of detection
giving an accuracy of 90% and 80%, while the last two 35% and 30%. The additional metrics mod-
ules, autocorrelation and DTW, are able to detect when there is a problem present with the user
gait, while the differentiation module keeps working correctly under different conditions.
51

5.2 Future Works
The proposed work can be extended and improved in several directions. First, the evaluation
presented in this work was done using only one user, simulating different gait conditions and
patterns. The system needs to be put to a test with real patients suffering from several different
conditions and see if the current metrics can capture the causes of those conditions. Since the
simulated conditions where so subtle and the system was able to detect them, more harsh conditions
must no present a problem to the system. Nevertheless, this needs to be evaluated.
Second, although the deviation module proposed in the system is a good starting point, the
results were far from ideal. Therefore, there is a need to find better ways, algorithms, filters
or methods to compensate for the bias introduced by the rotation vector sensor when there are
deviations that exceeds 10” outside of the safe path, giving more accurate results of the FGA tests.
Additionally, the FGA results need to be tested against those that a trained professional would give
performing the same set of tests.
Finally, the metrics module is currently designed to work in the server side of the system. It
will be an improvement if this module is integrated together with the FGA module, so that it runs
all the calculations on site, converting the server to just a storage place of the collected data for
future reference. This will bring the advantage of more information at the instant to the patient after
finishing each test. Also, the server side should be expanded with a registration and authentication
system. This will bring the advantage of privacy for each user of the system, and at the same time
allow the study of different types of population gait separated by groups such as sex and age.
52

REFERENCES
[1] E. Stone and M. Skubic, “Evaluation of an inexpensive depth camera for in-home gait assess-ment,” Journal of Ambient Intelligence and Smart Environments, vol. 3, no. 4, pp. 349–361,2011.
[2] D. Gouwanda and S. A. Senanayake, “Identifying gait asymmetry using gyroscopesa cross-correlation and normalized symmetry index approach,” Journal of Biomechanics, vol. 44,no. 5, pp. 972–978, 2011.
[3] R. Moe-Nilssen and J. L. Helbostad, “Estimation of gait cycle characteristics by trunk ac-celerometry,” Journal of biomechanics, vol. 37, no. 1, pp. 121–126, 2004.
[4] Centers for Disease Control and National Center for Health Statistics, “National hospitaldischarge survey, 2010,” 2013.
[5] Department of Research and Scientific Affairs and American Academy of OrthopaedicSurgeons. (2013) Physician visits for musculoskeletal symptoms and complaints. Accessed:June, 6 2015. [Online]. Available: http://www.aaos.org/research/stats/patientstats.asp.
[6] T. Okoro, A. B. Lemmey, P. Maddison, and J. G. Andrew, “An appraisal of rehabilitationregimes used for improving functional outcome after total hip replacement surgery,” BMCSports Science, Medicine and Rehabilitation, vol. 4, no. 1, p. 5, 2012.
[7] E. Mayr, M. Nogler, M.-G. Benedetti, O. Kessler, A. Reinthaler, M. Krismer, andA. Leardini, “A prospectiv randomized assessment of earlier functional recovery in{THA} patients treated by minimally invasive direct anterior approach: A gait analysisstudy,” Clinical Biomechanics, vol. 24, no. 10, pp. 812–818, 2009. [Online]. Available:http://www.sciencedirect.com/science/article/pii/S0268003309001697.
[8] H. R. F. Yakhdani, H. A. Bafghi, O. G. Meijer, S. M. Bruijn, N. van den Dikkenberg,A. B. Stibbe, B. J. van Royen, and J. H. van Dien, “Stability and variabilityof knee kinematics during gait in knee osteoarthritis before and after replacementsurgery,” Clinical Biomechanics, vol. 25, no. 3, pp. 230–236, 2010. [Online]. Available:http://www.sciencedirect.com/science/article/pii/S0268003309002873.
[9] J. L. da Fonseca, M. Magini, and T. H. de Freitas, “Laboratory gait analysis in patients withlow back pain before and after a pilates intervention,” Journal of Sport Rehabilitation, vol. 18,no. 2, p. 269, 2009.
53

[10] A. Rasch, N. Daln, and H. E. Berg, “Muscle strength, gait, and balance in 20 patientswith hip osteoarthritis followed for 2 years after tha,” Acta Orthopaedica, vol. 81, no. 2,pp. 183–188, 2010. [Online]. Available: http://informahealthcare.com/doi/abs/10.3109/17453671003793204
[11] T. Otsuki, K. Nawata, and M. Okuno, “Quantitative evaluation of gait pattern in patientswith osteoarthrosis of the knee before and after total knee arthroplasty. gait analysis using apressure measuring system,” Journal of Orthopaedic Science, vol. 4, no. 2, pp. 99–105, 1999.
[12] D. M. Wrisley, M. L. Walker, J. L. Echternach, and B. Strasnick, “Reliability of the dynamicgait index in people with vestibular disorders,” Archives of Physical Medicine and Rehabili-tation, vol. 84, no. 10, pp. 1528–1533, 2003.
[13] D. M. Wrisley, G. F. Marchetti, D. K. Kuharsky, and S. L. Whitney, “Reliability, internal con-sistency, and validity of data obtained with the functional gait assessment,” Physical Therapy,vol. 84, no. 10, pp. 906–918, 2004.
[14] H. Blake, “Innovation in practice: mobile phone technology in patient care,” Br J CommunityNurs, vol. 13, no. 4, p. 160, 2008.
[15] M. Derawi and P. Bours, “Gait and activity recognition using commercial phones,” Comput-ers & Security, vol. 39, pp. 137–144, 2013.
[16] M. O. Derawi, C. Nickel, P. Bours, and C. Busch, “Unobtrusive user-authentication on mobilephones using biometric gait recognition,” in Intelligent Information Hiding and MultimediaSignal Processing (IIH-MSP), 2010 Sixth International Conference on. IEEE, 2010, pp.306–311.
[17] R. Baker and H. M. Hart, Measuring walking: a handbook of clinical gait analysis. MacKeith Press, 2013.
[18] J. K. Loudon, M. Swift, and S. Bell, The clinical orthopedic assessment guide. HumanKinetics, 2008.
[19] R. M. Kiss and A. Illyes, “Comparison of gait parameters in patients following total hiparthroplasty with a direct-lateral or antero-lateral surgical approach,” Human movement sci-ence, vol. 31, no. 5, pp. 1302–1316, 2012.
[20] A. Sant’Anna, N. Wickstrom, H. Eklund, and R. Tranberg, “A wearable gait analysis systemusing inertial sensors part ii: Evaluation in a clinical setting,” in International Conference onBio-inspired Systems and Signal Processing, BIOSIGNALS 2012, Vilamoura, Algarve, 1-4February, 2012. SciTePress, 2012, pp. 5–14.
[21] W. Tao, T. Liu, R. Zheng, and H. Feng, “Gait analysis using wearable sensors,” Sensors,vol. 12, no. 2, pp. 2255–2283, 2012.
[22] M. Gabel, R. Gilad-Bachrach, E. Renshaw, and A. Schuster, “Full body gait analysis withkinect,” in Engineering in Medicine and Biology Society (EMBC), 2012 Annual InternationalConference of the IEEE. IEEE, 2012, pp. 1964–1967.
54

[23] D. Stoia and M. Toth-Tascau, “Comparison of treadmill-based and overground gait analy-sis,” in International Conference on Advancements of Medicine and Health Care throughTechnology. Springer, 2011, pp. 368–371.
[24] B. Zhang, S. Jiang, D. Wei, M. Marschollek, and W. Zhang, “State of the art in gait analysisusing wearable sensors for healthcare applications,” in Computer and Information Science(ICIS), 2012 IEEE/ACIS 11th International Conference on. IEEE, 2012, pp. 213–218.
[25] S. Nishiguchi, M. Yamada, K. Nagai, S. Mori, Y. Kajiwara, T. Sonoda, K. Yoshimura,H. Yoshitomi, H. Ito, K. Okamoto et al., “Reliability and validity of gait analysis by android-based smartphone,” Telemedicine and e-Health, vol. 18, no. 4, pp. 292–296, 2012.
[26] A. Salarian, H. Russmann, F. J. Vingerhoets, C. Dehollain, Y. Blanc, P. R. Burkhard, andK. Aminian, “Gait assessment in parkinson’s disease: toward an ambulatory system for long-term monitoring,” Biomedical Engineering, IEEE Transactions on, vol. 51, no. 8, pp. 1434–1443, 2004.
[27] B. Mariani, C. Hoskovec, S. Rochat, C. Bula, J. Penders, and K. Aminian, “3d gait assessmentin young and elderly subjects using foot-worn inertial sensors,” Journal of biomechanics,vol. 43, no. 15, pp. 2999–3006, 2010.
[28] J. Klucken, J. Barth, P. Kugler, J. Schlachetzki, T. Henze, F. Marxreiter, Z. Kohl, R. Steidl,J. Hornegger, B. Eskofier et al., “Unbiased and mobile gait analysis detects motor impairmentin parkinsons disease,” PloS one, vol. 8, no. 2, p. e56956, 2013.
[29] E. J. Keogh and M. J. Pazzani, “Derivative dynamic time warping.” in SDM, vol. 1. SIAM,2001, pp. 5–7.
[30] M. O. Derawi, P. Bours, and K. Holien, “Improved cycle detection for accelerometer basedgait authentication,” in Intelligent Information Hiding and Multimedia Signal Processing(IIH-MSP), 2010 Sixth International Conference on. IEEE, 2010, pp. 312–317.
[31] J. Barth, C. Oberndorfer, C. Pasluosta, S. Schulein, H. Gassner, S. Reinfelder, P. Kugler,D. Schuldhaus, J. Winkler, J. Klucken et al., “Stride segmentation during free walk move-ments using multi-dimensional subsequence dynamic time warping on inertial sensor data,”Sensors, vol. 15, no. 3, pp. 6419–6440, 2015.
[32] “comScore Reports June 2015 U.S. Smartphone Subscriber MarketShare.” [Online]. Available: http://www.comscore.com/Insights/Market-Rankings/comScore-Reports-June-2015-US-Smartphone-Subscriber-Market-Share.
[33] “The Android Source Code | Android Open Source Project.” [Online]. Available:https://source.android.com/source/index.html.
[34] “Meet ART, Part 2: Benchmarks - Performance Won’t Blow You Away Today,But It Will Get Better.” [Online]. Available: http://www.androidpolice.com/2013/11/12/meet-art-part-2-benchmarks-performance-wont-blow-away-today-will-get-better/.
55

[35] J. J. Marron Monteserin, “Multi sensor system for pedestrian tracking and activity recognitionin indoor environments,” Master’s thesis, University of South Florida, 2014.
56

57
APPENDIX A: FUNCTIONAL GAIT ASSESSMENT TESTS
The only requirement to perform a Functional Gait Assessment is a marked 6-m (20-ft) walk-
way that is marked with a 30.48-cm (12-in) width, as shown in Figure 2.5.
1. Gait level surface
Instructions: Walk at your normal speed from here to the next mark (6 m (20 ft)).
Grading: Mark the highest category that applies.
• (3) Normal - Walks 6 m (20 ft) in less than 5.5 seconds, no assistive devices, good
speed, no evidence for imbalance, normal gait pattern, deviates no more than 15.24
cm (6 in) outside of the 30.48-cm (12-in) walkway width.
• (2) Mild impairment - Walks 6 m (20 ft) in less than 7 seconds but greater than 5.5
seconds, uses assistive device, slower speed, mild gait deviations, or deviates 15.24
-25.4 cm (6-10 in) outside of the 30.48-cm (12-in) walkway width.
• (1) Moderate impairment - Walks 6 m (20 ft), slow speed, abnor- mal gait pattern,
evidence for imbalance, or deviates 25.4 - 38.1 cm (10-15 in) outside of the 30.48-
cm (12-in) walkway width. Requires more than 7 seconds to ambulate 6 m (20 ft).
• (0) Severe impairment - Cannot walk 6 m (20 ft) without assistance, severe gait de-
viations or imbalance, deviates greater than 38.1 cm (15 in) outside of the 30.48-cm
(12-in) walkway width or reaches and touches the wall.
2. Change in gait speed
Instructions: Begin walking at your normal pace (for 1.5 m (5 ft)). When I tell you go, walk

58
as fast as you can (for 1.5 m [5 ft]). When I tell you slow, walk as slowly as you can (for
1.5 m (5 ft)).
Grading: Mark the highest category that applies.
• (3) Normal - Able to smoothly change walking speed without loss of balance or
gait deviation. Shows a significant difference in walking speeds between normal,
fast, and slow speeds. Deviates no more than 15.24 cm (6 in) outside of the 30.48-
cm (12-in) walkway width.
• (2) Mild impairment - Is able to change speed but demonstrates mild gait
deviations, deviates 15.24 -25.4 cm (6 -10 in) outside of the 30.48-cm (12-in)
walkway width, or no gait deviations but unable to achieve a significant change in
velocity, or uses an assistive device.
• (1) Moderate impairment - Makes only minor adjustments to walking speed, or ac-
complishes a change in speed with significant gait deviations, deviates 25.4 -38.1
cm (10 -15 in) outside the 30.48-cm (12 in) walkway width, or changes speed but
loses balance but is able to recover and continue walking.
• (0) Severe impairment - Cannot change speeds, deviates greater than 38.1 cm (15
in) outside 30.48-cm (12 in) walkway width, or loses balance and has to reach for
wall or be caught.
3. Gait with horizontal head turns
Instructions: Walk from here to the next mark 6 m (20 ft) away. Begin walking at your
normal pace. Keep walking straight; after 3 steps, turn your head to the right and keep
walking straight while looking to the right. After 3 more steps, turn your head to the left
and keep walking straight while looking left. Continue alternating looking right and left

59
every 3 steps until you have completed 2 repetitions in each direction.
Grading: Mark the highest category that applies.
• (3) Normal - Performs head turns smoothly with no change in gait. Deviates no
more than 15.24 cm (6 in) outside 30.48-cm (12 in) walkway width.
• (2) Mild impairment - Performs head turns smoothly with slight change in gait ve-
locity (eg, minor disruption to smooth gait path), deviates 15.24 -25.4 cm (6 -10 in)
outside 30.48-cm (12-in) walkway width, or uses an assistive device.
• (1) Moderate impairment - Performs head turns with moderate change in gait veloc-
ity, slows down, deviates 25.4 -38.1 cm (10 -15 in) outside 30.48-cm (12 in)
walkway width but recov- ers, can continue to walk.
• (0) Severe impairment - Performs task with severe disruption of gait (eg, staggers
38.1 cm (15 in) outside 30.48-cm (12-in) walkway width, loses balance, stops, or
reaches for wall).
4. Gait with vertical head turns
Instructions: Walk from here to the next mark (6 m (20 ft)). Begin walking at your normal
pace. Keep walking straight; after 3 steps, tip your head up and keep walking straight while
looking up. After 3 more steps, tip your head down, keep walking straight while looking
down. Continue alternating looking up and down every 3 steps until you have completed 2
repetitions in each direction.
Grading: Mark the highest category that applies.
• (3) Normal - Performs head turns with no change in gait. Deviates no more than
15.24 cm (6 in) outside 30.48-cm (12 in) walkway width.
• (2) Mild impairment - Performs task with slight change in gait velocity (eg, minor

60
disruption to smooth gait path), deviates 15.24 -25.4 cm (6-10 in) outside 30.48-cm
(12 in) walkway width or uses assistive device.
• (1) Moderate impairment - Performs task with moderate change in gait velocity,
slows down, deviates 25.4 -38.1 cm (10-15 in) outside 30.48-cm (12 in) walkway
width but recovers, can continue to walk.
• (0) Severe impairment - Performs task with severe disruption of gait (e.g., stag-
gers 38.1 cm (15 in) outside 30.48-cm (12 in) walkway width, loses balance, stops,
reaches for wall).
5. Gait and pivot
Instructions: Begin with walking at your normal pace. When I tell you, turn and stop, turn
as quickly as you can to face the opposite direction and stop.
Grading: Mark the highest category that applies.
• (3) Normal - Pivot turns safely within 3 seconds and stops quickly with no loss of
balance.
• (2) Mild impairment - Pivot turns safely in 3 seconds and stops with no loss of bal-
ance, or pivot turns safely within 3 seconds and stops with mild imbalance, requires
small steps to catch balance.
• (1) Moderate impairment - Turns slowly, requires verbal cueing, or requires several
small steps to catch balance following turn and stop.
• (0) Severe impairment - Cannot turn safely, requires assistance to turn and stop.
6. Step over obstacle
Instructions: Begin walking at your normal speed. When you come to the shoe box, step
over it, not around it, and keep walking.

61
Grading: Mark the highest category that applies.
• (3) Normal - Is able to step over 2 stacked shoe boxes taped together (22.86 cm (9
in) total height) without changing gait speed; no evidence of imbalance.
• (2) Mild impairment - Is able to step over one shoe box (11.43 cm (4.5 in) total
height) without changing gait speed; no evidence of imbalance.
• (1) Moderate impairment - Is able to step over one shoe box (11.43 cm (4.5 in) total
height) but must slow down and adjust steps to clear box safely. May require verbal
cueing.
• (0) Severe impairment - Cannot perform without assistance.
7. Gait with narrow base of support
Instructions: Walk on the floor with arms folded across the chest, feet aligned heel to toe
in tandem for a distance of 3.6 m (12 ft). The number of steps taken in a straight line are
counted for a maximum of 10 steps.
Grading: Mark the highest category that applies.
• (3) Normal - Is able to ambulate for 10 steps heel to toe with no staggering.
• (2) Mild impairment - Ambulates 7-9 steps.
• (1) Moderate impairment - Ambulates 4 -7 steps.
• (0) Severe impairment - Ambulates less than 4 steps heel to toe or cannot perform
without assistance.
8. Gait with eyes closed
Instructions: Walk at your normal speed from here to the next mark (6 m (20 ft)) with your
eyes closed.
Grading: Mark the highest category that applies.

62
• (3) Normal - Walks 6 m (20 ft), no assistive devices, good speed, no evidence of
imbalance, normal gait pattern, deviates no more than 15.24 cm (6 in) outside
30.48- cm (12-in) walkway width. Ambulates 6 m (20 ft) in less than 7 seconds.
• (2) Mild impairment - Walks 6 m (20 ft), uses assistive device, slower speed, mild
gait deviations, deviates 15.24 -25.4 cm (6 -10 in) outside 30.48-cm (12-in)
walkway width. Ambulates 6 m (20 ft) in less than 9 seconds but greater than 7
seconds.
• (1) Moderate impairment - Walks 6 m (20 ft), slow speed, abnor- mal gait pattern,
evidence for imbalance, deviates 25.4 -38.1 cm (10 -15 in) outside 30.48-cm (12-
in) walkway width. Requires more than 9 seconds to ambulate 6 m (20 ft).
• (0) Severe impairment - Cannot walk 6 m (20 ft) without assistance, severe gait
deviations or imbalance, deviates greater than 38.1 cm (15 in) outside 30.48-cm
(12- in) walkway width or will not attempt task.
9. Ambulating backwards
Instructions: Walk backwards until I tell you to stop.
Grading: Mark the highest category that applies.
• (3) Normal - Walks 6 m (20 ft), no assistive devices, good speed, no evidence for
imbalance, normal gait pattern, deviates no more than 15.24 cm (6 in) outside
30.48- cm (12-in) walkway width.
• (2) Mild impairment - Walks 6 m (20 ft), uses assistive device, slower speed, mild
gait deviations, deviates 15.24 -25.4 cm (6 -10 in) outside 30.48-cm (12-in)
walkway width.
• (1) Moderate impairment - Walks 6 m (20 ft), slow speed, abnor- mal gait pattern,

63
evidence for imbalance, deviates 25.4 -38.1 cm (10 -15 in) outside 30.48-cm (12-
in) walkway width.
• (0) Severe impairment - Cannot walk 6 m (20 ft) without assistance, severe gait
deviations or imbalance, deviates greater than 38.1 cm (15 in) outside 30.48-cm
(12- in) walkway width or will not attempt task.
10. Steps
Instructions: Walk up these stairs as you would at home (i.e., using the rail if necessary).
At the top turn around and walk down.
Grading: Mark the highest category that applies.
• (3) Normal - Alternating feet, no rail.
• (2) Mild impairment - Alternating feet, must use rail.
• (1) Moderate impairment - Two feet to a stair; must use rail.
• (0) Severe impairment - Cannot do safely.

64
APPENDIX B: COPYRIGHT PERMISSION FOR FIGURE 2.7

65


![Artificial Intelligence for Clinical Gait Diagnostics of ... · widely used in gait analysis, given the nonlinearity and high dimensionality of gait data [7], they are only analytical](https://img.pdfslide.net/doc/110x75/5f1a43b39b949336d16040c5/artificial-intelligence-for-clinical-gait-diagnostics-of-widely-used-in-gait.jpg)
![Clinical Study Gait Performance and Lower-Limb Muscle ... · knee extensors, and exors [ , ]. Gait asymmetry has also been negatively related to the residual strength of various muscle](https://img.pdfslide.net/doc/110x75/60b6e9cc49138529c25e11aa/clinical-study-gait-performance-and-lower-limb-muscle-knee-extensors-and-exors.jpg)


![A Study of Gait Analysis with A Smartphone for Measurement ...useful to detect abnormal gait [4]. In our study, we measure “hip joint angle” with a smart-phone placed in a front](https://img.pdfslide.net/doc/110x75/60f69f3660224e083c5e9cf7/a-study-of-gait-analysis-with-a-smartphone-for-measurement-useful-to-detect.jpg)