Embed Size (px)
Citation preview
Health and Safety Executive
A staged approach to reducing musculoskeletal disorders (MSDs) in the workplace A long term followup Prepared by Loughborough University for the Health and Safety Executive 2007
RR545 Research Report
Health and Safety Executive
A staged approach to reducing musculoskeletal disorders (MSDs) in the workplace A long term followup Kate Shaw, Professor Cheryl Haslam & Professor Roger Haslam Department of Human Sciences Loughborough University Loughborough Leicestershire LE11 3TU
Musculoskeletal disorders (MSDs) remain the most common form of occupational illhealth in Great Britain. Recent research by the authors (Whysall, Haslam and Haslam, 2005) involved the development and evaluation of a new and innovative approach to reducing MSDs. These authors applied a model from health psychology (stage of change model) to develop interventions more closely matched to worker and manager stage of change. Twenty four interventions were monitored within a variety of organisations for up to six months. Tailored interventions (matched to stage of change) were found to be more effective in promoting riskawareness, promoting behaviour change aimed at reducing risks, and in reducing selfreported musculoskeletal discomfort in a number of body areas.
The study described in this report involved a longerterm followup at 15 months postintervention and at 20 months postintervention to ascertain whether the improvements seen at 6 months persist in the longer term. The results show that the benefits in behaviour change and symptom reduction persist over a longer period of followup. Tailored interventions were found to be more effective in promoting behaviour change and reducing selfreported musculoskeletal discomfort over a 20 month followup period.
These findings suggest that scope exists for improving the success of interventions by tailoring advice according to stage of change. This approach increases the uptake, implementation, and maintenance of riskreducing measures.
This report and the work it describes were funded by the Health and Safety Executive (HSE). Its contents, including any opinions and/or conclusions expressed, are those of the authors alone and do not necessarily reflect HSE policy.
HSE Books

© Crown copyright 2007
First published 2007
All rights reserved. No part of this publication may bereproduced, stored in a retrieval system, or transmitted inany form or by any means (electronic, mechanical,photocopying, recording or otherwise) without the priorwritten permission of the copyright owner.
Applications for reproduction should be made in writing to:Licensing Division, Her Majesty’s Stationery Office,St Clements House, 216 Colegate, Norwich NR3 1BQor by email to hmsolicensing@cabinetoffice.x.gsi.gov.uk
ii

ACKNOWLEDGEMENTS
We would like to thank the organisations that took part in this research for kindly providing us with access to their workplaces, and to the employees within these organisations for their time and their useful comments.
We would also like to thank our HSE colleagues Pauline Stenhouse, Peter Kelly and Sue Brandrick for their support, guidance and encouragement throughout the project.
iii

iv
CONTENTS
EXECUTIVE SUMMARY……………………………………………………………… vii
1 INTRODUCTION…………………………………………………………………... 11.1 Objectives……………………………………………………………………… 41.2 Research approach……………………………………………………………... 41.3 Report format…………………………………………………………………... 4
2 METHOD…………………………………………………………………………… 52.1 Research instruments ………………………………………………………… 62.2 Sample ………………………………..………………………..……………... 62.3 Analysis………………………………………………………………………... 6
3 STANDARD INTERVENTIONS…………………………………………………. 113.1 Results: 15 months post-intervention - Workers……………………………… 113.2 Results: 15 months post-intervention - Managers…………………………… 153.3 Results: 20 months post-intervention - Workers …………………………… 163.4 Results: 20 months post-intervention - Managers…………………………… 21
4 TAILORED INTERVENTIONS…….…………………………………………...... 224.1 Results: 15 months post-intervention - Workers ……………………………… 224.2 Results: 15 months post-intervention - Managers……………………………... 284.3 Results: 20 months post-intervention - Workers …………………………….... 294.4 Results: 20 months post-intervention - Managers……………………………... 36
5 MANAGERIAL INTERVIEWS…………………………………………………… 375.1 Participant characteristics……………………………………………………… 375.2 Barriers to change…………………………………………………….………... 375.3 Factors facilitating the change process ……………………………………….…37 5.4 Outcomes of the intervention …………………..…………………………….…37
6 SUMMARY AND CONCLUSIONS……………………………………………….. 406.1 Standard interventions ………………………………………………………... 406.2 Tailored interventions………………………………………………………… 406.3 Manager interviews………………………………………………………...…. 416.4 Implications for theory and practice………………………………………….. 416.5 Conclusions…………………………………………………………………… 43
7 REFERENCES……………..………………………………………………………… 44-45
APPENDICES…………………………………………………………………………… 46-65
v

vi

EXECUTIVE SUMMARY
PROJECT AIMS
For over a decade musculoskeletal disorders (MSDs) have remained the most common cause of work-related ill health in Great Britain, presenting substantial costs to individual sufferers, employers, and health service providers alike. This raises the question as to why prevalence rates remain high in spite of ongoing attempts to tackle MSDs, and how interventions to reduce MSDs can be made more effective.
Behaviour is a crucial factor in the reduction of many of today’s most widespread diseases and health problems, including MSDs. Most interventions aimed at reducing MSDs focus on the physical aspects of the work environment and the job task, rather than tackling ‘psychological’ factors such as risk perception or management commitment. Such an approach overlooks important psychosocial influences, which have been found to be associated with MSDs.
Recent research by the authors (Whysall, Haslam and Haslam, 2005) attempted to improve the efficacy of interventions by applying the stage of change model to the workplace. The stage of change model acknowledges the importance of addressing attitudes in order to achieve behaviour change, and assumes that any behaviour change involves movement through distinct stages:
i) precontemplation (resistance to recognising or modifying problem behaviour) ii) contemplation (recognition of the problem, thinking about changing, but not
ready to act) iii) preparation (intending to change in the next 30 days, and/or having made specific
plans to do so)iv) action (having engaged in behaviour change, no longer than 6 months ago)v) maintenance (initiated changes over 6 months ago, working to consolidate gains
made and avoid relapse)
According to the model, an individual’s stage determines their receptiveness to, and the likely efficacy of, particular methods of education. In the precontemplation stage individuals are more influenced by graphic information about the health risks, whereas skills training or practical advice is more effective in promoting change among those in the preparation stage.
Whysall, Haslam and Haslam (2005) developed new tools to measure organisational and worker stage of change with respect to MSDs and then used these tools to develop interventions tailored to manager and worker stage of change. The effectiveness of tailored compared to standard interventions was measured on a variety of levels, including stage of change and self-reported musculoskeletal discomfort. Evaluations were conducted 6 months after the implementation of the interventions. Tailored interventions were significantly more effective in promoting risk-awareness; promoting progression through the stages of change; promoting behaviour change and reducing self-reported musculoskeletal discomfort in a number of body areas.
15 AND 20 MONTHS POST-INTERVENTION
To determine if the positive findings seen at 6 months persist over the long term, the authors conducted a longer-term follow-up of the interventions at 15 months post-intervention and at 20 months post-intervention. The effectiveness of tailored compared to standard interventions was measured in terms of: stage of change and self-reported musculoskeletal discomfort.
vii
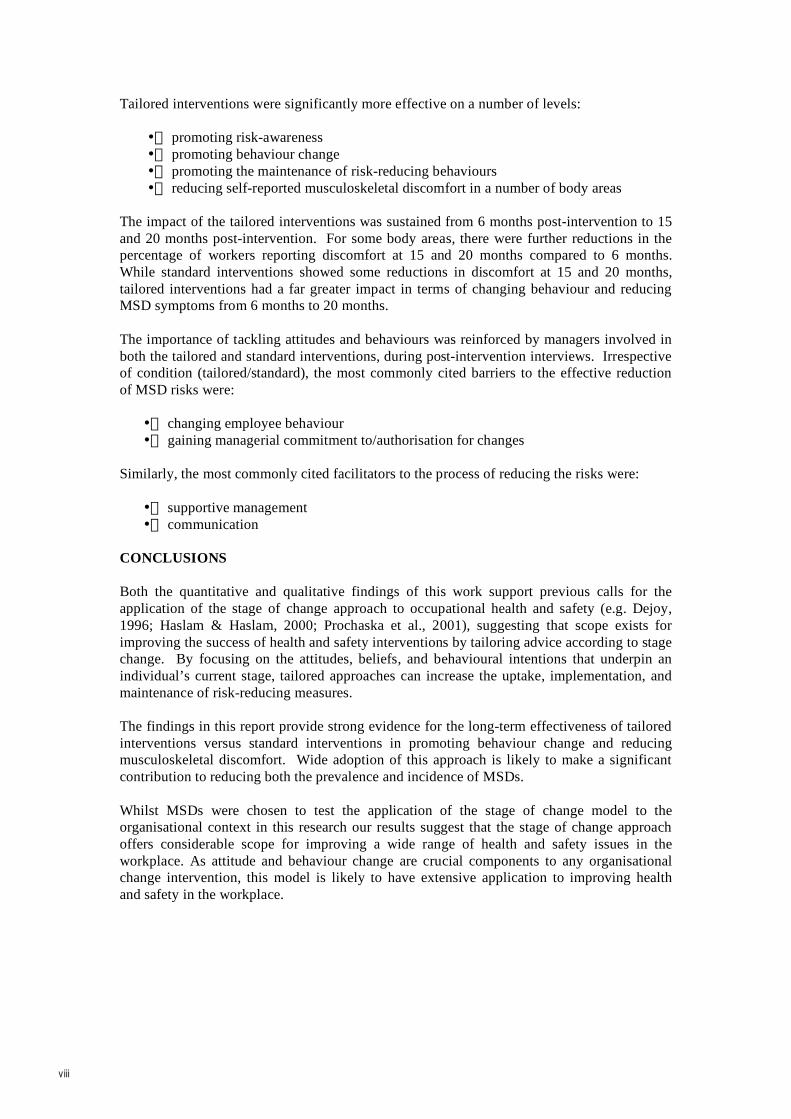
Tailored interventions were significantly more effective on a number of levels:
• promoting risk-awareness • promoting behaviour change • promoting the maintenance of risk-reducing behaviours • reducing self-reported musculoskeletal discomfort in a number of body areas
The impact of the tailored interventions was sustained from 6 months post-intervention to 15 and 20 months post-intervention. For some body areas, there were further reductions in the percentage of workers reporting discomfort at 15 and 20 months compared to 6 months. While standard interventions showed some reductions in discomfort at 15 and 20 months, tailored interventions had a far greater impact in terms of changing behaviour and reducing MSD symptoms from 6 months to 20 months.
The importance of tackling attitudes and behaviours was reinforced by managers involved in both the tailored and standard interventions, during post-intervention interviews. Irrespective of condition (tailored/standard), the most commonly cited barriers to the effective reduction of MSD risks were:
• changing employee behaviour • gaining managerial commitment to/authorisation for changes
Similarly, the most commonly cited facilitators to the process of reducing the risks were:
• supportive management • communication
CONCLUSIONS
Both the quantitative and qualitative findings of this work support previous calls for the application of the stage of change approach to occupational health and safety (e.g. Dejoy, 1996; Haslam & Haslam, 2000; Prochaska et al., 2001), suggesting that scope exists for improving the success of health and safety interventions by tailoring advice according to stage change. By focusing on the attitudes, beliefs, and behavioural intentions that underpin an individual’s current stage, tailored approaches can increase the uptake, implementation, and maintenance of risk-reducing measures.
The findings in this report provide strong evidence for the long-term effectiveness of tailored interventions versus standard interventions in promoting behaviour change and reducing musculoskeletal discomfort. Wide adoption of this approach is likely to make a significant contribution to reducing both the prevalence and incidence of MSDs.
Whilst MSDs were chosen to test the application of the stage of change model to the organisational context in this research our results suggest that the stage of change approach offers considerable scope for improving a wide range of health and safety issues in the workplace. As attitude and behaviour change are crucial components to any organisational change intervention, this model is likely to have extensive application to improving health and safety in the workplace.
viii
1 INTRODUCTION
Musculoskeletal disorders (MSDs) are consistently the most commonly reported type of work-related ill health in Great Britain according to national surveys of self-reported work-related illness (Health & Safety Commission - HSC, 2005; 2004; 2001; 2000). In 2004/2005 over a million people experienced symptoms that they felt were caused or made worse by their work (HSC, 2005).
Despite numerous attempts to manage the problem including changing work methods, the use of personal protective equipment and engineering redesigns, MSDs still remain highly prevalent (Karsh et al., 2001). Additionally, studies into the effectiveness of interventions aiming to tackle MSDs have yielded mixed results. For instance, Melhorn, (1996) found that posture training showed positive results whereas the use of a new tool or exercise training did not show any positive effects. The methodology of a number of intervention studies has come under scrutiny. Westguard and Winkel (1997) reviewed 92 studies of ergonomic interventions and concluded that many were methodologically flawed. For instance, many studies lacked control groups and had insufficient delays between intervention and follow up.
A possible explanation for the documented inconsistency of ergonomics interventions may lie in the variability of the intervention process itself. Indeed, HSE (2002) highlighted the importance of the intervention process, and proposed a seven staged cycle for the management of MSDs (specifically focusing on upper limb disorders – ULDs):
1. Understand the issues and commit to action 2. Create the right organisational environment 3. Assess the risk of ULDs in the workplace 4. Reduce the risks of ULDs 5. Educate and inform the workforce 6. Manage any episodes of ULDs 7. Carry out regular checks on programme effectiveness
Current interventions to reduce MSDs focus largely on the physical aspects of the work, tending to overlook the more ‘psychological’ aspects of the interaction between the worker and their environment (Whysall et al., 2004). Such an approach is at odds with both practical recommendations and the principles of behaviour change theory. In terms of practical recommendations, for example, the World Health Organisation (1988) recommended that ergonomic improvements to reduce the risks of MSDs should be combined with health promotion activities aimed at modifying behaviour. Similarly, HSE proposed that effective management of MSDs requires not only reducing the physical risks in the workplace, but also efforts to educate and inform the workforce. This suggests that current organisational attempts to reduce MSDs are unsuccessful due to a failure to take into account the psychology of change.
There is growing awareness that theoretical models of health related behaviour might be useful in improving health and safety at work. Whilst many models of health related behaviour have been proposed, the Stage of Change approach (Prochaska & DiClemente, 1982); has been highlighted as particularly beneficial for application in this context (e.g. Dejoy, 1996; Haslam & Haslam; 2000; Prochaska et al., 2001). Used extensively in connection with health behaviours such as drinking, smoking, and exercise, the stage of change model centres around the change process itself, emphasising the importance of ensuring that interventions are tailored according to recipients’ readiness to change (DiClemente et al., 1991).
1

Consistent with the notion that individuals’ behaviours are strongly determined by their knowledge and attitudes, Prochaska and DiClemente maintain that a crucial, yet frequently overlooked step in reducing health risks is to ensure that the individuals concerned perceive the health issue to be a genuine risk. In terms of MSDs, it can be seen that managers are unlikely to implement changes, or employees to adopt changes to their working practices, unless they are genuinely concerned about the issue. Individuals who are unconcerned about the risks, and are not considering taking action to reduce the risks, are considered to be in the ‘precontemplation’ stage. According to the stage of change model, precontemplation is the first in a series of distinct stages through which behaviour change progresses:
vi) precontemplation (resistance to recognising or modifying problem behaviour) vii) contemplation (recognition of the problem, thinking about changing, but not
ready to act) viii) preparation (intending to change in the next 30 days, and/or having made specific
plans to do so) ix) action (having engaged in behaviour change, no longer than 6 months ago) x) maintenance (initiated changes over 6 months ago, working to consolidate gains
made and avoid relapse)
action
maintenance
relapse contemplation
preparation
stable healthy behaviour
precontemplation
Figure 1 Stage of change (Prochaska & DiClemente, 1982)
The model has implications for promoting change in practice, as each stage has been found to be dominated by specific types of underpinning attitudes, beliefs and intentions regarding the
2
health issue. The key constructs believed to influence movement between stages being decisional balance (Velicier et al., 1985) and habit strength (Velicier et al., 1990). Decisional balance reflects an individual’s weighing up of the pros and cons of changing. With smoking, for example, in precontemplation the pros of smoking outweigh the cons, but a crossover occurs in the contemplation stage, where the cons of smoking become equal to the pros. In the case of MSDs, therefore, a precontemplative construction worker, for example, may feel that the benefits of saving time by carrying two bags of cement at a time outweigh the possible risk of injury (despite the introduction of a weight limit on cement bags in order to protect workers). A worker who is contemplative, on the other hand, may begin to realise that the time saved by carrying two bags of cement is not worth the potential body damage caused. As individuals progress into the more advanced stages of change, the cons then begin to outweigh the pros of the risky behaviour.
This crossover effect has been observed in relation to 12 different health-related behaviours (Prochaska et al., 1994). Habit strength tends to be initially high in the precontemplation stage, but gradually weakens with progression through the stages. As a result, due to the varying dominance of these concepts over time, an individual’s stage of change determines their receptiveness to (and, consequentially, the effectiveness of) health information aimed at promoting behaviour change. In the precontemplation stage, for instance, individuals are more influenced by graphic information about the health risks, whereas skills training or practical advice is more effective in promoting change among those in the preparation stage. In the maintenance stage, emphasis should be placed on the need to remain vigilant to the risks, and to establish systems of monitoring and feedback. Research adopting the model has shown that stage matched interventions increase the likelihood that individuals will take action (e.g. Prochaska et al., 1993; Rakowski et al., 1998).
Despite the intuitive relevance of the stage of change approach to the organisational context, attempts to apply the approach in practice have been limited. Urlings et al. (1990) provided some support for the benefits the application of such an approach might hold for organisational interventions. Urlings et al. explored the feasibility of adopting a staged approach to promote the introduction of standing aids into the Dutch furniture industry, although did not actually evaluate the implementation of such an approach. Furthermore, consisting of a single case study, these findings have limited use in terms of broader application.
Whysall, Haslam and Haslam (2005) developed new tools to measure organisational and worker stage of change with respect to MSDs and then used these tools to develop interventions tailored to manager and worker stage of change. Tools were developed to assess both organisational and individual worker stage of change regarding work-related MSDs, and administered to personnel within a wide range of organisations. The stage of change approach was then tested in practice, by monitoring 24 interventions aimed at reducing the risks of MSDs, and in half of these cases attempting to improve intervention effectiveness by tailoring interventions according to both worker and organisational stage of change. Evaluations of tailored versus standard interventions at 6 months post-intervention found tailored interventions to be more effective on a number of levels: promoting risk-awareness, promoting progression through stages of change and reducing self reported musculoskeletal discomfort in a number of body areas.
The aim of the current research, therefore, was to determine whether these positive findings persist over a longer period of time. The study followed up the organisations at 15 and 20 months after the initial implementation of interventions.
3
1.1 OBJECTIVES
The objectives of this project were to:
provide a longitudinal evaluation of the effectiveness of tailored interventions compared to non-tailored interventions
provide longitudinal case studies demonstrating the process of change and organisational experiences
generate in depth data establishing the factors that enhance or inhibit positive behaviour change in organisations
1.2 RESEARCH APPROACH
A combination of research methods were used to achieve these objectives, including quantitative and qualitative elements. A number of post-intervention measures were taken within each case study organisation including:
Employee survey Managerial survey Semi-structured interviews with managers
1.3 REPORT FORMAT
The report is divided into sections as follows:
Section 2 - Method
Section 3 – Standard interventions* Results: 15 months post-intervention Results: 20 months post-intervention
Section 4 – Tailored interventions* Results: 15 months post-intervention Results: 20 months post-intervention
Section 5 – Managerial interviews
Section 6 - Summary and conclusions Overview of findings Implications for theory and practice Conclusions
* Results sections report movement through stages of change, proportions of workers experiencing MSD discomfort and severity of discomfort (general attitudinal data relating to MSDs among the workforce and managers is presented in tables in Appendix 6).
4

2 METHOD
The first phase of the research is reported in full in the previous HSE report (Whysall, Haslam and Haslam, 2005). It involved pre- and post-intervention monitoring of 24 workplace interventions aimed at reducing the risks of work-related MSDs (see figure 2). These interventions were carried out in a range of sectors: manufacturing, delivery/logistics, education, healthcare, engineering, construction, printing and fire/rescue service. A number of pre- and post-intervention measures were taken within each case study organisation, namely:
Observation of working practices Employee survey Managerial survey Semi-structured interviews with managers (post-intervention)
In approximately half of the cases, organisations were provided with pre-intervention information and advice on how to tailor their interventions according to both managerial and worker stage of change. For example, in cases where managers and/or workers were identified as being in the precontemplation stage, the organisation was advised of the importance to first educate and promote risk awareness among both of these groups of individuals, by highlighting the detrimental effects of MSDs. In order to do this effectively, emphasis was placed on the need for this information to be specifically targeted to the primary concerns of these two different groups (i.e. managers and workers):
Managerial concerns Workers’ concerns - Reduced productivity - MSD discomfort - Reduced product/service quality - Numbness, tingling - Employee suffering - Temporary or permanent - Damage to company reputation disability - Increased absence - Lost time from work - Early retirement through ill health - Loss of earnings - Increased turnover - Treatment/healthcare costs - Higher recruitment and training costs - Compensation claims - Increased insurance premiums
Health promotion materials were developed to assist organisations in this task, including leaflets, posters, presentations, and CD-ROMs. Further details on the tailoring process are presented in Appendix 6.
- -Pre intervention monitoring:
24 interventions
Standard interventions
Tailored interventions
Tailoring advice
Postintervention monitoring
Figure 2 Implementation phase overview
5
Interventions were initially evaluated at 6 months post-intervention. The follow-up research (reported here) repeated evaluations at 15 months and at 20 months post-intervention.
2.1 Research instruments The organisational and worker surveys used comprised three sections below as used in the Whysall, Haslam and Haslam (2005) research:
demographic characteristics and background information (e.g. company size, role of the respondent, tenure)
stage of change assessment (appendix 2) attitudes toward reducing MSDs (appendix 5)
The worker survey included an additional sections:
musculoskeletal discomfort experienced in the previous 7 days discomfort rating (appendix 4)
2.2 Sample A total of 16 case study interventions were monitored at 15 months post-intervention (8 tailored and 8 standard). Not all of the original interventions could be followed-up due to companies no longer being in existence or a return visit not being possible at the time of the study. A total of 13 interventions were followed up at 20 months post-intervention (6 tailored and 7 standard interventions. This was due to one company going into administration and two companies not being available at the time of the 20 month follow up. To boost the sample at follow-up, as well as administering checklists to employees who took part in the research previously, checklists where administered to people who were previously involved in the interventions but who did not previously take part in the survey. Both the worker and managerial checklists included a background information sheet to establish whether the participants had previously participated in the research (appendix 3).
2.3 Analysis Descriptive statistics were used to identify the distribution of organisations and workers across the stages of change and workers’ reported discomfort. Chi-square tests were used to identify significant differences in stage of change after the implementation of interventions and to identify significant differences in the number of people experiencing discomfort. In addition to analysing individual body areas, body areas were categorised into the upper limb, lower limb area (legs) and back. Kruskall Wallis tests were used to identify significant differences in workers’ severity ratings.
In comparing the pre-intervention and post-intervention data at 15 months, the analysis considered only those 16 organisations involved at pre-intervention, 6 months post-intervention and 15 months intervention. In comparing the pre-intervention and post-intervention data at 20 months, the analysis considered only those 13 organisations involved at pre-intervention, 6 months post-intervention, 15 months intervention and 20 months post-intervention.
Transcribed data from post-intervention interviews with managers were analysed using the structured method outlined by Miles and Huberman (1994). The data under each theme was summarised and verbatim quotes used to illustrate the theme being described.
Organisational details relating to each case study are shown in table 1. Details of the interventions are shown in table 2. Appendix 6 lists stages of change and explains how information is tailored to the stages.
6
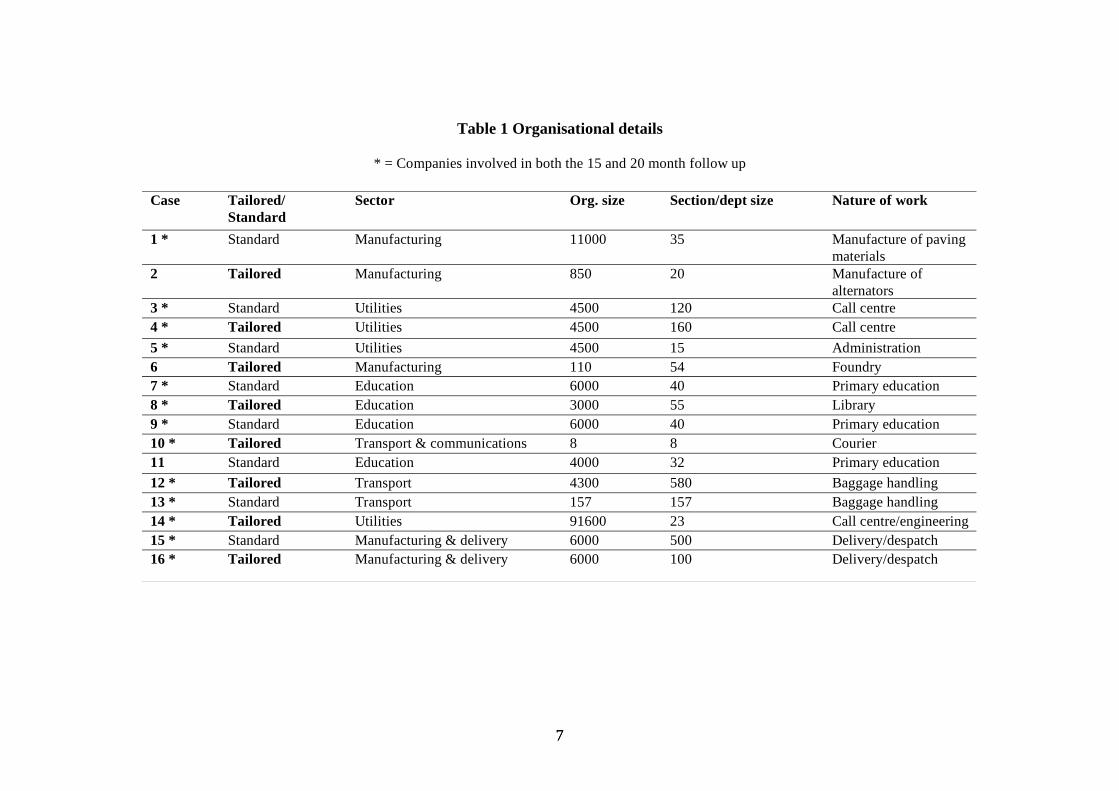
Table 1 Organisational details
* = Companies involved in both the 15 and 20 month follow up
Case Tailored/ Sector Org. size Section/dept size Nature of work Standard
1 * Standard Manufacturing 11000 35 Manufacture of paving materials
2 Tailored Manufacturing 850 20 Manufacture of alternators
3 * Standard Utilities 4500 120 Call centre 4 * Tailored Utilities 4500 160 Call centre 5 * Standard Utilities 4500 15 Administration 6 Tailored Manufacturing 110 54 Foundry 7 * Standard Education 6000 40 Primary education 8 * Tailored Education 3000 55 Library 9 * Standard Education 6000 40 Primary education 10 * Tailored Transport & communications 8 8 Courier 11 Standard Education 4000 32 Primary education 12 * Tailored Transport 4300 580 Baggage handling 13 * Standard Transport 157 157 Baggage handling 14 * Tailored Utilities 91600 23 Call centre/engineering 15 * Standard Manufacturing & delivery 6000 500 Delivery/despatch 16 * Tailored Manufacturing & delivery 6000 100 Delivery/despatch
77

Table 2 Intervention details
* = Companies involved in both the 15 and 20 month follow up
Case Tailored/ Standard
Intervention details
1 * Standard Changes introduced: Monthly ‘toolbox talks’ on specific safety issues, health and safety inductions, health screening for new staff, return to work interviews following absence, monthly safety improvement team meetings (employee representatives and management), reduction in shift length, near miss reporting system, improved staff facilities (canteen, showers, staff room), resurfacing of yard, stock rotation system (reducing the need for manual handling of stock).
2 Tailored Workers were in the preparation stage, and so feedback was given regarding changes that would help reduce the risks. Managers and supervisors were in the action stage, and so advice was provided on the importance of maintaining efforts to reduce the risks by developing systems for ongoing monitoring and feedback. Changes introduced: Job rotation, powered wire cutters, tool balancer, low impact hammers, and advice regarding improved working postures. An ergonomics issues board was introduced into the workshop, providing information on MSDs such as symptoms to look out for, and minutes from safety meetings to inform employees of intended actions and to generate feedback.
3 * Standard Changes introduced: Introduction of interactive web-based training package available for employees’ ongoing use from their own work stations, educating employees about how to assess their own areas for risks, and the types of changes that can help to reduce the risks.
4 * Tailored The majority of employees were precontemplative, either because they were unconcerned about the risks, or because they had taken steps to reduce the risks, but felt that no further attention to the issue was necessary. The call centre manager was in the maintenance stage. Advice was given regarding the importance of highlighting ensuring that all workers appreciated the risks of MSDs, and the need for employees to remain vigilant to the risks once action has been taken. To facilitate this, information was provided regarding MSDs and the potential detrimental effects for workers (in terms of factors such as pain, discomfort, absence, and lost earnings). Changes introduced: Introduction of interactive web-based training package available for employees’ ongoing use from their own work stations, educating employees about how to assess their own areas for risks, and the types of changes that can help to reduce the risks.
88
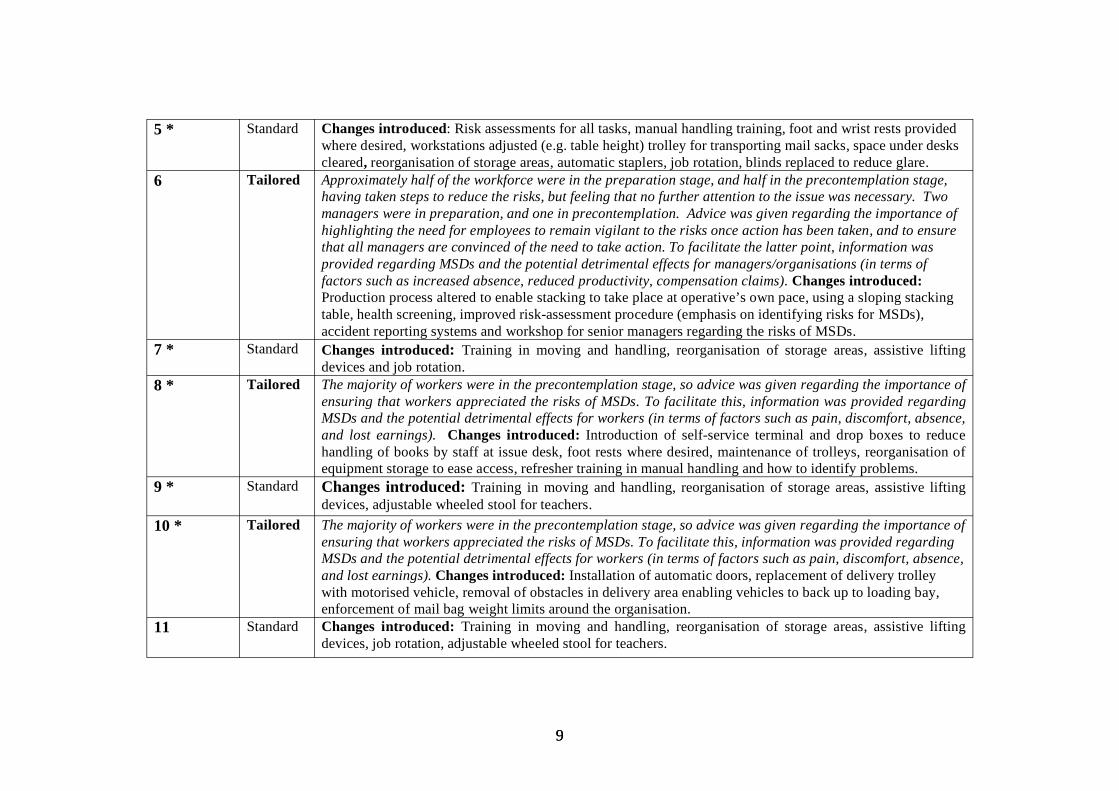
5 * Standard Changes introduced: Risk assessments for all tasks, manual handling training, foot and wrist rests provided where desired, workstations adjusted (e.g. table height) trolley for transporting mail sacks, space under desks cleared, reorganisation of storage areas, automatic staplers, job rotation, blinds replaced to reduce glare.
6 Tailored Approximately half of the workforce were in the preparation stage, and half in the precontemplation stage, having taken steps to reduce the risks, but feeling that no further attention to the issue was necessary. Two managers were in preparation, and one in precontemplation. Advice was given regarding the importance of highlighting the need for employees to remain vigilant to the risks once action has been taken, and to ensure that all managers are convinced of the need to take action. To facilitate the latter point, information was provided regarding MSDs and the potential detrimental effects for managers/organisations (in terms of factors such as increased absence, reduced productivity, compensation claims). Changes introduced: Production process altered to enable stacking to take place at operative’s own pace, using a sloping stacking table, health screening, improved risk-assessment procedure (emphasis on identifying risks for MSDs), accident reporting systems and workshop for senior managers regarding the risks of MSDs.
7 * Standard Changes introduced: Training in moving and handling, reorganisation of storage areas, assistive lifting devices and job rotation.
8 * Tailored The majority of workers were in the precontemplation stage, so advice was given regarding the importance of ensuring that workers appreciated the risks of MSDs. To facilitate this, information was provided regarding MSDs and the potential detrimental effects for workers (in terms of factors such as pain, discomfort, absence, and lost earnings). Changes introduced: Introduction of self-service terminal and drop boxes to reduce handling of books by staff at issue desk, foot rests where desired, maintenance of trolleys, reorganisation of equipment storage to ease access, refresher training in manual handling and how to identify problems.
9 * Standard Changes introduced: Training in moving and handling, reorganisation of storage areas, assistive lifting devices, adjustable wheeled stool for teachers.
10 * Tailored The majority of workers were in the precontemplation stage, so advice was given regarding the importance of ensuring that workers appreciated the risks of MSDs. To facilitate this, information was provided regarding MSDs and the potential detrimental effects for workers (in terms of factors such as pain, discomfort, absence, and lost earnings). Changes introduced: Installation of automatic doors, replacement of delivery trolley with motorised vehicle, removal of obstacles in delivery area enabling vehicles to back up to loading bay, enforcement of mail bag weight limits around the organisation.
11 Standard Changes introduced: Training in moving and handling, reorganisation of storage areas, assistive lifting devices, job rotation, adjustable wheeled stool for teachers.
99
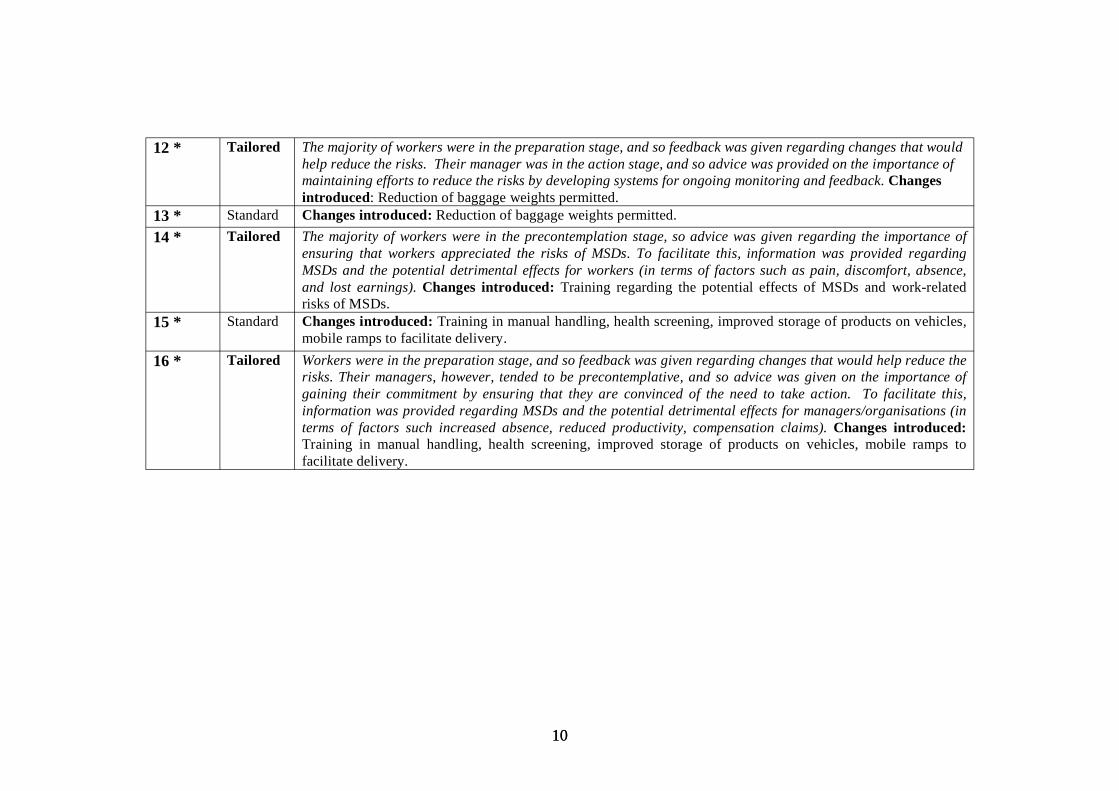
12 * Tailored The majority of workers were in the preparation stage, and so feedback was given regarding changes that would help reduce the risks. Their manager was in the action stage, and so advice was provided on the importance of maintaining efforts to reduce the risks by developing systems for ongoing monitoring and feedback. Changes introduced: Reduction of baggage weights permitted.
13 * Standard Changes introduced: Reduction of baggage weights permitted. 14 * Tailored The majority of workers were in the precontemplation stage, so advice was given regarding the importance of
ensuring that workers appreciated the risks of MSDs. To facilitate this, information was provided regarding MSDs and the potential detrimental effects for workers (in terms of factors such as pain, discomfort, absence, and lost earnings). Changes introduced: Training regarding the potential effects of MSDs and work-related risks of MSDs.
15 * Standard Changes introduced: Training in manual handling, health screening, improved storage of products on vehicles, mobile ramps to facilitate delivery.
16 * Tailored Workers were in the preparation stage, and so feedback was given regarding changes that would help reduce the risks. Their managers, however, tended to be precontemplative, and so advice was given on the importance of gaining their commitment by ensuring that they are convinced of the need to take action. To facilitate this, information was provided regarding MSDs and the potential detrimental effects for managers/organisations (in terms of factors such increased absence, reduced productivity, compensation claims). Changes introduced: Training in manual handling, health screening, improved storage of products on vehicles, mobile ramps to facilitate delivery.
1010
SECTION 3 – STANDARD INTERVENTIONS
3.1 RESULTS – 15 MONTHS POST-INTERVENTION - WORKERS
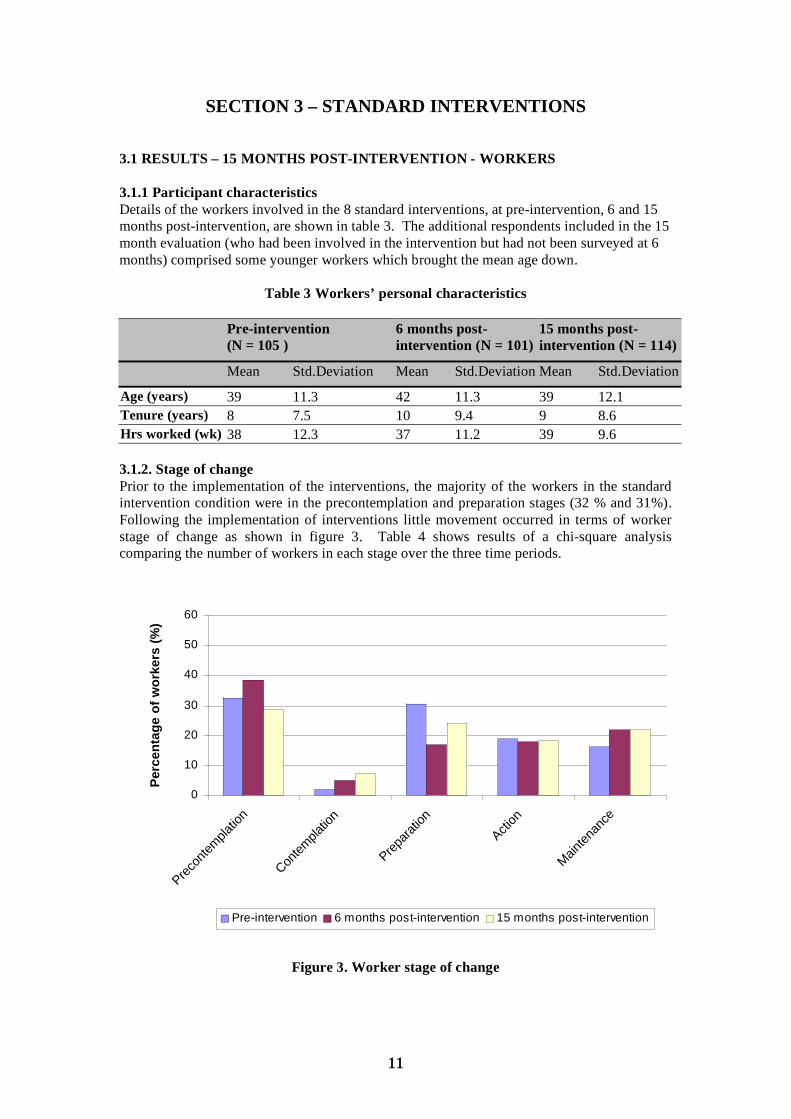
3.1.1 Participant characteristics Details of the workers involved in the 8 standard interventions, at pre-intervention, 6 and 15 months post-intervention, are shown in table 3. The additional respondents included in the 15 month evaluation (who had been involved in the intervention but had not been surveyed at 6 months) comprised some younger workers which brought the mean age down.
Table 3 Workers’ personal characteristics
Pre-intervention (N = 105 )
Mean Std.Deviation
6 months post-intervention (N = 101)
15 months post-intervention (N = 114)
Mean Std.Deviation Mean Std.Deviation
Age (years) 39 11.3 42 11.3 39 12.1 Tenure (years) 8 7.5 10 9.4 9 8.6 Hrs worked (wk) 38 12.3 37 11.2 39 9.6
3.1.2. Stage of change Prior to the implementation of the interventions, the majority of the workers in the standard intervention condition were in the precontemplation and preparation stages (32 % and 31%). Following the implementation of interventions little movement occurred in terms of worker stage of change as shown in figure 3. Table 4 shows results of a chi-square analysis comparing the number of workers in each stage over the three time periods.
0
10
20
30
40
50
60
Precon
templa
tion
Contem
platio
n
Prepara
tion
Action
Mainten
ance
Pe
rce
nta
ge
of
wo
rke
rs (
%)
Pre-intervention 6 months post-intervention 15 months post-intervention
Figure 3. Worker stage of change
1111
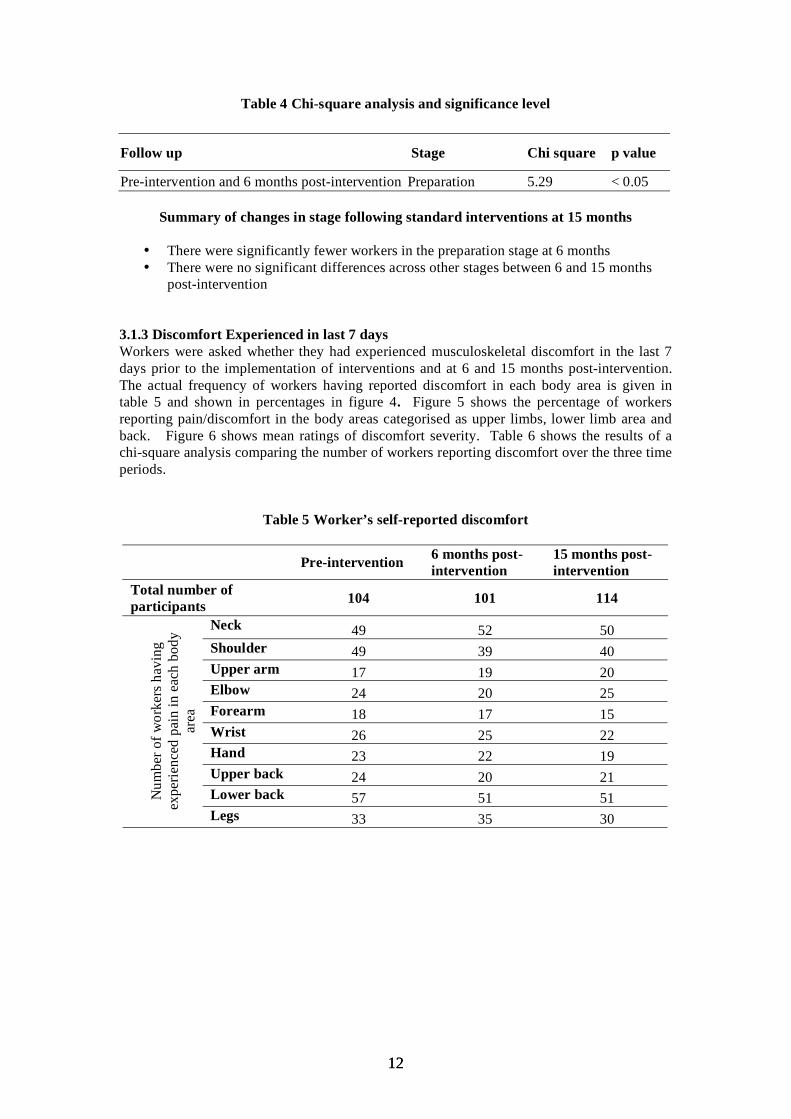
Table 4 Chi-square analysis and significance level
Follow up Stage Chi square p value
Pre-intervention and 6 months post-intervention Preparation 5.29 < 0.05
Summary of changes in stage following standard interventions at 15 months
• There were significantly fewer workers in the preparation stage at 6 months • There were no significant differences across other stages between 6 and 15 months
post-intervention
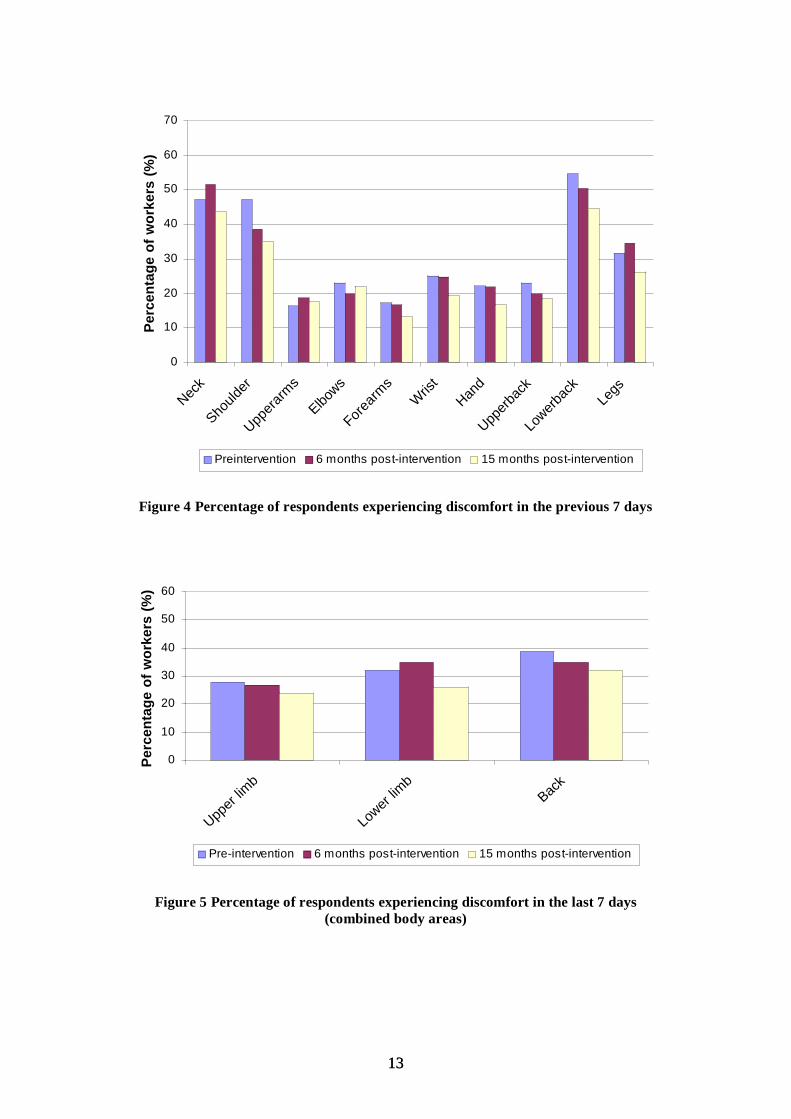
3.1.3 Discomfort Experienced in last 7 days Workers were asked whether they had experienced musculoskeletal discomfort in the last 7 days prior to the implementation of interventions and at 6 and 15 months post-intervention. The actual frequency of workers having reported discomfort in each body area is given in table 5 and shown in percentages in figure 4. Figure 5 shows the percentage of workers reporting pain/discomfort in the body areas categorised as upper limbs, lower limb area and back. Figure 6 shows mean ratings of discomfort severity. Table 6 shows the results of a chi-square analysis comparing the number of workers reporting discomfort over the three time periods.
Table 5 Worker’s self-reported discomfort
Pre-intervention 6 months post- 15 months post-intervention intervention
Total number of participants 104 101 114
Num
ber o
f wor
kers
hav
ing
expe
rienc
ed p
ain
in e
ach
body
ar
ea
Neck 49 52 50 Shoulder 49 39 40 Upper arm 17 19 20 Elbow 24 20 25 Forearm 18 17 15 Wrist 26 25 22 Hand 23 22 19 Upper back 24 20 21 Lower back 57 51 51 Legs 33 35 30
1212
0
10
20
30
40
50
60
70
Neck
Should
er
Uppera
rms
Elbows
Forearm
sW
rist
Hand
Upperb
ack
Lowerb
ack
Legs
Pe
rce
nta
ge
of
wo
rke
rs (
%)
Preintervention 6 months post-intervention 15 months post-intervention
Figure 4 Percentage of respondents experiencing discomfort in the previous 7 days
0
10
20
30
40
50
60
Upper
limb
Lower
limb
Back
Pe
rce
nta
ge
of
wo
rke
rs (
%)
Pre-intervention 6 months post-intervention 15 months post-intervention
Figure 5 Percentage of respondents experiencing discomfort in the last 7 days (combined body areas)
1313
01234567
Neck
Should
er
Uppera
rms
Elbows
Forearm
s
Wris
t Han
d
Upperb
ack
Lowerb
ack
Legs
Dis
co
mfo
rt s
ev
eri
ty r
ati
ng
Pre-intervention 6 months post-intervention 15 months post-intervention
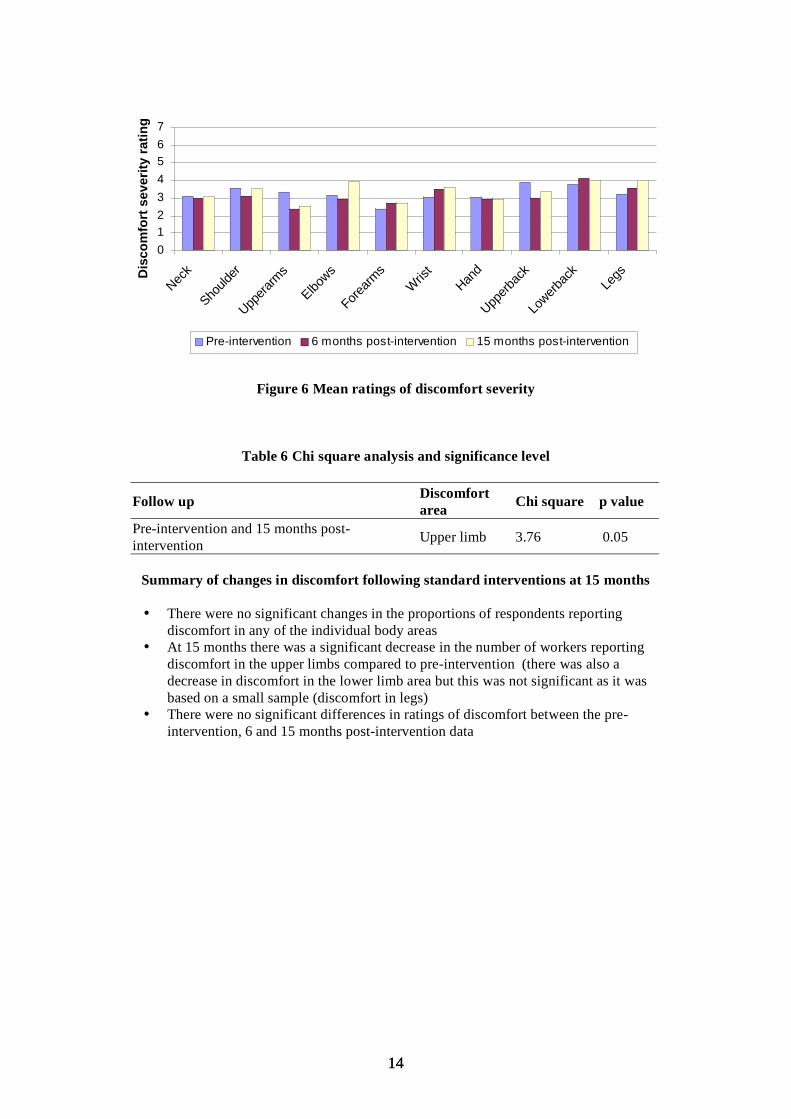
Figure 6 Mean ratings of discomfort severity
Table 6 Chi square analysis and significance level
Follow upDiscomfort Chi square p value area
Pre-intervention and 15 months post- Upper limb 3.76 0.05intervention
Summary of changes in discomfort following standard interventions at 15 months
• There were no significant changes in the proportions of respondents reporting discomfort in any of the individual body areas
• At 15 months there was a significant decrease in the number of workers reporting discomfort in the upper limbs compared to pre-intervention (there was also a decrease in discomfort in the lower limb area but this was not significant as it was based on a small sample (discomfort in legs)
• There were no significant differences in ratings of discomfort between the pre-intervention, 6 and 15 months post-intervention data
1414
3.2 RESULTS - 15 MONTHS POST-INTERVENTION - MANAGERS
3.2.1 Participant characteristics In the standard intervention condition, 16 managers participated in the pre-intervention survey. At 6 months post-intervention 10 managers completed the survey and at 15 months intervention 16 managers completed the survey.
Whilst managers’ responses were crucial to the tailoring of interventions, due to the relatively small numbers of managers, care must be taken in interpreting these results as generalisable to the broader managerial population.
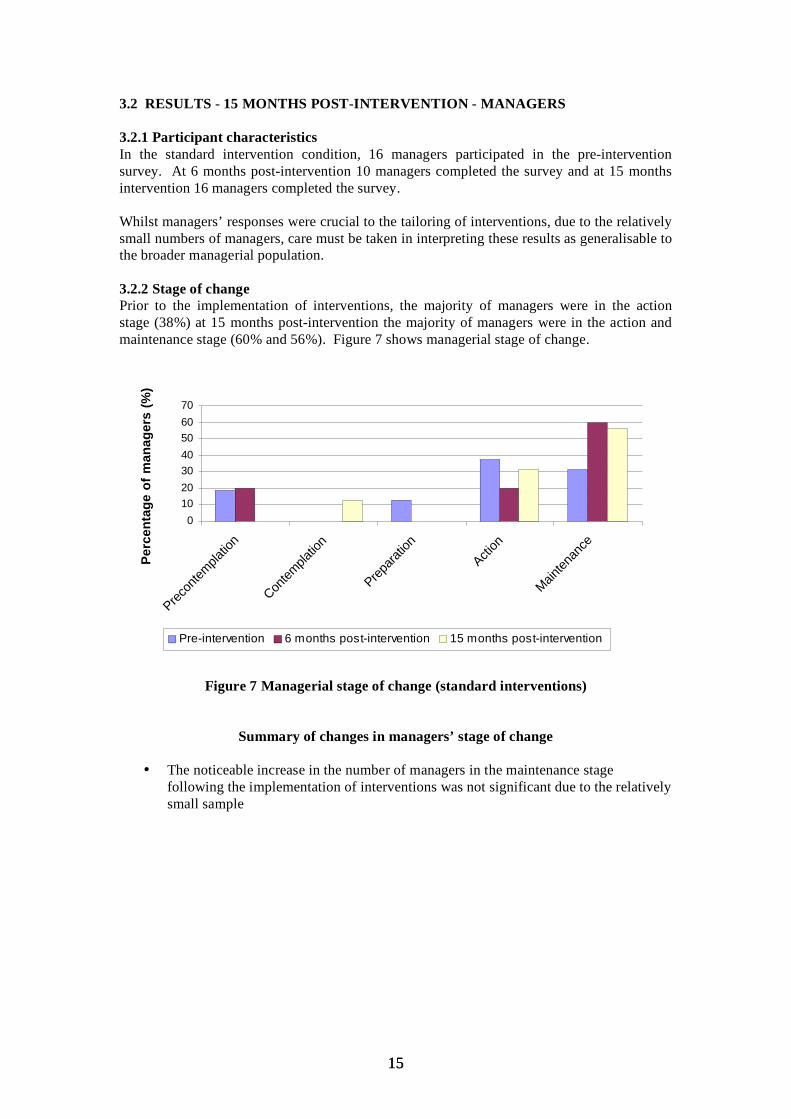
3.2.2 Stage of change Prior to the implementation of interventions, the majority of managers were in the action stage (38%) at 15 months post-intervention the majority of managers were in the action and maintenance stage (60% and 56%). Figure 7 shows managerial stage of change.
010203040506070
Precon
templa
tion
Contem
platio
n
Prepara
tion
Action
Mainten
ance
Pe
rce
nta
ge
of
ma
na
ge
rs (
%)
Pre-intervention 6 months post-intervention 15 months post-intervention
Figure 7 Managerial stage of change (standard interventions)
Summary of changes in managers’ stage of change
• The noticeable increase in the number of managers in the maintenance stage following the implementation of interventions was not significant due to the relatively small sample
1515
3.3 RESULTS – 20 MONTHS POST-INTERVENTION- WORKERS
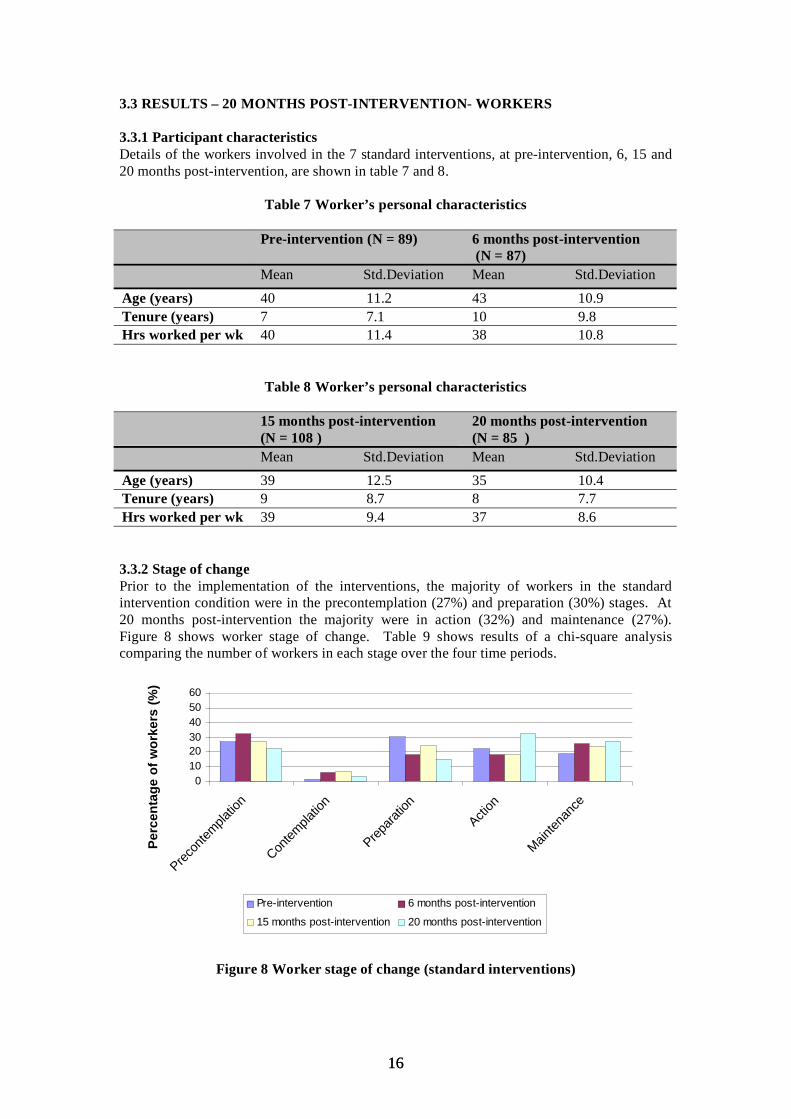
3.3.1 Participant characteristics Details of the workers involved in the 7 standard interventions, at pre-intervention, 6, 15 and 20 months post-intervention, are shown in table 7 and 8.
Table 7 Worker’s personal characteristics
Pre-intervention (N = 89) 6 months post-intervention (N = 87)
Mean Std.Deviation Mean Std.Deviation
Age (years) 40 11.2 43 10.9 Tenure (years) 7 7.1 10 9.8 Hrs worked per wk 40 11.4 38 10.8
Table 8 Worker’s personal characteristics
15 months post-intervention (N = 108 )
20 months post-intervention (N = 85 )
Mean Std.Deviation Mean Std.Deviation
Age (years) 39 12.5 35 10.4 Tenure (years) 9 8.7 8 7.7 Hrs worked per wk 39 9.4 37 8.6
3.3.2 Stage of change Prior to the implementation of the interventions, the majority of workers in the standard intervention condition were in the precontemplation (27%) and preparation (30%) stages. At 20 months post-intervention the majority were in action (32%) and maintenance (27%). Figure 8 shows worker stage of change. Table 9 shows results of a chi-square analysis comparing the number of workers in each stage over the four time periods.
0102030405060
Precon
templa
tion
Contem
platio
n
Prepara
tion
Action
Mainten
ance
Pe
rce
nta
ge
of
wo
rke
rs (
%)
Pre-intervention 6 months post-intervention
15 months post-intervention 20 months post-intervention
Figure 8 Worker stage of change (standard interventions)
1616
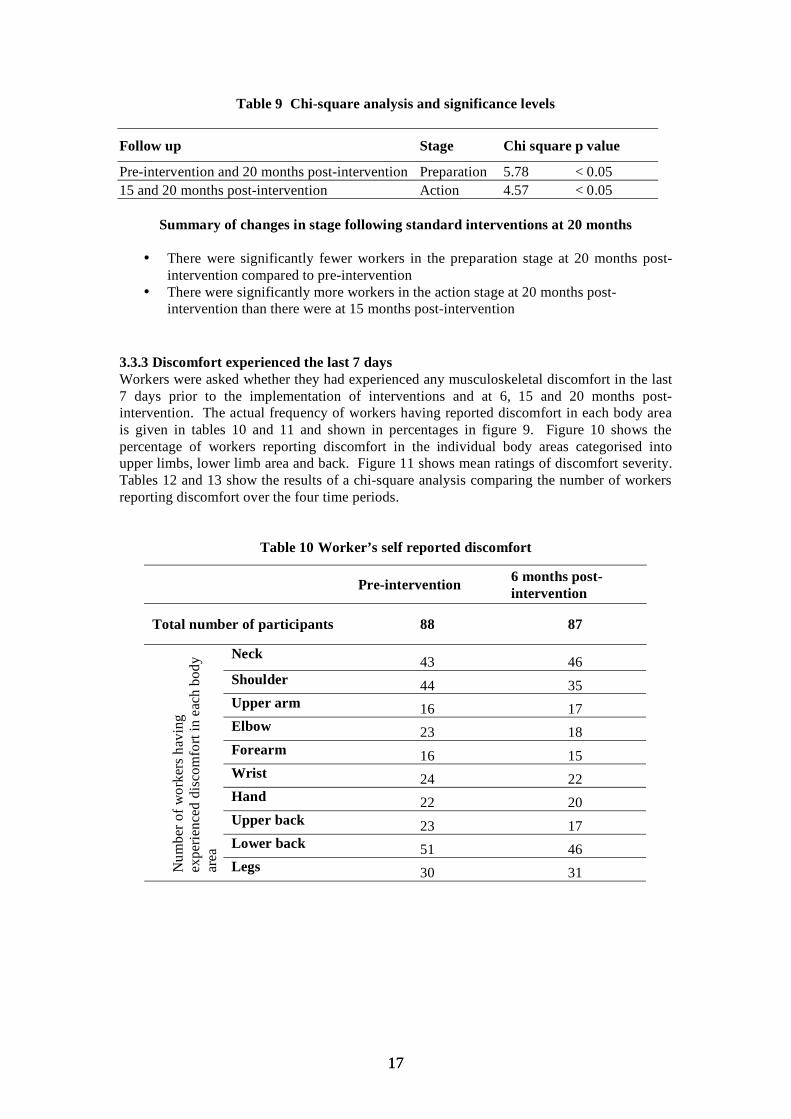
Table 9 Chi-square analysis and significance levels
Follow up Stage Chi square p value
Pre-intervention and 20 months post-intervention Preparation 5.78 < 0.05 15 and 20 months post-intervention Action 4.57 < 0.05
Summary of changes in stage following standard interventions at 20 months
• There were significantly fewer workers in the preparation stage at 20 months post-intervention compared to pre-intervention
• There were significantly more workers in the action stage at 20 months post-intervention than there were at 15 months post-intervention
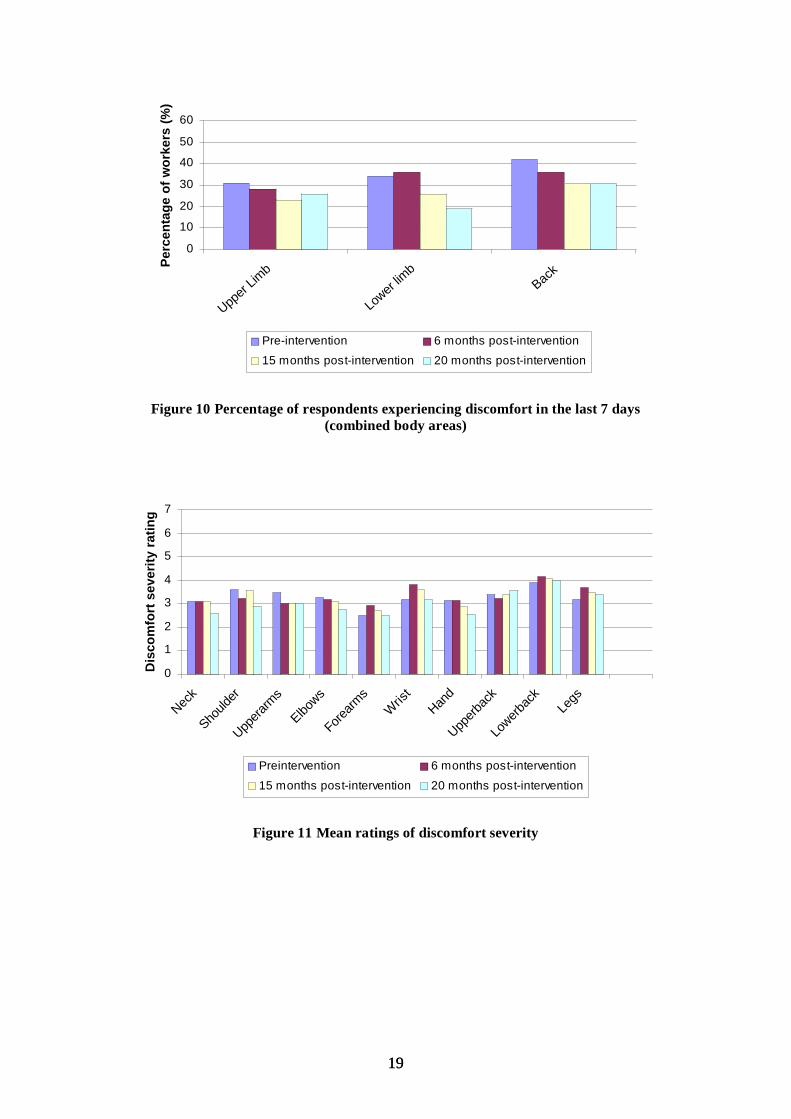
3.3.3 Discomfort experienced the last 7 days Workers were asked whether they had experienced any musculoskeletal discomfort in the last 7 days prior to the implementation of interventions and at 6, 15 and 20 months post-intervention. The actual frequency of workers having reported discomfort in each body area is given in tables 10 and 11 and shown in percentages in figure 9. Figure 10 shows the percentage of workers reporting discomfort in the individual body areas categorised into upper limbs, lower limb area and back. Figure 11 shows mean ratings of discomfort severity. Tables 12 and 13 show the results of a chi-square analysis comparing the number of workers reporting discomfort over the four time periods.
Table 10 Worker’s self reported discomfort
Pre-intervention 6 months post-intervention
Total number of participants 88 87
Num
ber o
f wor
kers
hav
ing
expe
rienc
ed d
isco
mfo
rt in
eac
h bo
dy
area
Neck 43 46 Shoulder 44 35 Upper arm 16 17 Elbow 23 18 Forearm 16 15 Wrist 24 22 Hand 22 20 Upper back 23 17 Lower back 51 46 Legs 30 31
1717
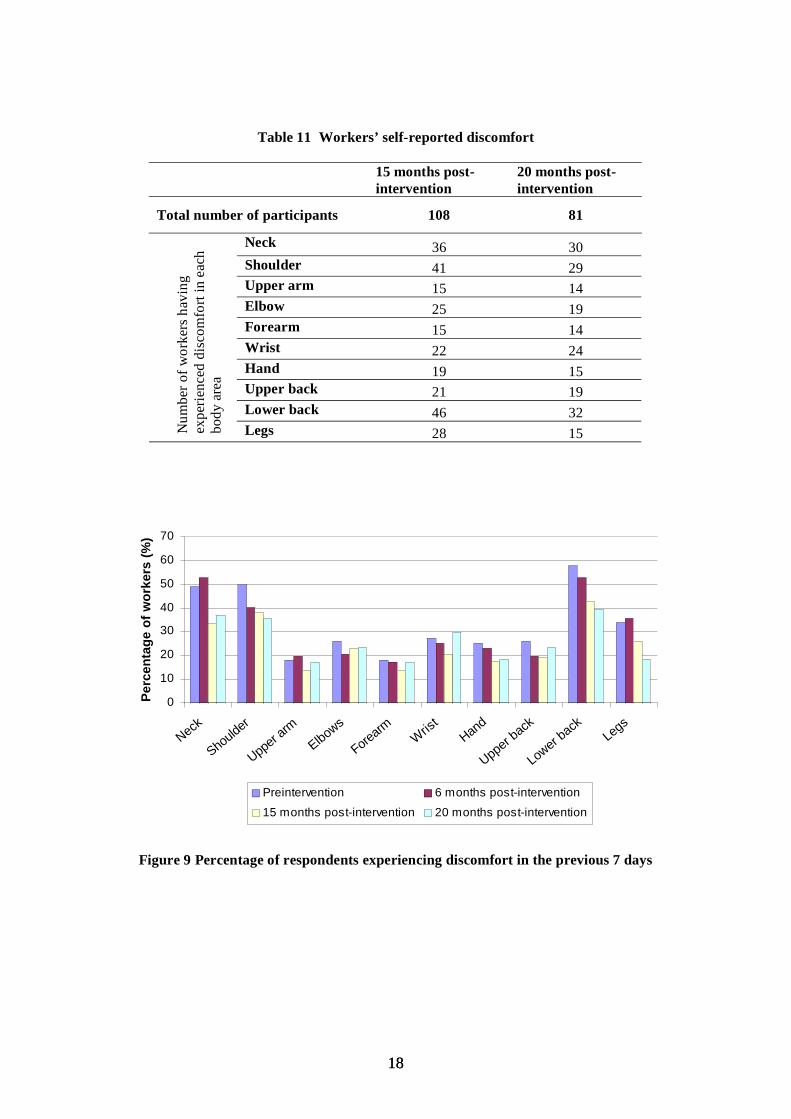
Table 11 Workers’ self-reported discomfort
15 months post- 20 months post-intervention intervention
Total number of participants 108 81
Neck 36 30
Num
ber o
f wor
kers
hav
ing
expe
rienc
ed d
isco
mfo
rt in
eac
h bo
dy a
rea
Shoulder 41 29Upper arm 15 14Elbow 25 19Forearm 15 14Wrist 22 24Hand 19 15Upper back 21 19Lower back 46 32Legs 28 15
0
10
20
30
40
50
60
70
Neck
Shoulder
Upper
armElbows
Forearm Wris
tHan
d
Upper back
Lower back
Legs
Pe
rce
nta
ge
of
wo
rke
rs (
%)
Preintervention 6 months post-intervention
15 months post-intervention 20 months post-intervention
Figure 9 Percentage of respondents experiencing discomfort in the previous 7 days
1818
0
10
20
30
40
50
60
Upper
Limb
Lower
limb
Back P
erc
en
tag
e o
f w
ork
ers
(%
)
Pre-intervention 6 months post-intervention
15 months post-intervention 20 months post-intervention
Figure 10 Percentage of respondents experiencing discomfort in the last 7 days (combined body areas)
0
1
2
3
4
5
6
7
Neck
Should
er
Uppera
rms
Elbows
Forearm
sW
rist
Hand
Upperb
ack
Lowerb
ack
Legs
Dis
co
mfo
rt s
everi
ty r
ati
ng
Preintervention 6 months post-intervention
15 months post-intervention 20 months post-intervention
Figure 11 Mean ratings of discomfort severity
1919
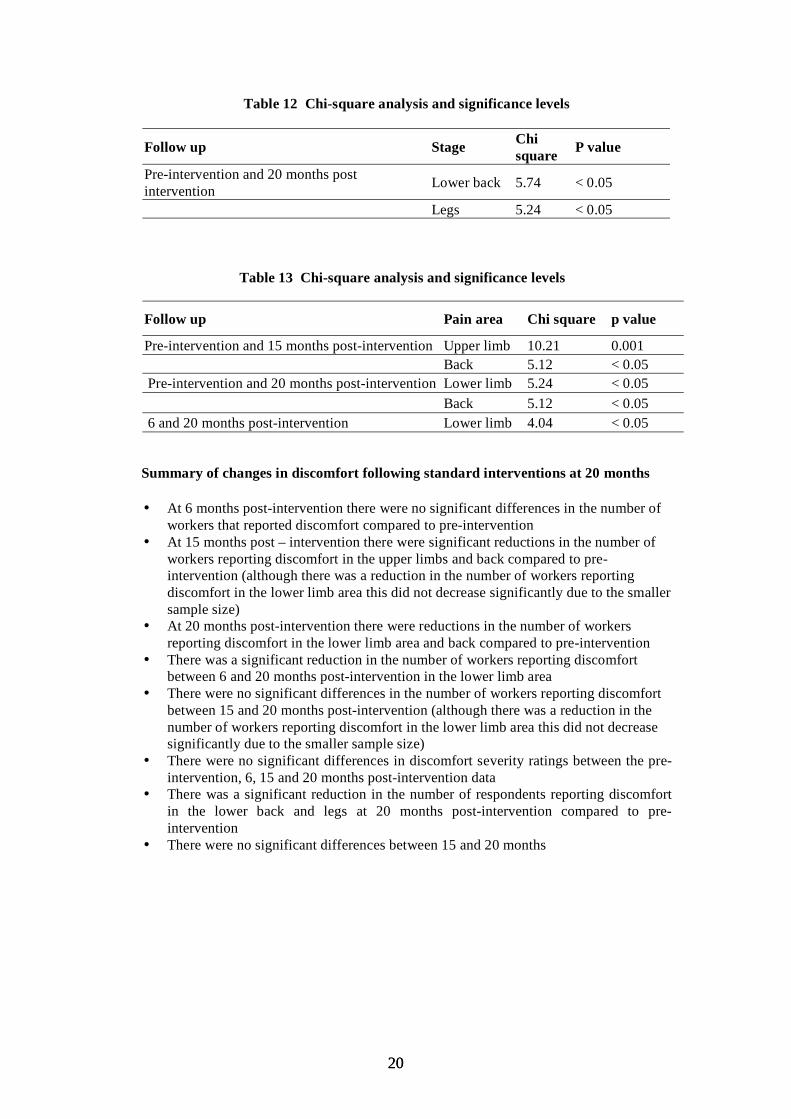
Table 12 Chi-square analysis and significance levels
Follow up Stage Chi P value square Pre-intervention and 20 months post Lower back 5.74 < 0.05intervention
Legs 5.24 < 0.05
Table 13 Chi-square analysis and significance levels
Follow up Pain area Chi square p value
Pre-intervention and 15 months post-intervention Upper limb 10.21 0.001 Back 5.12 < 0.05
Pre-intervention and 20 months post-intervention Lower limb 5.24 < 0.05 Back 5.12 < 0.05
6 and 20 months post-intervention Lower limb 4.04 < 0.05
Summary of changes in discomfort following standard interventions at 20 months
• At 6 months post-intervention there were no significant differences in the number of workers that reported discomfort compared to pre-intervention
• At 15 months post – intervention there were significant reductions in the number of workers reporting discomfort in the upper limbs and back compared to pre-intervention (although there was a reduction in the number of workers reporting discomfort in the lower limb area this did not decrease significantly due to the smaller sample size)
• At 20 months post-intervention there were reductions in the number of workers reporting discomfort in the lower limb area and back compared to pre-intervention
• There was a significant reduction in the number of workers reporting discomfort between 6 and 20 months post-intervention in the lower limb area
• There were no significant differences in the number of workers reporting discomfort between 15 and 20 months post-intervention (although there was a reduction in the number of workers reporting discomfort in the lower limb area this did not decrease significantly due to the smaller sample size)
• There were no significant differences in discomfort severity ratings between the pre-intervention, 6, 15 and 20 months post-intervention data
• There was a significant reduction in the number of respondents reporting discomfort in the lower back and legs at 20 months post-intervention compared to pre-intervention
• There were no significant differences between 15 and 20 months
2020
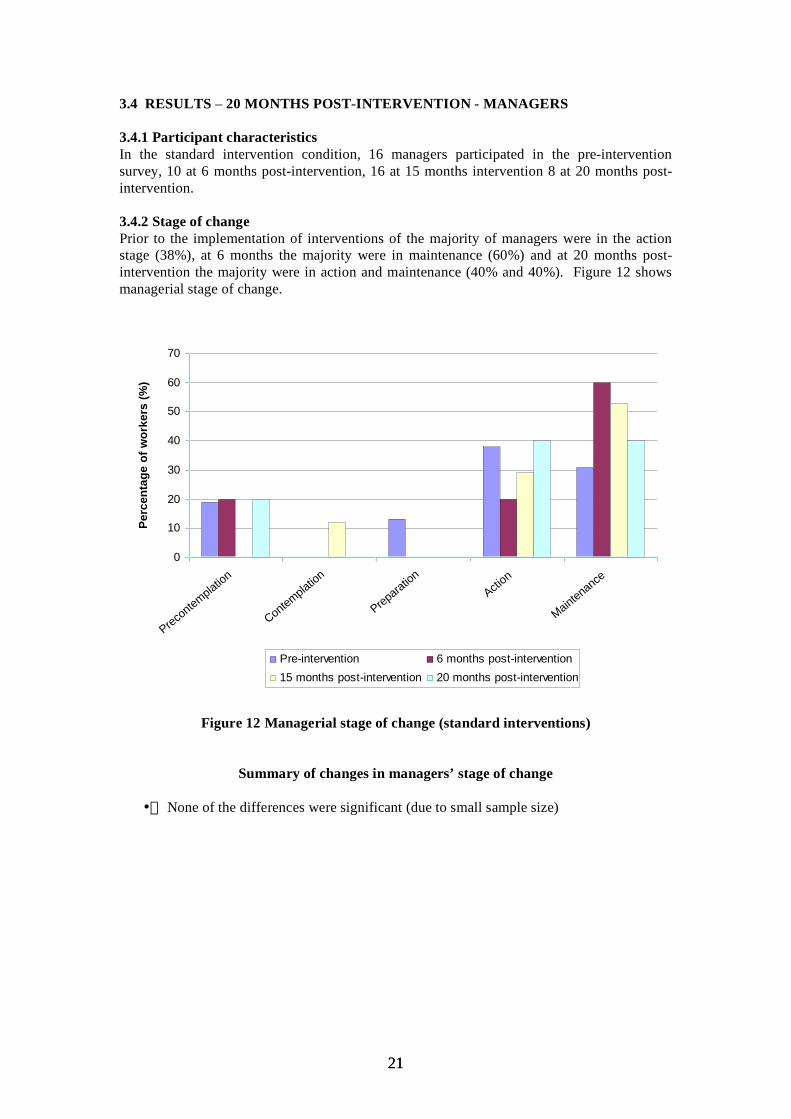
3.4 RESULTS – 20 MONTHS POST-INTERVENTION - MANAGERS
3.4.1 Participant characteristics In the standard intervention condition, 16 managers participated in the pre-intervention survey, 10 at 6 months post-intervention, 16 at 15 months intervention 8 at 20 months post-intervention.
3.4.2 Stage of change Prior to the implementation of interventions of the majority of managers were in the action stage (38%), at 6 months the majority were in maintenance (60%) and at 20 months post-intervention the majority were in action and maintenance (40% and 40%). Figure 12 shows managerial stage of change.
0
10
20
30
40
50
60
70
Precontemplatio
n
Contemplation
Preparation
Action
Maintenance
Pe
rce
nta
ge
of
wo
rke
rs (
%)
Pre-intervention 6 months post-intervention 15 months post-intervention 20 months post-intervention
Figure 12 Managerial stage of change (standard interventions)
Summary of changes in managers’ stage of change
• None of the differences were significant (due to small sample size)
2121
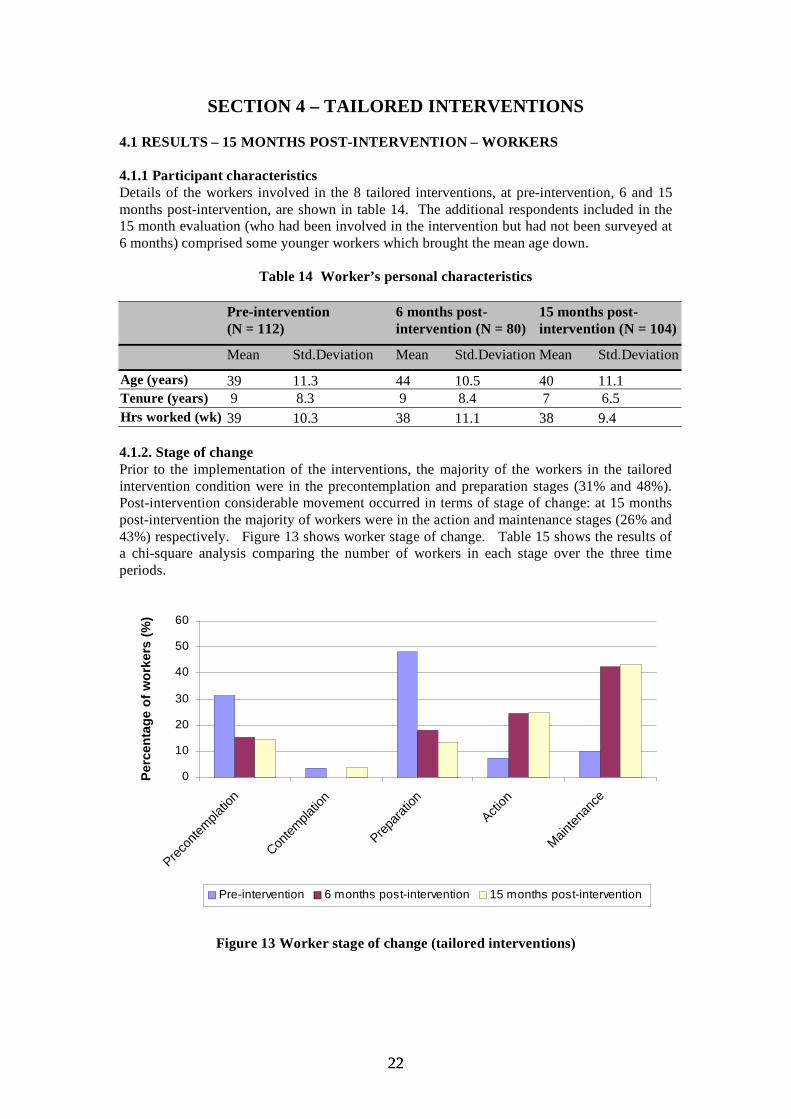
SECTION 4 – TAILORED INTERVENTIONS
4.1 RESULTS – 15 MONTHS POST-INTERVENTION – WORKERS
4.1.1 Participant characteristics Details of the workers involved in the 8 tailored interventions, at pre-intervention, 6 and 15 months post-intervention, are shown in table 14. The additional respondents included in the 15 month evaluation (who had been involved in the intervention but had not been surveyed at 6 months) comprised some younger workers which brought the mean age down.
Table 14 Worker’s personal characteristics
Pre-intervention (N = 112)
6 months post-intervention (N = 80)
15 months post-intervention (N = 104)
Mean Std.Deviation Mean Std.Deviation Mean Std.Deviation
Age (years) 39 11.3 44 10.5 40 11.1 Tenure (years) 9 8.3 9 8.4 7 6.5 Hrs worked (wk) 39 10.3 38 11.1 38 9.4
4.1.2. Stage of change Prior to the implementation of the interventions, the majority of the workers in the tailored intervention condition were in the precontemplation and preparation stages (31% and 48%). Post-intervention considerable movement occurred in terms of stage of change: at 15 months post-intervention the majority of workers were in the action and maintenance stages (26% and 43%) respectively. Figure 13 shows worker stage of change. Table 15 shows the results of a chi-square analysis comparing the number of workers in each stage over the three time periods.
0
10
20
30
40
50
60
Precon
templa
tion
Contem
platio
n
Prepara
tion
Action
Mainten
ance
Pe
rce
nta
ge
of
wo
rke
rs (
%)
Pre-intervention 6 months post-intervention 15 months post-intervention
Figure 13 Worker stage of change (tailored interventions)
2222

Table 15 Chi-square and significance levels
Follow up Stage Chi square p value
Pre-intervention and 6 months post-intervention Precontemplation 6.22 < 0.05 Preparation 18.33 < 0.001 Action 11.18 <0.001 Maintenance 27.3 < 0.001
Pre-intervention and 15 months post-intervention Precontemplation 8.58 <0.003 Preparation 30.2 < 0.001 Action 12.9 < 0.001 Maintenance 31.42 < 0.001
Summary of changes in stage following tailored interventions at 15 months
• At 6 months there were significantly fewer workers in the precontemplation stage and the preparation stage compared to pre-intervention and there were significantly more workers in action and maintenance stages compared to pre-intervention
• At 15 months there were significantly fewer workers in the precontemplation stage at 15 months and significantly fewer workers in the preparation stage compared to pre-intervention and there were significantly more workers in action and maintenance compared to pre-intervention
• There were no significant differences between 6 and 15 months, suggesting that the effect of the intervention has been maintained over the long term
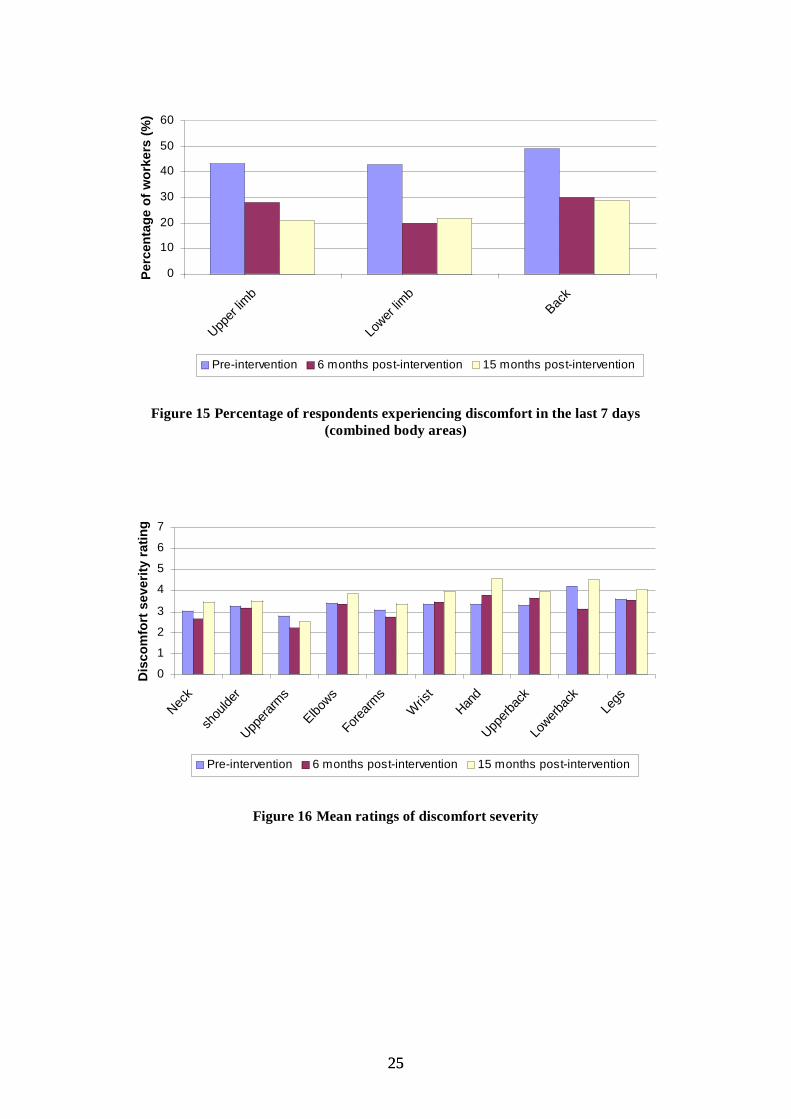
4.1.3 Discomfort experienced the last 7 days Workers were asked whether they had experienced any musculoskeletal discomfort in the last 7 days prior to the implementation of interventions and at 6 and 15 months post-intervention. The actual frequency of workers having reported discomfort in each body area is given in table 16 and shown in percentages in figure 14. The percentage of workers reporting discomfort when the individual body areas were categorised into upper limb, lower limb and back is shown in figure 15. Mean ratings of discomfort severity are displayed in figure 16. Tables 17 and 19 compare the number of workers reporting discomfort over the three time periods. Table 18 shows severity of discomfort across the three time periods.
2323
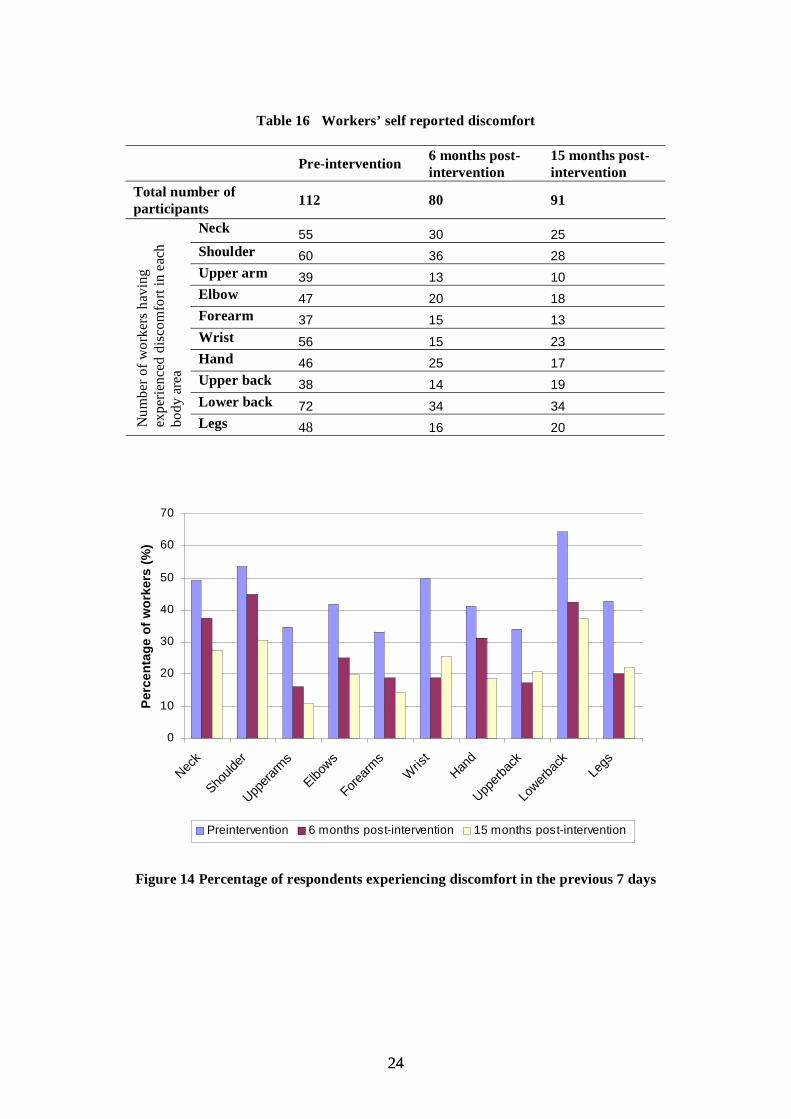
Table 16 Workers’ self reported discomfort
Pre-intervention 6 months post- 15 months post-intervention intervention
Total number of 80 91participants 112
Neck 55 30 25
Num
ber o
f wor
kers
hav
ing
expe
rienc
ed d
isco
mfo
rt in
eac
h bo
dy a
rea
Shoulder 60 36 28Upper arm 39 13 10Elbow 47 20 18Forearm 37 15 13Wrist 56 15 23Hand 46 25 17Upper back 38 14 19Lower back 72 34 34Legs 48 16 20
0
10
20
30
40
50
60
70
Neck
Should
er
Uppera
rms
Elbows
Forearm
sW
rist
Hand
Upperb
ack
Lowerb
ack
Legs
Pe
rce
nta
ge
of
wo
rke
rs (
%)
Preintervention 6 months post-intervention 15 months post-intervention
Figure 14 Percentage of respondents experiencing discomfort in the previous 7 days
2424
0
10
20
30
40
50
60
Upper
limb
Lower
limb
Back
Pe
rce
nta
ge
of
wo
rke
rs (
%)
Pre-intervention 6 months post-intervention 15 months post-intervention
Figure 15 Percentage of respondents experiencing discomfort in the last 7 days (combined body areas)
0
1
2
3
4
5
6
7
Neck
shou
lder
Uppera
rms
Elbows
Forearm
s
Wris
t
Hand
Upperb
ack
Lowerb
ack
Legs
Dis
co
mfo
rt s
ev
eri
ty r
ati
ng
Pre-intervention 6 months post-intervention 15 months post-intervention
Figure 16 Mean ratings of discomfort severity
2525
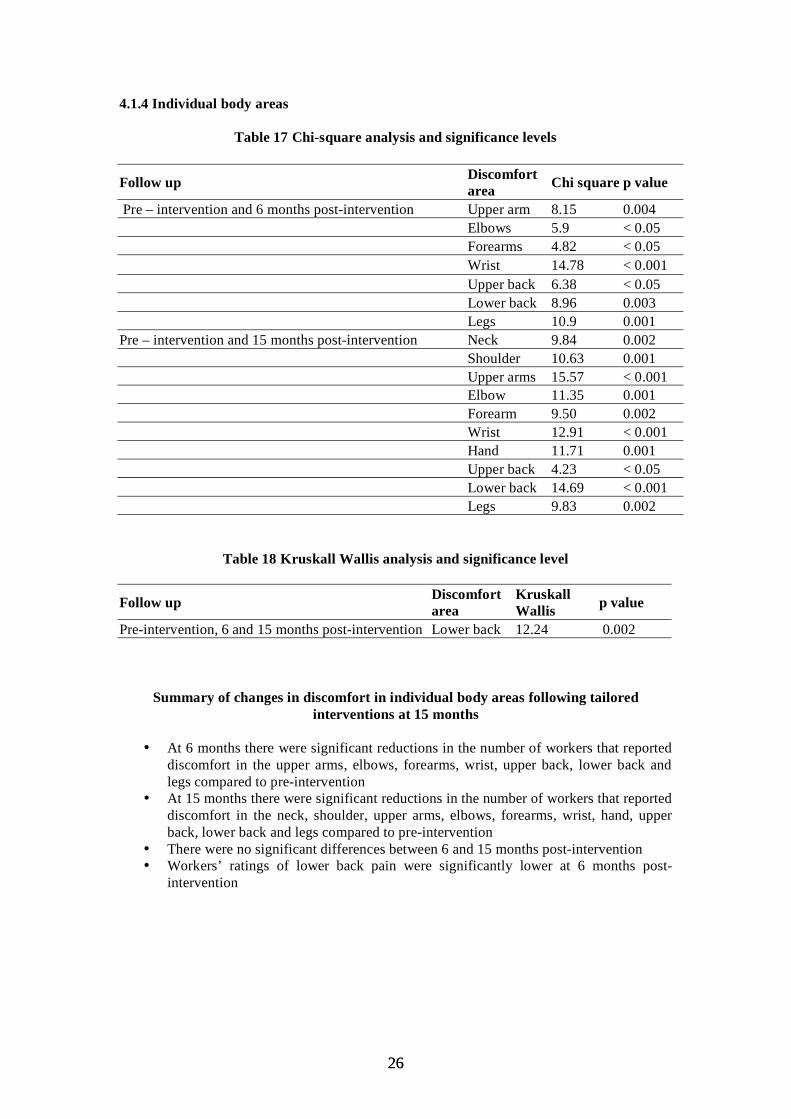
4.1.4 Individual body areas
Table 17 Chi-square analysis and significance levels
Follow up Discomfort area Chi square p value
Pre – intervention and 6 months post-intervention Upper arm 8.15 0.004 Elbows 5.9 < 0.05 Forearms 4.82 < 0.05 Wrist 14.78 < 0.001 Upper back 6.38 < 0.05 Lower back 8.96 0.003 Legs 10.9 0.001
Pre – intervention and 15 months post-intervention Neck 9.84 0.002 Shoulder 10.63 0.001 Upper arms 15.57 < 0.001 Elbow 11.35 0.001 Forearm 9.50 0.002 Wrist 12.91 < 0.001 Hand 11.71 0.001 Upper back 4.23 < 0.05 Lower back 14.69 < 0.001 Legs 9.83 0.002
Table 18 Kruskall Wallis analysis and significance level
Follow upDiscomfort Kruskall
Wallis p value area Pre-intervention, 6 and 15 months post-intervention Lower back 12.24 0.002
Summary of changes in discomfort in individual body areas following tailored interventions at 15 months
• At 6 months there were significant reductions in the number of workers that reported discomfort in the upper arms, elbows, forearms, wrist, upper back, lower back and legs compared to pre-intervention
• At 15 months there were significant reductions in the number of workers that reported discomfort in the neck, shoulder, upper arms, elbows, forearms, wrist, hand, upper back, lower back and legs compared to pre-intervention
• There were no significant differences between 6 and 15 months post-intervention • Workers’ ratings of lower back pain were significantly lower at 6 months post-
intervention
2626
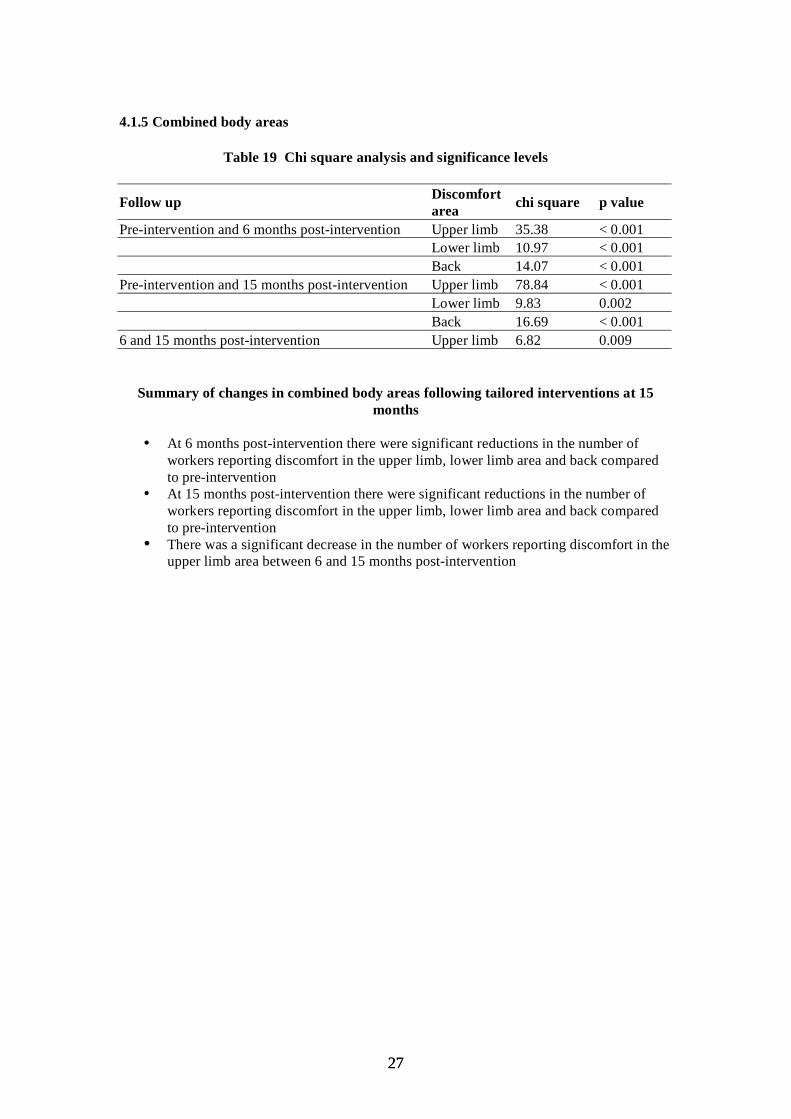
4.1.5 Combined body areas
Table 19 Chi square analysis and significance levels
Follow up Discomfort area chi square p value
Pre-intervention and 6 months post-intervention Upper limb 35.38 < 0.001 Lower limb 10.97 < 0.001 Back 14.07 < 0.001
Pre-intervention and 15 months post-intervention Upper limb 78.84 < 0.001 Lower limb 9.83 0.002 Back 16.69 < 0.001
6 and 15 months post-intervention Upper limb 6.82 0.009
Summary of changes in combined body areas following tailored interventions at 15 months
• At 6 months post-intervention there were significant reductions in the number of workers reporting discomfort in the upper limb, lower limb area and back compared to pre-intervention
• At 15 months post-intervention there were significant reductions in the number of workers reporting discomfort in the upper limb, lower limb area and back compared to pre-intervention
• There was a significant decrease in the number of workers reporting discomfort in the upper limb area between 6 and 15 months post-intervention
2727
4.2 RESULTS – 15 MONTHS POST-INTERVENTION – MANAGERS
4.2.1 Participant characteristics In the tailored intervention condition, 20 managers participated in the pre-intervention survey. At 6 months post-intervention 9 managers completed the survey and at 15 months post-intervention 17 managers completed the survey. Due to the relatively small numbers of managers, care must be taken in interpreting these results as generalisable to the broader managerial population.
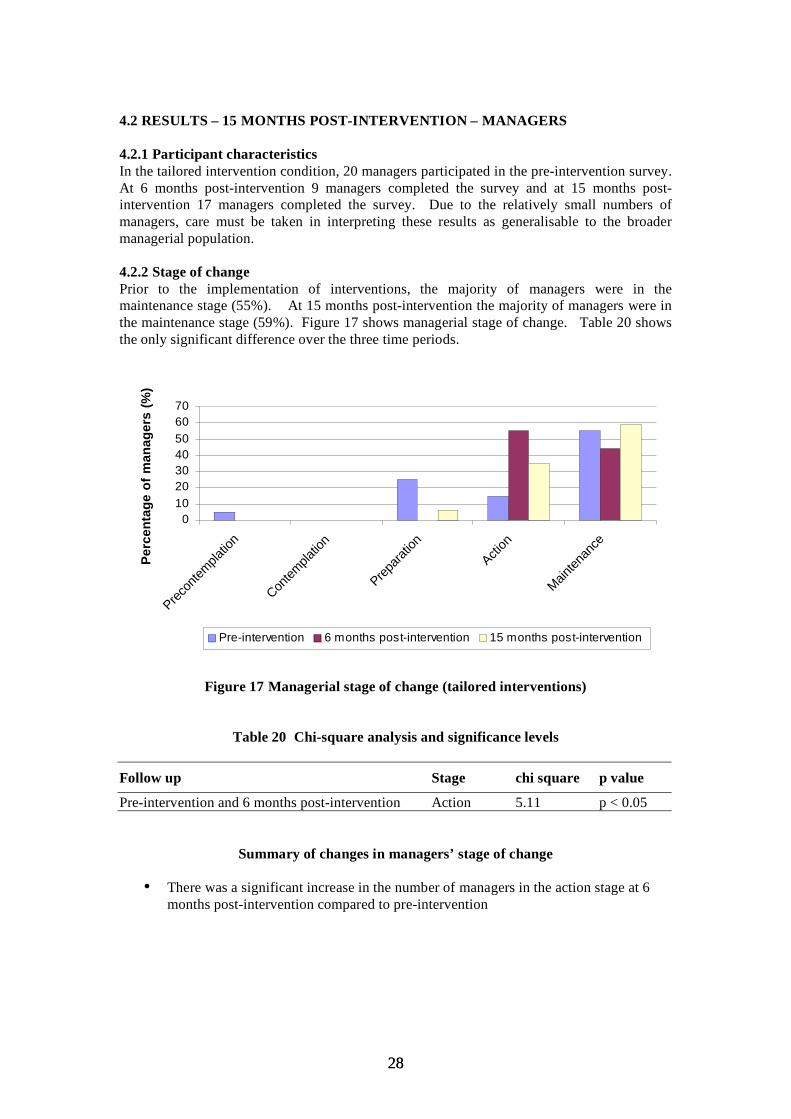
4.2.2 Stage of change Prior to the implementation of interventions, the majority of managers were in the maintenance stage (55%). At 15 months post-intervention the majority of managers were in the maintenance stage (59%). Figure 17 shows managerial stage of change. Table 20 shows the only significant difference over the three time periods.
010203040506070
Precon
templa
tion
Contem
platio
n
Prepara
tion
Action
Mainten
ance
Pe
rce
nta
ge
of
ma
na
ge
rs (
%)
Pre-intervention 6 months post-intervention 15 months post-intervention
Figure 17 Managerial stage of change (tailored interventions)
Table 20 Chi-square analysis and significance levels
Follow up Stage chi square p value
Pre-intervention and 6 months post-intervention Action 5.11 p < 0.05
Summary of changes in managers’ stage of change
• There was a significant increase in the number of managers in the action stage at 6 months post-intervention compared to pre-intervention
2828

4.3 RESULTS - 20 MONTHS POST-INTERVENTION – WORKERS
4.3.1 Participant characteristics Details of the workers involved in the 6 tailored interventions, at pre-intervention, 6, 15 and 20 months post-intervention, are shown in table 21 and 22.
Table 21 Personal characteristics
Pre-intervention (N = 93) 6 months post-intervention (N = 64)
Mean Std.Deviation Mean Std.Deviation Age (years) 41 9.7 45 10.6 Tenure (years) 8 8.7 9 9.11 Hrs worked per wk 38 11.1 37 11.9
Table 22 Personal characteristics
15 months post-intervention (N = 85 )
20 months post-intervention (N = 85 )
Mean Std.Deviation Mean Std.Deviation
Age (years) 40 11.5 37 12.3 Tenure (years) 6 6.0 7 6.9 Hrs worked per wk 36 9.2 36 8.0
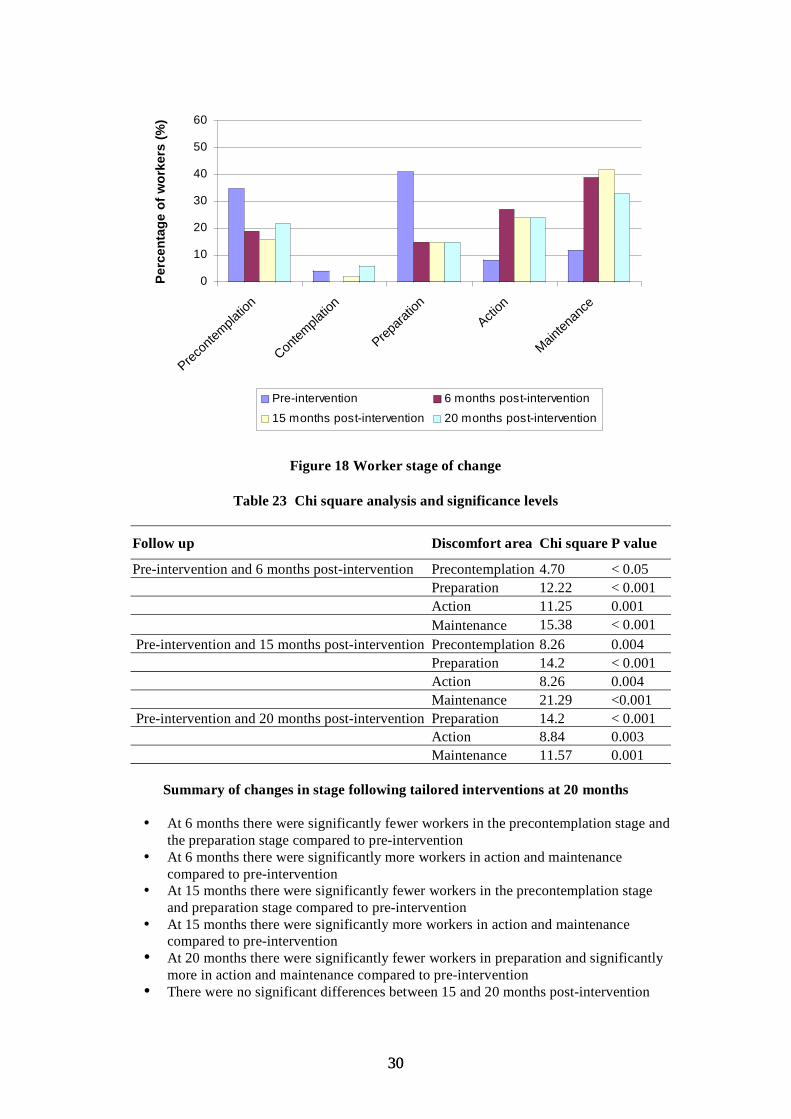
4.3.2 Stage of change Prior to the implementation of the interventions, the majority of workers in the tailored intervention condition were in the precontemplation and preparation stages (36% and 41%). At 20 months post-intervention the majority were in maintenance (33%). Figure 18 shows worker stage of change. Table 23 compares the number of workers in each stage across the four time periods.
2929
0
10
20
30
40
50
60
Precon
templa
tion
Contem
platio
n
Prepara
tion
Action
Mainten
ance
Pe
rce
nta
ge
of
wo
rke
rs (
%)
Pre-intervention 6 months post-intervention
15 months post-intervention 20 months post-intervention
Figure 18 Worker stage of change
Table 23 Chi square analysis and significance levels
Follow up Discomfort area Chi square P value
Pre-intervention and 6 months post-intervention Precontemplation 4.70 < 0.05 Preparation 12.22 < 0.001 Action 11.25 0.001 Maintenance 15.38 < 0.001
Pre-intervention and 15 months post-intervention Precontemplation 8.26 0.004 Preparation 14.2 < 0.001 Action 8.26 0.004 Maintenance 21.29 <0.001
Pre-intervention and 20 months post-intervention Preparation 14.2 < 0.001 Action 8.84 0.003 Maintenance 11.57 0.001
Summary of changes in stage following tailored interventions at 20 months
• At 6 months there were significantly fewer workers in the precontemplation stage and the preparation stage compared to pre-intervention
• At 6 months there were significantly more workers in action and maintenance compared to pre-intervention
• At 15 months there were significantly fewer workers in the precontemplation stage and preparation stage compared to pre-intervention
• At 15 months there were significantly more workers in action and maintenance compared to pre-intervention
• At 20 months there were significantly fewer workers in preparation and significantly more in action and maintenance compared to pre-intervention
• There were no significant differences between 15 and 20 months post-intervention
3030

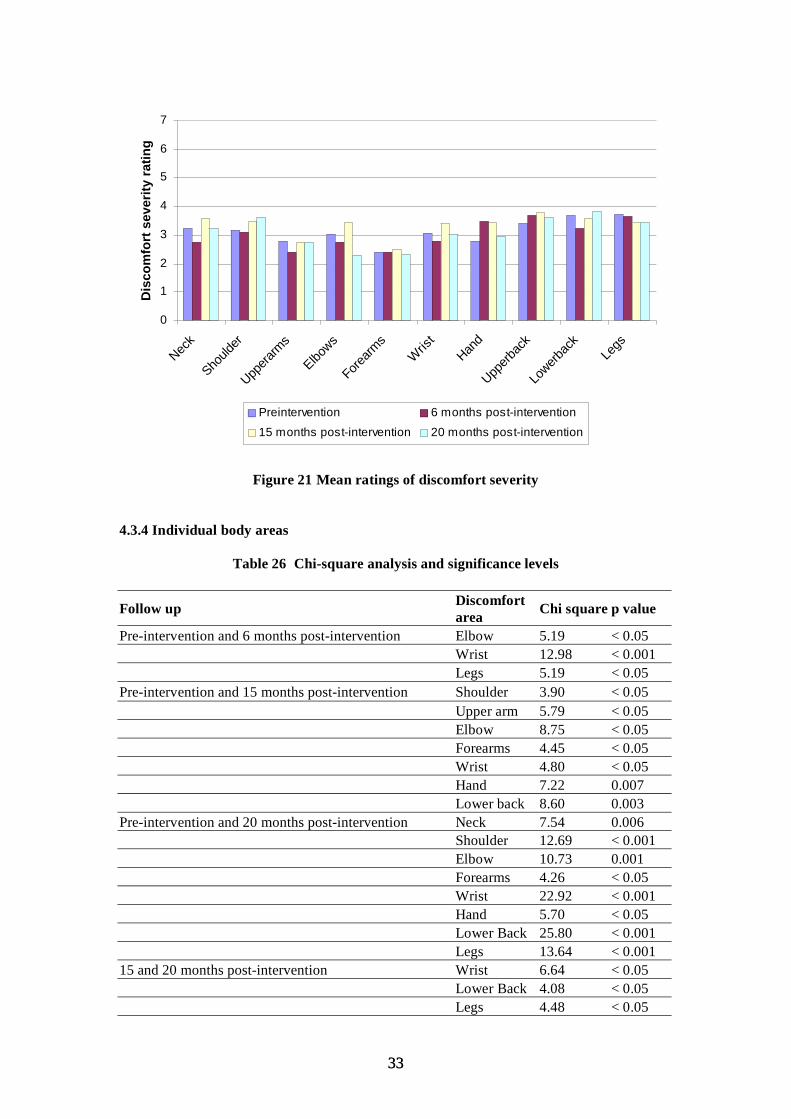
4.3.3 Discomfort experienced the last 7 days Workers were asked whether they had experienced any musculoskeletal discomfort in the last 7 days prior to the implementation of interventions and at 6, 15 and 20 months post-intervention. The frequency of workers having reported discomfort in each body area is given in tables 24 and 25 and shown in percentages in figure 19. Figure 20 shows the percentage of workers reporting discomfort in the individual body areas categorised into upper limb, lower limb and back. Mean ratings of discomfort severity are displayed in figure 21. Tables 26 and 27 compare the number of workers reporting discomfort over the four time periods.
Table 24 Frequency of workers having reported discomfort
Pre-intervention 6 months post-intervention
Total number of participants 93 64
Neck 40 24
Num
ber o
f wor
kers
hav
ing
expe
rienc
ed d
isco
mfo
rt in
eac
h bo
dy a
rea
Shoulder 42 28 Upper arm 24 10 Elbow 33 12 Forearm 22 13 Wrist 38 9 Hand 31 17 Upper back 24 10 Lower back 57 30 Legs 33 12
Table 25 Frequency of workers having reported discomfort
15 months post- 20 months post-intervention intervention
Total number of participants 73 85
22 20 20
Num
ber o
f wor
kers
hav
ing
expe
rienc
ed d
isco
mfo
rt in
eac
h bo
dy a
rea
22 17 17 8 15 15
11 12 12 8 10 10
18 8 8 11 15 15 14 13 13 28 20 20 18 10 10
3131

010203040506070
Neck
Should
er
Upper
arms
Elbows
Forearm
sW
rist
Hand
Upper
back
Lower
back
Le
gs P
erc
en
tag
e o
f w
ork
ers
(%
)
Preintervention 6 months post-intervention
15 months post-intervention 20 months post-intervention
Figure 19 Percentage of respondents experiencing discomfort in the previous 7 days
0
10
20
30
40
50
60
Upper
Limb
Lower
limb
Back
Pe
rce
nta
ge
of
wo
rke
rs (
%)
Pre-intervention 6 months post-intervention
15 months post-intervention 20 months post-intervention
Figure 20 Percentage of respondents experiencing discomfort in the last 7 days (combined body areas)
3232
0
1
2
3
4
5
6
7
Neck
Should
er
Uppera
rms
Elbows
Forearm
sW
rist
Hand
Upperb
ack
Lowerb
ack
Legs
Dis
co
mfo
rt s
everi
ty r
ati
ng
Preintervention 6 months post-intervention
15 months post-intervention 20 months post-intervention
Figure 21 Mean ratings of discomfort severity
4.3.4 Individual body areas
Table 26 Chi-square analysis and significance levels
Follow up Discomfort area Chi square p value
Pre-intervention and 6 months post-intervention Elbow 5.19 < 0.05 Wrist 12.98 < 0.001 Legs 5.19 < 0.05
Pre-intervention and 15 months post-intervention Shoulder 3.90 < 0.05 Upper arm 5.79 < 0.05 Elbow 8.75 < 0.05 Forearms 4.45 < 0.05 Wrist 4.80 < 0.05 Hand 7.22 0.007 Lower back 8.60 0.003
Pre-intervention and 20 months post-intervention Neck 7.54 0.006 Shoulder 12.69 < 0.001 Elbow 10.73 0.001 Forearms 4.26 < 0.05 Wrist 22.92 < 0.001 Hand 5.70 < 0.05 Lower Back 25.80 < 0.001 Legs 13.64 < 0.001
15 and 20 months post-intervention Wrist 6.64 < 0.05 Lower Back 4.08 < 0.05 Legs 4.48 < 0.05
3333

Summary of changes in discomfort in individual body areas following tailored interventions at 20 months
• At 6 months post-intervention there was a significant reduction in discomfort felt in the elbow, wrist and legs compared to pre-intervention
• At 15 months post-intervention there was a significant reduction in the number of workers experiencing discomfort (compared to pre-intervention) in the shoulder, upper arms, elbows, forearms, wrist, hand and lower back
• At 20 months post-intervention there was a significant reduction in the number of workers experiencing discomfort (compared to pre-intervention) in the neck, shoulder elbow, forearm, wrist, hand, lower back and legs
• For most body areas the data shows further reductions in the percentage of workers reporting discomfort between 15 and 20 months and the reduction was significant for wrist, lower back and legs
4.3.5 Combined body areas
Table 27 Chi square and significance levels
Follow up Discomfort area Chi square p value
Pre-intervention and 6 months post-intervention Upper limb 12.63 < 0.001 Lower limb 5.19 < 0.05 Back 4.84 < 0.05
Pre-intervention and 15 months post-intervention Upper limb 34.97 < 0.001 Back 7.66 0.006
Pre-intervention and 20 months post-intervention Upper limb 58.15 < 0.001 Lower limb 13.64 < 0.001 Back 23.77 < 0.001
6 and 20 months post-intervention Upper limb 12.65 < 0.001 Back 23.77 < 0.001
15 and 20 months post-intervention Lower limb 4.48 < 0.05 Back 3.80 0.05
Summary of changes in discomfort in combined body areas following tailored interventions at 20 months
• At 6 months post-intervention there were significant reductions in the number of workers that reported discomfort in the upper limbs, lower limb area and back compared to pre-intervention
• At 15 months post-intervention there were significant reductions in the number of workers that reported discomfort in the upper limbs and back compared to pre-intervention
• At 20 months post-intervention there were significant reductions in the number of workers that reported discomfort in the upper limbs, lower limb area and back compared to pre-intervention
• There were significant reductions in the number of workers reporting discomfort between 6 and 20 months post-intervention in the upper limbs and back
3434

• There were significant reductions in the number of workers reporting discomfort between 15 and 20 months post-intervention in the lower limb area and back
• There were no significant differences in discomfort severity ratings between pre-intervention, 6, 15 and 20 months post-intervention data
3535
4.4 RESULTS - 20 MONTHS POST-INTERVENTION – MANAGERS
4.4.1 Participant characteristics In the tailored intervention condition, 20 managers participated in the pre-intervention survey, 9 managers participated 6 months post-intervention, 17 managers participated 15 months post-intervention and 8 managers participated at 20 months post-intervention.
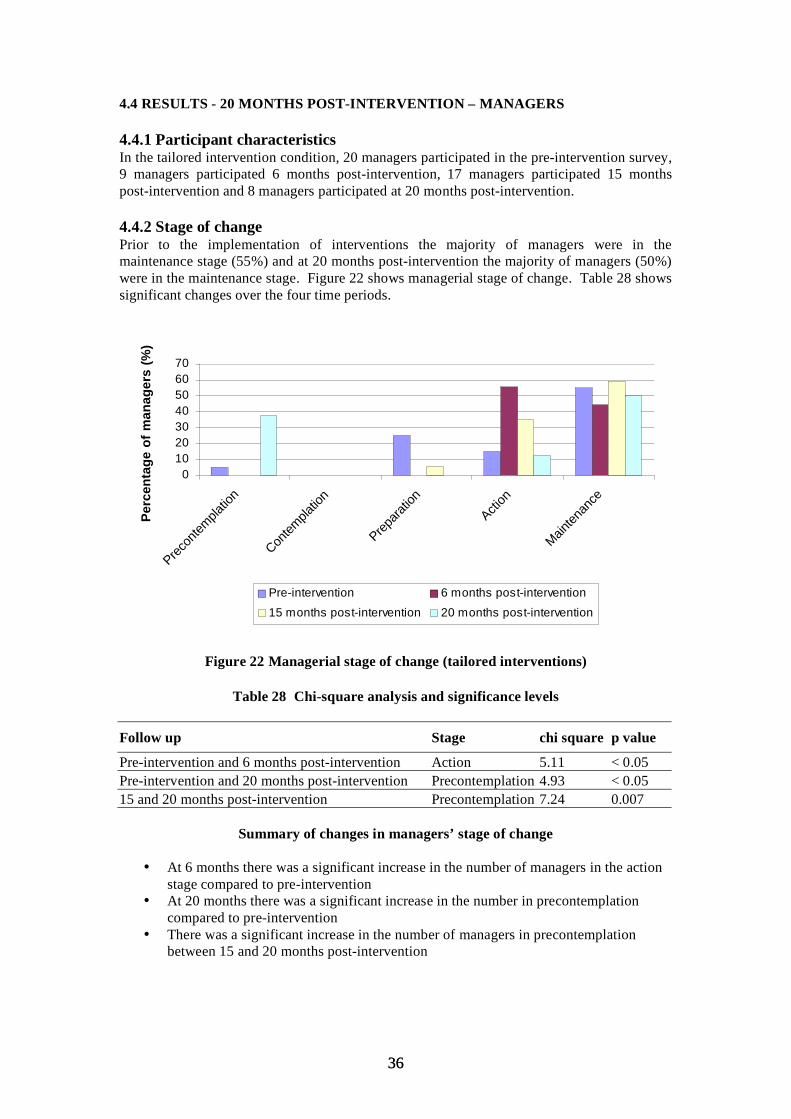
4.4.2 Stage of change Prior to the implementation of interventions the majority of managers were in the maintenance stage (55%) and at 20 months post-intervention the majority of managers (50%) were in the maintenance stage. Figure 22 shows managerial stage of change. Table 28 shows significant changes over the four time periods.
010203040506070
Precon
templa
tion
Contem
platio
n
Prepara
tion
Action
Mainten
ance
Pe
rce
nta
ge
of
ma
na
ge
rs (
%)
Pre-intervention 6 months post-intervention
15 months post-intervention 20 months post-intervention
Figure 22 Managerial stage of change (tailored interventions)
Table 28 Chi-square analysis and significance levels
Follow up Stage chi square p value
Pre-intervention and 6 months post-intervention Action 5.11 < 0.05 Pre-intervention and 20 months post-intervention Precontemplation 4.93 < 0.05 15 and 20 months post-intervention Precontemplation 7.24 0.007
Summary of changes in managers’ stage of change
• At 6 months there was a significant increase in the number of managers in the action stage compared to pre-intervention
• At 20 months there was a significant increase in the number in precontemplation compared to pre-intervention
• There was a significant increase in the number of managers in precontemplation between 15 and 20 months post-intervention
3636
5 MANAGERIAL INTERVIEWS
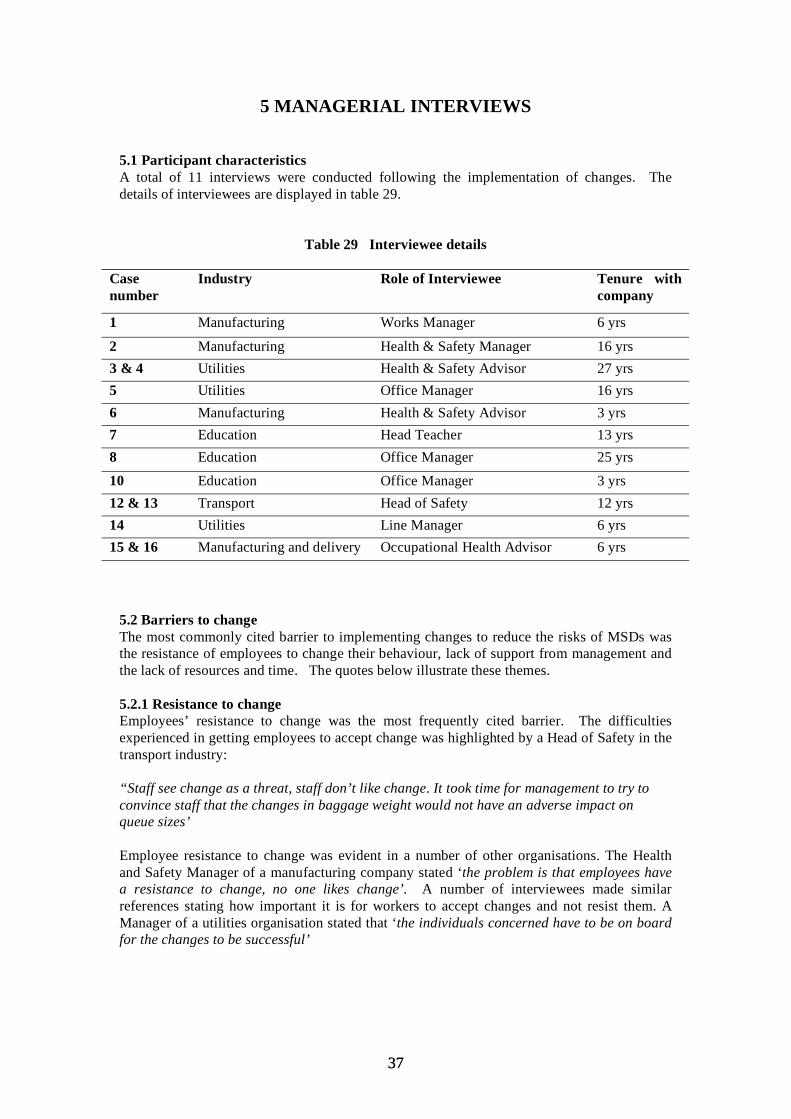
5.1 Participant characteristics A total of 11 interviews were conducted following the implementation of changes. The details of interviewees are displayed in table 29.
Table 29 Interviewee details
Case Industry Role of Interviewee Tenure with number company
1 Manufacturing Works Manager 6 yrs
2 Manufacturing Health & Safety Manager 16 yrs 3 & 4 Utilities Health & Safety Advisor 27 yrs 5 Utilities Office Manager 16 yrs 6 Manufacturing Health & Safety Advisor 3 yrs 7 Education Head Teacher 13 yrs 8 Education Office Manager 25 yrs
10 Education Office Manager 3 yrs 12 & 13 Transport Head of Safety 12 yrs 14 Utilities Line Manager 6 yrs 15 & 16 Manufacturing and delivery Occupational Health Advisor 6 yrs
5.2 Barriers to change The most commonly cited barrier to implementing changes to reduce the risks of MSDs was the resistance of employees to change their behaviour, lack of support from management and the lack of resources and time. The quotes below illustrate these themes.
5.2.1 Resistance to change Employees’ resistance to change was the most frequently cited barrier. The difficulties experienced in getting employees to accept change was highlighted by a Head of Safety in the transport industry:
“Staff see change as a threat, staff don’t like change. It took time for management to try to convince staff that the changes in baggage weight would not have an adverse impact on queue sizes’
Employee resistance to change was evident in a number of other organisations. The Health and Safety Manager of a manufacturing company stated ‘the problem is that employees have a resistance to change, no one likes change’. A number of interviewees made similar references stating how important it is for workers to accept changes and not resist them. A Manager of a utilities organisation stated that ‘the individuals concerned have to be on board for the changes to be successful’
3737

5.2.2 Lack of support from management A number of interviewees made reference to a lack of support from management being a barrier against change. The Manager of a manufacturing company stated that:
‘Lack of support from management has been a problem in the past, if management don’t support changes if can be very difficult to get them implemented’
Some interviewees speculated why it is that management may not be supportive of change. A Head of Safety in the Transport Industry stated that ‘management can be sceptical of change’.
5.2.3 Resources and time Not having the resources available to make the changes happen was mentioned by a few interviewees. An Office Manager in a utilities company explained:
‘we have been trying to get some new equipment for a while but we have not been able to find suitable equipment for the task, we are not sure how to find out or who to contact about this’
Time constraints were mentioned as a barrier on a number of occasions. A Teacher stated:
‘Time is a constraint, the children need a lot of hands on attention in this school, if there were less time restrictions more time could be spent planning changes and implementing them’
5.3 Factors facilitating the change process More interviewees cited factors that they believed acted as facilitators to change than the number that cited barriers. The most common facilitators to the change process were a supportive management, change of management and communication. The quotes below illustrate these themes.
5.3.1 Supportive Management A supportive management was cited as the most common facilitator to change. The Health and Safety Manager from a manufacturing organisation stated:
‘The guy at the top, we are a family owned business and the chairman has a big commitment to health and safety. Being led from the top of the organisation has helped us a lot. We’ve recently had a new managing director with new policies on health and safety. We think about everything we do from a health and safety point of view and we look at current legislation and go one step further’
A number of other interviewees made reference to the importance of management support. One Health and Safety Manager noted that ‘support from management is very important’. An Line Manager from a Utilities company stated that ‘management support is the most important facilitator to change’
5.3.2 Change of management Change of management was cited as assisting with the change process. A Health and Safety Manager of a Utilities company stated that:
‘we have recently got a new Company Director who is very enthusiastic about health and safety and is influencing the company in a positive light’
A Health and Safety Advisor of a manufacturing company stated how he took over the management of health and safety and was able to make a number of improvements:
3838
‘I joined the company and took on the role of managing Health and Safety, I set about identifying the problems and searching for solutions and I feel that I took a more proactive approach to health and safety and raised awareness in the company’
5.3.3 Communication Communication was seen as an important facilitator to change by a number of interviewees. A Health and Safety Advisor from the manufacturing industry stated that:
‘Good communication with the workforce is key to affective change, we have a notice board where we have information regarding health and safety and have regular meetings with our staff, keeping our staff aware of planned changes and health and safety procedures facilitates the change process’
Another interviewee commented on the importance of communication. The Line Manager of a utilities company stated that ‘communication is paramount to successful change in the workplace’
5.4 Outcomes of the interventions When interviewees were asked if they felt that there had been any changes as a result of the interventions, in terms of working practices, absence, or attitudes, interviewees from organisations receiving both standard and tailored interventions described a variety of outcomes.
In terms of the effects of interventions on absence levels a number of interviewees noted that absence levels had decreased since the implementation of the interventions. The Manager of a utilities company stated that:
‘Absence has reduced - people tend to be at work more’
A number of interviewees stated that there had been a reduction in symptoms as a result of the interventions. A Health and Safety Advisor in the education sector stated:
‘Aches and pains have reduced we now have self issue machines so there are less books coming over the counter’
A Manager of a manufacturing company stated that: ‘We have a very low level of manual handling injuries at the moment’
Some interviewees noted an improvement in safety culture. A Manager of company in the transport and communications sector stated that:
‘There is an raised awareness, people will come straight to me’
There was also evidence of improved attitudes among the workforce as a Health and Safety Advisor in the delivery and manufacturing sector stated:
‘I think there has been a more accepting view of making changes following an accident or incident’
3939
6 SUMMARY AND CONCLUSIONS
This research project represents the first systematic attempt to apply the stage of change approach to the organisational context to improve health and safety. The aim was to determine if tailoring health and safety interventions according to recipients’ stage of change, results in greater effectiveness. The authors developed tools to measure organisational and worker stage of change and employed these tools in practice, to evaluate whether interventions can be made more effective by tailoring approaches according to managerial and worker stage of change.
The first phase of the research (Whysall, Haslam and Haslam, 2005) followed up 24 interventions for up to 6 months. Results showed that interventions tailored to manager and worker stage of change were significantly more effective on a number of levels: promoting risk-awareness, promoting progression through stages of change and reducing self reported musculoskeletal discomfort in a number of body areas. This report is based on longer-term follow-up periods of 15 and 20 months post-intervention.
6.1 STANDARD INTERVENTIONS
The impact of the standard interventions was relatively modest and reductions in symptoms were not manifested until 15 and 20 months
Findings at the 15 month follow up
• At 6 months there were significantly fewer workers in preparation compared to pre-intervention
• There were no significant differences between stages between 6 and 15 months • At 6 and 15 months there were no significant changes in the proportions of
respondents reporting discomfort in individual body areas• At 15 months there was a significant decrease in the number of workers reporting
discomfort in the upper limbs
Findings at 20 month follow up
• There were significantly fewer workers in preparation at 20 months compared to pre-intervention
• There were significantly more workers in action at 20 months compared to 15 months • At 20 months there were significant reductions in the number of respondents
reporting discomfort in the lower back and legs compared to pre-intervention• At 15 months there were significant reductions in the upper limbs and back and at 20
months in the lower limb and back compared to pre-intervention
6.2 TAILORED INTERVENTIONS
Findings at the 15 month follow up
• At 6 and 15 months there were significantly fewer workers in precontemplation and preparation and significantly more workers in the action and maintenance (compared to pre-intervention)
• There were no significant differences between 6 and 15 months post-intervention suggesting that the impact of the interventions has been maintained
• At 6 and 15 months there were significant reductions in the number of workers reporting discomfort in a wide range of individual body areas
4040

• There were further reductions in discomfort in individual body areas between 6 and 15 although these failed to reach significance
• At 6 and 15 months post-intervention there were significant reductions in the number of workers reporting discomfort in the upper limbs, lower limbs and back
• There was a further significant reduction in discomfort in the upper limbs between 6 and 15 months post-intervention
Findings at the 20 month follow up
• There were significantly fewer workers in precontemplation and preparation and more workers in action and maintenance compared to pre-intervention
• There were significant reductions in the numbers of workers reporting discomfort in three individual body areas at 6 months, 7 individual body areas at 15 months and 8 individual body areas at 20 months
• For most body areas there were further reductions in discomfort between 15 and 20 months post-intervention
• At 6 and 20 months there were significant reductions in discomfort in the upper limbs, legs and back compared to pre-intervention
• At 15 months there were significant reductions in the upper limbs and back compared to pre-intervention
• There were further significant reductions in the number of workers reporting discomfort in the lower limb and back between 15 and 20 months post-intervention
6.3 MANAGER INTERVIEWS The importance of attitudes and behaviour to the success of interventions was supported by the post-intervention interviews, as the most commonly cited barriers to the implementation of changes were the failure of employees to change their behaviour and the difficulties in obtaining managerial authorisation for intended changes. Similarly, the most commonly cited facilitators to the process of managing the risks of MSDs were management support and effective communication within the organisation.
6.4 WIDER IMPLICATIONS FOR THEORY AND PRACTICE With regards to the wider implications of this research, having demonstrated the effectiveness of the stage of change approach in relation to reducing the risks of MSDs, potential exists for improving the effectiveness of many other types of health and safety interventions through application of this approach (e.g. stress management, falls from height, violence in the workplace, use of personal protective equipment). Work-related stress is one occupational health problem that may be particularly appropriate, due to the importance of tackling both managerial and workers’ perceptions of, and attitudes towards, this issue.
Despite being one of the most common causes of occupational ill-health in this country, stress is an issue that organisations can be reluctant to tackle, perhaps due to scepticism or lack of knowledge regarding how stress can be managed. HSE have taken steps towards helping organisations understand how work-related stress can be reduced, through publication of the management standards. To promote the implementation of the information outlined by these standards, it is crucial that attitudes regarding stress are also tackled, to reduce the scepticism or reluctance that may inhibit some employers from taking action.
It is fundamental to the approach that stage of change can be assessed using just a small number of questions. It should be borne in mind, that the actual questions asked need to be systematically developed and assessed for validity and reliability (Haslam and Haslam, 2000; Whysall, Haslam and Haslam, 2005). An important observation from our research is that the stage of ‘contemplation’ seems to have less validity in the organisational context than the
4141
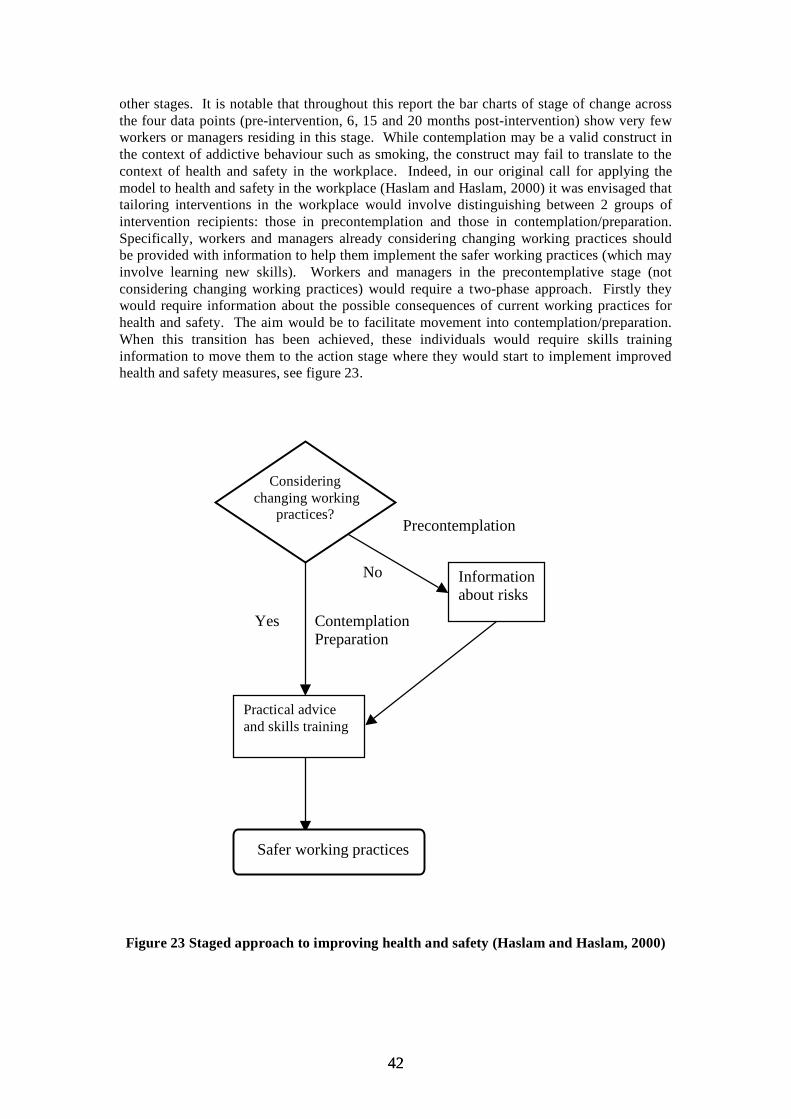
other stages. It is notable that throughout this report the bar charts of stage of change across the four data points (pre-intervention, 6, 15 and 20 months post-intervention) show very few workers or managers residing in this stage. While contemplation may be a valid construct in the context of addictive behaviour such as smoking, the construct may fail to translate to the context of health and safety in the workplace. Indeed, in our original call for applying the model to health and safety in the workplace (Haslam and Haslam, 2000) it was envisaged that tailoring interventions in the workplace would involve distinguishing between 2 groups of intervention recipients: those in precontemplation and those in contemplation/preparation. Specifically, workers and managers already considering changing working practices should be provided with information to help them implement the safer working practices (which may involve learning new skills). Workers and managers in the precontemplative stage (not considering changing working practices) would require a two-phase approach. Firstly they would require information about the possible consequences of current working practices for health and safety. The aim would be to facilitate movement into contemplation/preparation. When this transition has been achieved, these individuals would require skills training information to move them to the action stage where they would start to implement improved health and safety measures, see figure 23.
Considering changing working
practices?
Practical advice and skills training
Yes Contemplation Preparation
Information about risks
No
Precontemplation
Safer working practices
Figure 23 Staged approach to improving health and safety (Haslam and Haslam, 2000)
4242
The results we have obtained to date certainly suggest that in tailoring interventions to improve health and safety in the workplace it is only necessary to distinguishing between 2 groups of intervention recipients: those who do not recognise the health issue and who are not considering change (precontemplation) and those who do recognise the issue and are considering making changes to their working practices (contemplation/preparation). Future research could usefully determine the utility of the construct of contemplation in relation to other occupational health issues. On the basis of the evidence so far it seems that simplifying the stages as described above is a pragmatic approach which would facilitate the implementation of interventions in the organisational context.
6.5 CONCLUSIONS
The results presented in this report and our previous 2005 HSE report strongly support the calls for the application of the stage of change approach to occupational settings (e.g. Dejoy, 1996; Haslam & Haslam, 2000; Prochaska et al., 2001). The findings of this research suggest that the positive effects of interventions tailored according to manager and worker stage of change persist over a long period of time. Moreover, the qualitative findings also provide further insight into the specific knowledge, beliefs, and attitudes that are of importance to promoting change towards reducing the risks of MSDs in the workplace.
While the standard interventions demonstrated some impact on symptoms in the long term, tailored interventions had a far greater influence in changing behaviour and reducing MSD symptoms. The findings in this report demonstrate the effectiveness of tailored interventions over standard interventions in promoting behaviour change, attitude change and in reducing musculoskeletal discomfort.
Both behaviour change theory and practical recommendations highlight the need to ensure that change recipients possess the knowledge, attitudes, and beliefs that promote the adoption and maintenance of changes required to prevent MSDs. The work presented in this report and our previous report (Whysall, Haslam and Haslam, 2005) demonstrates that the stage of change model offers a practical framework that can be used to help guide the change process.
This work provides compelling evidence for the increased effectiveness of interventions that are tailored according to the recipient’s stage of change. Tailored interventions have been shown to significantly improve behaviour aimed at reducing the risk of MSDs and significantly reduce discomfort related to MSDs. Moreover we have demonstrated that the positive impact on behaviour and MSD symptoms produced by tailored interventions persist over a long-term period of follow-up. Wide-scale adoption of this approach could make a major contribution to reducing prevalence rates and incidence rates for MSDs, leading to substantial cost savings, reduced sickness absence and improvements in working practice.
4343
7 REFERENCES
Dejoy, D.M. (1996). Theoretical models of health behaviour and workplace self-protective behaviour. Journal of Safety Research, 27, 61-72.
DiClemente, C.C., Prochaska, J.O., Fairhurst, S.K., Velicier, W.F., Velasquez, M.M., & Rossi, J.S. (1991). The process of smoking cessation: An analysis of precontemplation, contemplation, and preparation stages of change. Journal of Consulting and Clinical Psychology, 59, 295-304.
Haslam, C., & Haslam, R. A. (2000). A stage specific approach to improving occupational health and safety. Proceedings of the XIVth Triennial Congress of the International Ergonomics Association and 44th Annual Meeting of the Human Factors and Ergonomics Society, 6, 253-255.
Health and Safety Commission (2005). Health and Safety Statistics 2004/2005. HSE Books: Sudbury, UK.
Health and Safety Commission (2004). Health and Safety Statistics Highlights 2003/04. HSE Books: Sudbury, UK.
Health and Safety Commission (2001). Health and Safety Statistics 2000/01. HSE Books: Sudbury, UK.
Health and Safety Commission (2000). Health and Safety Statistics 1999/2000. HSE Books: Sudbury, UK.
Health and Safety Executive (2002). Upper Limb Disorders in the Workplace. HSE Books: Sudbury, UK.
Karsh, B-T., Moro, F.B.P., & Smith, M.J. (2001). The efficacy of workplace ergonomic interventions to control musculoskeletal disorders: A critical analysis of the peer-reviewed literature. Theoretical Issues in Ergonomic Science, 2, 23-96.
Melhorn, J.M. (1996). A prospective study for upper-extremity cumulative trauma disorders of workers in aircraft manufacturing. Journal of Occupational and Environmental Medicine, 38, 1264-1271.
Miles, M.B., & Huberman, A.M. (1994). An Expanded Sourcebook. Qualitative Data Analysis. Sage: London.
Prochaska, J.O., & DiClemente, C.C. (1982). Transtheoretical therapy: Toward a more integrative model of change. Psychotherapy: Theory Research and Practice, 19, 276-288.
Prochaska, J.O., DiClemente, C.C., Velicier, W.F., & Rossi, J.S. (1993). Standardised, individualised, interactive, and personalised self-help programmes for smoking cessation. Health Psychology, 12, 399-405.
Prochaska, J.O., Norcross, J.C., & DiClemente, C.C. (1994). Changing for good. William Morrow & Co. Inc.: New York.
4444

Prochaska, J.M., Prochaska, J.O., & Levesque, D.A. (2001). A Transtheoretical approach to changing organisations. Administration and Policy in Mental Health, 28, 247-261.
Rakowski, W., Ehrich, B., Goldstein, M.G., Rimer, B.K., Pearlman, D.N., Clark, M.A., Velicier, W.F., & Woolverton, H. (1998). Increasing mammography among women aged 40-74 by use of a stage-matched, tailored intervention. Preventive Medicine, 27, 748-756.
Urlings, I. J. M., Nijboer, I.D., & Dul, J. (1990). A method for changing the attitudes and behavior of management and employees to stimulate the implementation of ergonomic improvements. Ergonomics, 33, 629-637.
Velicier, W.F., DiClemente, C.C., Prochaska, J.O., & Brandenberg, N. (1985). Decisional balance measure for assessing and predicting smoking status. Journal of Personality and Social Psychology, 48, 1279-1289.
Velicier, W.F., DiClemente, C.C., Rossi, & Prochaska, J.O. (1990). Relapse situations and self-efficacy: An integrative model. Addictive Behaviours, 15, 271-283.
Westgaard, R.H., & Winkel, J. (1997). Ergonomic intervention research for improved musculoskeletal health: A critical review. International Journal of Industrial Ergonomics, 20, 463-500.
Whysall, Z., Haslam, R. and Haslam, C. (2004). Processes, barriers and outcomes described by ergonomics consultants in preventing musculoskeletal disorders. Applied Ergonomics, 35, 343-351.
Whysall, Z.J., Haslam, C., & Haslam, R.A. (2005). A staged approach to reducing musculoskeletal disorders (MSDs) in the Workplace. HSE Research Report 379. HSE Books: Sudbury, UK.
World Health Organization. (1988). Health promotion for working populations. Report of a WHO expert committee, Technical Report Series 765. Geneva: WHO.
4545

APPENDIX 1
STANDARDISED INSTRUCTIONS
4646

Work-Related Musculoskeletal Problems Survey
This survey is part of a study for the Health and Safety Executive, looking at attitudes towards work-related musculoskeletal problems and their management. The study is being conducted by researchers from Loughborough University.
The term ‘musculoskeletal problems’ refers to a range of problems affecting the affecting the muscles, tendons, and other supporting structures of the body – that is, those affecting the arms and wrists such as repetitive strain injury, and also those affecting the back, neck and shoulders.
Please answer the following questions as accurately as you can.
All information is strictly confidential, and will be used only for research purposes.
Feedback will be given to [name of company] to help assess the causes of aches and pains affecting their employees.
Thank you
For further information about the study contact:
Kate Shaw, Loughborough University
Tel: 01509 228481 Email: [email protected]
4747

APPENDIX 2
STAGE OF CHANGE ASSESSMENT TOOLS
4848

MANAGERIAL STAGE OF CHANGE ASSESSMENT
1. Are you concerned about the risk of musculoskeletal problems in your organisation? Y/N
(Circle as appropriate)
2. Are you thinking about taking action to reduce the risk of musculoskeletal problems in the next 6 months? Y/ N (Circle as appropriate)
→ If no - please go to Question 5.
3. Do you have a clear idea of what you are going to do to reduce the risk of musculoskeletal problems in your company? Y/ N (Circle as appropriate)
4. Are you considering taking action to reduce the risk of musculoskeletal problems in the next month or two? Y/ N (Circle as appropriate)
5. Have any changes already been made? Y / N (Circle as appropriate)
→ If yes please go to Question 6. → If no - please go to Section 3.
6. Please describe what steps have been taken below (continue on reverse if necessary): ………………………………………………………………………………………………… ………………………………………………………………………………………………… ………………………………………………………………………………………………… ………………………………………………………………………………………………… ………………………………………………………………………………………………… ………………………………………………………………………………………………… ………………………………………………………………………………………………… ………………………………………………………………………………………………… ………………………………………………………………………………………………… ………………………………………………………………………………………………
7. How long ago were these changes implemented? ………..………….Yrs / Mths / Wks (Circle as appropriate)
8. If more than 6 months ago, is any further attention to the problem planned? Y / N (If yes, please describe what is planned) …………….……………………………………………………………..…..……….. ………………………………………………………………………………………
4949

WORKER STAGE OF CHANGE ASSESSMENT
1. Are you concerned about developing musculoskeletal problems from your work? Y / N (Circle as appropriate)
2. Do you think changes should be made to reduce the risk of musculoskeletal problems from your work in the next 6 months? Y / N (Circle as appropriate)
3. Do you think changes should be made in the next month or two? Y / N (Circle as appropriate)
4. Have you got any suggestions for changes that would reduce the strain of your work? ….…………………………………………..…………………………………………………… ………………………………………………………………………………………………… ……………………………………….…………………………..……………………………… ………………………………………………………….……………….….…………………… ………………………………………………………………………………..….……………… ….………………………………………………………………………………………….….… .….………………………………………………………………………………………………. .………………….….…………………………………………………………………………… ………………………………………………………………………..………………….….… ………………………………………………………………………………………………… ………………………………………………………………………………………………… …………………………………………
5. Has your employer made any changes to reduce the risk of musculoskeletal problems from your work? Y / N (Circle as appropriate)
6. Are you doing or have you done anything to reduce the risk? Y / N (Circle as appropriate)
7. If yes, please describe what you have done: ….…………………………………………..…………………………………………………… …………………………………………………………………………………………...……… …………………………………….…………………………..………………………………… ………………………………………………………………………………………………… …...…………………………………………….…………………………..…………………… …………………………………………………………………….……………….….………… …………………………………………………………………………………………..….…… ………………………………………………………………………………………………… ………..………………….….………………………………………………………………… …………………….………………………………..…………………………………………… ………………………………………………………………………………………………… ………………………………..(Continue on reverse if necessary)
8. How long ago did you make these changes?…………………………….. wks / mths / yrs (Circle as appropriate)
9. If more than 6 months ago, do you intend to do anything more? Y / N (If yes, please describe)
………………………………….…………………….………………………………………… …..………………………………………………………………………………………………
5050

APPENDIX 3
BACKGROUND INFORMATION SHEET
5151
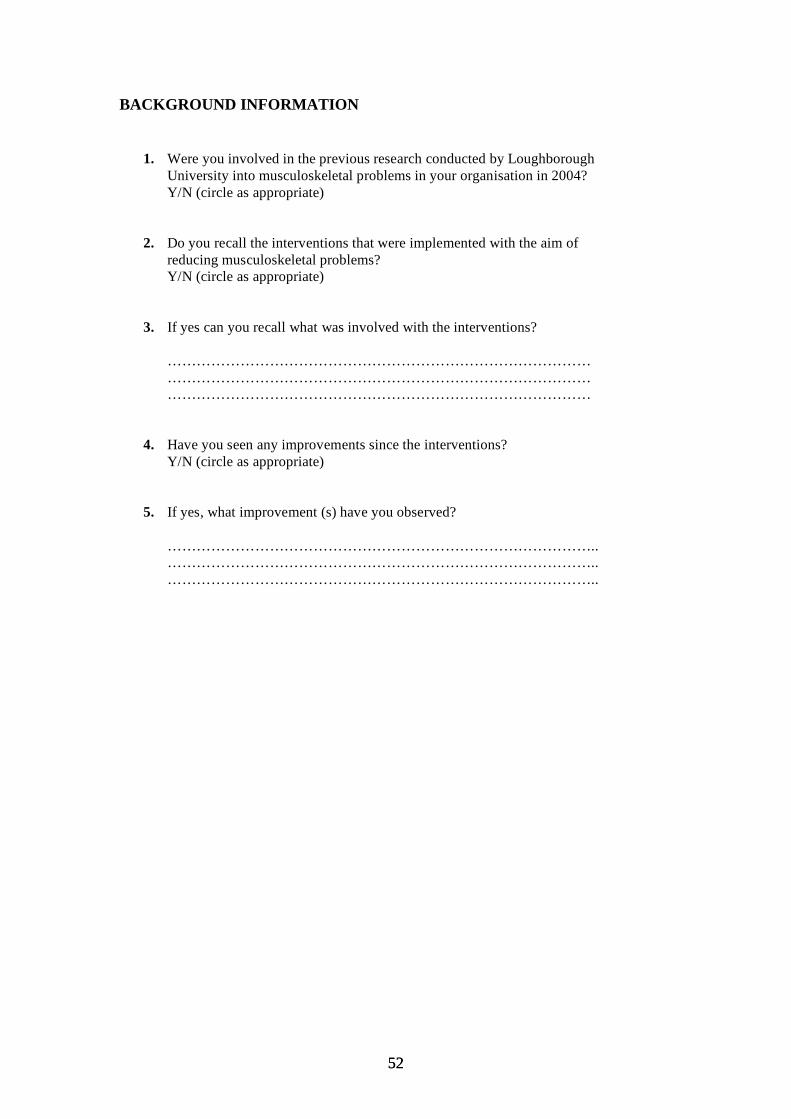
BACKGROUND INFORMATION
1. Were you involved in the previous research conducted by Loughborough University into musculoskeletal problems in your organisation in 2004? Y/N (circle as appropriate)
2. Do you recall the interventions that were implemented with the aim of reducing musculoskeletal problems? Y/N (circle as appropriate)
3. If yes can you recall what was involved with the interventions?
…………………………………………………………………………… …………………………………………………………………………… ……………………………………………………………………………
4. Have you seen any improvements since the interventions? Y/N (circle as appropriate)
5. If yes, what improvement (s) have you observed?
…………………………………………………………………………….. …………………………………………………………………………….. ……………………………………………………………………………..
5252

APPENDIX 4
SELF-REPORTED DISCOMFORT SCALE
5353
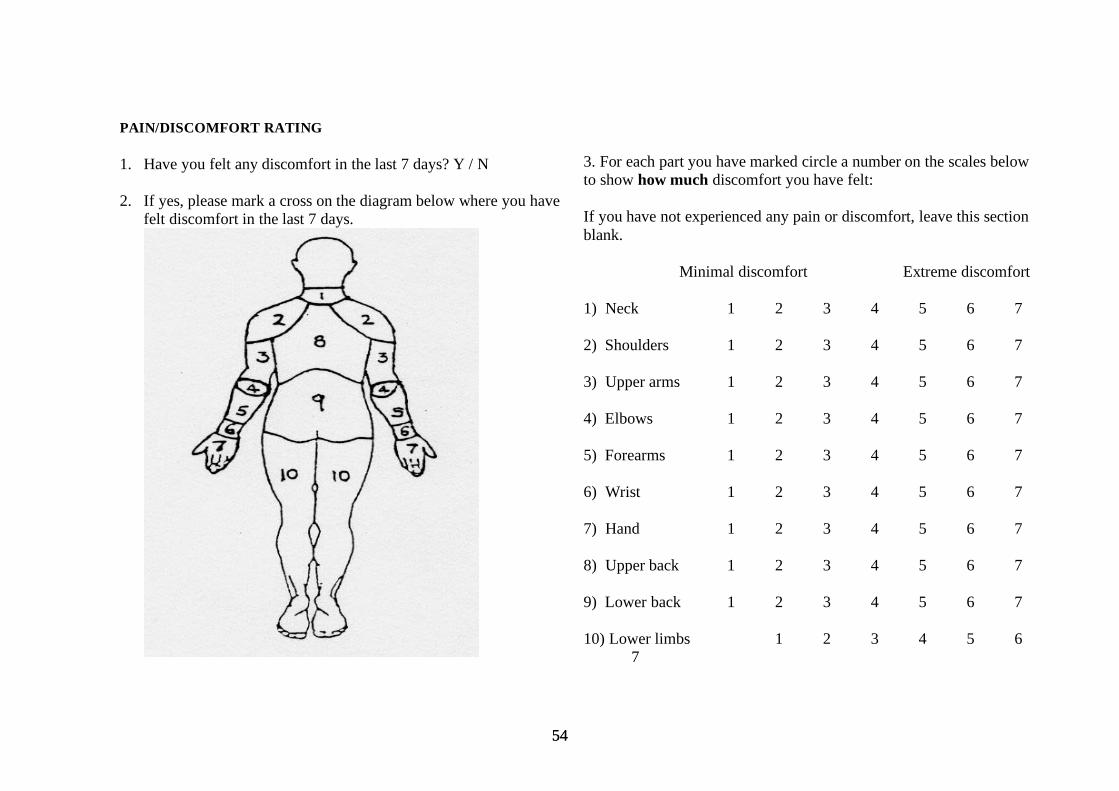
PAIN/DISCOMFORT RATING
1. Have you felt any discomfort in the last 7 days? Y / N
2. If yes, please mark a cross on the diagram below where you have felt discomfort in the last 7 days.
3. For each part you have marked circle a number on the scales below to show how much discomfort you have felt:
If you have not experienced any pain or discomfort, leave this section blank.
Minimal discomfort Extreme discomfort
1) Neck 1 2 3 4 5 6 7
2) Shoulders 1 2 3 4 5 6 7
3) Upper arms 1 2 3 4 5 6 7
4) Elbows 1 2 3 4 5 6 7
5) Forearms 1 2 3 4 5 6 7
6) Wrist 1 2 3 4 5 6 7
7) Hand 1 2 3 4 5 6 7
8) Upper back 1 2 3 4 5 6 7
9) Lower back 1 2 3 4 5 6 7
10) Lower limbs 1 2 3 4 5 6 7
5454

APPENDIX 5
ATTITUDES TOWARD MSDs
5555
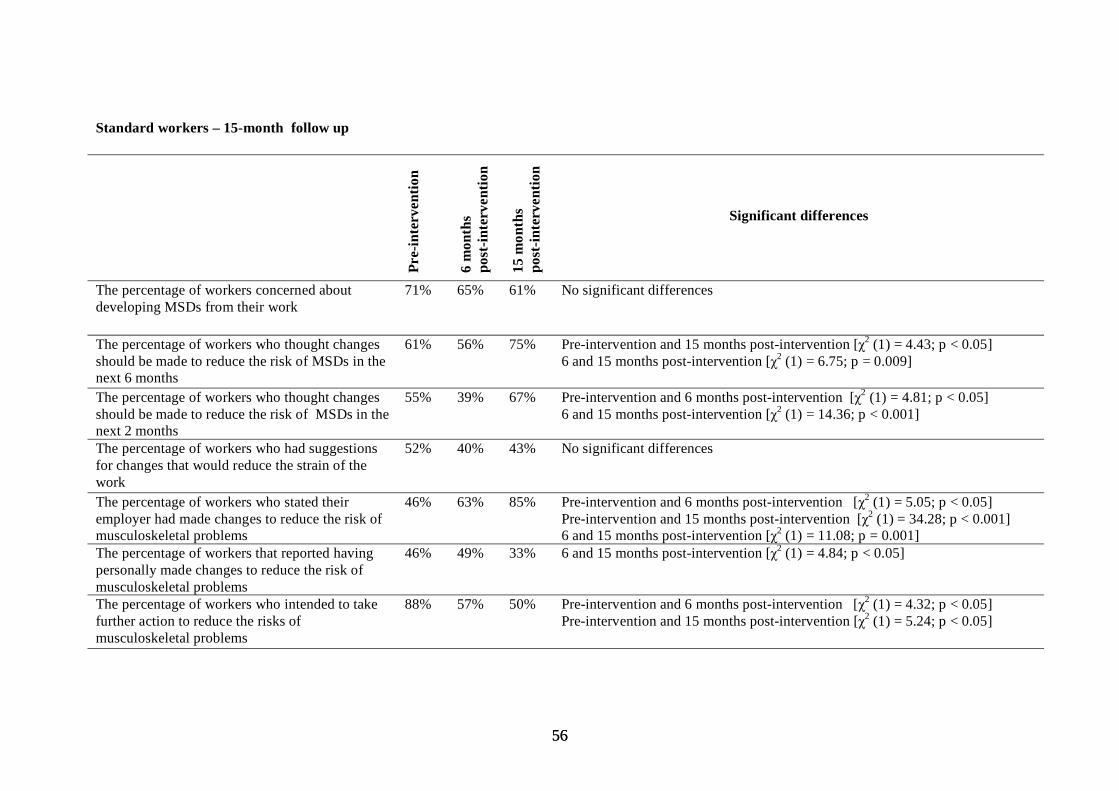
Standard workers – 15-month follow up
Pre-
inte
rven
tion
6 m
onth
s po
st-in
terv
entio
n
15 m
onth
s po
st-in
terv
entio
n
Significant differences
The percentage of workers concerned about 71% 65% 61% No significant differences developing MSDs from their work
The percentage of workers who thought changes should be made to reduce the risk of MSDs in the
61% 56% 75% Pre-intervention and 15 months post-intervention [χ2 (1) = 4.43; p < 0.05] 6 and 15 months post-intervention [χ2 (1) = 6.75; p = 0.009]
next 6 months The percentage of workers who thought changes should be made to reduce the risk of MSDs in the
55% 39% 67% Pre-intervention and 6 months post-intervention [χ2 (1) = 4.81; p < 0.05] 6 and 15 months post-intervention [χ2 (1) = 14.36; p < 0.001]
next 2 months The percentage of workers who had suggestions 52% 40% 43% No significant differences for changes that would reduce the strain of the work The percentage of workers who stated their employer had made changes to reduce the risk of musculoskeletal problems The percentage of workers that reported having
46%
46%
63%
49%
85%
33%
Pre-intervention and 6 months post-intervention [χ2 (1) = 5.05; p < 0.05] Pre-intervention and 15 months post-intervention [χ2 (1) = 34.28; p < 0.001] 6 and 15 months post-intervention [χ2 (1) = 11.08; p = 0.001] 6 and 15 months post-intervention [χ2 (1) = 4.84; p < 0.05]
personally made changes to reduce the risk of musculoskeletal problems The percentage of workers who intended to take further action to reduce the risks of
88% 57% 50% Pre-intervention and 6 months post-intervention [χ2 (1) = 4.32; p < 0.05] Pre-intervention and 15 months post-intervention [χ2 (1) = 5.24; p < 0.05]
musculoskeletal problems
5656
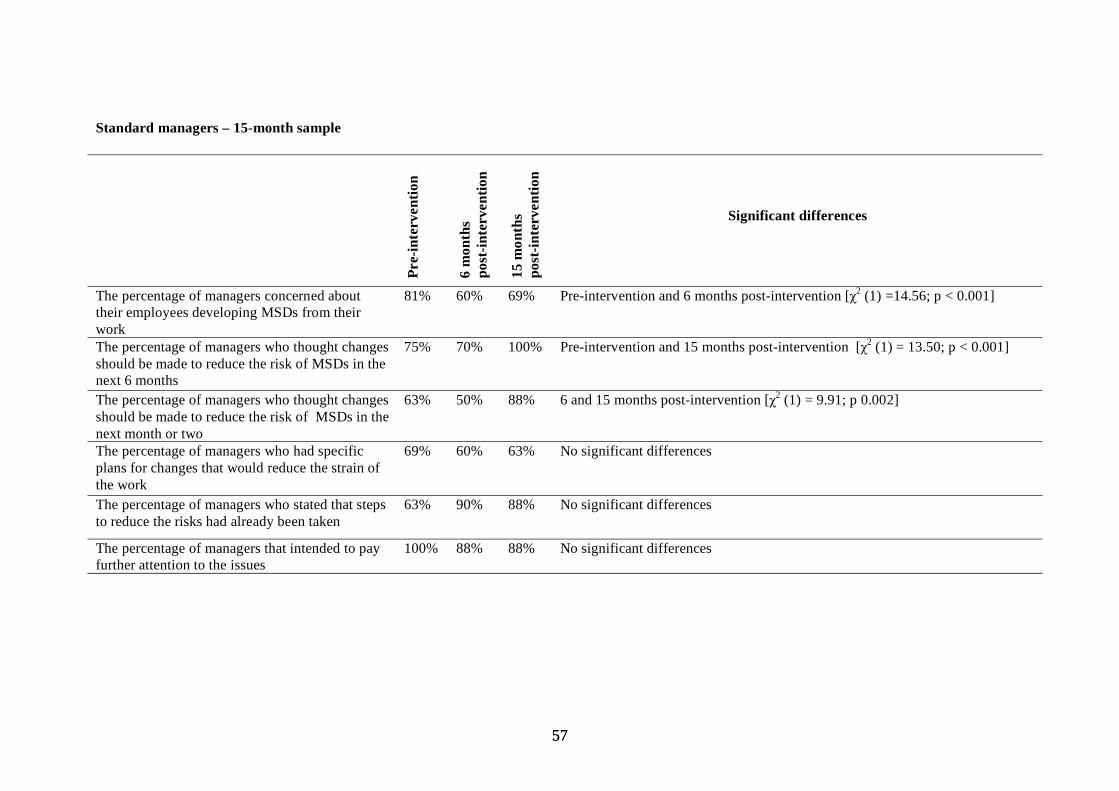
Standard managers – 15-month sample
Pre-
inte
rven
tion
6 m
onth
s po
st-in
terv
entio
n
15 m
onth
s po
st-in
terv
entio
n
Significant differences
The percentage of managers concerned about 81% 60% 69% Pre-intervention and 6 months post-intervention [χ2 (1) =14.56; p < 0.001]their employees developing MSDs from theirworkThe percentage of managers who thought changes 75% 70% 100% Pre-intervention and 15 months post-intervention [χ2 (1) = 13.50; p < 0.001]should be made to reduce the risk of MSDs in the next 6 monthsThe percentage of managers who thought changes 63% 50% 88% 6 and 15 months post-intervention [χ2 (1) = 9.91; p 0.002]should be made to reduce the risk of MSDs in thenext month or twoThe percentage of managers who had specific 69% 60% 63% No significant differences plans for changes that would reduce the strain of the work The percentage of managers who stated that steps 63% 90% 88% No significant differences to reduce the risks had already been taken
The percentage of managers that intended to pay 100% 88% 88% No significant differences further attention to the issues
5757
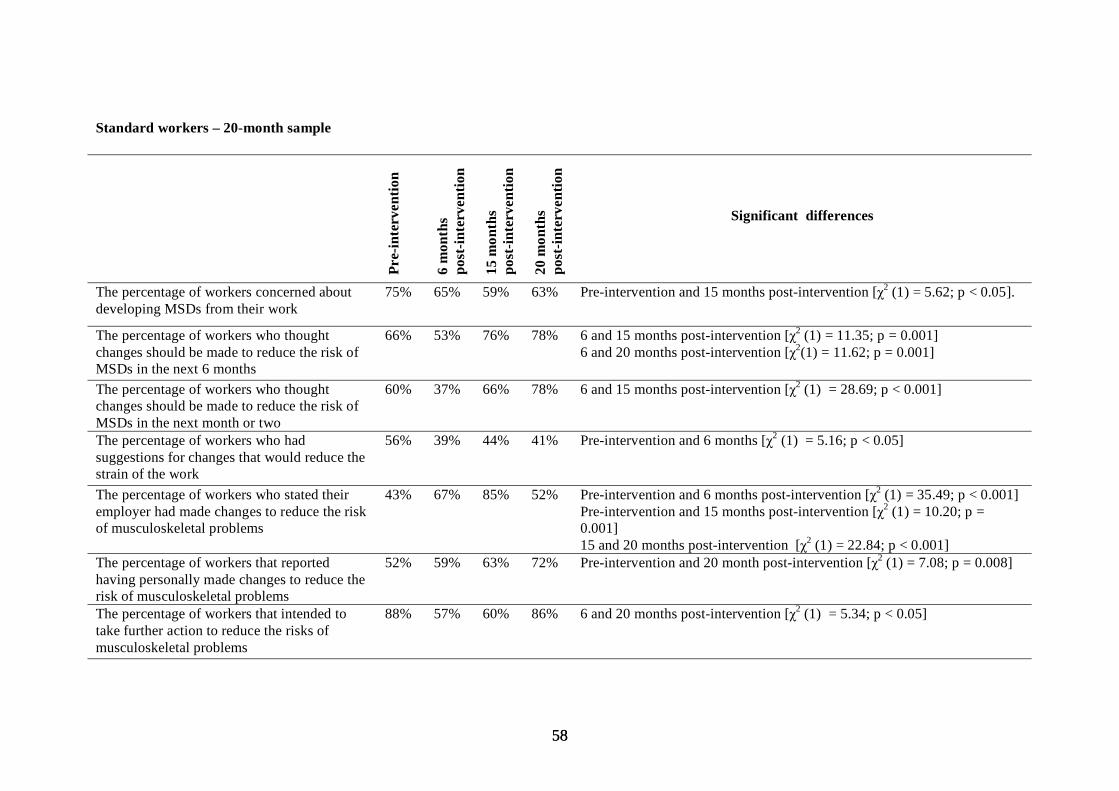
Standard workers – 20-month sample
Pre-
inte
rven
tion
6 m
onth
s po
st-in
terv
entio
n
15 m
onth
s po
st-in
terv
entio
n
20 m
onth
s po
st-in
terv
entio
n
Significant differences
The percentage of workers concerned about 75% 65% 59% 63% Pre-intervention and 15 months post-intervention [χ2 (1) = 5.62; p < 0.05]. developing MSDs from their work
The percentage of workers who thought 66% 53% 76% 78% 6 and 15 months post-intervention [χ2 (1) = 11.35; p = 0.001] changes should be made to reduce the risk of 6 and 20 months post-intervention [χ2(1) = 11.62; p = 0.001] MSDs in the next 6 months The percentage of workers who thought 60% 37% 66% 78% 6 and 15 months post-intervention [χ2 (1) = 28.69; p < 0.001] changes should be made to reduce the risk of MSDs in the next month or two The percentage of workers who had 56% 39% 44% 41% Pre-intervention and 6 months [χ2 (1) = 5.16; p < 0.05] suggestions for changes that would reduce the strain of the work The percentage of workers who stated their 43% 67% 85% 52% Pre-intervention and 6 months post-intervention [χ2 (1) = 35.49; p < 0.001] employer had made changes to reduce the risk Pre-intervention and 15 months post-intervention [χ2 (1) = 10.20; p = of musculoskeletal problems 0.001]
15 and 20 months post-intervention [χ2 (1) = 22.84; p < 0.001] The percentage of workers that reported 52% 59% 63% 72% Pre-intervention and 20 month post-intervention [χ2 (1) = 7.08; p = 0.008] having personally made changes to reduce the risk of musculoskeletal problems The percentage of workers that intended to 88% 57% 60% 86% 6 and 20 months post-intervention [χ2 (1) = 5.34; p < 0.05] take further action to reduce the risks of musculoskeletal problems
5858
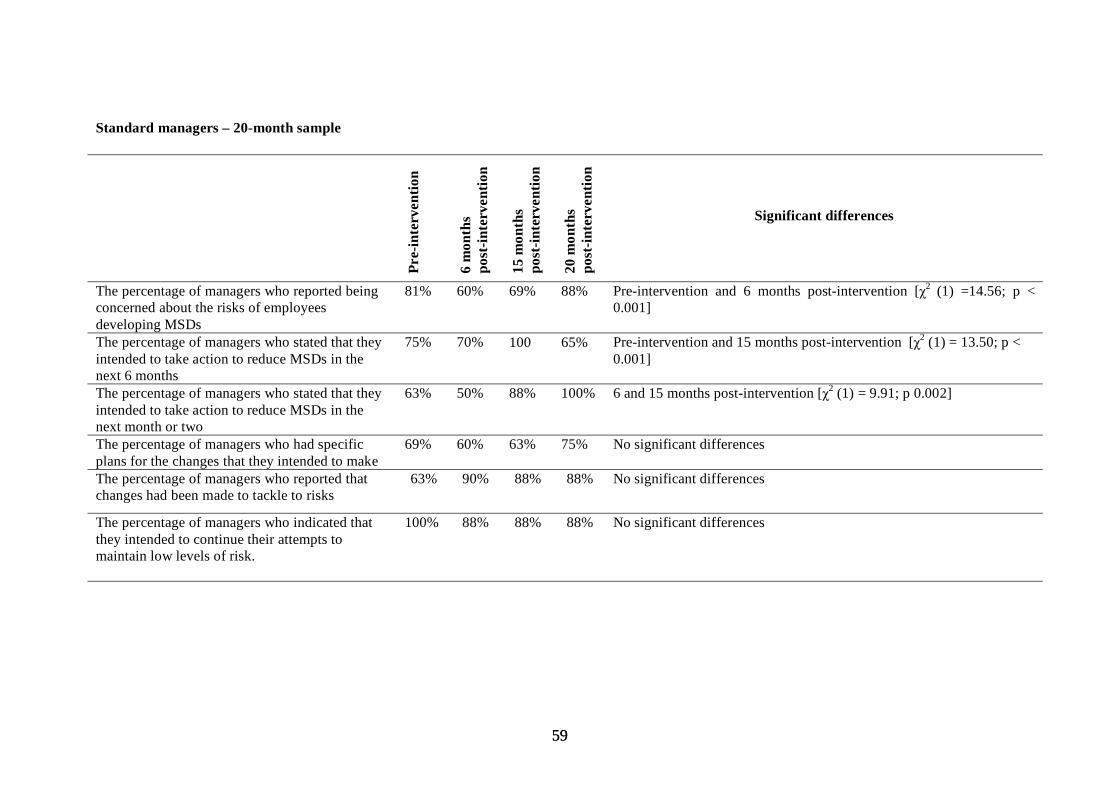
Standard managers – 20-month sample
Pre-
inte
rven
tion
6 m
onth
s po
st-in
terv
entio
n
15 m
onth
s po
st-in
terv
entio
n
20 m
onth
s po
st-in
terv
entio
n
Significant differences
The percentage of managers who reported being 81% 60% 69% 88% Pre-intervention and 6 months post-intervention [χ2 (1) =14.56; p <concerned about the risks of employees 0.001]developing MSDsThe percentage of managers who stated that they 75% 70% 100 65% Pre-intervention and 15 months post-intervention [χ2 (1) = 13.50; p <intended to take action to reduce MSDs in the 0.001]next 6 monthsThe percentage of managers who stated that they 63% 50% 88% 100% 6 and 15 months post-intervention [χ2 (1) = 9.91; p 0.002]intended to take action to reduce MSDs in the next month or twoThe percentage of managers who had specific 69% 60% 63% 75% No significant differences plans for the changes that they intended to make The percentage of managers who reported that 63% 90% 88% 88% No significant differences changes had been made to tackle to risks
The percentage of managers who indicated that 100% 88% 88% 88% No significant differences they intended to continue their attempts to maintain low levels of risk.
5959
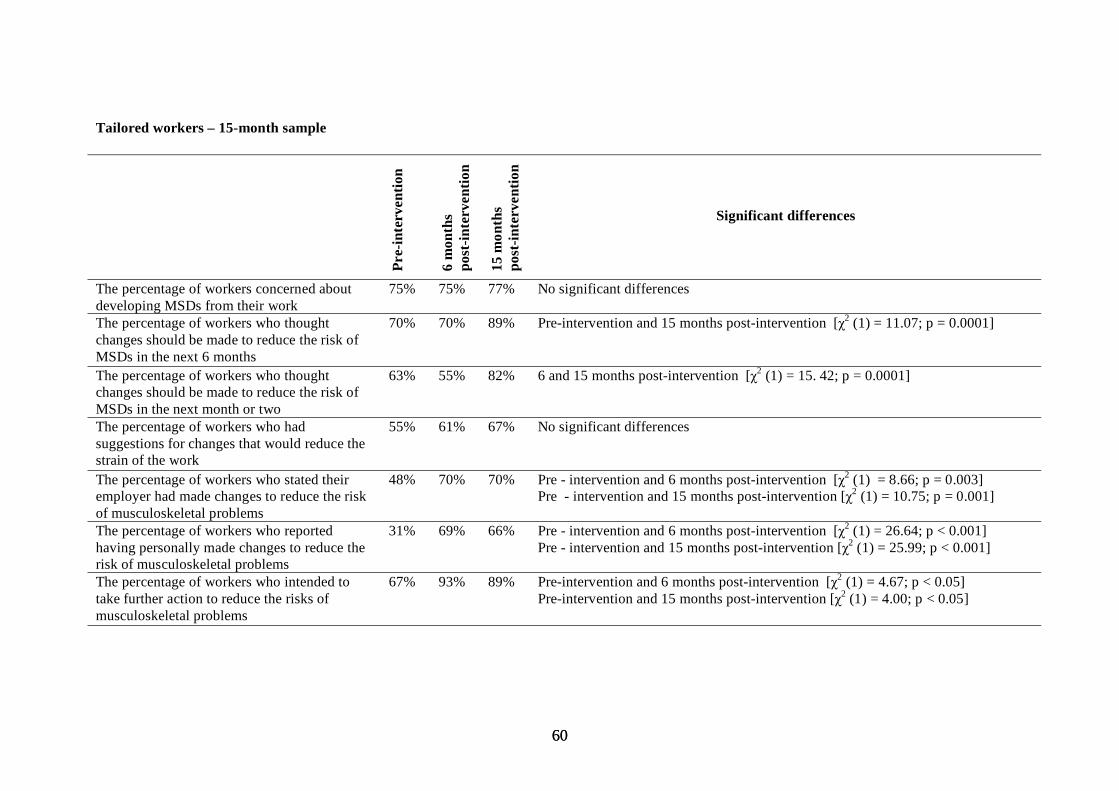
Tailored workers – 15-month sample
Pre-
inte
rven
tion
6 m
onth
s po
st-in
terv
entio
n
15 m
onth
s po
st-in
terv
entio
n
Significant differences
The percentage of workers concerned about 75% 75% 77% No significant differences developing MSDs from their work The percentage of workers who thought 70% 70% 89% Pre-intervention and 15 months post-intervention [χ2 (1) = 11.07; p = 0.0001] changes should be made to reduce the risk of MSDs in the next 6 months The percentage of workers who thought 63% 55% 82% 6 and 15 months post-intervention [χ2 (1) = 15. 42; p = 0.0001] changes should be made to reduce the risk of MSDs in the next month or two The percentage of workers who had 55% 61% 67% No significant differences suggestions for changes that would reduce the strain of the work The percentage of workers who stated their employer had made changes to reduce the risk
48% 70% 70% Pre - intervention and 6 months post-intervention [χ2 (1) = 8.66; p = 0.003] Pre - intervention and 15 months post-intervention [χ2 (1) = 10.75; p = 0.001]
of musculoskeletal problems The percentage of workers who reported having personally made changes to reduce the
31% 69% 66% Pre - intervention and 6 months post-intervention [χ2 (1) = 26.64; p < 0.001] Pre - intervention and 15 months post-intervention [χ2 (1) = 25.99; p < 0.001]
risk of musculoskeletal problems The percentage of workers who intended to take further action to reduce the risks of
67% 93% 89% Pre-intervention and 6 months post-intervention [χ2 (1) = 4.67; p < 0.05] Pre-intervention and 15 months post-intervention [χ2 (1) = 4.00; p < 0.05]
musculoskeletal problems
6060

Tailored managers – 15-month sample
Pre-
inte
rven
tion
6 m
onth
s po
st-in
terv
entio
n
15 m
onth
s po
st-in
terv
entio
n
Significant differences
The percentage of managers concerned about their 95% 89% 82% No significant differences employees developing MSDs from their work
The percentage of managers who thought changes 65% 67% 100% Pre-intervention and 15 months post-intervention [χ2 (1) = 6.41; p < 0.05] should be made to reduce the risk of MSDs in the next 6 months The percentage of managers who thought changes 45% 73% 100% Pre-intervention and 15 months post-intervention [χ2 (1) = 4.09; p < 0.05] should be made to reduce the risk of MSDs in the next month or two The percentage of managers who had specific plans 75% 78% 60% No significant differences for changes that would reduce the strain of the work The percentage of managers who stated that steps 70% 100% 77% No significant differences to reduce the risks had already been taken The percentage of managers who intended to pay 100% 100% 100% No significant differences further attention to the issues
6161

Tailored workers – 20-month sample
Pre-
inte
rven
tion
6 m
onth
s po
st-in
terv
entio
n
15 m
onth
s po
st-in
terv
entio
n
20 m
onth
s po
st-in
terv
entio
n
Significant differences
The percentage of workers concerned about 72% 70% 79% 82% No significant differences developing MSDs from their work
The percentage of workers who thought 65% 64% 88% 75% No significant differences changes should be made to reduce the risk of MSDs in the next 6 months The percentage of workers who thought 58% 47% 81% 67% 6 and 15 months post-intervention was significant [χ2 (1) = 19.27; p < changes should be made to reduce the risk of 0.001] MSDs in the next 2 months The percentage of workers who had suggestions for changes that would reduce the strain of the
47% 58% 64% 52% Pre-intervention and 15 months post-intervention [χ2 (1) = 5.14; p < 0.05] Pre-intervention and 6 months post-intervention [χ2 (1) = 9.08; p = 0.003]
work The percentage of workers who stated their 51% 75% 66% 62% Pre-intervention and 6 months post-intervention [χ2 (1) = 9.08; p = 0.003] employer had made changes to reduce the risk of musculoskeletal problems The percentage of workers that reported having personally made changes to reduce the risk of musculoskeletal problems
33% 73% 61% 71% Pre-intervention and 6 months post-intervention [χ2 (1) = 22.93; p < 0.001] Pre- and 15 months post-intervention [χ2 (1) = 13.30; p < 0.001] Pre and 20 months post-intervention [χ2 (1) = 24.67; p < 0.001].
The percentage of workers that intended to take 77% 92% 89% 86% No significant differences further action to reduce the risks of MSDs
6262
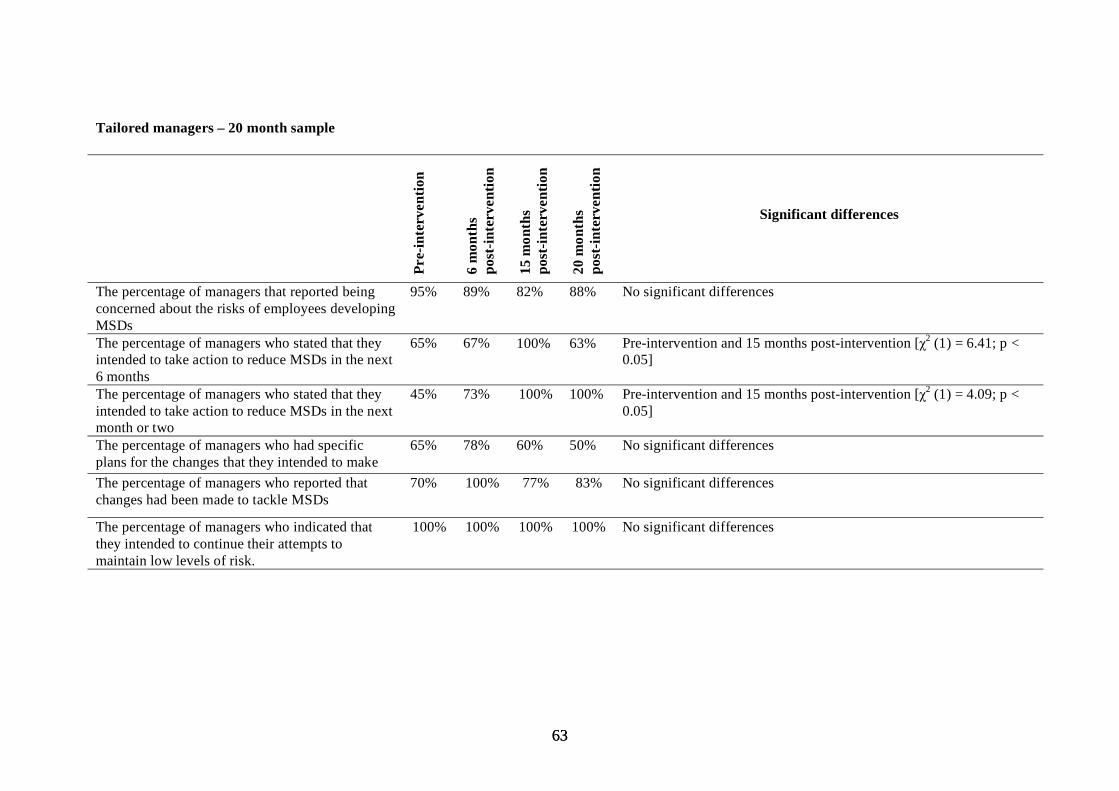
Tailored managers – 20 month sample
Pre-
inte
rven
tion
6 m
onth
s po
st-in
terv
entio
n
15 m
onth
s po
st-in
terv
entio
n
20 m
onth
s po
st-in
terv
entio
n
Significant differences
The percentage of managers that reported being 95% 89% 82% 88% No significant differences concerned about the risks of employees developing MSDs The percentage of managers who stated that they 65% 67% 100% 63% Pre-intervention and 15 months post-intervention [χ2 (1) = 6.41; p < intended to take action to reduce MSDs in the next 0.05] 6 months The percentage of managers who stated that they 45% 73% 100% 100% Pre-intervention and 15 months post-intervention [χ2 (1) = 4.09; p < intended to take action to reduce MSDs in the next 0.05] month or two The percentage of managers who had specific 65% 78% 60% 50% No significant differences plans for the changes that they intended to make The percentage of managers who reported that 70% 100% 77% 83% No significant differences changes had been made to tackle MSDs
The percentage of managers who indicated that 100% 100% 100% 100% No significant differences they intended to continue their attempts to maintain low levels of risk.
6363

APPENDIX 6
GUIDELINES FOR TAILORING INTERVENTIONS
6464

Staged Interventions Key beliefs Key barriers Key messages to convey Materials/Approaches
1. Precontemplation (not even considering changing) No need to change – not a Lack of awareness of risks Raising awareness of risks: severity Graphic information great risk & susceptibility Probability of illness/injury
Highlighting consequences: ill- Significance of injury/illness health & productivity/profit Case studies: claims/production/ absence
Photographs 2. Contemplation (thinking about changing) May be a need to change No sense of urgency Reinforce need for change Benefits of change
Efficacy of interventions Case studies/statistics – successful Benefits of change (cost etc) changes (reduced absence/increased
production) 3. Preparation (making definite plans to change) Making definite efforts to Lack of knowledge of the Practical advice on change process Advice on range of approaches change changes that should be made Value of large scale changes Most efficacious approach
Scepticism – change efficacy Skills training Reducing barriers (participation etc) Fear of change Efficacy of interventions/own ability Specific & realistic plans of action
4. Action (actually engaged in changing behaviour) Engaged in change efforts Perceived cost Ongoing advice Participation
Resistance to change Skills training Feedback Performance feedback & support Assistance with tools/equipment May be an initial increase in cases
5. Maintenance (working to prevent relapse or consolidate gains made) Working to keep the Complacency Continual efforts must be made to Reinforcement changes/improvements Belief that problem is solved prevent relapse Ongoing relationship with advisors
Risks are continually changing
6565

Published by the Health and Safety Executive 04/07
Health and Safety Executive
A staged approach to reducing musculoskeletal disorders (MSDs) in the workplace A long term followup Musculoskeletal disorders (MSDs) remain the most common form of occupational illhealth in Great Britain. Recent research by the authors (Whysall, Haslam and Haslam, 2005) involved the development and evaluation of a new and innovative approach to reducing MSDs. These authors applied a model from health psychology (stage of change model) to develop interventions more closely matched to worker and manager stage of change. Twenty four interventions were monitored within a variety of organisations for up to six months. Tailored interventions (matched to stage of change) were found to be more effective in promoting riskawareness, promoting behaviour change aimed at reducing risks, and in reducing selfreported musculoskeletal discomfort in a number of body areas.
The study described in this report involved a longerterm followup at 15 months postintervention and at 20 months postintervention to ascertain whether the improvements seen at 6 months persist in the longer term. The results show that the benefits in behaviour change and symptom reduction persist over a longer period of followup. Tailored interventions were found to be more effective in promoting behaviour change and reducing selfreported musculoskeletal discomfort over a 20 month followup period.
These findings suggest that scope exists for improving the success of interventions by tailoring advice according to stage of change. This approach increases the uptake, implementation, and maintenance of riskreducing measures.
This report and the work it describes were funded by the Health and Safety Executive (HSE). Its contents, including any opinions and/or conclusions expressed, are those of the authors alone and do not necessarily reflect HSE policy.
RR545
www.hse.gov.uk