Embed Size (px)
Citation preview
Practical Assessment, Research, and Evaluation Practical Assessment, Research, and Evaluation
Volume 24 Volume 24, 2019 Article 6
2019
A State Level Analysis of the Marzano Teacher Evaluation Model: A State Level Analysis of the Marzano Teacher Evaluation Model:
Predicting Teacher Value-Added Measures with Observation Predicting Teacher Value-Added Measures with Observation
Scores Scores
Lindsey Devers Basileo
Michael Toth
Follow this and additional works at: https://scholarworks.umass.edu/pare
Recommended Citation Recommended Citation Basileo, Lindsey Devers and Toth, Michael (2019) "A State Level Analysis of the Marzano Teacher Evaluation Model: Predicting Teacher Value-Added Measures with Observation Scores," Practical Assessment, Research, and Evaluation: Vol. 24 , Article 6. DOI: https://doi.org/10.7275/cc5b-6j43 Available at: https://scholarworks.umass.edu/pare/vol24/iss1/6
This Article is brought to you for free and open access by ScholarWorks@UMass Amherst. It has been accepted for inclusion in Practical Assessment, Research, and Evaluation by an authorized editor of ScholarWorks@UMass Amherst. For more information, please contact [email protected].
A peer-reviewed electronic journal.
Copyright is retained by the first or sole author, who grants right of first publication to Practical Assessment, Research & Evaluation. Permission is granted to distribute this article for nonprofit, educational purposes if it is copied in its entirety and the journal is credited. PARE has the right to authorize third party reproduction of this article in print, electronic and database forms.
Volume 24 Number 6, July 2019 ISSN 1531-7714
A State Level Analysis of the Marzano Teacher Evaluation Model: Predicting Teacher Value-Added Measures with
Observation Scores
Lindsey Devers Basileo & Michael Toth, Learning Sciences International
The purpose of the study is to close the gap in the literature regarding the Marzano Teacher Evaluation Model (MTEM) that lacks large scale empirical investigations to assess the predictability of the model. The study thoroughly reviews the extant literature from all teacher evaluation frameworks, particularly focusing on the large body of published studies that have investigated the correlations between teacher observation ratings and teacher value-added measures, then outlines the literature specific to the MTEM. The study extracted observation ratings from a collection platform and linked it to the Florida Department of Education teacher value-added measure, which controls for prior testing history and student-level characteristics. The study sample included over 12,000 teachers and validated the use of the MTEM, particularly in Florida, by upholding the magnitude of correlations found in other instructional frameworks and demonstrating that observation ratings were the largest predictor in multilevel models accounting for student, teacher and school level characteristics.
Improving student achievement remains a national priority as demonstrated by the United States’ national education law, Every Student Succeeds Act (ESSA 2015). The new law builds upon the previous reauthorization known as No Child Left Behind (NCLB 2002) to identify key areas of progress and advance equity for high needs students. States and school districts across the nation have been responding to the legislative reforms by including evaluative measurement systems for teachers and principals (Alger, 2012; Auguste, Kihn, & Miller, 2010; Bill & Melinda Gates Foundation, 2012; Renter, 2012). These systems call for higher accountability for teachers and a focus on improved educator effectiveness and student learning. Teacher evaluation systems are critical to these movements as they are the formal process a school uses to review and rate teachers’ performance and effectiveness. Moreover, the findings from evaluations are used to provide feedback to teachers and guide professional development, which in turn should positively impact
student achievement and improve equity. Teacher evaluations systems are integral to meeting the national priorities set forth in ESSA, particularly if teacher evaluation and observation scores ratings are predictive of student achievement.
The current study will investigate the relationship between teacher observation ratings and teacher value-added measures using three years of data to assess correlation levels in the state of Florida. We also use hierarchical linear modeling to test whether observation scores predict teacher value-added measures. Value-added measures, sometimes also referred to as growth measures, are used to estimate how much positive or negative impact teachers have on students’ achievement during a given school year. Value-added models aim to isolate a teacher’s contribution by controlling for student, classroom and school-level measures, thereby making it possible to study individual growth and compare teachers in different classrooms and schools fairly. The study builds upon the current literature by
1
Basileo and Toth: A State Level Analysis of the Marzano Teacher Evaluation Model: P
Published by ScholarWorks@UMass Amherst, 2019
Practical Assessment, Research & Evaluation, Vol 24 No 6 Page 2 Basileo & Toth, Predicting Teacher Value-Added with Observation Scores
using observation scores collected from an evaluation framework, the Marzano Teacher Evaluation Model (MTEM), which is widely used in Florida yet has received little attention in the scientific community in regards to its ability to reliably predict teacher value-added measures (Basileo, Toth, & Kennedy, 2015).
In order to contextualize the findings of this study, we will first describe teacher evaluation systems in Florida. Second, we will summarize the evidence from all teacher evaluation frameworks, particularly focusing on the large body of published studies that have investigated the correlations between teacher observation ratings and teacher value-added measures. Correlation analyses are necessary to assess predictability, strength and direction of observational instruments. It is important to note that while many states and districts want evidence that they have chosen the correct framework, the major focus of this research is not to identify a framework that is superior. It is to establish the magnitude of effect for all frameworks and to provide evidence of the predictability of the MTEM. The literature review will also go beyond correlation studies and include the research base specific to the MTEM. Third, the data and methods used in this study will be presented. Fourth, the results section will include findings from the correlation analysis and the hierarchical linear model that tests the assumption that observation ratings predict teacher value-added measures. Lastly, the conclusion section will discuss the limitations of the study and future areas of research.
Background
Florida Statutes (Section 1012.34, F.S.) requires school districts to establish procedures for evaluating the performance of instructional, administrative, and supervisory personnel, with the goal of increasing student academic performance by improving the quality of services provided in public schools. Performance evaluations must be conducted for each instructional employee at least once a year, and twice a year for newly hired teachers in their first year of teaching. Each district must have an evaluation system that is based on research in effective educational practices. Evaluation systems should support continuous improvement of effective instruction and student learning growth. Florida statute requires that school districts implement personnel evaluations that are based on several criteria, two of which are teacher instructional practice and the performance of their students.
Student performance is measured by the required state assessments or a local assessment in non-state tested subjects. In Florida, state assessment data are the basis for value-added models. The models measure the difference in each student’s actual performance on the statewide assessment from that student’s expected performance, which accounts for student and classroom factors that impact the learning process. Aggregated value-added measures are created and averaged to the individual teacher in order to then create a teacher value-added measure. Teacher value-added measures are public information in the state of Florida and are the outcome of interest in this study. In addition to student performance, a teacher instructional practice score is created, and it includes teachers’ ratings from their formal observations conducted throughout the school year.
In 2011, the Florida Department of Education (FLDOE) adopted the MTEM as the state model. However, each district was able to choose the model they preferred to use to evaluate the teachers. In 2014-15, there were 29 districts in Florida using the MTEM as their evaluation system, with an additional 14 districts implementing a hybrid model incorporating parts of the MTEM, and 10 districts using only some indicators from the model. The remaining 19 districts implemented the Framework for Teaching by Charlotte Danielson. Because the MTEM is the dominant model in Florida, it is essential to assess the predictability, strength, and direction of observational instrument for teacher evaluation in a real-world setting.
The MTEM draws from the foundational concepts and research articulated in Robert Marzano’s The Art and Science of Teaching (2007), and from earlier works including What Works in Schools (Marzano, 2003), Classroom Instruction that Works (Marzano, Pickering, & Pollock, 2001), Classroom Management that Works (Marzano, Marzano, & Pickering, 2003), and Classroom Assessment and Grading that Work (Marzano, 2006). The model incorporates 41 research-based elements. When teachers use these elements at the correct level of implementation, student achievement should increase. The model includes a developmental system where teachers can continuously improve their skills over time (Marzano, 2007). It is designed to measure teacher skill at a discrete point in time and provide the resources and coaching necessary to improve teacher skill over the course of a teacher’s career. The model is founded on
2
Practical Assessment, Research, and Evaluation, Vol. 24 [2019], Art. 6
https://scholarworks.umass.edu/pare/vol24/iss1/6DOI: https://doi.org/10.7275/cc5b-6j43
Practical Assessment, Research & Evaluation, Vol 24 No 6 Page 3 Basileo & Toth, Predicting Teacher Value-Added with Observation Scores
three main concepts (Marzano, Schooling, & Toth, 2012):
1. The purpose of evaluation is to measure teacher effectiveness and to advance teacher performance.
2. Effective teaching is a leading indicator for improving student performance.
3. The model should show correlations between the elements within the model and teacher effectiveness.
The current study will empirically test the second hypothesis of the MTEM. Specifically, that effective teaching, as measured by teacher observation scores, positively predicts student performance, as measured by teacher value-added scores.
Literature Review
The purpose of the literature review is twofold. First, we want to establish the current literature across all evaluation models regarding the magnitude of effect of teacher observation scores on teacher value-added measures. This will lay the foundation for the relative impact of all established models. Second, we want to go beyond teacher observation ratings and value-added measures to establish the level of evidence specific to the MTEM.
Observation Scores and Teacher Value-Added
Measures
A literature review was conducted that included correlation results using an observation score or teacher evaluation rating and a value-added measure. Studies needed to report an overall correlation between the two measures for the full study sample. Correlations were not typically the major focus of the studies and were not always reported. Consequently, there is the possibility that studies were missed through the search. Coefficients are classified in magnitude using Cohen's (1988) conventions to interpret effect sizes of .10, .50, and .80 standard deviations as small, moderate, and large. As Bloom and colleagues (2008) point out, these guidelines are not always relevant to intervention effects in education; however, they may be used when there is no better basis for estimating the magnitude of impact across studies (Cohen, 1988).
In our review of the literature, the following models were used most often to investigate the relationship between observation scores and student achievement:
• The Framework for Teaching (FFT) developed by Charlotte Danielson or a modified version of the framework
• The Mathematical Quality of Instruction (MQI) developed at the University of Michigan and Harvard University
• The Protocol for Language Arts Teaching Observation (PLATO) developed at Stanford University
There were a variety of other observation rubrics that were found in the literature but were not as commonly used, including:
• The Classroom Assessment Scoring System (CLASS) measure developed at the University of Virginia
• The Quality Science Teaching (QST) instrument developed at Stanford University
• The Marzano Teacher Evaluation Model (MTEM) outlined in The Art and Science of Teaching developed by Dr. Robert Marzano.
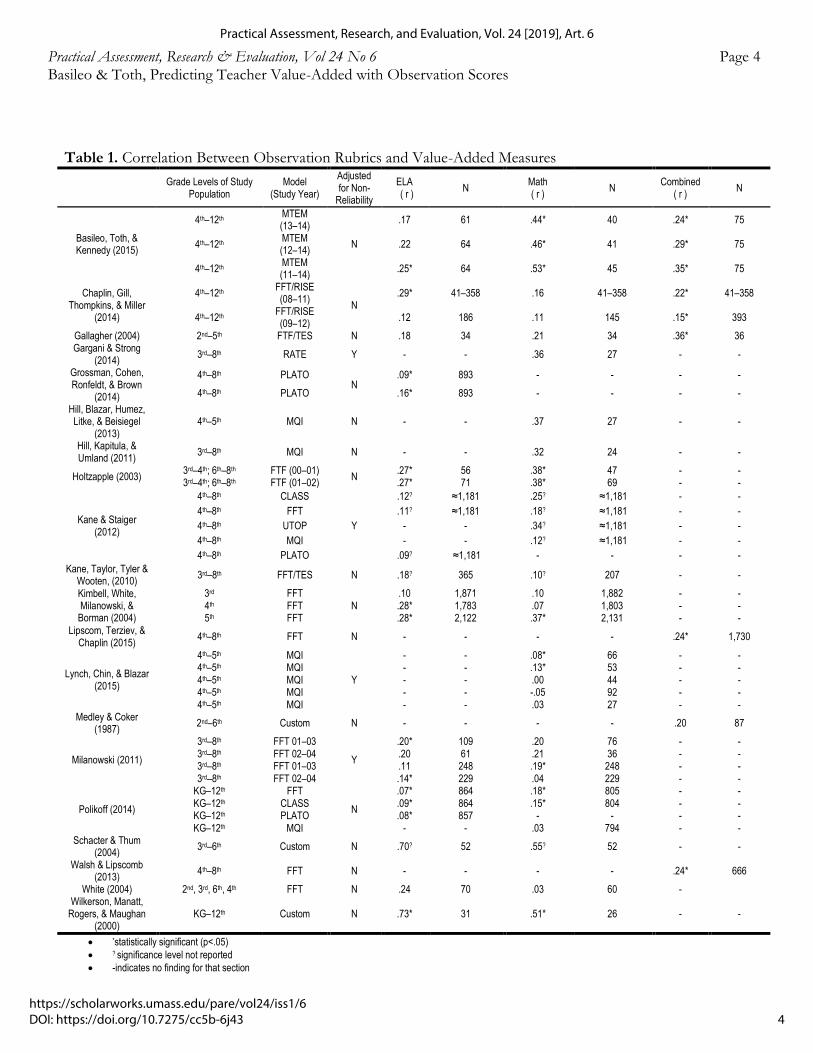
Table 1 illustrates the findings from the literature review. Each study is listed, followed by the grade level of the study population; the observation framework name and year if multiple study populations were used; whether the study adjusted for non-reliability; subject area; and approximate sample size. The major finding from the compilation shows that regardless of the rubric employed, most coefficients are classified as small to moderate in magnitude. Almost all associations are positive, indicating that as observation scores increase, so do teacher value-added measures (except for Lynch, Chin, & Blazar, 2015). After removing studies that did not specify a significance value (Kane & Staiger, 2012; Kane, Taylor, Tyler, & Wooten, 2010; Schacter & Thum, 2004), 64 percent of the coefficients were statistically significant in ELA and 43 percent were statistically significant in math.
Moreover, 93 percent of the coefficients in ELA were small and 7 percent were large. For math, 68 percent were small, 24 percent were moderate, and 9 percent were large. Six studies out of nine studies reported a combined ELA and math value-added
3
Basileo and Toth: A State Level Analysis of the Marzano Teacher Evaluation Model: P
Published by ScholarWorks@UMass Amherst, 2019
Practical Assessment, Research & Evaluation, Vol 24 No 6 Page 4 Basileo & Toth, Predicting Teacher Value-Added with Observation Scores
Table 1. Correlation Between Observation Rubrics and Value-Added Measures
Grade Levels of Study Population
Model (Study Year)
Adjusted for Non-
Reliability
ELA ( r )
N Math ( r )
N Combined
( r ) N
Basileo, Toth, & Kennedy (2015)
4th–12th MTEM (13–14)
N
.17 61 .44* 40 .24* 75
4th–12th MTEM (12–14)
.22 64 .46* 41 .29* 75
4th–12th MTEM (11–14)
.25* 64 .53* 45 .35* 75
Chaplin, Gill, Thompkins, & Miller
(2014)
4th–12th FFT/RISE (08–11)
N .29* 41–358 .16 41–358 .22* 41–358
4th–12th FFT/RISE (09–12)
.12 186 .11 145 .15* 393
Gallagher (2004) 2nd–5th FTF/TES N .18 34 .21 34 .36* 36 Gargani & Strong
(2014) 3rd–8th RATE Y - - .36 27 - -
Grossman, Cohen, Ronfeldt, & Brown
(2014)
4th–8th PLATO N
.09* 893 - - - -
4th–8th PLATO .16* 893 - - - -
Hill, Blazar, Humez, Litke, & Beisiegel
(2013) 4th–5th MQI N - - .37 27 - -
Hill, Kapitula, & Umland (2011)
3rd–8th MQI N - - .32 24 - -
Holtzapple (2003) 3rd–4th; 6th–8th FTF (00–01)
N .27* 56 .38* 47 - -
3rd–4th; 6th–8th FTF (01–02) .27* 71 .38* 69 - -
Kane & Staiger (2012)
4th–8th CLASS
Y
.12? ≈1,181 .25? ≈1,181 - -
4th–8th FFT .11? ≈1,181 .18? ≈1,181 - -
4th–8th UTOP - - .34? ≈1,181 - -
4th–8th MQI - - .12? ≈1,181 - -
4th–8th PLATO .09? ≈1,181 - - - -
Kane, Taylor, Tyler & Wooten, (2010)
3rd–8th FFT/TES N .18? 365 .10? 207 - -
Kimbell, White, Milanowski, & Borman (2004)
3rd FFT N
.10 1,871 .10 1,882 - - 4th FFT .28* 1,783 .07 1,803 - - 5th FFT .28* 2,122 .37* 2,131 - -
Lipscom, Terziev, & Chaplin (2015)
4th–8th FFT N - - - - .24* 1,730
Lynch, Chin, & Blazar (2015)
4th–5th MQI
Y
- - .08* 66 - - 4th–5th MQI - - .13* 53 - - 4th–5th MQI - - .00 44 - - 4th–5th MQI - - -.05 92 - - 4th–5th MQI - - .03 27 - -
Medley & Coker (1987)
2nd–6th Custom N - - - - .20 87
Milanowski (2011)
3rd–8th FFT 01–03
Y
.20* 109 .20 76 - - 3rd–8th FFT 02–04 .20 61 .21 36 - - 3rd–8th FFT 01–03 .11 248 .19* 248 - - 3rd–8th FFT 02–04 .14* 229 .04 229 - -
Polikoff (2014)
KG–12th FFT
N
.07* 864 .18* 805 - - KG–12th CLASS .09* 864 .15* 804 - - KG–12th PLATO .08* 857 - - - - KG–12th MQI - - .03 794 - -
Schacter & Thum (2004)
3rd–6th Custom N .70? 52 .55? 52 - -
Walsh & Lipscomb (2013)
4th–8th FFT N - - - - .24* 666
White (2004) 2nd, 3rd, 6th, 4th FFT N .24 70 .03 60 - Wilkerson, Manatt,
Rogers, & Maughan (2000)
KG–12th Custom N .73* 31 .51* 26 - -
*statistically significant (p<.05)
? significance level not reported
-indicates no finding for that section
4
Practical Assessment, Research, and Evaluation, Vol. 24 [2019], Art. 6
https://scholarworks.umass.edu/pare/vol24/iss1/6DOI: https://doi.org/10.7275/cc5b-6j43
Practical Assessment, Research & Evaluation, Vol 24 No 6 Page 5 Basileo & Toth, Predicting Teacher Value-Added with Observation Scores
measure that averages the effects of ELA and math together (Basileo, Toth, & Kennedy, 2015; Chaplin, Gill, Thompkins, & Miller, 2014; Gallagher, 2004; Lipscomb, Terziev, & Chaplin, 2015; Medley & Coker, 1987; Walsh & Lipscomb, 2013). Of the nine findings that had a combined value-added measure, 89 percent were statistically significant, 78 percent were small, and 22 percent were moderate in size.
Most studies analyzed the Danielson rubric (FFT), followed by the MQI and PLATO. Other rubrics found throughout the literature used custom forms (Medley & Coker, 1987; Schacter & Thum, 2004; Wilkerson, Manatt, Rogers, & Maughan, 2000). Those studies saw some of the largest correlations between observation scores and teacher value-added measures. Schacter and Thum (2004) found large correlations between teacher value-added scores and observational measures, from .55 to .70. In that study, graduate research teams trained teachers in their models, measured teacher compliance, and conducted experimental and quasi-experimental studies (Schacter & Thum, 2004). While these correlations were large, studies using custom forms are more difficult to compare to standardized rubrics as the data are collected on a small sample of teachers with specialized training. Only one study used the MTEM (Basileo, Toth, & Kennedy, 2015) to collect observation scores and they found small to large correlations after principals completed a series of trainings on the model. Overall, smaller scale studies seemed to find larger correlation levels. This could be due to training required to increase fidelity to the model and smaller scale studies may include more error in the estimates.
An additional moderating factor was included in Table 1 to account for variations across observational systems. Instrument use and the practice of observing teachers can vary widely across schools and districts. For example, there is a wide variation in the number of elements or items scored in and across observations. Moreover, the number of lessons observed, and the number of different observers or raters, can vary greatly by school or district. Failing to specify these important criteria can impact the reliability of the estimates even when there is reliability between raters (Hill, Charalambouse, & Kraft, 2012). Several studies adjusted for non-reliability in their estimates (Gargani & Strong, 2014; Kane & Staiger, 2012; Lynch, Chin, & Blazar, 2015; Milanowski, 2011). For those studies, deattenuated
correlations are reported rather than the raw correlations.
While the studies included in this investigation focused on observation scores, isolating the effects of observation scores proved difficult in some cases. For example, the FFT observation score often constituted only part of the final evaluation score. Sometimes student portfolio scores constituted the other portion, making it difficult to untangle the magnitude of the relationship from the observation score alone (Gargani & Strong, 2014). Furthermore, it was difficult to determine how strongly observations would have correlated on their own (Borman & Kimball, 2004; Gallagher, 2004; Holtzapple, 2003; Kane, Taylor, Tyler, & Wooten, 2010; Milanowski, 2004; White, 2004). It should also be noted that when possible, composite evaluation scores were not reported because the focus of the study was on the impact of the observation score alone—not composite measures of teacher effectiveness.
Several of the studies involved data from the Measures of Effective Teachers Project (Grossman, Cohen, Ronfeldt, & Brown, 2014; Kane & Staiger, 2012; Polikoff, 2014), which used the same study populations. To not skew the findings, the same study populations were avoided whenever possible. For example, the studies by Kimball, White, Milanowski, and Borman (2004), Gallagher (2004), and Milanowski (2011) were reported in Table 1, while some studies were excluded because they reported using the same populations for the same year (Heneman, Milanowski, Kimball, & Odden, 2006; Milanowski, 2004; Milanowski, Kimball, & Odden, 2005). Furthermore, there were some studies cited in the literature that reported having correlation coefficients; however, upon further investigation, there was no coefficient reported between the predictor and outcome measure that met the criteria for inclusion in this review (Allen, Gregory, Lun, Hamre, & Pianta, 2012; Walkington & Marder, 2013).
In sum, across all studies, small to moderate correlations were found between observation scores and teacher value-added measures. Almost all associations were positive. 64 percent of the coefficients were statistically significant in ELA and 43 percent were statistically significant in math. Most of the studies analyzed observation data from the Danielson framework (FFT) followed by the MQI. A major issue worth noting concerns the practice of observing
5
Basileo and Toth: A State Level Analysis of the Marzano Teacher Evaluation Model: P
Published by ScholarWorks@UMass Amherst, 2019
Practical Assessment, Research & Evaluation, Vol 24 No 6 Page 6 Basileo & Toth, Predicting Teacher Value-Added with Observation Scores
teachers, which varied across all studies, and could impact the reliability of the estimates when comparing effect sizes. When looking only at those studies that controlled for non-reliability, correlation coefficients were small, except for Gargani and Strong (2014), which used a small sample (n=37). Next, prior research specific to the MTEM will be discussed.
The Marzano Teacher Evaluation Model
There are several small-scale studies that have investigated the validity of the MTEM. First, a meta-analysis conducted by Haystead and Marzano (2009) synthesized approximately 300 small scale studies conducted at the Marzano Research Laboratory, and indicated that on average, the elements within the model were associated with an effect size of .42. When corrected for attenuation, the percentile gain associated with the use of the instructional elements was 16 percentile points over what would be expected if teachers did not use the instructional elements.
Second, a study conducted by the Marzano Research Laboratory (2011) investigated correlations among elements scored during observations and compared those scores to student reading and math proficiency scores. The sample size was small, ranging from 19 to 54 teachers. The study found small to moderate correlations across the 41 elements in the model and that the number of elements used by teachers had a positive relationship with mathematics and reading proficiency.
Additionally, a study by Alexander (2016) investigated the school level relationship between the school value-added measure and average teacher evaluation ratings in 29 districts implementing the MTEM in Florida. The evaluation ratings included observational scores and other factors associated with teacher evaluations. Across three years of data, they found small and statistically significant correlations across the schools.
Overall, there are few studies that assess the correlations between teacher observation scores and student achievement using the MTEM. Moreover, there are even fewer studies that investigate the impact of implementation on student achievement using large-scale samples. The largest sample reported in Table 1 is from Kimbell, White, Milanowski, and Borman (2004) and that study included about 2,100 teachers. Large-scale implementations are imperative when frameworks are
utilized within state evaluation systems to assess whether observations cores are predictive in real-world settings. While frameworks should hold promise regardless of the amount of training received, the magnitude of coefficients should be higher where models are implemented with fidelity.
The MTEM is a dominant teacher evaluation framework used in Florida. Despite the use of the model, there is little quantitative research on it to date. Next, correlation coefficients for the MTEM will be investigated using teacher observation ratings and value-added measures collected in the state of Florida using three years of data (2012–13, 2013–14, and 2014–15). Then, the analysis will use the 2013–14 dataset where teacher characteristics were available to determine whether the teacher observation score predicts the state value-added measure score controlling for teacher, observation system, and school level characteristics.
Data and Methods
This section will outline the outcome variables used in the models. Then, the predictor variables used in the study will be discussed. Last, the matching results between the two datasets will be presented.
Outcome Variable: Teacher Value-Added
Measures
The dependent variables were obtained from the Florida Department of Education (FLDOE). The secondary dataset included aggregated teacher value-added measures in ELA, math, and a combined value-added measure for three years (2012-13, 2013-14, and 2014-15). The FLDOE value-added model estimates the effectiveness of a teacher by isolating the contribution of the teacher to student learning. Students’ predicted scores are based on the prior testing history and student-level characteristics, compared to how well other students in the state perform in that same grade level.
The value-added modeling techniques implemented in Florida are covariate adjustment models that include up to two prior assessment scores (except in Grade 4 where only one prior assessment is available, as Florida state testing does not begin until third grade), and a set
of characteristics for students. The models use error‐
in‐variables regression to account for the measurement
error in the covariates. The control variables in the model at the student level include the following: prior achievement measure(s), the number of subject-relevant
6
Practical Assessment, Research, and Evaluation, Vol. 24 [2019], Art. 6
https://scholarworks.umass.edu/pare/vol24/iss1/6DOI: https://doi.org/10.7275/cc5b-6j43
Practical Assessment, Research & Evaluation, Vol 24 No 6 Page 7 Basileo & Toth, Predicting Teacher Value-Added with Observation Scores
courses, English Learner (EL) status, gifted status, student attendance, student mobility, difference in modal age of the grade level, class size, and homogeneity
of students’ entering test scores. These variables are
incorporated in the FLDOE model to isolate differences in teachers’ classrooms. Below is an excerpt from the Florida Value-Added Model Technical Report (2013, pp. 6), which describes the formula used.
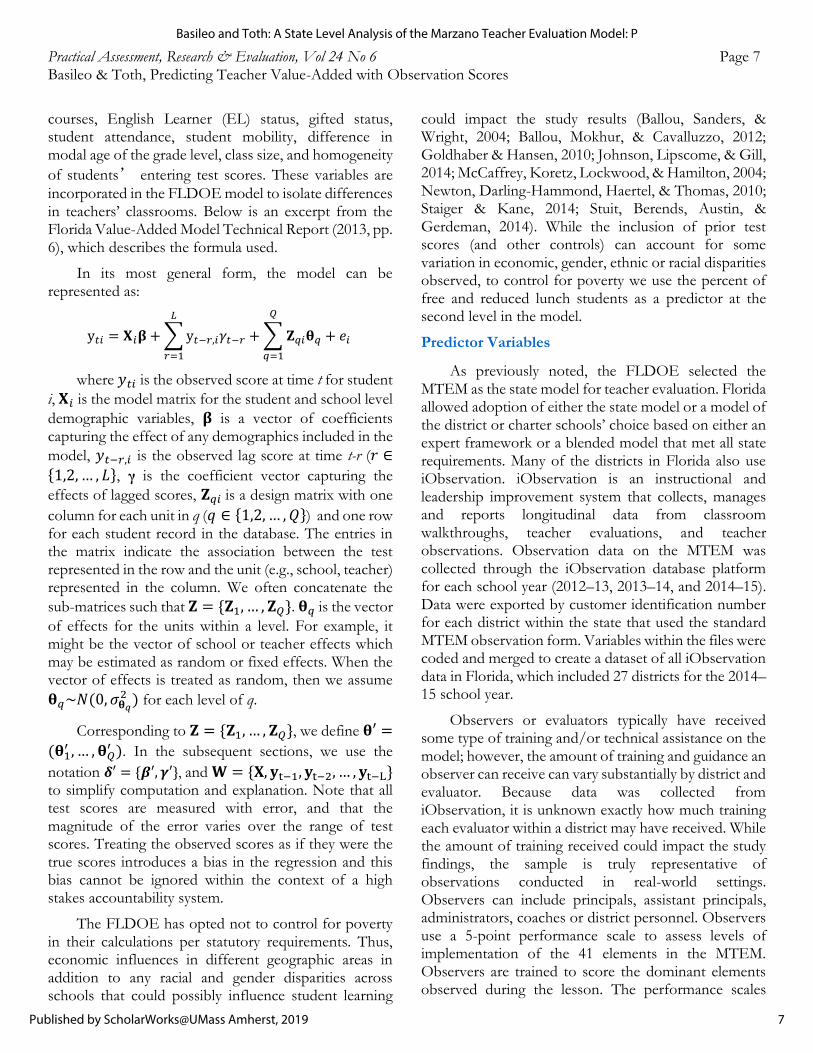
In its most general form, the model can be represented as:
y𝑡𝑖 = 𝐗𝑖𝛃 + ∑ y𝑡−𝑟,𝑖𝛾𝑡−𝑟
𝐿
𝑟=1
+ ∑ 𝐙𝑞𝑖𝛉𝑞
𝑄
𝑞=1
+ 𝑒𝑖
where 𝑦𝑡𝑖 is the observed score at time t for student
i, 𝐗𝑖 is the model matrix for the student and school level
demographic variables, 𝛃 is a vector of coefficients capturing the effect of any demographics included in the
model, 𝑦𝑡−𝑟,𝑖 is the observed lag score at time t-r (𝑟 ∈{1,2, … , 𝐿}, γ is the coefficient vector capturing the
effects of lagged scores, 𝐙𝑞𝑖 is a design matrix with one
column for each unit in q (𝑞 ∈ {1,2, … , 𝑄}) and one row for each student record in the database. The entries in the matrix indicate the association between the test represented in the row and the unit (e.g., school, teacher) represented in the column. We often concatenate the
sub-matrices such that 𝐙 = {𝐙1, … , 𝐙𝑄}. 𝛉𝑞 is the vector
of effects for the units within a level. For example, it might be the vector of school or teacher effects which may be estimated as random or fixed effects. When the vector of effects is treated as random, then we assume
𝛉𝑞~𝑁(0, 𝜎𝛉𝑞
2 ) for each level of q.
Corresponding to 𝐙 = {𝐙1, … , 𝐙𝑄}, we define 𝛉′ =
(𝛉1′ , … , 𝛉𝑄
′ ). In the subsequent sections, we use the
notation 𝜹′ = {𝜷′, 𝜸′}, and 𝐖 = {𝐗, 𝐲t−1, 𝐲t−2, … , 𝐲t−L} to simplify computation and explanation. Note that all test scores are measured with error, and that the magnitude of the error varies over the range of test scores. Treating the observed scores as if they were the true scores introduces a bias in the regression and this bias cannot be ignored within the context of a high stakes accountability system.
The FLDOE has opted not to control for poverty in their calculations per statutory requirements. Thus, economic influences in different geographic areas in addition to any racial and gender disparities across schools that could possibly influence student learning
could impact the study results (Ballou, Sanders, & Wright, 2004; Ballou, Mokhur, & Cavalluzzo, 2012; Goldhaber & Hansen, 2010; Johnson, Lipscome, & Gill, 2014; McCaffrey, Koretz, Lockwood, & Hamilton, 2004; Newton, Darling-Hammond, Haertel, & Thomas, 2010; Staiger & Kane, 2014; Stuit, Berends, Austin, & Gerdeman, 2014). While the inclusion of prior test scores (and other controls) can account for some variation in economic, gender, ethnic or racial disparities observed, to control for poverty we use the percent of free and reduced lunch students as a predictor at the second level in the model.
Predictor Variables
As previously noted, the FLDOE selected the MTEM as the state model for teacher evaluation. Florida allowed adoption of either the state model or a model of the district or charter schools’ choice based on either an expert framework or a blended model that met all state requirements. Many of the districts in Florida also use iObservation. iObservation is an instructional and leadership improvement system that collects, manages and reports longitudinal data from classroom walkthroughs, teacher evaluations, and teacher observations. Observation data on the MTEM was collected through the iObservation database platform for each school year (2012–13, 2013–14, and 2014–15). Data were exported by customer identification number for each district within the state that used the standard MTEM observation form. Variables within the files were coded and merged to create a dataset of all iObservation data in Florida, which included 27 districts for the 2014–15 school year.
Observers or evaluators typically have received some type of training and/or technical assistance on the model; however, the amount of training and guidance an observer can receive can vary substantially by district and evaluator. Because data was collected from iObservation, it is unknown exactly how much training each evaluator within a district may have received. While the amount of training received could impact the study findings, the sample is truly representative of observations conducted in real-world settings. Observers can include principals, assistant principals, administrators, coaches or district personnel. Observers use a 5-point performance scale to assess levels of implementation of the 41 elements in the MTEM. Observers are trained to score the dominant elements observed during the lesson. The performance scales
7
Basileo and Toth: A State Level Analysis of the Marzano Teacher Evaluation Model: P
Published by ScholarWorks@UMass Amherst, 2019
Practical Assessment, Research & Evaluation, Vol 24 No 6 Page 8 Basileo & Toth, Predicting Teacher Value-Added with Observation Scores
provide a developmental continuum for teachers on five levels of proficiency:
Not Using (0)
Beginning (1)
Developing (2)
Applying (3)
Innovating (4).
For example, in the element “Identifying Critical Content,” the Not Using level (0) indicates the teacher should be identifying critical content but is not. The Beginning level (1), indicates the teacher is attempting to identify critical content but is doing it with error. The Developing level (2), is when the teacher is accurately identifying critical content from the lesson but the majority of the students in the class cannot identify the critical content based on student evidence. At the Applying level (3), the teacher is using the element correctly and the majority of students in the class can identify the critical content. At the highest level, Innovating (4), the teacher uses the student results to make adaptations as needed so that more than 90 percent of students demonstrate they can identify the critical content. Teachers may be scored on any of the 41 elements and the evaluative observation(s) is included in their end of year teacher evaluation.
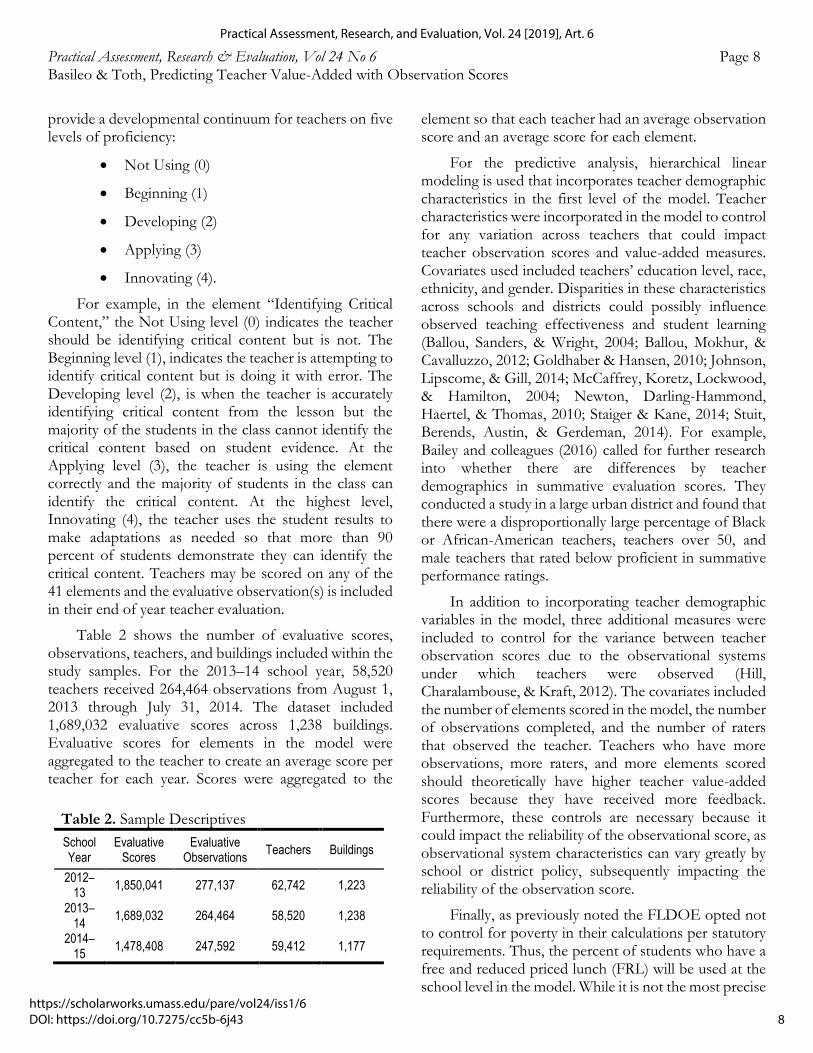
Table 2 shows the number of evaluative scores, observations, teachers, and buildings included within the study samples. For the 2013–14 school year, 58,520 teachers received 264,464 observations from August 1, 2013 through July 31, 2014. The dataset included 1,689,032 evaluative scores across 1,238 buildings. Evaluative scores for elements in the model were aggregated to the teacher to create an average score per teacher for each year. Scores were aggregated to the
element so that each teacher had an average observation score and an average score for each element.
For the predictive analysis, hierarchical linear modeling is used that incorporates teacher demographic characteristics in the first level of the model. Teacher characteristics were incorporated in the model to control for any variation across teachers that could impact teacher observation scores and value-added measures. Covariates used included teachers’ education level, race, ethnicity, and gender. Disparities in these characteristics across schools and districts could possibly influence observed teaching effectiveness and student learning (Ballou, Sanders, & Wright, 2004; Ballou, Mokhur, & Cavalluzzo, 2012; Goldhaber & Hansen, 2010; Johnson, Lipscome, & Gill, 2014; McCaffrey, Koretz, Lockwood, & Hamilton, 2004; Newton, Darling-Hammond, Haertel, & Thomas, 2010; Staiger & Kane, 2014; Stuit, Berends, Austin, & Gerdeman, 2014). For example, Bailey and colleagues (2016) called for further research into whether there are differences by teacher demographics in summative evaluation scores. They conducted a study in a large urban district and found that there were a disproportionally large percentage of Black or African-American teachers, teachers over 50, and male teachers that rated below proficient in summative performance ratings.
In addition to incorporating teacher demographic variables in the model, three additional measures were included to control for the variance between teacher observation scores due to the observational systems under which teachers were observed (Hill, Charalambouse, & Kraft, 2012). The covariates included the number of elements scored in the model, the number of observations completed, and the number of raters that observed the teacher. Teachers who have more observations, more raters, and more elements scored should theoretically have higher teacher value-added scores because they have received more feedback. Furthermore, these controls are necessary because it could impact the reliability of the observational score, as observational system characteristics can vary greatly by school or district policy, subsequently impacting the reliability of the observation score.
Finally, as previously noted the FLDOE opted not to control for poverty in their calculations per statutory requirements. Thus, the percent of students who have a free and reduced priced lunch (FRL) will be used at the school level in the model. While it is not the most precise
Table 2. Sample Descriptives
School Year
Evaluative Scores
Evaluative Observations
Teachers Buildings
2012–13
1,850,041 277,137 62,742 1,223
2013–14
1,689,032 264,464 58,520 1,238
2014–15
1,478,408 247,592 59,412 1,177
8
Practical Assessment, Research, and Evaluation, Vol. 24 [2019], Art. 6
https://scholarworks.umass.edu/pare/vol24/iss1/6DOI: https://doi.org/10.7275/cc5b-6j43
Practical Assessment, Research & Evaluation, Vol 24 No 6 Page 9 Basileo & Toth, Predicting Teacher Value-Added with Observation Scores
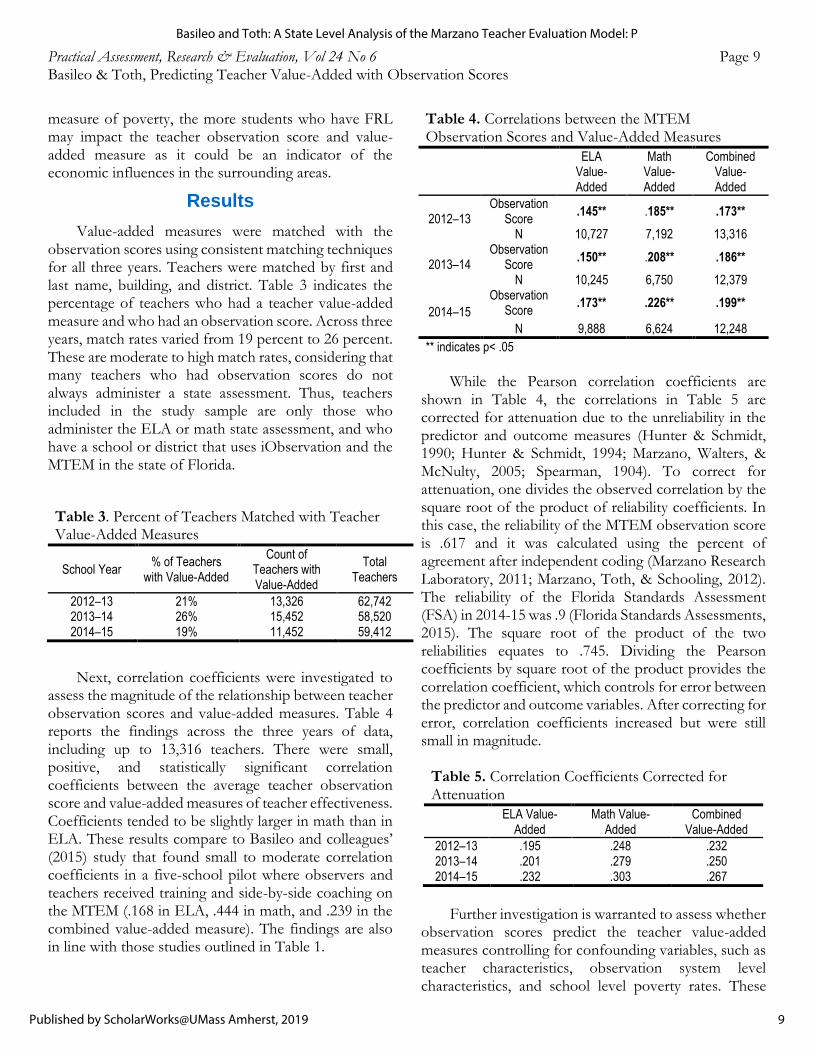
measure of poverty, the more students who have FRL may impact the teacher observation score and value-added measure as it could be an indicator of the economic influences in the surrounding areas.
Results
Value-added measures were matched with the observation scores using consistent matching techniques for all three years. Teachers were matched by first and last name, building, and district. Table 3 indicates the percentage of teachers who had a teacher value-added measure and who had an observation score. Across three years, match rates varied from 19 percent to 26 percent. These are moderate to high match rates, considering that many teachers who had observation scores do not always administer a state assessment. Thus, teachers included in the study sample are only those who administer the ELA or math state assessment, and who have a school or district that uses iObservation and the MTEM in the state of Florida.
Table 3. Percent of Teachers Matched with Teacher Value-Added Measures
School Year % of Teachers
with Value-Added
Count of Teachers with Value-Added
Total Teachers
2012–13 21% 13,326 62,742 2013–14 26% 15,452 58,520 2014–15 19% 11,452 59,412
Next, correlation coefficients were investigated to assess the magnitude of the relationship between teacher observation scores and value-added measures. Table 4 reports the findings across the three years of data, including up to 13,316 teachers. There were small, positive, and statistically significant correlation coefficients between the average teacher observation score and value-added measures of teacher effectiveness. Coefficients tended to be slightly larger in math than in ELA. These results compare to Basileo and colleagues’ (2015) study that found small to moderate correlation coefficients in a five-school pilot where observers and teachers received training and side-by-side coaching on the MTEM (.168 in ELA, .444 in math, and .239 in the combined value-added measure). The findings are also in line with those studies outlined in Table 1.
Table 4. Correlations between the MTEM Observation Scores and Value-Added Measures
ELA
Value-Added
Math Value-Added
Combined Value-Added
2012–13 Observation
Score .145** .185** .173**
N 10,727 7,192 13,316
2013–14 Observation
Score .150** .208** .186**
N 10,245 6,750 12,379
2014–15
Observation Score
.173** .226** .199**
N 9,888 6,624 12,248
** indicates p< .05
While the Pearson correlation coefficients are
shown in Table 4, the correlations in Table 5 are corrected for attenuation due to the unreliability in the predictor and outcome measures (Hunter & Schmidt, 1990; Hunter & Schmidt, 1994; Marzano, Walters, & McNulty, 2005; Spearman, 1904). To correct for attenuation, one divides the observed correlation by the square root of the product of reliability coefficients. In this case, the reliability of the MTEM observation score is .617 and it was calculated using the percent of agreement after independent coding (Marzano Research Laboratory, 2011; Marzano, Toth, & Schooling, 2012). The reliability of the Florida Standards Assessment (FSA) in 2014-15 was .9 (Florida Standards Assessments, 2015). The square root of the product of the two reliabilities equates to .745. Dividing the Pearson coefficients by square root of the product provides the correlation coefficient, which controls for error between the predictor and outcome variables. After correcting for error, correlation coefficients increased but were still small in magnitude.
Table 5. Correlation Coefficients Corrected for Attenuation
ELA Value-
Added Math Value-
Added Combined
Value-Added
2012–13 .195 .248 .232 2013–14 .201 .279 .250 2014–15 .232 .303 .267
Further investigation is warranted to assess whether
observation scores predict the teacher value-added measures controlling for confounding variables, such as teacher characteristics, observation system level characteristics, and school level poverty rates. These
9
Basileo and Toth: A State Level Analysis of the Marzano Teacher Evaluation Model: P
Published by ScholarWorks@UMass Amherst, 2019
Practical Assessment, Research & Evaluation, Vol 24 No 6 Page 10 Basileo & Toth, Predicting Teacher Value-Added with Observation Scores
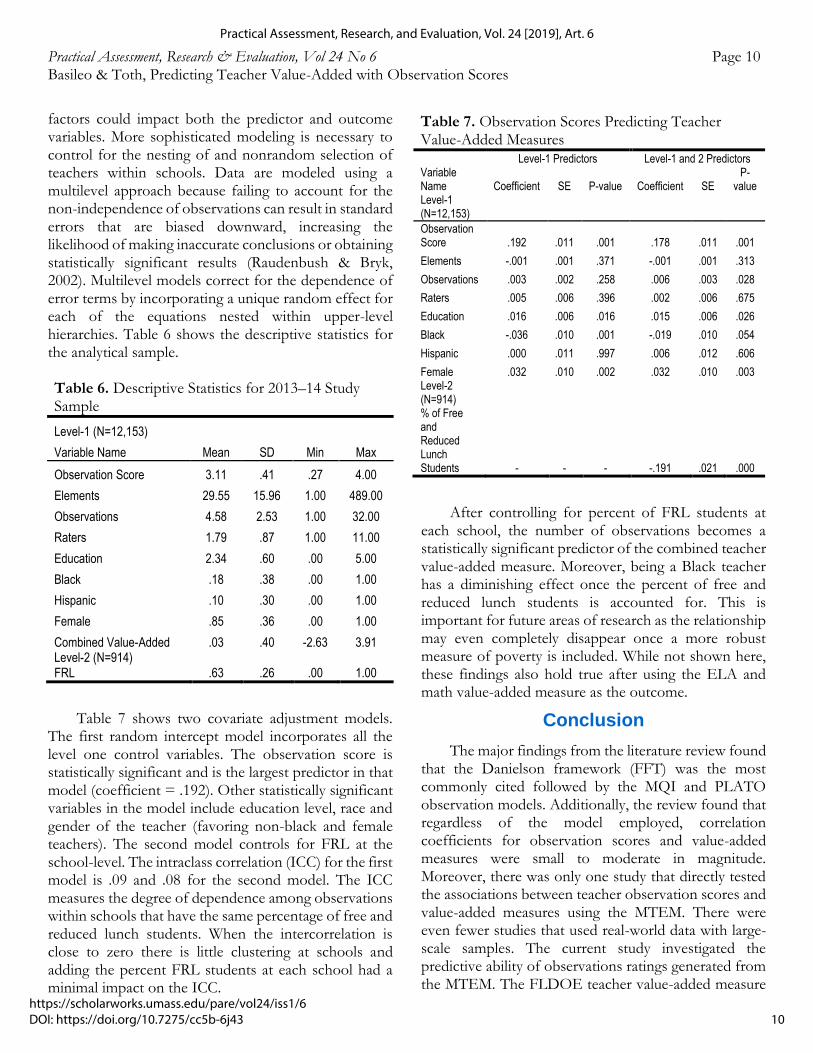
factors could impact both the predictor and outcome variables. More sophisticated modeling is necessary to control for the nesting of and nonrandom selection of teachers within schools. Data are modeled using a multilevel approach because failing to account for the non-independence of observations can result in standard errors that are biased downward, increasing the likelihood of making inaccurate conclusions or obtaining statistically significant results (Raudenbush & Bryk, 2002). Multilevel models correct for the dependence of error terms by incorporating a unique random effect for each of the equations nested within upper-level hierarchies. Table 6 shows the descriptive statistics for the analytical sample.
Table 6. Descriptive Statistics for 2013–14 Study Sample
Level-1 (N=12,153)
Variable Name Mean SD Min Max
Observation Score 3.11 .41 .27 4.00
Elements 29.55 15.96 1.00 489.00
Observations 4.58 2.53 1.00 32.00
Raters 1.79 .87 1.00 11.00
Education 2.34 .60 .00 5.00
Black .18 .38 .00 1.00
Hispanic .10 .30 .00 1.00
Female .85 .36 .00 1.00
Combined Value-Added .03 .40 -2.63 3.91 Level-2 (N=914) FRL .63 .26 .00 1.00
Table 7 shows two covariate adjustment models. The first random intercept model incorporates all the level one control variables. The observation score is statistically significant and is the largest predictor in that model (coefficient = .192). Other statistically significant variables in the model include education level, race and gender of the teacher (favoring non-black and female teachers). The second model controls for FRL at the school-level. The intraclass correlation (ICC) for the first model is .09 and .08 for the second model. The ICC measures the degree of dependence among observations within schools that have the same percentage of free and reduced lunch students. When the intercorrelation is close to zero there is little clustering at schools and adding the percent FRL students at each school had a minimal impact on the ICC.
After controlling for percent of FRL students at each school, the number of observations becomes a statistically significant predictor of the combined teacher value-added measure. Moreover, being a Black teacher has a diminishing effect once the percent of free and reduced lunch students is accounted for. This is important for future areas of research as the relationship may even completely disappear once a more robust measure of poverty is included. While not shown here, these findings also hold true after using the ELA and math value-added measure as the outcome.
Conclusion
The major findings from the literature review found that the Danielson framework (FFT) was the most commonly cited followed by the MQI and PLATO observation models. Additionally, the review found that regardless of the model employed, correlation coefficients for observation scores and value-added measures were small to moderate in magnitude. Moreover, there was only one study that directly tested the associations between teacher observation scores and value-added measures using the MTEM. There were even fewer studies that used real-world data with large-scale samples. The current study investigated the predictive ability of observations ratings generated from the MTEM. The FLDOE teacher value-added measure
Table 7. Observation Scores Predicting Teacher Value-Added Measures
Level-1 Predictors Level-1 and 2 Predictors Variable Name Coefficient SE P-value Coefficient SE
P-value
Level-1 (N=12,153)
Observation Score .192 .011 .001 .178 .011 .001
Elements -.001 .001 .371 -.001 .001 .313
Observations .003 .002 .258 .006 .003 .028
Raters .005 .006 .396 .002 .006 .675
Education .016 .006 .016 .015 .006 .026
Black -.036 .010 .001 -.019 .010 .054
Hispanic .000 .011 .997 .006 .012 .606
Female .032 .010 .002 .032 .010 .003 Level-2 (N=914) % of Free and Reduced Lunch Students - - - -.191 .021 .000
10
Practical Assessment, Research, and Evaluation, Vol. 24 [2019], Art. 6
https://scholarworks.umass.edu/pare/vol24/iss1/6DOI: https://doi.org/10.7275/cc5b-6j43
Practical Assessment, Research & Evaluation, Vol 24 No 6 Page 11 Basileo & Toth, Predicting Teacher Value-Added with Observation Scores
was used as the outcome of interest and the average observation score of teachers was the main independent variable in the models.
The study found that the magnitude of the relationship between observation scores and value-added measures were small, positive, and statistically significant. Correcting for attenuation increased the magnitude of the correlations but they remained small in magnitude. The covariate adjustment model found that the observation score was the largest level one predictor of value-added measures accounting for student, teacher, observation system, and school characteristics.
While the sample used in this study is one of the largest available, there are several limitations to using such data. The results are generalizable only to those using the MTEM in Florida. A national study of the MTEM may yield more generalizable results. Additionally, although some of the variance in the practice of observing teachers was accounted for in this study, the characteristics used in the analysis were not exhaustive. There are still many unknown systematic confounders that could impact the results and may be stronger predictors of teacher value-added measures. Finally, other school-level confounders such as school rates of teacher turnover, teacher absenteeism, and student mobility rates were not accounted for and could impact the findings (Bailey, Bocala, Shakman, & Zweig, 2016).
Despite these limitations, the study helped to close the gap in the literature as to the predictability of the MTEM by analyzing the largest dataset collected in a real-world setting. Studies such as these are critical in understanding the predictability of instructional models implemented in the field. Studies that included extensive trainings sessions for raters and teachers tended to have larger correlations; however, they are less replicable on larger scales and the results may not be able to be reproduced. To meet national priorities set forth in ESSA, larger scale studies are essential. The current study validated the use of the MTEM, particularly in Florida, by upholding the magnitude of correlations found in other instructional frameworks and demonstrating that observation ratings were the largest predictor in multilevel models. As such, the MTEM used within an evaluation system can help meet the national priorities set forth in the ESSA legislation.
References
Alexander, S., (2016). The relationship between teacher evaluation model, value-added model, and school grades. (Doctoral dissertation). Retrieved from ProQuest Dissertations and Theses Global database. (UMI No. 10141740).
Alger, Vicki E. (2012). Teacher selection and evaluation in Nebraska. Retrieved from https://www.platteinstitute.org/Library/docLib/20120109_Teacher_Selection_and_Evaluation_in_Nebraska.pdf .
Allen, J., Gregory, A., Mikami, A., Lun, J., Hamre, B., & Pianta, P. (2013). Observations of effective teacher-student interactions in secondary school classrooms: Predicting student achievement with the classroom assessment scoring system—Secondary. School and Psychology Review, 42(1), 76-98.
Auguste, B., Kihn, P., & Miller, M. (2010). Closing the talent gap: Attracting and retaining top third graduates to careers in teaching. Retrieved from http://mckinseyonsociety.com/-closing-the-talent-gap/ .
Bailey, J., Bocala, C., Shakman, K., & Zweig, J. (2016). Teacher demographics and evaluation: A descriptive study in a large urban district (REL 2017–189). Washington, DC: U.S. Department of Education, Institute of Education Sciences, National Center for Education Evaluation and Regional Assistance, Regional Educational Laboratory Northeast & Islands. Retrieved from http://ies.ed.gov/ncee/edlabs .
Ballou, D., Sanders, W., & Wright, P. (2004). Controlling for student background in value-added assessment of teachers. Journal of Educational and Behavioral Statistics, 29(1), 37–65.
Ballou, D., Mokher, C. G., & Cavalluzzo, L. (2012). Using value-added assessment for personnel decisions: How omitted variables and model specification influence teachers’ outcomes. Paper presented at the annual meeting of the Association for Education Finance and Policy. Boston, MA. Retrieved from http://www.aefpweb.org/sites/-default/files/webform/AEFPUsing%20VAM%20for%20personnel%20decisions_02-29-12.pdf .
Basileo, L., Toth, M. & Kennedy, E. (2015). Pinellas County Public Schools 2013-14 multiple measures pilot results. Retrieved from Learning Sciences International website: http://info.learningsciences.com/rs/860-TAJ-757/images/PCPS%20White%20Paper%2013-14%2020150604.pdf .
11
Basileo and Toth: A State Level Analysis of the Marzano Teacher Evaluation Model: P
Published by ScholarWorks@UMass Amherst, 2019
Practical Assessment, Research & Evaluation, Vol 24 No 6 Page 12 Basileo & Toth, Predicting Teacher Value-Added with Observation Scores
Bill & Melinda Gates Foundation. (2012). Gathering feedback for teaching. Measures of effective teaching. Retrieved from Bill & Melinda Gates Foundation website: http://metproject.org/downloads/MET_Gathering_Feedback_Research_Paper.pdf .
Bloom, H.S., Hill, Black, A.R., & Lipsey, M.W. (2008). Performance Trajectories and Performance Gaps as Achievement Effect-Size Benchmarks for Educational Interventions. MDRC. Retrieved from https://www.mdrc.org/sites/default/-files/full_473.pdf .
Borman, G., & Kimball, S. (2004). Teacher quality and educational equality: Do teachers with higher standards based evaluation ratings close student achievement gaps? Elementary School Journal, 106(1), 3-21.
Chaplin, D., Gill, B., Thompkins, A., & Miller, H. (2014). Professional practice, student surveys, and value added: Multiple measures of teacher effectiveness in the Pittsburgh Public Schools. Mathematica Policy Research report. Retrieved from the IES website https://ies.ed.gov/ncee/edlabs/regions/midatlantic/pdf/REL_2014024.pdf .
Cohen, J. (1988). Statistical power analysis for the behavioral sciences (2nd ed.). Hillsdale, NJ: Lawrence Erlbaum.
Florida Value-Added Model Technical Report (2013). American Institutes for Research. Retrieved from http://myflteacher.com/wp-content/uploads/2014/05/Value-AddedModelTechnicalReport1213.pdf .
Florida Standards Assessments. (2015). Florida Standards Assessments 2014-15: Volume 4 evidence of reliability and validity. The Florida Department of Education. Retrieved from http://www.fsassessments.org/wp-content/uploads/2016/04/V4_FSA_TechRpt_508.pdf
Gallagher, H. (2004). Vaughn Elementary’s innovative teacher evaluation system: Are teacher evaluation scores related to growth in student achievement? Peabody Journal of Education, 79(4), 79-107.
Gargani, J., & Strong, M. (2014). Can we identify a successful teacher better, faster, and cheaper? Evidence for innovating teacher observation systems. Journal of Teacher Education, 65(5), 389-401.
Goe, L. (2008). Key issue: Using value-added models to identify and support highly effective teachers. Washington, DC: National Comprehensive Center for Teacher Quality. Retrieved from https://gtlcenter.org/sites/default/files/docs/strategies/-het/UsingValueAddedModels.pdf .
Goldhaber, D., & Hansen, M. (2010). Is it just a bad class? Assessing the stability of measured teacher performance (CEDR Working Paper 2010-3). University of Washington, Seattle, WA: Center for Education Data and Research, University of Washington. Retrieved April 3, 2015 from http://cedr.us/papers/working/CEDR%20WP%202010-3_Bad%20Class%20Stability%20%288-23-10%29.pdf .
Grossman, P., Cohen, J., Ronfeldt, M., & Brown, L. (2014). The test matters: The relationship between classroom observation scores and teacher value added on multiple types of assessment. Educational Researcher, 43(6), 293-303.
Haystead, M., & Marzano, R. (2009). Meta-analytic synthesis of studies conducted at Marzano Research Laboratory on instructional strategies. Retrieved from Marzano Research Laboratory website: https://www.marzanoresearch.com/meta-analytic-synthesis-of-studies .
Hill, H., Blazar, D., Humez, A., Litke, E., & Beisiegel, M. (2013). Examining high and low value-added mathematics instruction: Can expert observers tell the difference? CPRE Working Papers. Retrieved from http://repository.upenn.edu/cpre_workingpapers/11 .
Hill, H., Charalambos, Y., & Kraft, M. (2012). When rater reliability is not enough: Teacher observation systems and a case for the generalizability study. Educational Researcher, 41(2), 56-64.
Hill, H., Kapitula, L., & Umland, K. (2011). A validity argument approach to evaluating teacher value-added scores. American Educational Research Journal, 48(3), 794-831.
Holtzapple, E. (2003). Criterion-related validity evidence for a standards-based teacher evaluation system. Journal of Personnel Evaluation in Education, 17(3), 207-219.
Hunter, J., & Schmidt, F. (1990). Methods of meta-analysis: Correcting error and bias in research findings. Beverly Hills, CA: Sage.
Hunter, J. & Schmidt, F. (1994). Correcting for sources of artificial variable across studies. In H. Cooper & L. Hedge (Eds.). The handbook of research synthesis (pp. 323-336). New York: Russell Sage Foundation.
Johnson, M., Lipscomb, S., & Gill, B. (2014). Sensitivity of teacher value-added estimates to student and peer control variables. Journal of Research on Educational Effectiveness, 8(1), 60–83.
12
Practical Assessment, Research, and Evaluation, Vol. 24 [2019], Art. 6
https://scholarworks.umass.edu/pare/vol24/iss1/6DOI: https://doi.org/10.7275/cc5b-6j43
Practical Assessment, Research & Evaluation, Vol 24 No 6 Page 13 Basileo & Toth, Predicting Teacher Value-Added with Observation Scores
Kane, T., & Staiger, D. (2012). Gathering feedback for teaching: Combining high-quality observations with student surveys and achievement gains. Seattle, WA: Bill & Melinda Gates Foundation. Retrieved from http://www.metproject.org/downloads/-MET_Gathering_Feedback_Research_Paper.pdf .
Kane, T., Taylor, E., Tyler, J., & Wooten, A. (2010). Identifying effective classroom practices using student achievement data. The Journal of Human Resources, 46(3), 587–613.
Kimball, S., White, B., Milanowski, A., & Borman, G. (2004). Examining the relationship between teacher evaluation and student assessment results in Washoe County. Peabody Journal of Education, 79(4):54-78.
Lipscomb, S., Terziev, J., & Chaplin, D. (2015). Measuring teachers’ effectiveness: A report from phase 3 of Pennsylvania’s pilot of the framework for teaching. Cambridge, MA: Mathematica Policy Research. Retrieved from https://www.mathematica-mpr.com/our-publications-and-findings/publications/measuring-teachers-effectiveness-a-report-from-phase-3-of-pennsylvanias-pilot-of-the-framework .
Lynch, K., Chin, M., & Blazar, D. (2015). Relationship between observations of elementary teacher mathematics instruction and student achievement: Exploring variability across districts. Cambridge, MA: National Center for Teacher Effectiveness, Harvard University. Retrieved from https://pdfs.semanticscholar.org/33b0/-3aa062e22c066670b01a0403d5b7ac25f27a.pdf .
Marzano, R. (2003). Forward. In C. A. Ewy, Teaching with visual frameworks. Thousand Oaks, CA: Corwin Press.
Marzano, R. (2006). Classroom assessment & grading that work. Alexandria, VA: Association for Supervision and Curriculum Development.
Marzano, R. (2007). The Art and Science of Teaching: A Comprehensive Framework for Effective Instruction. Alexandria, VA: Association for Supervision and Curriculum Development.
Marzano, R. with J. Marzano, & Pickering, D. (2003). Classroom management that works: Research-based strategies for every teacher. Alexandria, VA: Association for Supervision and Curriculum Development.
Marzano, R., Pickering, D., & Pollock, J. (2001). Classroom instruction that works: Research-based strategies for increasing student achievement. Alexandria, VA:
Association for Supervision and Curriculum Development.
Marzano, R., Toth, M., & Schooling, P. (2012). Examining the role of teacher evaluation in student achievement. Retrieved from http://ok.gov/sde/sites/ok.gov.sde/files/TLE-MarzanoWhitePaper.pdf .
Marzano Research Laboratory. (2011). What works in Oklahoma schools: A comprehensive needs assessment of Oklahoma schools: Phase 2 report. Retrieved from http://sde.ok.gov/sde/sites/ok.gov.sde/files/SI-PhaseIIStateReport.pdf .
Marzano, R., Waters, T., & McNulty, B., (2005). School leadership that works: From research to results. Alexandria, VA: Association for Supervision and Curriculum Development.
McCaffrey, F., Koretz, D., Lockwood, J, & Hamilton, S. (2004). The promise and peril of using value-added modeling to measure teacher effectiveness (Research Brief No. RB-9050-EDU). Santa Monica, CA: RAND Corporation. Retrieved from http://www.rand.org/pubs/research_briefs/RB9050.html .
Medley, D., & Coker, H. (1987). The accuracy of principals’ judgments of teacher performance. The Journal of Educational Research, 80, 242 247.
Milanowski, A. (2004). The relationship between teacher performance evaluation scores and student achievement: Evidence from Cincinnati. Peabody Journal of Education, 79(4), 33-53.
Milanowski, A. (2011). Validity research on teacher evaluation systems based on the framework for teaching. Paper for the American Education Research Association annual meeting on April 10, 2011 in New Orleans, LA.
Milanowski, A., Kimball, S., & White, B. (2004). The relationship between standards-based teacher evaluation scores and student achievement: Replication and extensions at three sites. CPRE-UW Working Paper Series.
Newton, A., Darling-Hammond, L., Haertel, E., & Thomas, E. (2010). Value-added modeling of teacher effectiveness: An exploration of stability across models and contexts. Retrieved from http://epaa.asu.edu/ojs/article/view/810 .
Polikoff, M. (2014). Does the test matter? Evaluating teachers when tests differ in their sensitivity to instruction. In T. Kane, K. Kerr, & R. Pianta (Eds.),
13
Basileo and Toth: A State Level Analysis of the Marzano Teacher Evaluation Model: P
Published by ScholarWorks@UMass Amherst, 2019
Practical Assessment, Research & Evaluation, Vol 24 No 6 Page 14 Basileo & Toth, Predicting Teacher Value-Added with Observation Scores
Designing Teacher Evaluation Systems: New Guidance from the Measures of Effective Teaching Project (pp. 278-302). San Francisco, CA: Jossey-Bass.
Raudenbush, S. W., & Bryk, A. S. (2002). Hierarchical linear models: Applications and data analysis methods. Thousand Oaks, CA: Sage.
Renter, D. (2012). After the stimulus money ends: The status of state K-12 education funding and reforms. Retrieved from Center on Education Policy website: http://www.cep-dc.org/displayDocument.cfm?DocumentID=395 .
Schacter, J., and Thum, Y. M. (2004). Paying for high- and low-quality teaching. Economics of Education Review, 23, 411-430.
Spearman, C. (1904). The proof and measurement of association between two things. The American Journal of Psychology, 15(1), 72-101.
Staiger, D., and Kane, T. (2014). Making decisions with imprecise performance measures: The relationship between annual student achievement gains and a teachers’ career value added. In Designing Teacher Evaluation Systems: New Guidance from the Measures of Effective Teaching Project (pp. 144–169). San Francisco, CA: Jossey-Bass.
Stuit, D., Berends, M., Austin, M., & Gerdeman, D. (2014). Comparing estimates of teacher value-added based on criterion- and norm-referenced tests. Washington, DC:
U.S. Department of Education, Institute of Education Sciences, National Center for Education Evaluation and Regional Assistance, Regional Educational Laboratory Midwest. Retrieved from http://ies.ed.gov/ncee/edlabs/projects/project.asp?ProjectID=392 .
Walkington, C., & Marder, M. (2013). Classroom observation and value-added models give complementary information about quality of mathematics teaching. In T. Kane, K. Kerr, & R. Pianta (Eds.), Designing teacher evaluation systems: New guidance from the Measuring Effective Teaching project (pp. 234–277). New York: Wiley.
Walsh, E., & Lipscomb, S. (2013). Classroom observations from phase 2 of the Pennsylvania teacher evaluation pilot: Assessing internal consistency, score variation, and relationships with value added. Cambridge, MA: Mathematica Policy Research. Retrieved from: https://www.researchgate.net/publication/299484160_Classroom_Observations_from_Phase_2_of_the_Pennsylvania_Teacher_Evaluation_Pilot_Assessing_Internal_Consistency_Score_Variation_and_Relationships_with_Value_Added_Final_Report .
White, B. (2004). The relationship between teacher evaluation scores and student achievement: evidence from Coventry, RI. CPRE-UW Working Paper Series.
Wilkerson, D., Manatt, R., Rogers, M., & Maughan, R. (2000). Validation of student, principal, and self-ratings in 360 feedback for teacher evaluation. Journal of Personnel Evaluation in Education, 14(2), 179-192.
Citation:
Basileo, Lindsey Devers & Toth, Michael (2019). A State Level Analysis of the Marzano Teacher Evaluation Model: Predicting Teacher Value-Added Measures with Observation Scores. Practical Assessment, Research & Evaluation, 24(6). Available online: https://pareonline.net/getvn.asp?v=24&n=6
Corresponding Author
Lindsey Devers Basileo Learning Sciences International 1400 Centrepark Boulevard Suite 1000 West Palm Beach, FL 33401 email: lbasileo [at] learningsciences.com
14
Practical Assessment, Research, and Evaluation, Vol. 24 [2019], Art. 6
https://scholarworks.umass.edu/pare/vol24/iss1/6DOI: https://doi.org/10.7275/cc5b-6j43