Embed Size (px)
Citation preview

A stroma-related gene signature predicts resistance toneoadjuvant chemotherapy in breast cancerPierre Farmer1,2,18, Herve Bonnefoi3–6, Pascale Anderle1,7, David Cameron8,18, Pratyakasha Wirapati2,Veronique Becette9,18, Sylvie Andre1, Martine Piccart10, Mario Campone11, Etienne Brain9,Gaetan MacGrogan3, Thierry Petit12, Jacek Jassem13, Frederic Bibeau14, Emmanuel Blot15, Jan Bogaerts6,Michel Aguet1, Jonas Bergh16, Richard Iggo1,3,17 & Mauro Delorenzi1,2
To better understand the relationship between tumor-host interactions and the efficacy of chemotherapy, we have developed
an analytical approach to quantify several biological processes observed in gene expression data sets. We tested the approach
on tumor biopsies from individuals with estrogen receptor–negative breast cancer treated with chemotherapy. We report that
increased stromal gene expression predicts resistance to preoperative chemotherapy with 5-fluorouracil, epirubicin and
cyclophosphamide (FEC) in subjects in the EORTC 10994/BIG 00-01 trial. The predictive value of the stromal signature
was successfully validated in two independent cohorts of subjects who received chemotherapy but not in an untreated control
group, indicating that the signature is predictive rather than prognostic. The genes in the signature are expressed in reactive
stroma, according to reanalysis of data from microdissected breast tumor samples. These findings identify a previously
undescribed resistance mechanism to FEC treatment and suggest that antistromal agents may offer new ways to overcome
resistance to chemotherapy.
Preoperative chemotherapy leads to the disappearance of the primarytumor (pathological complete response; pCR) in less than 10% ofestrogen receptor–positive breast tumors and in 20–30% of estrogenreceptor–negative tumors1–3. Several clinical studies have derived genesignatures that predict response to neoadjuvant therapy of breastcancer4–8, but none of those signatures has yet been validated in anexternal data set. Recently, predictive signatures based on the in vitroresponse of cell lines to chemotherapy were proposed9,10. However,the use of cell lines has the potential disadvantage of ignoring theinfluence of the tumor microenvironment on drug response.
This study was designed to search for a gene signature predictingthe response of breast tumors to FEC, a widely used anthracycline-containing chemotherapy regimen. To avoid confounding response-specific genes with tumor type-specific genes, the study was restricted
to estrogen receptor–negative tumors. To isolate robust signatures, wedeveloped a new bioinformatics method that decomposes the geneexpression signal originating from a mixture of tumor cells andstromal cells into multiple independent signatures associated withdistinct biological processes.
We report for the first time in the context of a randomized clinicaltrial a major contribution of stromal genes to drug sensitivity.
RESULTS
Chemotherapy response prediction from biological processes
Pretreatment biopsies of 63 estrogen receptor–negative tumors wereincluded in this substudy of the EORTC 10994 neoadjuvant trial(clinical and pathological data are given in Supplementary Tables 1and 2 online). We were unable to predict the response of these tumors
Received 13 August 2008; accepted 25 November 2008; published online 4 January 2009; doi:10.1038/nm.1908
1Swiss National Centre of Competence in Research Molecular Oncology, Swiss Institute for Experimental Cancer Research, Ecole Polytechnique Federale de Lausanne,School of Life Sciences, 155, Chemin des Boveresses, 1066 Epalinges s/Lausanne, Switzerland. 2Swiss Institute of Bioinformatics, Genopode Building, QuartierSorge, CH-1015 Lausanne, Switzerland. 3Institut Bergonie and Bordeaux 2 University, Institute National de la Sante et de la Recherche Medicale unit U916, 229Cours de l’Argonne, 33076 Bordeaux Cedex, France. 4Hopitaux Universitaires de Geneve, 24 rue Micheli-du-Crest CH-1211 Geneva, Switzerland. 5Swiss Group forClinical Cancer Research, Effingerstrasse 40 CH-3008 Bern, Switzerland. 6European Organisation for Research and Treatment of Cancer (EORTC), Avenue E. Mounier,83, 1200 Brussels, Belgium. 7Laboratory of Experimental Oncology, Oncology Institute of Southern Switzerland, Via Vincenza Vela 6, 6500 Bellinzona, Switzerland.8for the Anglo-Celtic Cooperative Oncology Group, University Department of Oncology, Western General Hospital, Crewe Road South, Edinburgh EH4 2XU, Scotland.9Centre Rene Huguenin, 35, rue Dailly, 92210 Saint-Cloud, France. 10Institut Jules Bordet, Boulevard de Waterloo 125, B-1000 Brussels, Belgium. 11Institut duCancer Nantes Atlantique, Centre de Lutte Contre le Cancer Rene Gauducheau, Centre de Cancerologie, Institute National de la Sante et de la Recherche Medicale 892,Boulevard Jacques Monod, 44 805 Nantes Cedex, Saint Herbalin, France. 12Centre Paul Strauss, 3, rue de la Porte de l’Hopital 67065 Strasbourg Cedex, France.13Medical University, 7, Debinki Street, 80-211 Gdansk, Poland. 14Centre Val d’Aurelle - Paul Lamarque, 208 rue des Apothicaires, 34298 Montpellier Cedex 5,France. 15Centre Henri Becquerel, rue d’Amiens, 76038 Rouen Cedex, France. 16Swedish Breast Cancer Group, Karolinska Institutet and Karolinska UniversityHospital, Radiumhemmet, 171 76 Stockholm, Sweden. 17Bute Medical School, Westburn Lane, University of St. Andrews, Fife KY16 9TS, Scotland. 18Presentaddresses: Merck Serono International S.A. Switzerland, 9, chemin des Mines, 1202 Geneva, Switzerland (P.F.), UK National Cancer Research Network CoordinatingCentre, 24 Hyde Terrace, Leeds LS2 9LN, UK (D.C.), Centre Francois Baclesse, 3 avenue du General Harris, BP 5026, 14076 CAEN Cedex 5, France (V.B.).Correspondence should be addressed to M.D. ([email protected]).
68 VOLUME 15 [ NUMBER 1 [ JANUARY 2009 NATURE MEDICINE
ART ICL ES©
2009
Nat
ure
Am
eric
a, In
c. A
ll ri
gh
ts r
eser
ved
.
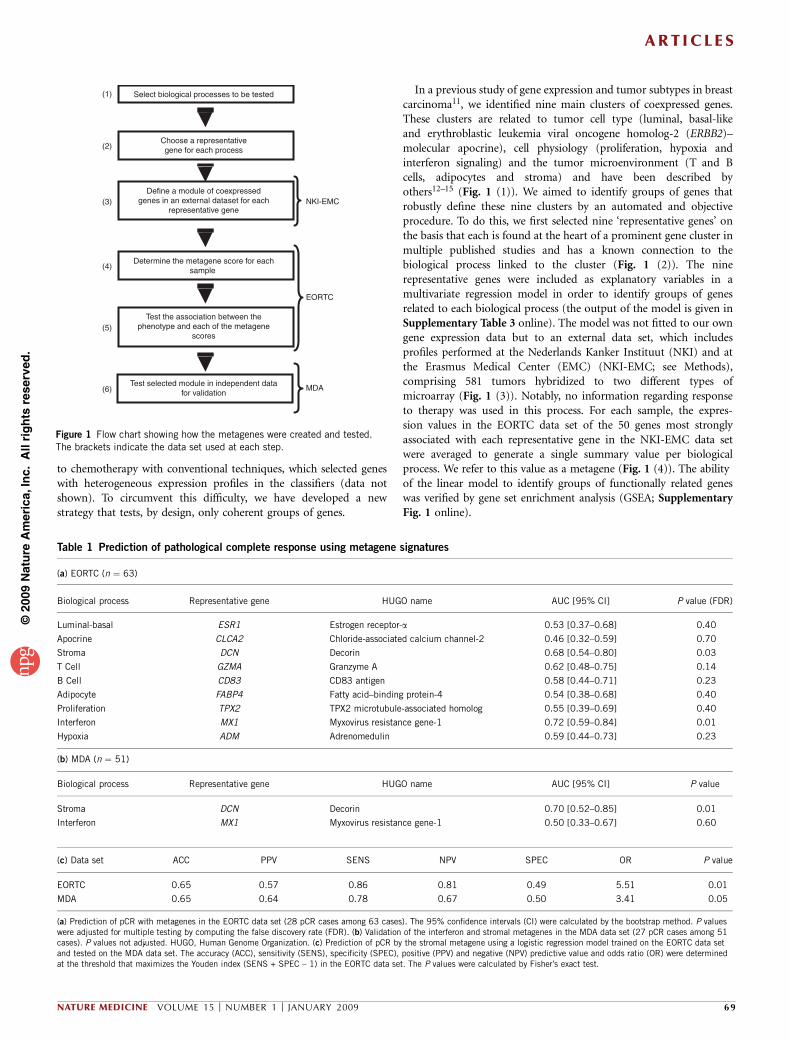
to chemotherapy with conventional techniques, which selected geneswith heterogeneous expression profiles in the classifiers (data notshown). To circumvent this difficulty, we have developed a newstrategy that tests, by design, only coherent groups of genes.
In a previous study of gene expression and tumor subtypes in breastcarcinoma11, we identified nine main clusters of coexpressed genes.These clusters are related to tumor cell type (luminal, basal-likeand erythroblastic leukemia viral oncogene homolog-2 (ERBB2)–molecular apocrine), cell physiology (proliferation, hypoxia andinterferon signaling) and the tumor microenvironment (T and Bcells, adipocytes and stroma) and have been described byothers12–15 (Fig. 1 (1)). We aimed to identify groups of genes thatrobustly define these nine clusters by an automated and objectiveprocedure. To do this, we first selected nine ‘representative genes’ onthe basis that each is found at the heart of a prominent gene cluster inmultiple published studies and has a known connection to thebiological process linked to the cluster (Fig. 1 (2)). The ninerepresentative genes were included as explanatory variables in amultivariate regression model in order to identify groups of genesrelated to each biological process (the output of the model is given inSupplementary Table 3 online). The model was not fitted to our owngene expression data but to an external data set, which includesprofiles performed at the Nederlands Kanker Instituut (NKI) and atthe Erasmus Medical Center (EMC) (NKI-EMC; see Methods),comprising 581 tumors hybridized to two different types ofmicroarray (Fig. 1 (3)). Notably, no information regarding responseto therapy was used in this process. For each sample, the expres-sion values in the EORTC data set of the 50 genes most stronglyassociated with each representative gene in the NKI-EMC data setwere averaged to generate a single summary value per biologicalprocess. We refer to this value as a metagene (Fig. 1 (4)). The abilityof the linear model to identify groups of functionally related geneswas verified by gene set enrichment analysis (GSEA; SupplementaryFig. 1 online).
Select biological processes to be tested
Choose a representativegene for each process
Define a module of coexpressedgenes in an external dataset for each
representative gene
Determine the metagene score for eachsample
Test the association between thephenotype and each of the metagene
scores
Test selected module in independent datafor validation
NKI-EMC
EORTC
MDA
(1)
(2)
(3)
(4)
(5)
(6)
Figure 1 Flow chart showing how the metagenes were created and tested.
The brackets indicate the data set used at each step.
Table 1 Prediction of pathological complete response using metagene signatures
(a) EORTC (n ¼ 63)
Biological process Representative gene HUGO name AUC [95% CI] P value (FDR)
Luminal-basal ESR1 Estrogen receptor-a 0.53 [0.37–0.68] 0.40
Apocrine CLCA2 Chloride-associated calcium channel-2 0.46 [0.32–0.59] 0.70
Stroma DCN Decorin 0.68 [0.54–0.80] 0.03
T Cell GZMA Granzyme A 0.62 [0.48–0.75] 0.14
B Cell CD83 CD83 antigen 0.58 [0.44–0.71] 0.23
Adipocyte FABP4 Fatty acid–binding protein-4 0.54 [0.38–0.68] 0.40
Proliferation TPX2 TPX2 microtubule-associated homolog 0.55 [0.39–0.69] 0.40
Interferon MX1 Myxovirus resistance gene-1 0.72 [0.59–0.84] 0.01
Hypoxia ADM Adrenomedulin 0.59 [0.44–0.73] 0.23
(b) MDA (n ¼ 51)
Biological process Representative gene HUGO name AUC [95% CI] P value
Stroma DCN Decorin 0.70 [0.52–0.85] 0.01
Interferon MX1 Myxovirus resistance gene-1 0.50 [0.33–0.67] 0.60
(c) Data set ACC PPV SENS NPV SPEC OR P value
EORTC 0.65 0.57 0.86 0.81 0.49 5.51 0.01
MDA 0.65 0.64 0.78 0.67 0.50 3.41 0.05
(a) Prediction of pCR with metagenes in the EORTC data set (28 pCR cases among 63 cases). The 95% confidence intervals (CI) were calculated by the bootstrap method. P valueswere adjusted for multiple testing by computing the false discovery rate (FDR). (b) Validation of the interferon and stromal metagenes in the MDA data set (27 pCR cases among 51cases). P values not adjusted. HUGO, Human Genome Organization. (c) Prediction of pCR by the stromal metagene using a logistic regression model trained on the EORTC data setand tested on the MDA data set. The accuracy (ACC), sensitivity (SENS), specificity (SPEC), positive (PPV) and negative (NPV) predictive value and odds ratio (OR) were determinedat the threshold that maximizes the Youden index (SENS + SPEC – 1) in the EORTC data set. The P values were calculated by Fisher’s exact test.
ART ICL ES
NATURE MEDICINE VOLUME 15 [ NUMBER 1 [ JANUARY 2009 69
©20
09 N
atu
re A
mer
ica,
Inc.
All
rig
hts
res
erve
d.

A stromal metagene is associated with chemoresistance
The ability of the nine metagenes to predict pathological completeresponse was tested by measuring the area under receiver operatingcharacteristic curves (AUC; Table 1 and Fig. 1 (5)). A signi-ficant AUC for prediction of response to FEC was observedonly for the interferon and stromal metagenes (Table 1a and Supple-mentary Fig. 2a online). The predictor showed high sensitivity butnot specificity for detection of responders at a selected threshold(Table 1c). Varying the threshold resulted in other combinations ofsensitivity, specificity and the other classification performance metrics(Supplementary Fig. 2b). The interferon and stromal metagenes werethen tested in an independent cohort of estrogen receptor–negativetumors from the M. D. Anderson Medical Center (MDA data set)included in a recent study of response toneoadjuvant chemotherapy with paclitaxel,5-fluorouracil, doxorubicin and cyclopho-sphamide (T-FAC)6 (Fig. 1 (6)). The stromalmetagene was again significantly associatedwith response (AUC ¼ 0.70; P ¼ 0.01),whereas the interferon metagene was not(Table 1b,c and Supplementary Fig. 2c,d).The constituent genes in the stromal meta-gene have a coherent expression pattern inboth the EORTC and the MDA studies; highstromal gene expression is associated withresistance to chemotherapy (Fig. 2).
The ability of the stromal metagene, histo-logical grade, node status, tumor size andERBB2 status to predict pCR was tested bylogistic regression. The stromal metagene wasthe only significant variable in univariateanalysis in both data sets (Table 2). Multi-variate analysis confirmed that the stromalmetagene was an independent predictivefactor in both data sets (Table 2). TheERBB2–molecular apocrine tumor class wastoo small to test, but the stromal metagenewas significantly associated with response inthe basal-like class in both the EORTC (AUC¼ 0.69 [0.51–0.84]; P ¼ 0.02; n ¼ 39) andMDA data sets (AUC ¼ 0.73 [0.54–0.92];P ¼ 0.01; n ¼ 27).
The selection of decorin (DCN) as therepresentative gene to derive the stromalmetagene was arbitrary. Two approacheswere used to test whether this choice mighthave led to overfitting of the data. Thestromal metagene is based on 50 genes,but the regression ranked all of the genesand identified many hundreds that aresignificantly associated with DCN expression(P o 0.05). Rather than using 50 genes,we constructed a series of metagenes fromnonoverlapping groups of 15 genes asso-ciated with decorin expression. Nine ofthe first 12 metagenes, involving a total of180 genes, gave an AUC significantly greaterthan 0.5 (Supplementary Fig. 3 online).To test whether the use of DCN itself asthe representative gene may have led tounintended bias, we repeated the regression
procedure with other stroma-related genes. We iteratively replacedDCN in the regression model with the 49 other genes in theoriginal stromal metagene and constructed new metagenes foreach new representative gene (Supplementary Table 4 online).The results with all of the metagenes were similar, in terms ofboth the genes identified and the AUC for prediction of responsein the EORTC and MDA data sets (Supplementary Table 4). Thiswas not surprising to us, because the mean pairwise correlationof genes in the original stromal metagene in the EORTC dataset was high (0.55). We conclude that neither the choice of DCNas the stromal representative gene nor the inclusion of exactly50 genes in the metagene led to overestimation of the predic-tive performance.
THBS2MGC3047
DACT1MMP14
OLFML2BDPYSL3
COL10A1LRP1C1RNDN
TGFB3COL6A1
RARRES2COL6A3
GAS1PDGFRB
AEBP1MMP11
ADAM12FBLN1ECM2
POSTNPCOLCE
SNAI2C1QTNF3
LRRC17COL1A2
PLAUANGPTL2
MFAP2COPZ2CALD1ITGBL1SFRP4SPON1MMP2LOXL1
COL5A2SPARC
ASPNHTRA1
CTSKPDGFRL
FBN1PEDF
FAPCOL3A1
CDH11CSPG2
DCN
8.5
0 10 20 30 40 50 60 0 10 20 30 40 50
9.0
9.5
10.0
11.0
Subject rank
Str
oma
met
agen
e
THBS2MGC3047
DACT1MMP14
OLFML2BDPYSL3
COL10A1LRP1C1RNDN
TGFB3COL6A1
RARRES2COL6A3
GAS1PDGFRB
AEBP1MMP11
ADAM12FBLN1ECM2
POSTNPCOLCE
SNAI2C1QTNF3
LRRC17COL1A2
PLAUANGPTL2
MFAP2COPZ2CALD1ITGBL1SFRP4SPON1MMP2LOXL1
COL5A2SPARC
ASPNHTRA1
CTSKPDGFRL
FBN1PEDF
FAPCOL3A1
CDH11CSPG2
DCN
5.0
5.5
6.0
6.5
7.0
7.5
Subject rank
Str
oma
met
agen
e10.5
a b
c d
Figure 2 Stromal gene expression and metagene scores. (a,b) Heat map showing the individual genes
included in the stromal metagene for the EORTC data set (a) and the MDA data set (b) (see also
Supplementary Table 4). (c,d) Metagene scores for each subject in the EORTC data set (c) and the
MDA data set (d) (pCR, red; non-pCR, blue). The samples in a and b are ordered horizontally as they
are in c and d.
ART ICL ES
70 VOLUME 15 [ NUMBER 1 [ JANUARY 2009 NATURE MEDICINE
©20
09 N
atu
re A
mer
ica,
Inc.
All
rig
hts
res
erve
d.

The stromal metagene is predictive but not prognostic
To test whether the stromal metagene is detecting bad prognosistumors that are intrinsically more aggressive, regardless of therapy,we examined the impact of the stromal metagene on relapse-freesurvival in three cohorts of subjects, one treated with adjuvantchemotherapy16, the other two not. Subjects in the NKI and EMCstudies who did not receive either chemotherapy or hormonal therapywere used as the reference untreated population. A proliferationmetagene known to be associated with high tumor grade and poorsurvival14 was used as a positive control. Subjects were split into twoequally sized groups on the basis of the value of their metagenes. Asexpected, high proliferation identified subjects with poor prognosis inall three data sets (Fig. 3a–c). The stromal metagene was unrelated tosurvival in the untreated subjects (Fig. 3d,e). In subjects who receivedadjuvant chemotherapy16, higher expression of the stromal metagenewas associated with significantly shorter relapse-free survival times(Fig. 3f). This indicates that the stromalmetagene is predictive of treatment responserather than prognostic of survival and sup-ports the hypothesis that the main associa-tion is between high stromal content andresistance to chemotherapy.
The stromal signature is characteristic of reactive stroma
A key question about the stromal metagene is whether it measures anintrinsic property of the tumor or merely the amount of normal tissuein the biopsy. To determine which pathological property of the tumoris captured by the stromal metagene, we performed a blindedexamination of the EORTC biopsy sections. For each sample, theproportions of tumor and nontumor tissue compartments wereevaluated. As expected, most biopsies contained only tumor tissue(Supplementary Fig. 4a online). We use the term reactive stroma todescribe areas rich in cells having fibroblast-like morphologies withinthe tumor compartment. The fibroblasts themselves are commonlyreferred to as activated fibroblasts or cancer-associated fibroblasts.There were noteworthy differences between tumors in the amount ofreactive stroma (Fig. 4a,b). Comparison of the histological andmicroarray data showed a significant association of the stromalmetagene with the amount of reactive stroma (Fig. 4c, P ¼ 0.009,Wilcoxon test) but not with the proportion of nontumor tissue in thebiopsy (Supplementary Fig. 4b). This means we can confidentlyexclude a major contribution of normal mammary tissue, such aslobules, ducts, adipose tissue or normal mammary interstitial tissue,to the stromal metagene.
The histological appearance of the biopsies in this study, as of breasttumors in general, strongly suggested that the amount of reactivestroma is a regular feature of individual tumors, making it an intrinsicproperty of the tumors. The classic approach to identify genes intrinsicto tumors is to compare between-tumor to within-tumor geneexpression variance12,17. Genes intrinsic to tumors should have lowvariance within tumors but high variance between tumors. Thevariance ratios (intrinsic scores) for the individual genes in the stromalmetagene can be used to define intrinsic genes. Applying a previouslyused threshold17, we found 20 out of 46 testable genes of the stromalmetagene to be intrinsic (Fig. 4d). This is significantly more thanwould be expected by chance (namely, 4 genes; P ¼ 0.00005, Fisher’sexact test).
To test the stromal metagene as a whole, we calculated the mean ofthe intrinsic scores of all of the genes in the stromal metagene(Fig. 4e). To compute an expected distribution for this parameter,we broke the link between biopsies and tumors in the previous data17;specifically, the pairing of biopsies used to calculate the within tumorvariance was randomly permuted. Taking the 97.5% upper boundary
Table 2 Predictive factors for pCR
EORTC Univariateb Multivariateb
Variablea Coefficient P value Coefficient P value
Clinical node (N0 versus N1 and N2) –0.099 0.862 0.014 0.982
Clinical size (T1 and T2 versus T3) –0.076 0.895 –0.222 0.736
Grade (grade 1 and 2 versus 3) 1.030 0.080 0.923 0.141
ERBB2 (low versus high) –0.588 0.362 0.114 0.882
Stromal metagene score (low versus high) 1.658 0.022 1.673 0.036
MDA Univariateb Multivariateb
Variablea Coefficient P value Coefficient P value
Clinical node (N0 versus N1 and N2) 0.789 0.231 1.844 0.044
Clinical size (T1 and T2 versus T3) –0.357 0.54 –1.698 0.040
Grade (grade 1 and 2 versus 3) 1.191 0.181 1.009 0.333
ERBB2 (negative versus positive) 0.577 0.336 0.489 0.477
Stromal metagene score (low versus high) 1.217 0.043 1.605 0.039
aThe node and size determination followed the tumor, nodes and metastasis (TNM)staging system35. bUnivariate and multivariate logistic regression models were usedto test the predictive power of the stromal signature and conventional variables.
RF
SR
FS
Untreated Treated
a b
ed
1,000 3,000 5,000 1,000 3,000 5,000
1,000 3,000 5,000 1,000 3,000 5,000
0.0
0.2
0.4
0.6
0.8
1.0
0.0
0.2
0.4
0.6
0.8
1.0
0.0
0.2
0.4
0.6
0.8
1.0
0.0
0.2
0.4
0.6
0.8
1.0
f
1,000 2,000 3,000
0.0
0.2
0.4
0.6
0.8
1.0
Time (d)
c
0.0
0.2
0.4
0.6
0.8
1.0
1,000 2,000 3,000Time (d)Time (d)
P < 0.001 P < 0.001 P = 0.061
Time (d)Time (d)Time (d)
P = 0.55 P = 0.78 P = 0.022
Figure 3 Prognostic versus predictive value
of the proliferation and stromal metagenes.
(a–c) Relapse-free survival (RFS) in the
proliferation metagene for the NKI (left),
EMC (center) and Duke (right) data sets.
(d–f) Relapse-free survival in the stromal
metagene for the NKI (left), EMC (center) and
Duke (right) data sets. In panels a, b, d and e,
the subjects did not receive chemotherapy.In panels c and f, subjects received adjuvant
chemotherapy. Blue lines show subjects with
low metagene scores. Red lines show subjects
with high metagene scores. Significance was
calculated by log-rank test.
ART ICL ES
NATURE MEDICINE VOLUME 15 [ NUMBER 1 [ JANUARY 2009 71
©20
09 N
atu
re A
mer
ica,
Inc.
All
rig
hts
res
erve
d.

of the expected distribution as reference, we concluded that, by theconventional definition, the stromal metagene is intrinsic to the tumor(Fig. 4e).
To further confirm that the genes in the stromal metagene areexpressed by stromal cells in the tumor compartment, we analyzeddata generated by microdissection of breast tumors18. To determinewhether a gene was expressed preferentially by epithelial or stromalcells, we calculated an epithelial (E) to stromal (S) ratio for each gene.The stromal metagene (Fig. 4f) showed a low E / S ratio, consistentwith the constituent genes being expressed primarily in the stroma(P ¼ 0.001, Sign test). To confirm that this result is not confined to asingle study or even a single tumor type, we performed the sameanalysis with data from another breast microdissection study and froma colon cancer study comparing tumor epithelial cells with coloncancer–associated fibroblasts (Supplementary Fig. 5a–c online).
To explore the biology underlying the stromal metagene, wecompared it to several potentially relevant gene lists. Because theepithelial-to-mesenchymal transition (EMT) is a potential explanationfor stromal gene expression by tumor cells, we tested a gene listderived from undifferentiated epithelial cells cultivated as floatingmammospheres19,20. These structures contain normal mammaryepithelial cell progenitors that produce an abundant extracellularmatrix containing decorin19. Mammospheres and EMT signaturegenes have a pattern of expression similar to that of the stromalmetagene (Fig. 4f and Supplementary Fig. 6a,b online). Thus, EMToftumor epithelial cells could account for increased stromal metageneexpression in some tumors. As EMT was reported to generate cellswith properties of stem cells20, chemoresistance observed in this studycould be related to the widely held opinion that tumor stem cells andprogenitors are more resistant to chemotherapy21. We also analyzedtwo gene signatures that are reported to distinguish between different
types of fibroblastic tumor, solitary fibrous tumors and desmoid-typefibromatosis (DTF)22. Only the DTF signature showed a strongcorrelation with the stromal metagene (Fig. 4f,g and SupplementaryFig. 6c). Desmoid tumors arise in fibroblasts with germline mutationsin the APC gene that activates the Wnt signaling pathway. To furtherexplore a potential role for EMT and Wnt signaling in the biology ofthe stromal metagene, we ranked genes by similarity to DCN expres-sion and performed GSEA with a Wnt gene set, an EMT gene set and atransforming growth factor-b (TGF-b) gene set; the last was testedbecause of its known role in EMT. A GSEA peak skewed to the left (asin Fig. 4h) indicates that a high proportion of EMT signature geneshave an expression pattern similar to that of the genes in the stromalmetagene. GSEA supports a potential role for all three processes inreactive stroma (Fig. 4h and Supplementary Fig. 7a,b online). Weconclude that reactive stroma is intrinsic to tumors that are resistantto FEC, and this may arise from activation of TGF-b or Wnt signaling.
DISCUSSION
The two main contributions of this work are the development of anew technique for the analysis of gene expression data and theidentification of stromal gene expression as a marker for resistanceto chemotherapy. The cell state represented by a high stromalsignature was associated with resistance of estrogen receptor–negative breast tumors to neoadjuvant therapy with two differentanthracycline-based regimens, FEC (EORTC) and T-FAC (MDA6).
The fact that the stromal signature was unable to predict survival insubjects who did not receive chemotherapy (Fig. 3) indicates that itdoes not merely detect a difference in the innate risk of recurrence ofbreast cancers. Most prognostic signatures currently studied in breastcancer are dominated by proliferation genes23. Together with a largebody of historical data on classical markers, they highlight the
b c d
f g h
−0.3−0.2−0.1
0.00.10.20.3
Ranked genes
Rel
ativ
e sc
ore
a
Rare + ++ +++
8
9
10
11
12
Str
omal
met
agen
e
e
P < 0.0001
E I P S D M
log 2(
E /
S)
−2
−1
0
1
Freq
uenc
y
0100200300400500600
0 2 4 6 8Score
Mean score
Freq
uenc
y
−3 −1 1 2 3
0
20
40
60
80
Stromal metagene
DT
F
8 9 10 11
9
10
11 r = 0.91
Reactive stroma content
Gene signatures
Figure 4 Biological interpretation of the stromal metagene.
(a,b) Histological sections showing breast tumors containing
sparse (a) and abundant (b) reactive stroma. Black arrows,
reactive stroma; green arrows, malignant epithelium. Scale
bars, 0.2 mm. (c) Correlation of reactive stromal content
with metagene expression. Tumors were divided into four
groups by a pathologist on the basis of the amount of
reactive stroma. P o 0.05 for the + versus ++ and + versus
+++ comparisons. (d,e) Intrinsic gene analysis. The intrinsic score (x axis) is the log ratio of the between-tumor to within-tumor variance for paired biopsies;
red bar, cutoff previously used to define intrinsic genes17. Black bars in d, all genes; green bars, genes included in the stromal metagene. Blue bar in e,
mean of the intrinsic scores of all the stromal genes, used to assess the full stromal metagene; yellow bar, upper 97.5th percentile of the distribution of themean intrinsic scores (black bars) under random pairing of the biopsies. (f) Gene expression in microdissected breast tissue. Blue dots, genes belonging to
the indicated signature; E / S score, ratio of the expression values in microdissected epithelial and stromal tissue18. Genes below the horizontal gray line
are preferentially expressed in stroma. E (epithelium) and I (stroma), control gene lists taken from another microdissection study36; P (proliferation) and
S (stroma), metagenes described in this study; D (desmoid-type fibromatosis22) and M (mammosphere19), gene signatures related to Wnt signaling in
fibroblasts and EMT in mammary epithelial cells, respectively. Red horizontal bars, mean score for each signature. (g) Correlation of the stromal metagene
with a DTF gene expression signature22. Each dot is a single tumor (pCR, red; non-pCR, blue); r, Pearson correlation coefficient. (h) GSEA testing whether
the ranks (x axis) of EMT signature genes (green bars) are uniformly distributed when genes are sorted by decreasing t statistic for DCN in the linear
regression model.
ART ICL ES
72 VOLUME 15 [ NUMBER 1 [ JANUARY 2009 NATURE MEDICINE
©20
09 N
atu
re A
mer
ica,
Inc.
All
rig
hts
res
erve
d.
importance of proliferation in the innate risk of relapse or aggressive-ness of tumors23. Notably, despite including topoisomerase II a(TOP2A), the target of anthracyclines, the proliferation metagene wasnot associated with response. Taken together, these findings stronglysuggest that the stromal metagene is predictive rather than prognostic.
To identify the cellular origin of the stromal signature, we analyzedmicroarray data from microdissected breast tumors18. This showedthat the dominant source of stromal gene expression is the tumorstroma. Although this result might appear to settle the issue, it iscrucial to recognize that mammary epithelial cells can adopt a stromalgene expression pattern almost indistinguishable from that of reactivestroma if grown in conditions that promote EMT20. Our analysis ofEMT and mammosphere signatures fully supports this possibility.Nevertheless, genetic analysis of the tumor stroma rarely findsidentical changes in tumor epithelial cells and stromal fibroblasts,and few pathologists would seriously contemplate EMT as a generalexplanation for the existence of reactive stroma in tumors24.
Recently, another group25 described a new stroma-derived prog-nostic predictor (SDPP) based on genes expressed by microdissectedtumor-associated stroma. They showed that stromal samples naturallyfall into distinct groups associated with very different outcomes. Thepoor prognosis group has high expression of hypoxia and angiogenesisgenes and low expression of type I immune response genes. Despitebeing derived from microdissected stroma, the SDPP signature isprognostic even in whole-tumor samples comprising tumor epithe-lium and stroma. In that study, fibroblasts and other normal cell types,such as immune cells and endothelial cells, were analyzed in themicrodissected stroma. In contrast, when we refer to reactive stroma,we mean primarily the fibroblasts within the stroma. The keydifference between the two studies is that our signature assesses onlya single aspect of gene expression in the stroma, whereas thoseresearchers used a composite signature that takes into account multi-ple cell types and processes occurring in the stroma. Not surprisingly,the conclusions reached by the two studies are different: the SDPPcaptures information about the innate aggressiveness of the tumor,whereas the DCN signature captures information about the respon-siveness of the tumor to chemotherapy.
There are many precedents for tumor-stroma interactions tomodulate the response to chemotherapy. Integrin activation rendersmammary epithelial cells resistant to apoptosis induction by a widerange of different treatments26, hyaluronic acid promotes resistance ofbreast cancer cell lines to doxorubicin27 and adhesion of multiplemyeloma cells and monocytic leukemia cells to fibronectin confers asurvival advantage in the presence of doxorubicin28,29. In experimentalmodels, osteopontin secretion by tumor cells has recently been linkedto mobilization of bone marrow cells that contribute to the formationof reactive stroma in tumors30. Release of paracrine survival factors bystromal cells recruited by the tumor cells is one possible explanation ofour results: the reactive stromal signature could be a marker for a formof cross-talk between tumor epithelial and reactive stromal cells thatmakes the tumor cells resistant to FEC chemotherapy.
In conclusion, we have developed a 50-gene signature that predictspoor response to anthracycline-based neoadjuvant chemotherapy intwo independent data sets. This predictor reflects the activation stateof the tumor stroma. Future and larger studies will be required to testwhether this signature can be combined with other variables—forexample, from gene dosage or mutational analysis—to constructmultivariable classifiers that can predict response even better. Ourfindings provide new insights into the contribution of the tumormicroenvironment to breast cancer biology and may lead to thedevelopment of new therapies for breast cancer.
METHODSSubject selection and sample processing. This study was performed in the
context of a prospective trial of neoadjuvant chemotherapy (EORTC 10994/
BIG 00-01). Ethical approval for the clinical trial and associated translational
projects was obtained from the institutional review boards of Institut Bergonie,
Bordeaux; Hopitaux Universitaires de Geneve; Western General Hospital,
Edinburgh; Centre Rene Huguenin, Saint-Cloud; Institut Jules Bordet, Brussels;
Institut du Cancer Nantes Atlantique, Nantes; Centre Paul Strauss, Strasbourg;
Medical University Gdansk; Centre Val d’Aurelle, Montpellier; Centre Henri
Becquerel, Rouen; and Karolinska Institutet, Stockholm. Subjects gave signed
informed consent for both the clinical and the translational studies. Inclusion
criteria for this substudy are described in the Supplementary Methods online.
We gave the subjects six cycles of 500 mg m–2 5-fluorouracil, 100 mg m–2
epirubicin and 500 mg m–2 cyclophosphamide (FEC) or of a modified tailored
FEC (Swedish patients; see Supplementary Methods) followed by breast-
conserving surgery or mastectomy. We defined pCR as disappearance of the
invasive component of the primary tumor after treatment, with, at most,
scattered tumor cells detected by the pathologist in the resection specimen.
There were 28 pCR cases among 63 cases included in this study. Complete
details of the methods used for RNA extraction, hybridization and
data preprocessing and cross-platform mapping are described in the Supple-
mentary Methods.
Statistical analyses. The data sets and the statistical methods used are described
in detail in the Supplementary Materials. Briefly, the aim of the linear
regression model was to condense the information contained in a cluster of
functionally related genes into a single value that we refer to as a metagene. For
each of the nine functionally related gene clusters included in the model, a
representative gene was defined a priori. The representative genes are genes
regularly found grouped with other functionally related genes when performing
clustering. We used a multivariate linear regression model to identify the genes
showing similar expression to the representative genes. Linear models provide
the framework to allow easy adjustment for potential confounding effects and
integration of data coming from different technological platforms. In all cases,
we selected the genes belonging to a metagene with external data (NKI-EMC
data set) only; hence, no pCR outcome information was used for gene selection.
We fitted the linear model separately for each study, and we combined the
associated t statistics with the fixed-effect meta-analytical method31. We
estimated P values by random permutation according to the method of
Westfall32. Supplementary Table 3 lists the t statistics and the corresponding
P values for all genes and model coefficients. We fixed the number of genes used
per metagene at 50. The number of genes significantly associated
(P o 0.05) with the representative gene was always greater that 50 genes.
The approach used to test the impact of changing the number of genes in the
stromal metagene is described in the Supplementary Methods. The heat maps
used to visualize the expression of single genes in the metagenes are color-
coded representations of the mean centered gene expression matrix.
We assessed the ability of the metagenes to classify the samples by their pCR
status by analyzing the area under receiver operating characteristic curves. We
estimated the 95% confidence intervals for this AUC by bootstrapping samples
(1,000 iterations). We defined sensitivity as the proportion of pCR cases
detected. We adjusted P values for multiple testing by the false discovery rate
method33. We analyzed survival with the R programming environment34, using
the library ‘survival’; we assessed significance with log-rank tests. In the survival
analysis, the cases with chemotherapy were taken from a study at Duke
University16 (Duke data set).
We performed the intrinsic gene analysis as previously described17.
We performed GSEA and molecular subtype classification as previously
described11. The epithelial, stromal, DTF, solitary fibrous tumors, mammo-
sphere, EMT, TGF-b and Wnt signature genes used for the figures are
described in the Supplementary Methods and are listed in Supplementary
Table 5 online.
Accession codes. Gene Expression Omnibus: Minimum Information About a
Microarray Experiment–compliant data have been deposited with accession
code GSE4779. Microdissection data18, GSE5847.
ART ICL ES
NATURE MEDICINE VOLUME 15 [ NUMBER 1 [ JANUARY 2009 73
©20
09 N
atu
re A
mer
ica,
Inc.
All
rig
hts
res
erve
d.

Note: Supplementary information is available on the Nature Medicine website.
ACKNOWLEDGMENTSWe thank the subjects, doctors and nurses involved in the EORTC 10994/BIG01study for their generous participation. We thank the staff of the EORTC datacenter (M. de Vos, S. Lejeune, I. Delmotte and M. Karina) and the technician inthe Iggo laboratory (A.-L. Nicoulaz) for assistance with data management andsample processing. We thank I. Xenarios, V. Praz and T. Sengstag for supportwith bioinformatics. We thank H. Chebab (Pathology Institute, UniversityLausanne) for supplying human colon tumors. We thank M. Zahn for criticalreading of the manuscript. We thank the University of Lausanne DNA arrayfacility and the Swiss Institute for Bioinformatics Vital-IT project forinfrastructure support. We thank the Fondation Medic, Fondation Widmer,Oncosuisse, Swiss National Science Foundation and Swiss National Center forCompetence in Research (NCCR) Molecular Oncology, EORTC TranslationalResearch Fund, Swedish Cancer Society, King Gustav the Fifth Jubilee Fund andSwedish Research Council for financial support.
AUTHOR CONTRIBUTIONSJ.B., F.B., E. Blot, H.B., D.C., M.C., J.J., G.M., T.P., M.P. and E. Brain suppliedtumor tissues and collected the clinical follow-up data. V.B. did the centralpathology review. R.I. supervised the laboratory experiments. S.A. performedlaboratory experiments. P.F., P.W. and M.D. developed the statistical models. P.F.,M.D. and R.I. analyzed the data. J.B. performed additional statistical analyses. P.A.and M.A. performed and supervised additional laboratory experiments. H.B., R.I.,P.F. and M.D. designed the study. P.F., M.D., H.B., P.A., J.B., M.A., D.C. and R.I.wrote the report. All investigators contributed to and reviewed the final report.
Published online at http://www.nature.com/naturemedicine/
Reprints and permissions information is available online at http://npg.nature.com/
reprintsandpermissions/
1. Colleoni, M. et al. Chemotherapy is more effective in patients with breast cancer notexpressing steroid hormone receptors: a study of preoperative treatment. Clin. CancerRes. 10, 6622–6628 (2004).
2. Guarneri, V. et al. Prognostic value of pathologic complete response after primarychemotherapy in relation to hormone receptor status and other factors. J. Clin. Oncol.24, 1037–1044 (2006).
3. Fisher, E.R. et al. Pathobiology of preoperative chemotherapy: findings from theNational Surgical Adjuvant Breast and Bowel (NSABP) protocol B-18. Cancer 95,681–695 (2002).
4. Chang, J.C. et al. Gene expression profiling for the prediction of therapeutic response todocetaxel in patients with breast cancer. Lancet 362, 362–369 (2003).
5. Gianni, L. et al. Gene expression profiles in paraffin-embedded core biopsy tissuepredict response to chemotherapy in women with locally advanced breast cancer.J. Clin. Oncol. 23, 7265–7277 (2005).
6. Hess, K.R. et al. Pharmacogenomic predictor of sensitivity to preoperative chemo-therapy with paclitaxel and fluorouracil, doxorubicin and cyclophosphamide in breastcancer. J. Clin. Oncol. 24, 4236–4244 (2006).
7. Thuerigen, O. et al. Gene expression signature predicting pathologic complete responsewith gemcitabine, epirubicin and docetaxel in primary breast cancer. J. Clin. Oncol. 24,1839–1845 (2006).
8. Hannemann, J. et al. Changes in gene expression associated with response toneoadjuvant chemotherapy in breast cancer. J. Clin. Oncol. 23, 3331–3342(2005).
9. Potti, A. et al. Genomic signatures to guide the use of chemotherapeutics. Nat. Med.12, 1294–1300 (2006).
10. Bonnefoi, H. et al. Validation of gene signatures that predict the response of breastcancer to neoadjuvant chemotherapy: a substudy of the EORTC 10994/BIG 00–01clinical trial. Lancet Oncol. 8, 1071–1078 (2007).
11. Farmer, P. et al. Identification of molecular apocrine breast tumours by microarrayanalysis. Oncogene 24, 4660–4671 (2005).
12. Perou, C.M. et al. Molecular portraits of human breast tumours. Nature 406, 747–752(2000).
13. Sorlie, T. et al. Gene expression patterns of breast carcinomas distinguish tumorsubclasses with clinical implications. Proc. Natl. Acad. Sci. USA 98, 10869–10874(2001).
14. Sotiriou, C. et al. Gene expression profiling in breast cancer: understanding themolecular basis of histologic grade to improve prognosis. J. Natl. Cancer Inst. 98,262–272 (2006).
15. van de Vijver, M.J. et al. A gene-expression signature as a predictor of survival in breastcancer. N. Engl. J. Med. 347, 1999–2009 (2002).
16. Bild, A.H., Potti, A. & Nevins, J.R. Linking oncogenic pathways with therapeuticopportunities. Nat. Rev. Cancer 6, 735–741 (2006).
17. Hu, Z. et al. The molecular portraits of breast tumors are conserved across microarrayplatforms. BMC Genomics 7, 96 (2006).
18. Boersma, B.J. et al. A stromal gene signature associated with inflammatory breastcancer. Int. J. Cancer 122, 1324–1332 (2008).
19. Dontu, G. et al. In vitro propagation and transcriptional profiling of human mammarystem/progenitor cells. Genes Dev. 17, 1253–1270 (2003).
20. Mani, S.A. et al. The epithelial-mesenchymal transition generates cells with propertiesof stem cells. Cell 133, 704–715 (2008).
21. Li, X. et al. Intrinsic resistance of tumorigenic breast cancer cells to chemotherapy.J. Natl. Cancer Inst. 100, 672–679 (2008).
22. West, R.B. et al. Determination of stromal signatures in breast carcinoma. PLoS Biol.3, e187 (2005).
23. Wirapati, P. et al. Meta-analysis of gene-expression profiles in breast cancer: toward aunified understanding of breast cancer sub-typing and prognosis signatures. BreastCancer Res. 10, R65 (2008).
24. Qiu, W. et al. No evidence of clonal somatic genetic alterations in cancer-associatedfibroblasts from human breast and ovarian carcinomas. Nat. Genet. 40, 650–655(2008).
25. Finak, G. et al. Stromal gene expression predicts clinical outcome in breast cancer.Nat. Med. 14, 518–527 (2008).
26. Weaver, V.M. et al. b4 integrin–dependent formation of polarized three-dimensionalarchitecture confers resistance to apoptosis in normal and malignant mammaryepithelium. Cancer Cell 2, 205–216 (2002).
27. Misra, S., Ghatak, S. & Toole, B.P. Regulation of MDR1 expression and drug resistanceby a positive feedback loop involving hyaluronan, phosphoinositide 3-kinase, andErbB2. J. Biol. Chem. 280, 20310–20315 (2005).
28. Damiano, J.S., Cress, A.E., Hazlehurst, L.A., Shtil, A.A. & Dalton, W.S. Cell adhesionmediated drug resistance (CAM-DR): role of integrins and resistance to apoptosis inhuman myeloma cell lines. Blood 93, 1658–1667 (1999).
29. Hazlehurst, L.A. et al. Reduction in drug-induced DNA double-strand breaks asso-ciated with b1 integrin–mediated adhesion correlates with drug resistance in U937cells. Blood 98, 1897–1903 (2001).
30. McAllister, S.S. et al. Systemic endocrine instigation of indolent tumor growth requiresosteopontin. Cell 133, 994–1005 (2008).
31. Hedges, L. & Olkin, I. Statistical Methods for Meta-Analysis. 39 (Academic Press,London, 1985).
32. Westfall, P. & Young, S. Resampling-Based Multiple Testing: Examples And MethodsFor P-Values Adjustment. Ch.2 (Wiley, New York, 1993).
33. Benjamini, Y. & Hochberg, Y. Controlling the false discovery rate: a practical andpowerful approach to multiple testing. J. R. Stat. Soc. [Ser B] 57, 289–300 (1995).
34. R Development Core Team. R: A language and environment for statistical computing.(R Foundation for Statistical Computing, Vienna, 2005).
35. International Union Against Cancer (UICC). TNM Classification of Malignant Tumours5th edn. (eds. Sobin, L.H. & Wittekind, C.) (Wiley, New York, 1997).
36. Finak, G. et al. Gene expression signatures of morphologically normal breast tissueidentify basal-like tumors. Breast Cancer Res. 8, R58 (2006).
ART ICL ES
74 VOLUME 15 [ NUMBER 1 [ JANUARY 2009 NATURE MEDICINE
©20
09 N
atu
re A
mer
ica,
Inc.
All
rig
hts
res
erve
d.

220 volume 15 | number 2 | february 2009 nature medicine
Erratum: A stroma-related gene signature predicts resistance to neoadjuvant chemotherapy in breast cancerPierre Farmer, Hervé Bonnefoi, Pascale Anderle, David Cameron, Pratyaksha Wirapati, Véronique Becette, Sylvie André, Martine Piccart, Mario Campone, Etienne Brain, Gaëtan MacGrogan, Thierry Petit, Jacek Jassem, Frédéric Bibeau, Emmanuel Blot, Jan Bogaerts, Michel Aguet, Jonas Bergh, Richard Iggo & Mauro DelorenziNat. Med. 15, 68–74 (2009); published online 4 January 2009; corrected after print 5 February 2009
In the version of this article initially published, one of the authors’ names was misspelled. Pratyakasha Wirapati should have been Pratyaksha Wirapati. The error has been corrected in the HTML and PDF versions of the article.
Erratum: Loss of ETHE1, a mitochondrial dioxygenase, causes fatal sulfide toxicity in ethylmalonic encephalopathyValeria Tiranti, Carlo Viscomi, Tatjana Hildebrandt, Ivano Di Meo, Rossana Mineri, Cecilia Tiveron, Michael D Levitt, Alessandro Prelle, Gigliola Fagiolari, Marco Rimoldi & Massimo ZevianiNat. Med.; doi:10.1038/nm.1907; corrected online 20 January 2009
In the version of this article initially published online, ‘SDO’ should have been ‘SDH’ in Figure 4a,b. The error has been corrected for the print, PDF and HTML versions of this article.
Corrigendum: Rescuing a failing heart: putting on the squeezeDavid A KassNat. Med. 15, 24–25 (2009); corrected after print February 5 2009
In the version of this article initially published, the competing financial interests statement was missing. The error has been corrected in the HTML and PDF versions of the article.
e r r ata a n d co r r i g e n d u m ©
2009
Nat
ure
Am
eric
a, In
c. A
ll ri
gh
ts r
eser
ved
.